 Xiaocheng Wang
 Yumeng Wang1
 Haining Wang
- 1National Marine Environmental Monitoring Center, Dalian, China
- 2Dalian Ocean University, Dalian, China
The ocean, serving as the cradle of life on Earth and the regulator of global climate, constitutes an invaluable resource repository for human survival and development. The preservation of ocean health is pivotal for the sustainable progression of human society. This study chose Dalian in China to assess the marine health using the Ocean Health Index (OHI) at the city-level by selecting appropriate parameters and reference points to align with data sources. The results indicated that the overall OHI score declined by 5.81 in Dalian from 2012 to 2022. For decades, the scores for Clean Waters and Coastal livelihoods and economies had consistently maintained perfection. The scores for Food Provision, Natural Products, and Carbon Storage increased, while those for Tourism and Recreation, Coastal Protection, Sense of Place, Artisanal Fishing Opportunities, and Biodiversity experienced decline. Food Provision saw the most substantial growth, increasing by 16.44, while Tourism and Recreation experienced the steepest decline, dropping by 30.57. It was indicated that the quality of seawater had consistently remained at a high level, and the economy developed well. However, there was a slight decline in marine health, with a notable downturn in tourism. Coastal ecosystems still face ongoing risks of degradation. For the next steps, the focus should be on coastal zone protection and revitalizing the tourism industry. Greater support and effective management should be provided to traditional fisheries. We recommend that parameters and reference points be standardized, and emphasize the importance of prioritizing the use of official data for calculations and assessments when applying the OHI at the city-level to ensure comparability.
1 Introduction
The ocean, being one of the most vital ecosystems on this planet, provides crucial material resources and safeguards the spatial environment for the existence and development of human society. It plays a pivotal role in global food and energy supply, production and employment, as well as economic growth (Costanza et al., 2014; United Nations (UN), 2015). Almost 40% of the world’s population lived in coastal areas (Barragán and de Andrés, 2015). Meanwhile, 75% of the world’s big cities and 70% of its industrial capital and population were concentrated within 100 kilometers from the coastline in coastal areas (Zong et al., 2021). In 2020, global capture fisheries production (excluding algae) was 90.3 million tons, including 78.8 million tons from marine waters. Global aquaculture production reached a record 122.6 million tons, of which 68.1 million tons came from marine and coastal aquaculture (Food and Agriculture Organization of the United Nations (FAO), 2022). Approximately 27% of the world’s oil and 30% of the natural gas production were derived from offshore sources (United Nations (UN), 2021). Established sectors of the EU Blue Economy generated a gross value added of 129 billion EUR, which directly employed almost 3.34 million people in 2020 (European Commission, 2023). In mainland China, the GDP of 11 coastal provincial-level administrative units accounted for 52.83% of the national GDP in 2022 (National Bureau of Statistics of China (NBSC), 2022).
Moreover, the ocean serves as not only the cornerstone of human survival but also plays an indispensable role in global climate regulation, carbon storage, energy and material cycles, biodiversity conservation, as well as human and ecosystem services (Duarte et al., 2020; Halpern et al., 2008; Intergovernmental Panel on Climate Change (IPCC), 2019; Worm et al., 2006). As one of the largest heat reservoirs, the ocean plays a crucial role in climate regulation by absorbing and storing a substantial amount of heat and carbon dioxide. This significant capacity greatly mitigated the rate of global temperature rise (Intergovernmental Panel on Climate Change (IPCC), 2019; Le Quéré et al., 2018; Levitus et al., 2012). Furthermore, the ocean provided diverse habitats for over 200,000 marine species (Costello et al., 2010), including coral reefs, seagrass beds, glaciers, coastal wetlands, cold seeps, deep-sea hydrothermal vents, submarine canyons, and so on.
However, with the dual impacts of climate change and human activities, the health of the ocean had been threatened to varying degrees. Since the industrial revolution, global climate change had accelerated, and occurrence of extreme weather events had increased (World Meteorological Organization (WMO), 2021). A series of issues such as glacier melt, sea level rise, ocean warming, and ocean acidification had emerged (Bindoff et al., 2007; Stocker et al., 2013; Doney et al., 2009; Intergovernmental Panel on Climate Change (IPCC), 2019; Poloczanska et al., 2013; Riebesell and Gattuso, 2015). The warming impacted not only coastal communities, but also the ecosystem goods and services they provided (Pendleton et al., 2016; Worm et al., 2006). This included impacts on sustainable fishing yields, aquaculture capabilities, and the filtering services offered by coastal wetlands (Barange et al., 2018; Cochard et al., 2008).
Meanwhile, the intensification of human activities in the ocean posed a significant threat to marine ecosystems. The first World Ocean Assessment report in 2015 identified human-induced pressures as the greatest threat to the ocean (United Nations (UN), 2015). Overfishing had depleted marine resources and severely reduced population resilience. Statistics indicated that half of the coastal areas globally have seen the disappearance of sawfish (Yan et al., 2021). Various marine engineering projects had also resulted in habitat destruction (Shams et al., 2023). For instance, offshore wind farms could impact the habitats and migration paths of seabirds and marine mammals, potentially leading to reduced populations of these species (Bailey et al., 2014). Given these challenges, conducting scientific assessments and implementing effective management strategies for marine health were crucial for the sustainable development of the ocean.
In order to ensure that the ocean could sustainably serve humanity’s prosperity and development, it was imperative to employ appropriate measures to assess the health of marine ecosystems, diagnose underlying issues, and provide scientifically valid guidance for human activities. The international approach to ocean management had evolved from a narrow focus on environmental pollution to comprehensive management, with the establishment of corresponding evaluation, governance, monitoring methods and frameworks. Examples of such approaches included Water Framework Directive (WFD) or Marine Strategy Framework Directive (MSFD) in Europe, Oceans Act in USA, Australia or Canada, National Water Act in South Africa, etc (Borja et al., 2008, 2012; Reyjol et al., 2014). However, these methods tended to emphasize environmental and ecological factors, while few synthetic measures existed to assess clearly and quantitatively the health of human-nature coupled system (Halpern et al., 2012).
As a scientifically rigorous indicator system, the Ocean Health Index (OHI) was a comprehensive evaluation system for assessing the ability and sustainability of the ocean to provide welfare for humans. It not only revealed the changes and trends in ocean health but also facilitated assessments and comparisons of marine ecosystem health across various temporal and spatial scales (Halpern et al., 2012). The OHI placed a greater emphasis on the connection between human society and marine ecosystems (Halpern, 2020). Additionally, the OHI considered the interactions between indicators to a greater extent. Currently, the OHI was used annually to assess the global ocean health of 220 coastal countries and regions (Blenckner et al., 2021). Each year, new data was collected to track changes in global ocean health (Halpern, 2020). It had been applied from the coast of Antarctica (Longo et al, 2017), Brazil (Elfes et al., 2014), Fiji (Selig et al., 2015), to Tianjin in China (Zheng and You, 2013), Xiamen (Ma et al., 2016), and Shanghai (Wu et al., 2021). The practical applications of these evaluations had demonstrated that the OHI served as an important tool for assessing ocean health, guiding marine development and management, and promoting the sustainable development of the ocean and applicable at both global and regional scales (Elfes et al., 2014; Halpern et al., 2012; Longo et al., 2017; Ma et al., 2016; Wu et al., 2021; Zheng and You, 2013). It was worth noting that while the OHI had been applied across multiple scales, its application at the city-level, especially in China, remained limited and required further research and exploration.
Situated at the southernmost tip of the Liaodong Peninsula, Dalian is a coastal city known as the “Northern Pearl” in China. As the leading open city in the northeastern region of China, it served as the largest seafood trading center and distribution hub in northern China. Additionally, the unique geographical advantage, with its eastern coastline facing the Yellow Sea and its western coast reaching the Bohai Sea, positioned it as an international comprehensive transportation hub and a maritime gateway to the world. While the rapid development of the maritime economy had brought vitality to Dalian, a coastal city that relied on the sea, it had also posed various challenges and issues to the marine ecosystem in the face of urbanization and accelerated economic growth. Therefore, there was an urgent need for scientific and effective measures to guide marine development and management, aiming to achieve high-quality development of the marine economy.
This study was aimed at providing basic data for marine development and management, enhancing the understanding and tracking of the health status of marine ecosystems, and deeply exploring the feasibility of applying the OHI at a regional scale. The OHI had been applied to assess the health status of the marine ecosystem in Dalian, with scores for both 2012 and 2022 calculated. This allowed for a comparison of the changes in the health status of Dalian’s marine ecosystem over this ten-year period. Furthermore, it was expected to serve as a reference for more regional-scale applications of the OHI, and provide a theoretical foundation and practical guidance for the development of Dalian as a marine center city and the enhancement of its capabilities for sustainable development of the marine ecosystem.
2 Methods and data
2.1 Study area
Dalian, situated in the northeastern region of China, is uniquely surrounded by the sea on three sides. It boasts a maritime area under administrative jurisdiction of 30100 km², which constitutes approximately 81% of the total ocean area of Liaoning Province. Its coastline stretches over 2,211 km, of which the mainland coastline is 1371 kilometers, accounting for 65% of the province’s total coastline. Over 300 kilometers of Dalian’s coastline are deep-water, forming numerous natural ports and over 60 beaches, thereby offering unique marine tourism resources. The marine resources, especially its precious seafood, are appreciated both domestically and internationally (Halpern et al., 2012; The People’s Government of Dalian Municipality (DMPG), 2024a). (Figure 1)
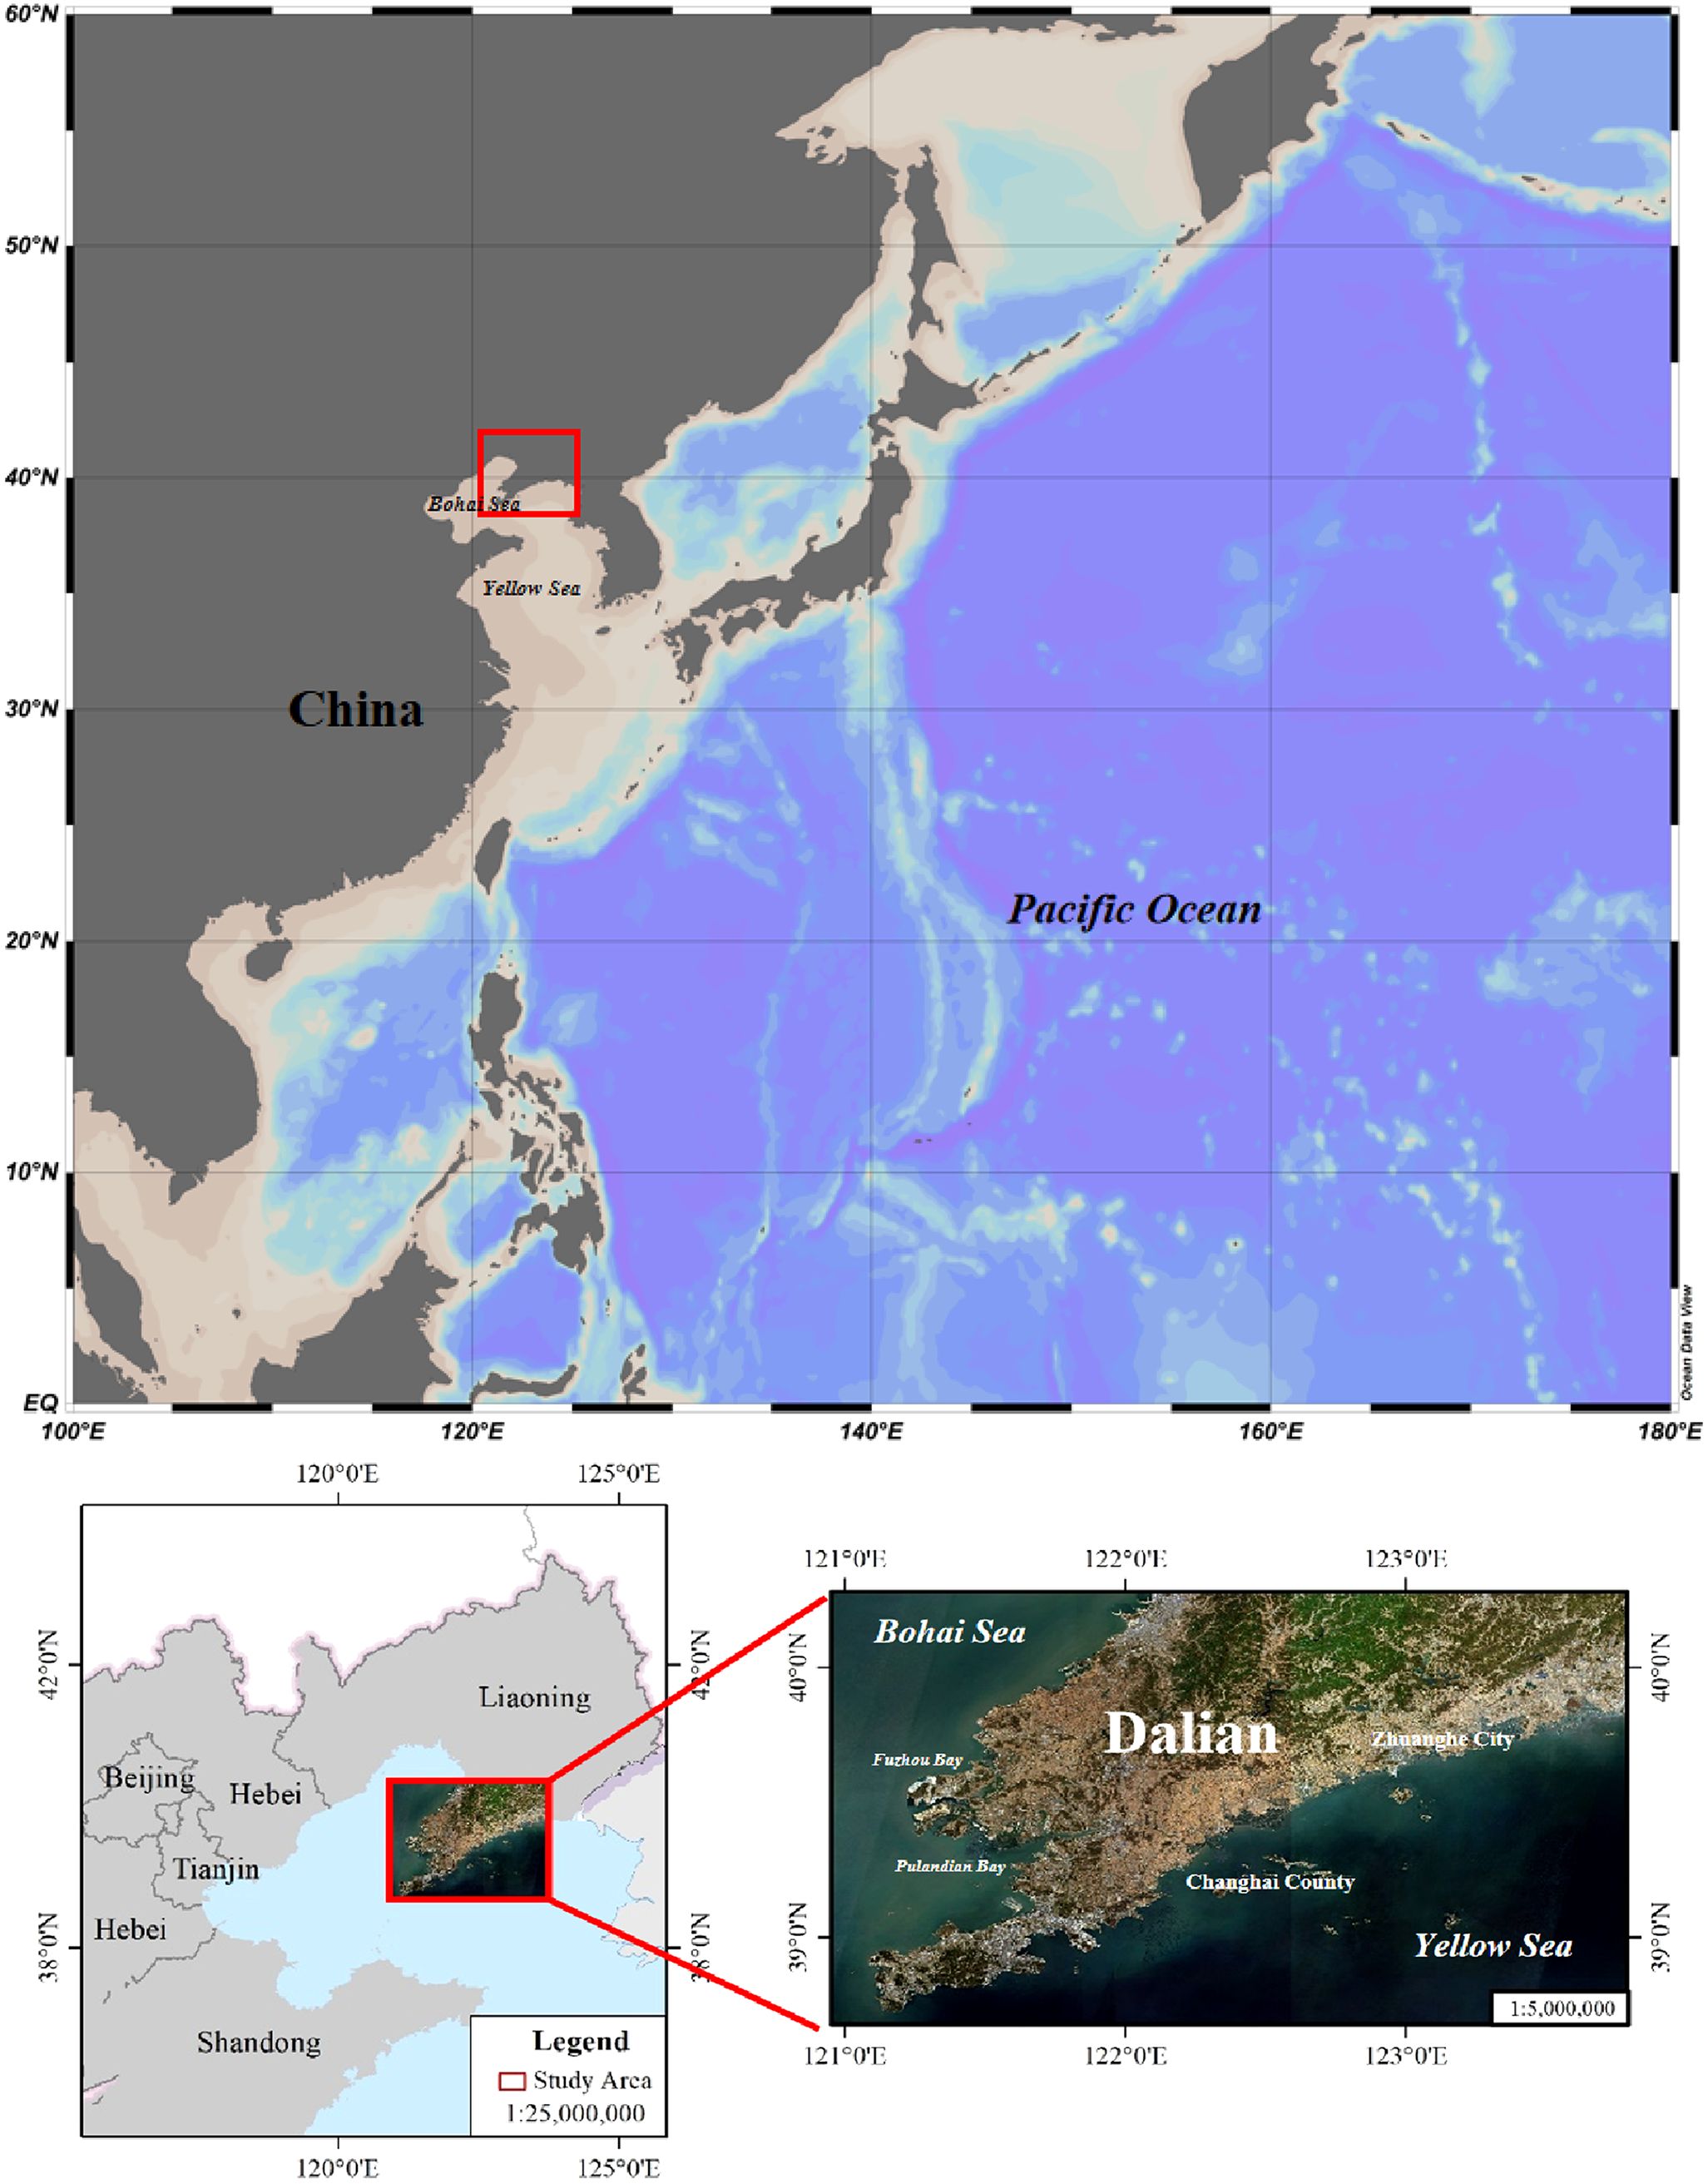
Figure 1. The location of Dalian.
2.2 The OHI framework
2.2.1 The OHI goals
The OHI comprehensively assessed ocean health from ten key goals, as follows: Food Provision (FP, measuring the potential for sustainable fishing of marine food), Artisanal Fishing Opportunities (AO, exploring opportunities for small-scale fishing activities), Natural Products (NP, assessing the sustainable fishing potential of non-food marine resources), Carbon Storage (CS, evaluating carbon absorption and storage capacity), Coastal Protection (CP, examining the protection capacity of marine and coastal habitats), Coastal Livelihoods and Economies (LE, measuring employment and income from marine-related industries), Tourism and Recreation (TR, reflecting the experiences and enjoyment people get from the ocean), Sense of Place (SP, a cultural value assessing the connection between specific species and cultural places and people’s connection with the ocean), Clean Waters (CW, assessing the pollution level of coastal waters), and Biodiversity (BD, assessing the status of marine biodiversity conservation).
In this study, OHI served as the primary evaluation tool for assessing the health of the marine ecosystem in 2012 and 2022 in Dalian. The detailed calculation method primarily drew upon previous research (Halpern et al., 2012; Ma et al., 2016; Wu et al., 2021). Due to the lack of some parameters and data for consecutive years, several minor tweaks of certain parameters and reference points had been implemented based on the actual circumstances in Dalian in this study. Here we gave a brief summary. The evaluation steps were as follows (see Figure 2):
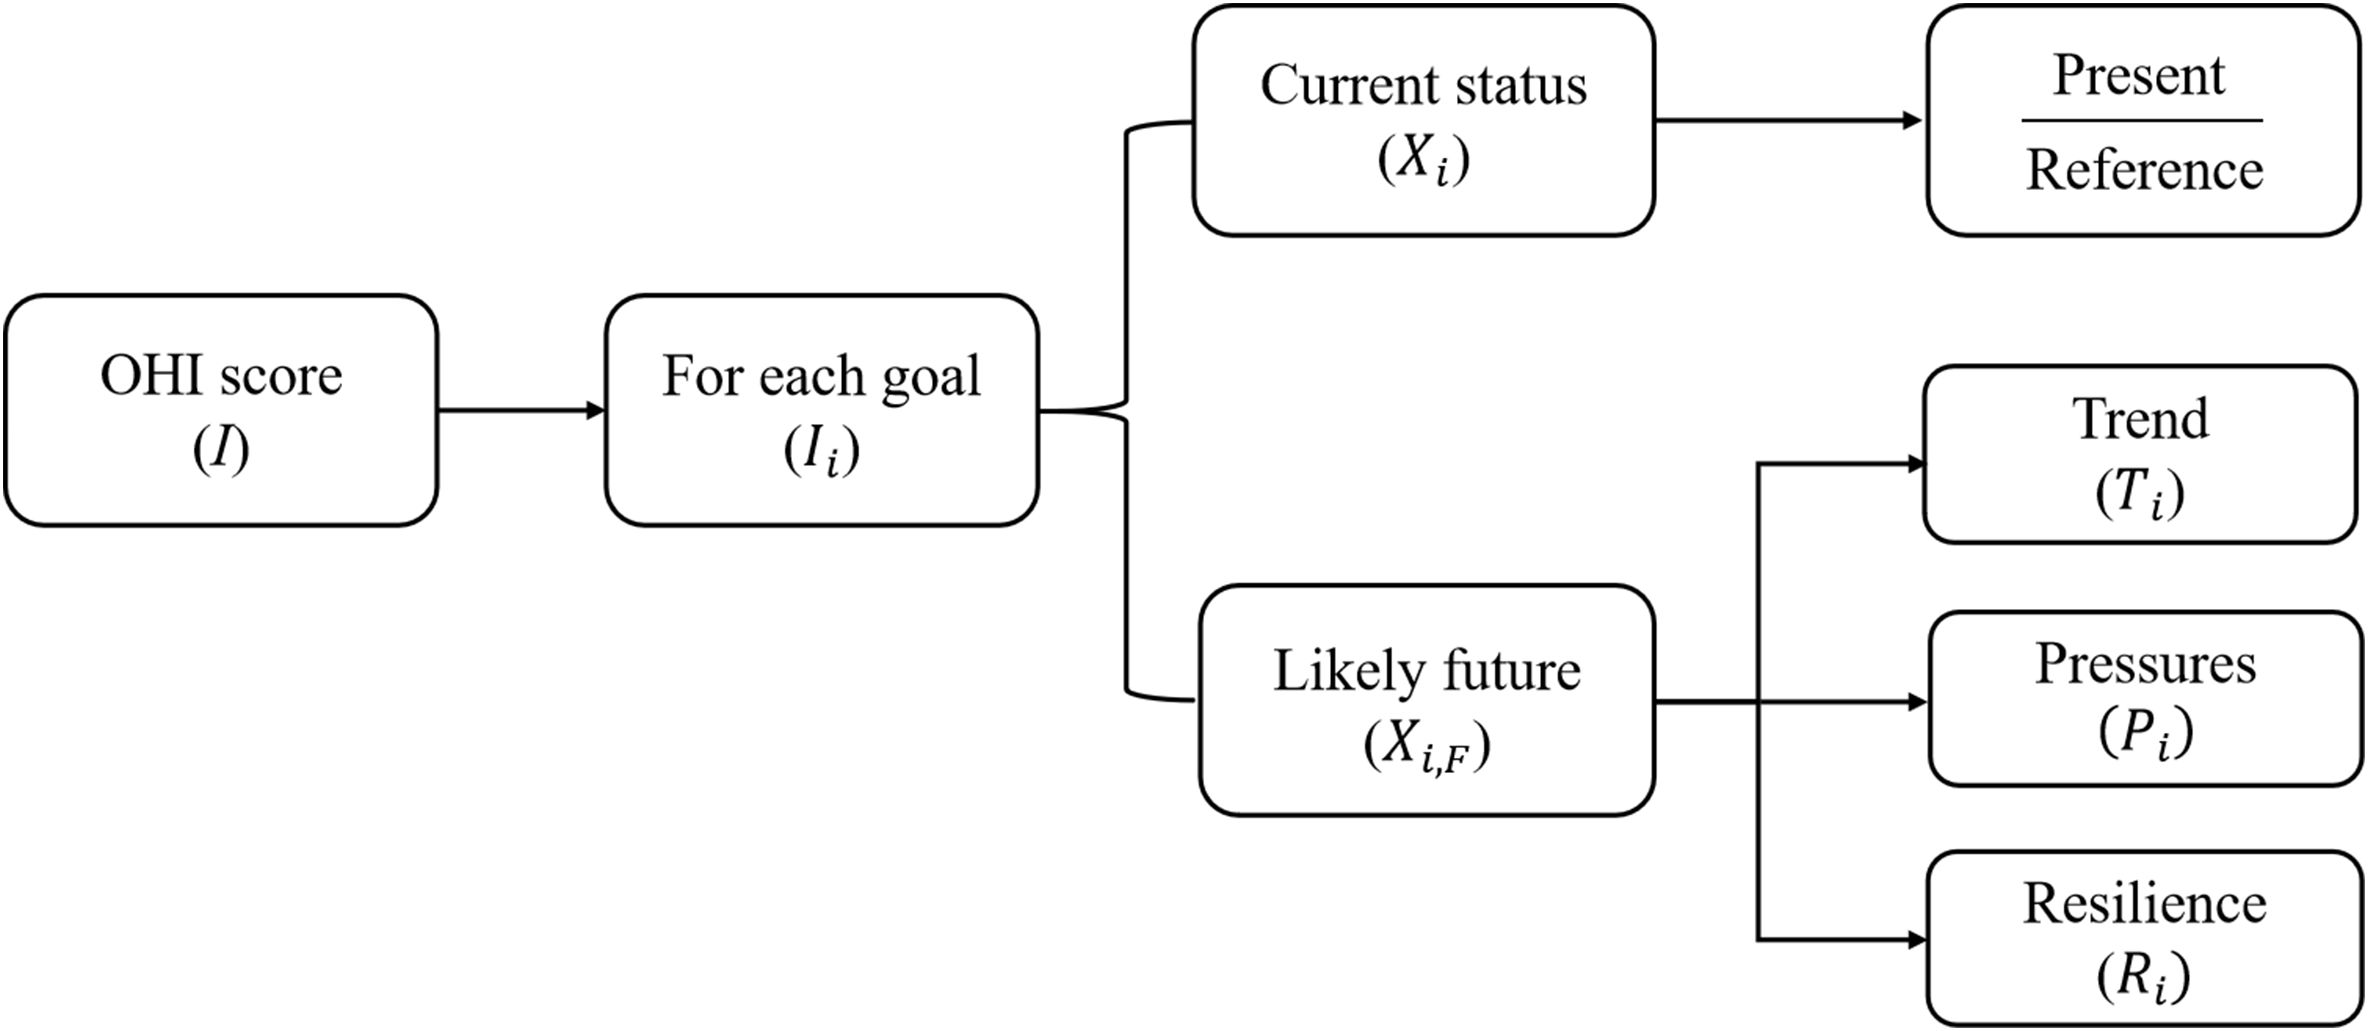
Figure 2. Framework of the OHI (Wu et al., 2021).
The goal of the OHI was to maximize its score (I), which was the linear combination of ten goal scores (I1, I2, I3,…, I10) and their respective weights (α1, α2,…, α10).
Each goal score () was a function of the current state (), and the near-term trend function () (usually covers data from the past five years). The goal score represented the average of the current state and the near-term trend.
was the ratio of its current condition score (X) to the reference point ().
The Likely future status included the trend (), pressure (), and resilience ().
where δ was a discounting rate, setting to 0 in this case because of the short time frame. β represented the weight of recent development trends, which was set to 0.67 (Halpern et al., 2012; Ma et al., 2016).
2.2.2 Reference points
The process of identifying reference points often presented a formidable challenge, stemming from the variability in data quality and its accessibility. The choice of reference points, contingent upon the specific context, could encompass diverse criteria such as the peak value within a region, a benchmark from an unperturbed era, a designated target, or the mean over recent years. This selection played a pivotal role in shaping the calculation of OHI, as different reference points yield varied outcomes. Furthermore, the OHI itself might select reference points tailored to its objectives or for the purpose of self-assessment. Accordingly, it was imperative to establish apt reference points for each parameter within the targeted region, ensuring their relevance and suitability. In this study, we had meticulously determined reasonable reference points, drawing upon regulatory frameworks, established standards, planning guidelines, historical precedents, average values from a prescribed period, and even values derived from rigorous scientific calculation models. This approach ensured that the chosen reference points were well-grounded and aligned with the objectives of the analysis.
2.2.3. Weighting goals
Three weight values (0.15, 0.10, and 0.05) were utilized, representing high (preservationists), medium (non-extractive), and low, (extractive users) respectively (Halpern et al., 2012). In this study, the weight values assigned to preservationists were adopted for the computation of the OHI (Table 1) (Halpern et al., 2012), as we believed that oceans still require our vigorous protection.
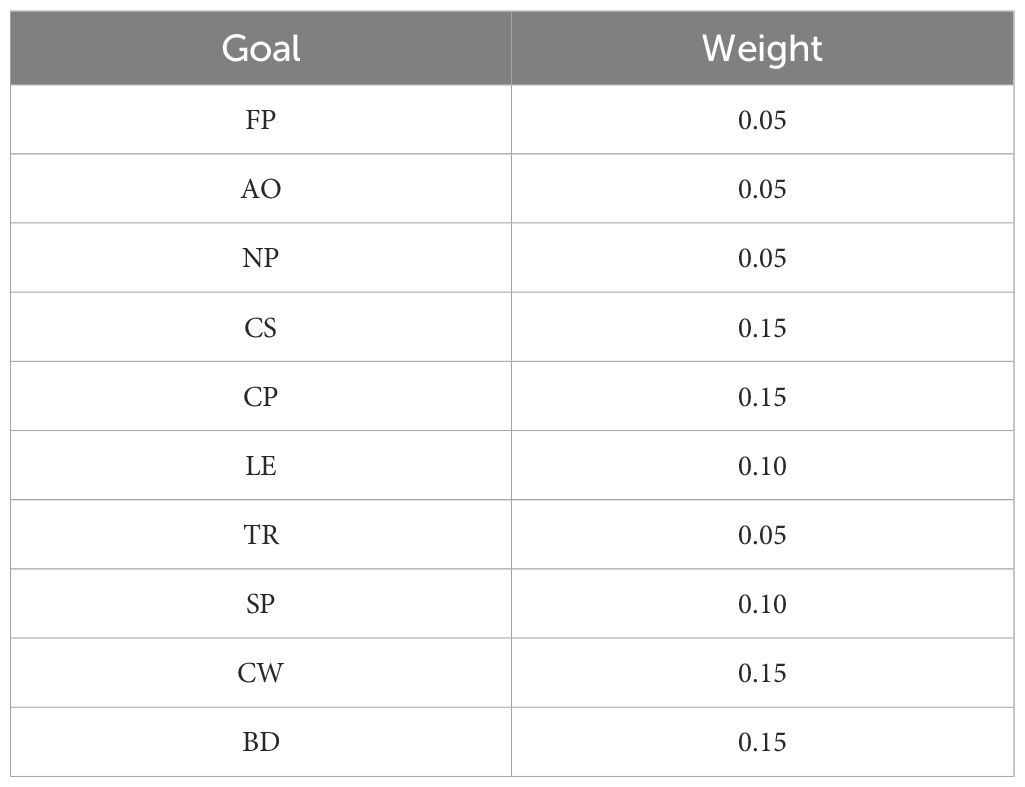
Table 1. Weights for each goal.
2.3 Detailed information
Followings were detailed models for the selected ten goals for Dalian OHI (Table 2).
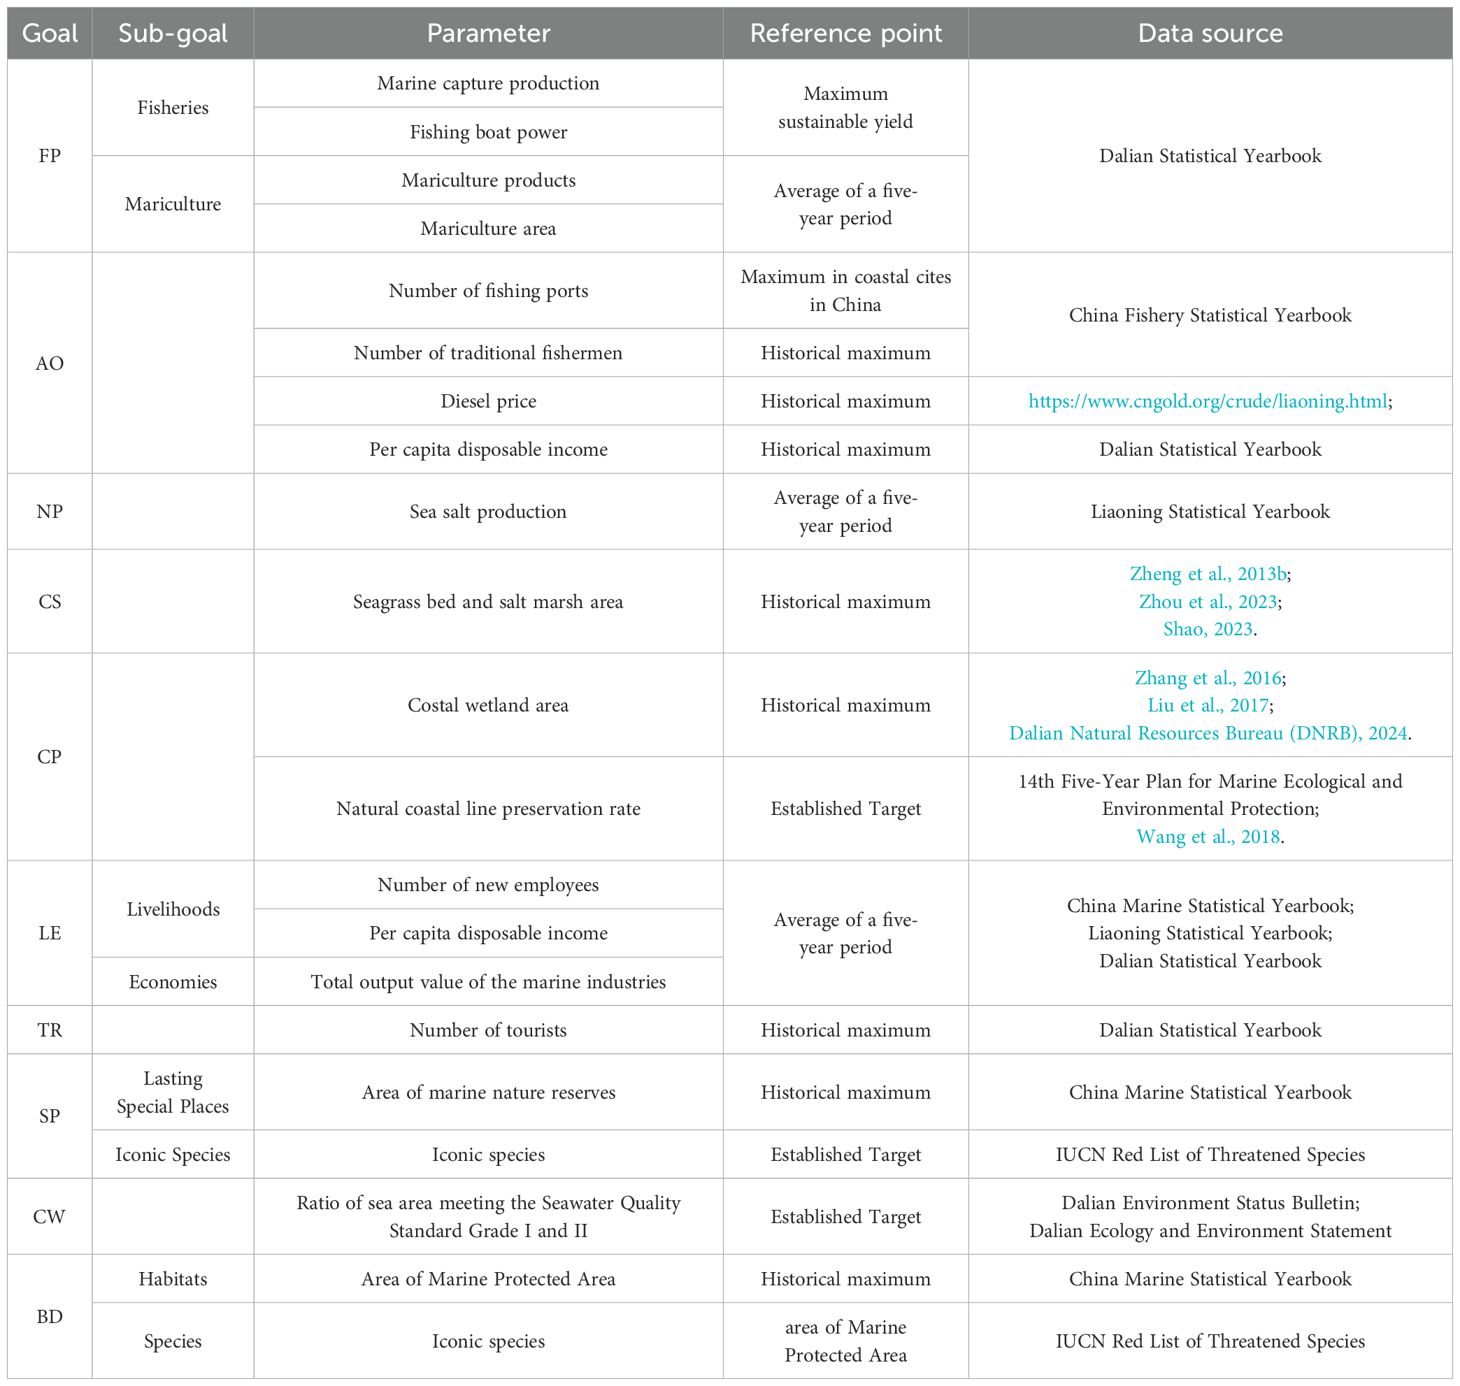
Table 2. Details for models of goals and sub-goals.
2.3.1 Current status
2.3.1.1 Food provision
Marine ecosystem were paramount in ensuring the availability of food resources. This goal endeavored to assess the sustainability of seafood procurement, with a higher score indicative of greater abundance. The evaluation framework encompassed two pivotal sub-objectives: Fisheries (FIS) and Mariculture (MAR). All data were sourced from the Dalian Statistical Yearbook, which was highly authoritative but might lack detail in certain aspects. The calculation model employed aligned fundamentally with the OHI global assessment model.
FIS was calculated following the OHI model:
where was the biomass at time t, was the natural increase rate, K was the maximum biological capacity and was the catch at t (time). In this study, We used the total marine capture data for our calculations due to the lack of information on the catch volumes of different types of seafood. As a result, all indicators for different types of seafood were treated equally.
where q was the fishing coefficient, and was the fishing effort (fishing boat power) at time t (Wu et al., 2021).
According to the formula = , Ut was the catch per unit of effort. Substituting with :
Rearranged to be:
Converted into a standard multiple linear regression formula:
where Y was the dependent variable , the independent variables and were represented by and , , and were represented by , and . Through multiple linear regression analysis, , and could be calculated. Maximum Sustainable Yield (MSY) was used as the reference value for this goal. To calculate MSY:
where was the FIS score.
MAR was calculated following the OHI model:
where Yk represented the total marine mariculture production in that year, and represented the maximum marine area allowed for aquaculture in the marine functional zone. A notable deviation from the global model lied within the treatment of the Yk. In the global assessment model, Yk denoted the average yield of all k mariculture species within a given year, based on the most recent four-year data. However, confronted with the scarcity of detailed yield data for various mariculture species in Dalian, this study adapted the model to calculate the mariculture yield directly.
2.3.1.2 Artisanal fishing opportunities
The assessment of opportunities for artisanal fishing, who typically engaged in small-scale fisheries (SSFs), held importance. This model of fishing fundamentally contributed to food security, nutrition, and economic sustenance for coastal communities. Due to the unavailability of data on the number of people living below the poverty level and the unsuitability of the per capita gross domestic product (pcGDP) as a proxy at the city-level in the original model, this study adjusted the model by utilizing three dimensions for representation. We considered that the quantification of these opportunities was intricately linked to factors such as number of fishing ports, the population of traditional fishermen, per capita disposable income, and diesel prices. The first two factors indicated the capacity of traditional fisheries to support fishermen, while the last two indicators represented the economic feasibility of engaging in this activity. Fishing ports are designated for docking of fishing vessels and fishery auxiliary ships, and serve as places for fishermen to replenish supplies and process their catches. In addition, due to the relatively low price of diesel, traditional fishermen often use diesel as fuel for their fishing vessels considering cost factors in China. Therefore, we had selected the number of fishing ports and diesel prices as measurement indicators.
The calculation methodology was outlined as follows (Wu et al., 2021).
where was the AO score, was the number of fishing ports, was the reference value of the number of fishing ports, was the number of traditional fishermen, was the reference value of the number of traditional fishermen, was the economic access, was the annual diesel price, was the reference value of diesel price, was the per capita disposable income, and was the reference value of per capita disposable income.
Given the lack of definitive data on the number of traditional fishermen in Dalian within the Statistical Yearbook, we had employed a proxy method, leveraging the count of traditional fishermen in Liaoning Province for estimation since Dalian is under the jurisdiction of Liaoning Province. The conversion factor was derived from the ratio of Dalian’s fishing ports to those in Liaoning Province, utilizing the highest figures recorded over the past decade as benchmarks. Furthermore, due to the unavailability of data from the China Fishery Statistical Yearbook prior to 2013, we had necessarily resorted to utilizing data from the 2014 edition to calculate the AO target score in 2012.
2.3.1.3 Natural products
This objective primarily evaluated a country or region’s capacity to optimize the sustainable extraction of non-food marine resources from the ocean. The assessment of the Natural Products goal predominantly centered on the analysis and scoring of three types of marine products: sea salt, marine chemicals, and marine bio-pharmaceuticals in China. In this study, given that Dalian only had recent data on sea salt, the production of sea salt was used as a representative to calculate this goal. The reference point was set as the average of the past five years. The calculation method was as follows.
where represented the harvest level of a product relative to the maximum reference point. reflected the sustainability of the product’s harvest. The state of each natural product XNPp represented the state of each natural product. was set at 0.5 based on previous research and experience in this study (Halpern et al., 2012). N represented the number of natural product categories (N=1 in this study). Lastly, represented the weight (=1 in this study) of each product relative to the total output value of all natural products.
2.3.1.4 Carbon storage
This goal was used to assess the ability of the ocean to absorb and store carbon. The state of carbon storage was primarily measured by evaluating the condition of mangroves, seagrass beds, and salt marshes (Halpern et al., 2012). Considering the characteristics of the Dalian sea area, seagrass beds and salt marshes were included in the calculation range of the carbon storage goal score. The calculation method was as follows:
where was the condition of each habitat, was the reference condition, and was the area of each habitat, was the total area of both habitats. The contribution rates of salt marshes and seagrass beds were generalized as 1 and 0.5, respectively, and was generalized as 0.5 and 0.8 based on previous research and experience in this study (Halpern et al., 2012; Wen, 2019).
2.3.1.5 Coastal protection
This objective served as a metric for assessing the aptitude of marine and coastal ecosystems in safeguarding critical infrastructure, housing, and other significant human activities zones, including marine parks, vital to coastal dwellers. The comprehensive evaluation focused on the resilience of coral reefs, seagrass beds, mangroves, salt marshes, and sea ice against the challenges posed by floods and beach erosion in the global model. A higher score denoted a more favorable habitat condition or a stronger capacity for recovery, aligning closer with the ideal reference state. By implementing protection and restoration initiatives, the depletion of these habitats could be mitigated.
For this case study, Given the actual utilization and conservation efforts in coastal areas in China, it was not comprehensive enough to solely use ecosystems such as seagrass beds and salt marshes to assess this indicator. Therefore, we had chosen to evaluate using coastal wetlands, which cover a broader area of coastal regions and encompass the aforementioned ecosystems, as well as the retention rate of natural coastlines (which assesses the protected coastline situation, specifically the proportion of natural coastline length to total coastline length). We believed that this approach might be more reasonable and targeted in the context of China. We sourced data pertaining to the coastal wetland area and the retention rate of natural coastlines, using the maximum area of coastal wetlands recorded in 2005 (the largest in recent years) and the target retention rates for natural coastlines outlined in the 12th Five-Year Plan (36%) and the 14th Five-Year Plan (35%) as points of reference. Further, we projected that the natural coastline retention rate in 2022 will surpass 35% according to the information obtained from relevant departments or numerous public statements, guided by benchmarks of 35% outlined in the 14th Five-Year Plan for Marine Ecological and Environmental Protection.
Where represented the current condition for natural coastlines, represented the reference condition (the government goal) for natural coastlines and is the current condition for costal wetland area, was the reference condition (the most area over the 20 years in Dalian) for costal wetland area.
2.3.1.6 Coastal livelihoods and economies
This objective was used to assess the contribution that the ocean could make to the livelihoods and economic development of people in coastal areas. Compared to the global model, internally unified statistical standards eliminated the need for adjustments to indicators such as employment, wages, and income in China. However, the China Marine Statistical Yearbook had discontinued its inclusion of employment statistics specific to marine-related occupations since 2016. The alteration in the Yearbook necessitated the use of total new jobs as a proxy alongside the values for all of Dalian or Liaoning Province. Therefore, to maintain data continuity and comparability, the count of total new jobs had been adopted as a proxy for the number of marine-focused positions. Additionally, the aggregate marine production value of Dalian was unavailable within the Dalian Statistical Yearbook. Therefore, the output value of the marine industries of Liaoning Province was employed for conversion purposes. With no other data available to us, we assumed that the proportion of Dalian’s marine production value in Liaoning Province’s marine production value was approximately equal to the proportion of Dalian’s GDP in Liaoning Province’s GDP, with the reference point being the average over the preceding five years. The methodology for this calculation was outlined as follows:
where was the score of livelihoods (LIV), jc,k was the annual number of newly employed individuals, jr,k was the reference value of the annual number of newly employed individuals, was the per capita disposable income, and was the reference value of the per capita disposable income.
where was the score of economies (ECO), was the total output value of marine industries and was the reference value of the total output value of marine industries.
2.3.1.7 Tourism and recreation
Tourism and recreational activities along coastal areas played a pivotal role in the vibrant development of these regions, and they were highly sought-after by individuals seeking to visit such destinations. Considering the accessibility of the data, the methodology for calculating the status of this objective proceeded as follows (Wu et al., 2021):
where represented the TR score, represented the number of tourists, including domestic and international tourists, and represented the maximum number of tourists in the past five years in Dalian.
2.3.1.8 Sense of place
The expression of SP towards the ocean embodied a cultural value, a subjective sense of existence in people’s connection with the ocean, and this sentiment originated from the ocean itself. This objective was bifurcated into two sub-objectives, namely, Iconic Species (ICO) and Lasting Special Places (LSP). Since there was no clear definition for iconic species, we consulted relevant experts and selected a total of 10 species with local cultural significance in Dalian from the List of Key Protected Wild Animals in China and the IUCN Red List of Threatened Species. We included nature reserves in the calculation and evaluation of the LSP. The calculation method was as follows:
where was the IUCN (International Union for Conservation of Nature) threat type, was the assessed number of threats for type and was derived by converting the threat weights determined according to the methodology described by Halpern et al. (2012), specifically as “1-threat weights” (Table 3). The reference value was the number of species classified as of Least Concern (weight was 1.0) risk status for all assessed species. The lower the risk for iconic species, the higher the score.
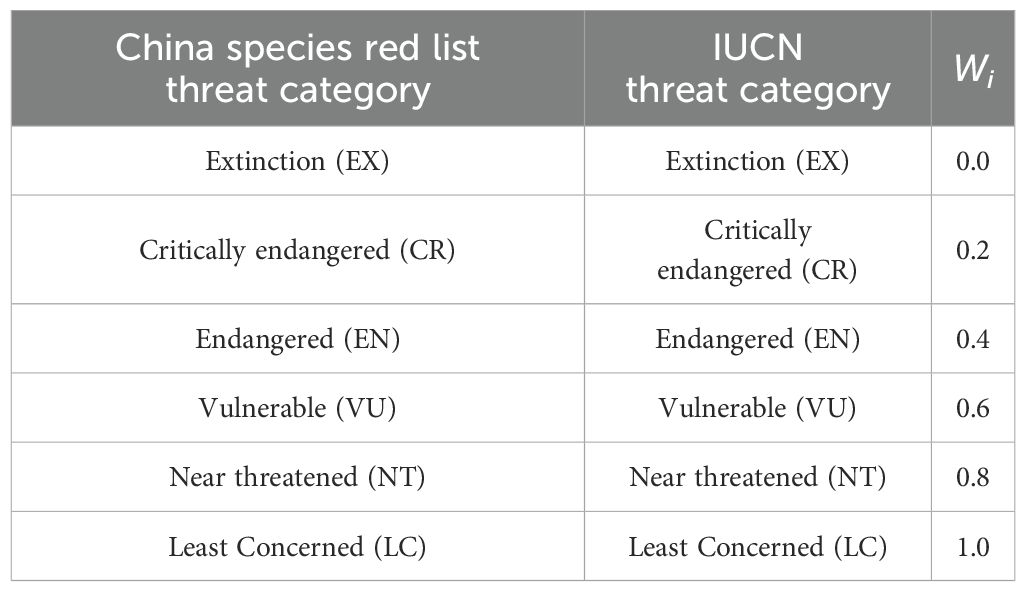
Table 3. Threat categories and Wi for assessment of species.
The value of LSP was calculated as follows:
where was the LSP score, MNR was the area of marine nature reserves. Ref_MNR was the reference value, which was the highest area from 2012 in Dalian.
2.3.1.9 Clean waters
This objective primarily evaluated the extent of seawater pollution. In this study, the ratio of sea area meeting the National standard of the People’s Republic of China: Seawater quality standard (GB 3097-1997) Grade I and II was employed as the calculation parameter. The reference points were set according to the goal of the 14th Five-Year Plan for Marine Ecological and Environmental Protection. The calculation method was as follows:
where represented the CW score, represented the ratio of sea area meeting the Seawater Quality Standard Grade I and II, and represented the reference point (79%).
2.3.1.10 Biodiversity
Biodiversity primarily revolved around the persistence of species and the looming threat of extinction. This overarching goal comprised two subsidiary objectives: species (SPP) and habitats (HAB). Species embodied the most tangible and immediately recognizable aspect of biodiversity, readily grasped by people. Conversely, habitats function as a proxy for a more comprehensive species evaluation, rooted in their respective living environments. Nevertheless, owing to the scarcity of habitat-specific data, the area of marine nature reserves was leveraged to quantify the habitat sub-objective. The approach to this calculation was outlined as follows:
Where represented the endangered weight value. If there was a record in the IUCN, it was calculated according to the weight in the IUCN. If there was no record, the weight of the national first-class protected animals was calculated according to the average weight of the first-class protected animals recorded in the IUCN. N was the number of endangered species.
where Cc/Cr, Cc represented the current condition of the habitat, Cr represented a specific condition of the habitat (reference point, which represented the highest area from 2012 in Dalian.
2.3.2 Trend
Trends were calculated based on the slope of recent changes derived from the available data. Whenever possible, the calculations were performed using data from the past five years, either by considering the data from each year or by using two data points to estimate the slope when data availability was limited.
2.3.3 Pressures
Ecological pressure () and social pressure () were assessed for each goal (Table 4).
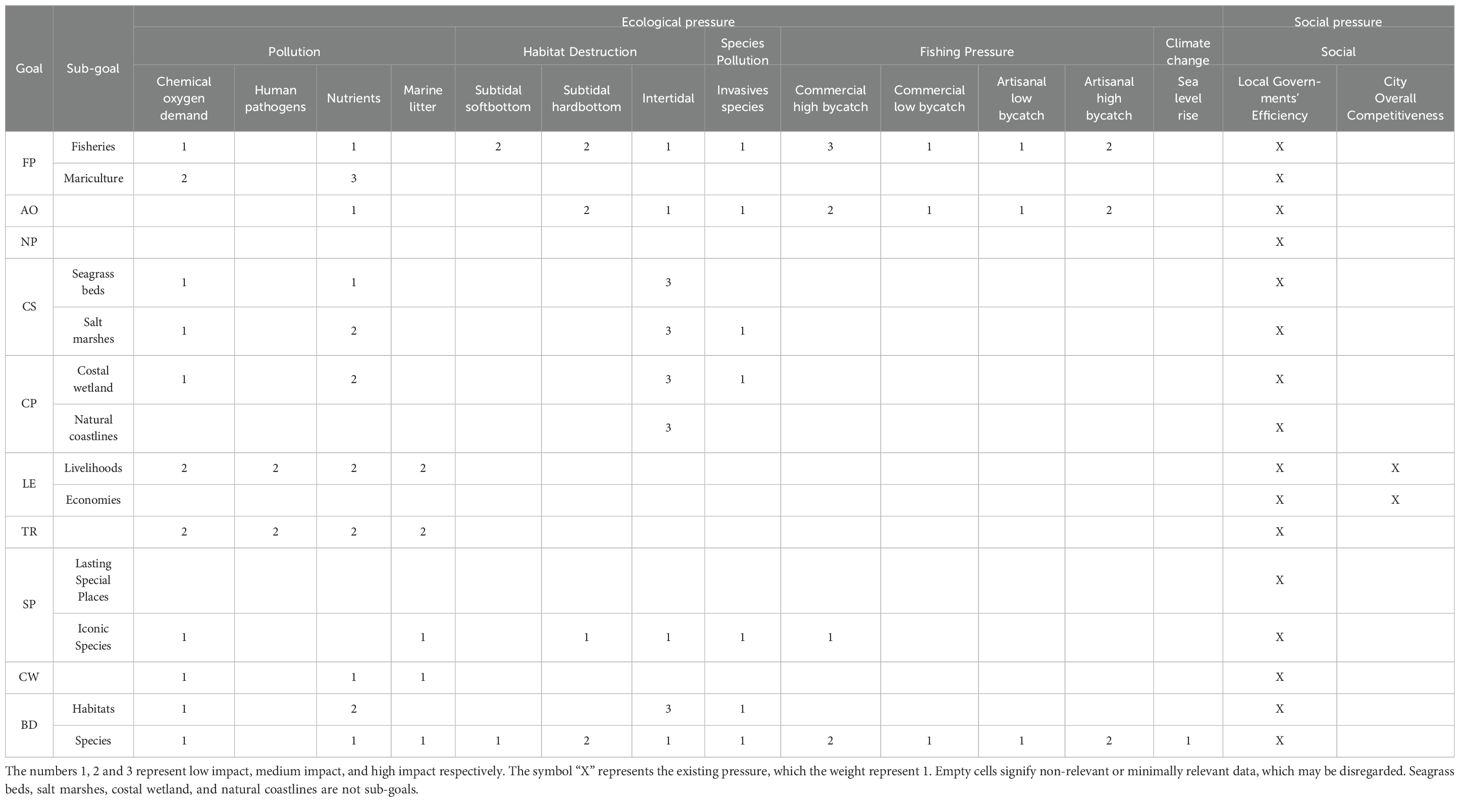
Table 4. Matrix of pressure rankings for all goals in Dalian.
where the weighting factor γ was set to 0.5, as the components of ecological pressures and social pressures were considered equally important. Px lied between 0 and 1.0.
Ecological pressure encompassed the severity of five distinct stressors, including water pollution, habitat destruction, genetic pollution, overfishing and climate change. For each goal and sub-goal, it was necessary to identify which ecological factors exert pressure and then rank them as “high” (score = 3), “medium” (score = 2), “low” (score = 1) or “X” (score = 1, “X” represents the existing pressure). By calculating the total weighted score of the corresponding goals or sub-goals and dividing them by the highest possible weighted score (multiplying the number of weights by the score of “high”, which was 3), the corresponding score of pressure was obtained. The dual dimensions of resilience and pressure served as valuable tools in crafting a more accurate assessment of recent developmental trends. Factors that adversely affected a given goal are categorized as pressure, whereas those exerting a positive influence are tied to resilience. Table 4 provided a comprehensive overview of both ecological and social pressures in this study, which leveraged insight from previous works (Ma et al., 2016; Wu et al., 2021).
2.3.4 Resilience
Evaluating resilience for goals necessitated a comprehensive assessment encompassing both ecological resilience and social resilience. The overall resilience value was subsequently derived as the average of these two components: the specific ecological regulations and the level of social resilience. Rx lied between 0 and 1.0.
Considering the unique circumstances in China and the availability of data, resilience measures for each goal or sub-goal was identified in this study based on previous research and the practical situation in Dalian (Ma et al., 2016; Wu et al., 2021). Ecological resilience encompassed clean water regulations and marine protected area, while social resilience included government efficiency and city overall competitiveness, with each aspect carrying a weight of 1 (Table 5). When pressure existed in a particular aspect, it earned a weighted score of 1. By calculating the total weighted score of the corresponding goal or sub-goal and dividing it by the maximum possible total weighted score, which was 4, the resilience score was then obtained by subtracting this ratio from 1. This approach reflected the inverse relationship between resilience and pressure: the greater the pressure, the lower the resilience, and vice versa.
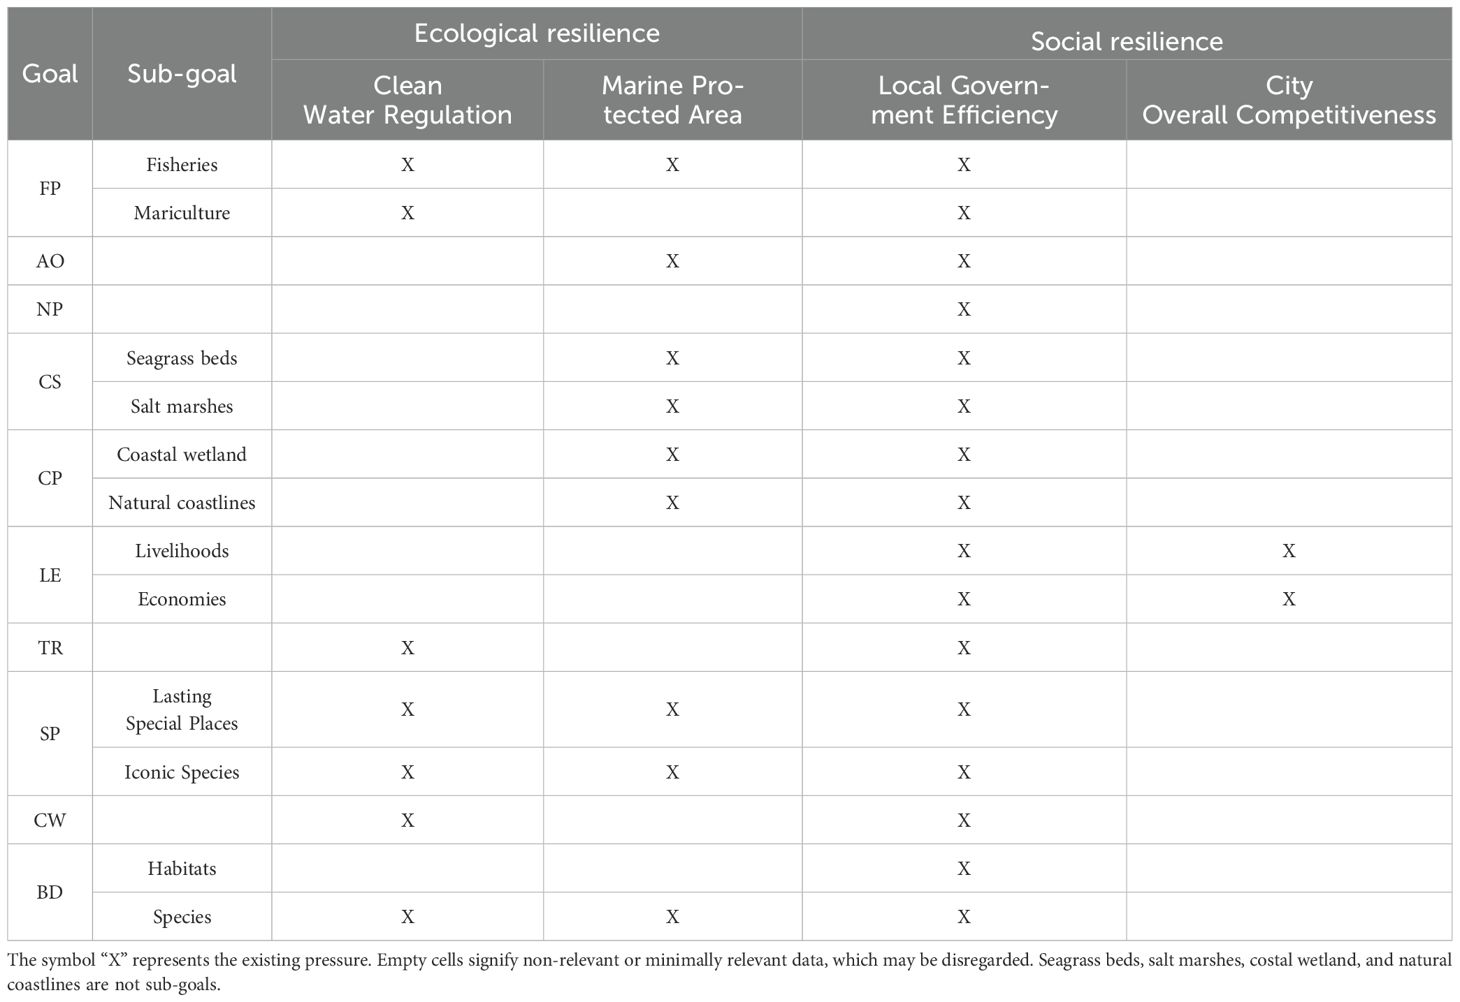
Table 5. Matrix of data used for the measurement of resilience for each goal in Dalian.
3 Results
The scores for 2012 and 2022 were shown in Table 6 and Figure 3. In the year 2012, the scores for each goal ranged from 33.78 to 100.00, with LE, TR and CW achieving the highest score, and FP the lowest. Among them, the scores for LE, TR, CW, CP and SP all surpassed the overall OHI score (74.55), with their respective scores being 100.00, 100.00, 100.00, 89.65 and 75.05 respectively. In contrast, AO, BD, NP, CS and FP scored below the OHI score, registering 67.09, 62.95, 55.55, 42.24 and 33.78, respectively. In the year 2022, the scoring range for each goal fell within 43.21 to 100.00. Once again, LE and CW emerged as the top scorers, while CS recorded the lowest one. Among them, the scores for LE, CW CP and TR, surpassed the OHI score (68.74), achieving scores of 100.00, 100.00, 71.42 and 69.43 respectively. In contrast, TR, SP, AO, NP, FP, BD, and CS scored below the OHI score, registering 69.43, 68.45, 63.90, 60.32, 50.22, 50.04 and 43.21, respectively.
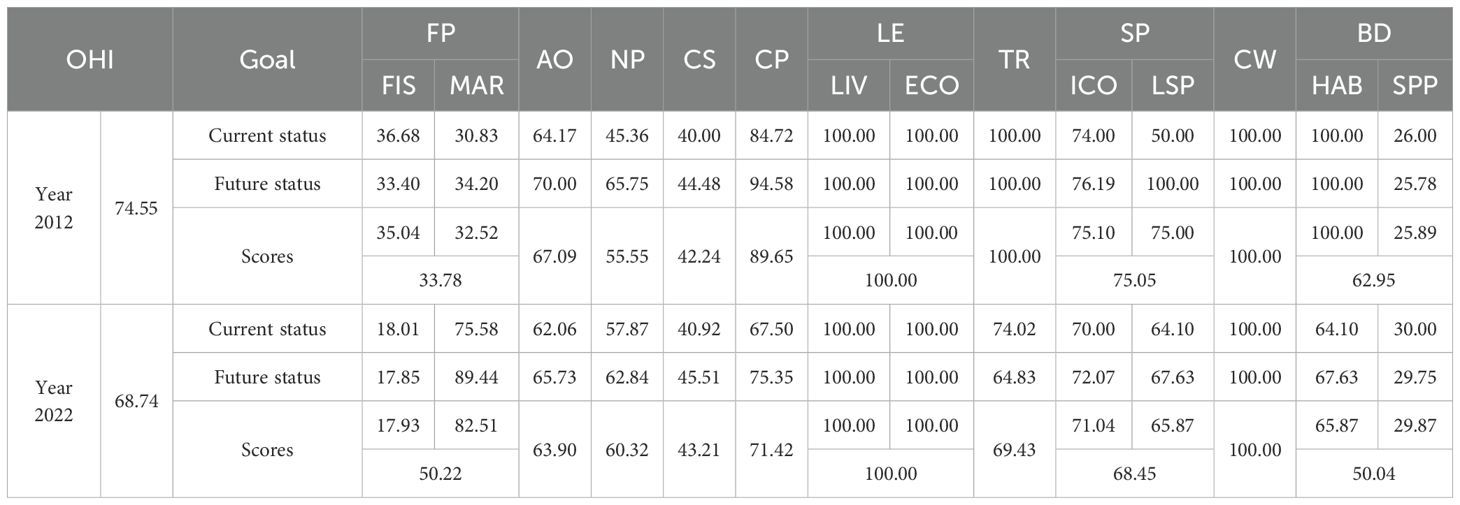
Table 6. Goal and Sub-goal scores for Dalian.
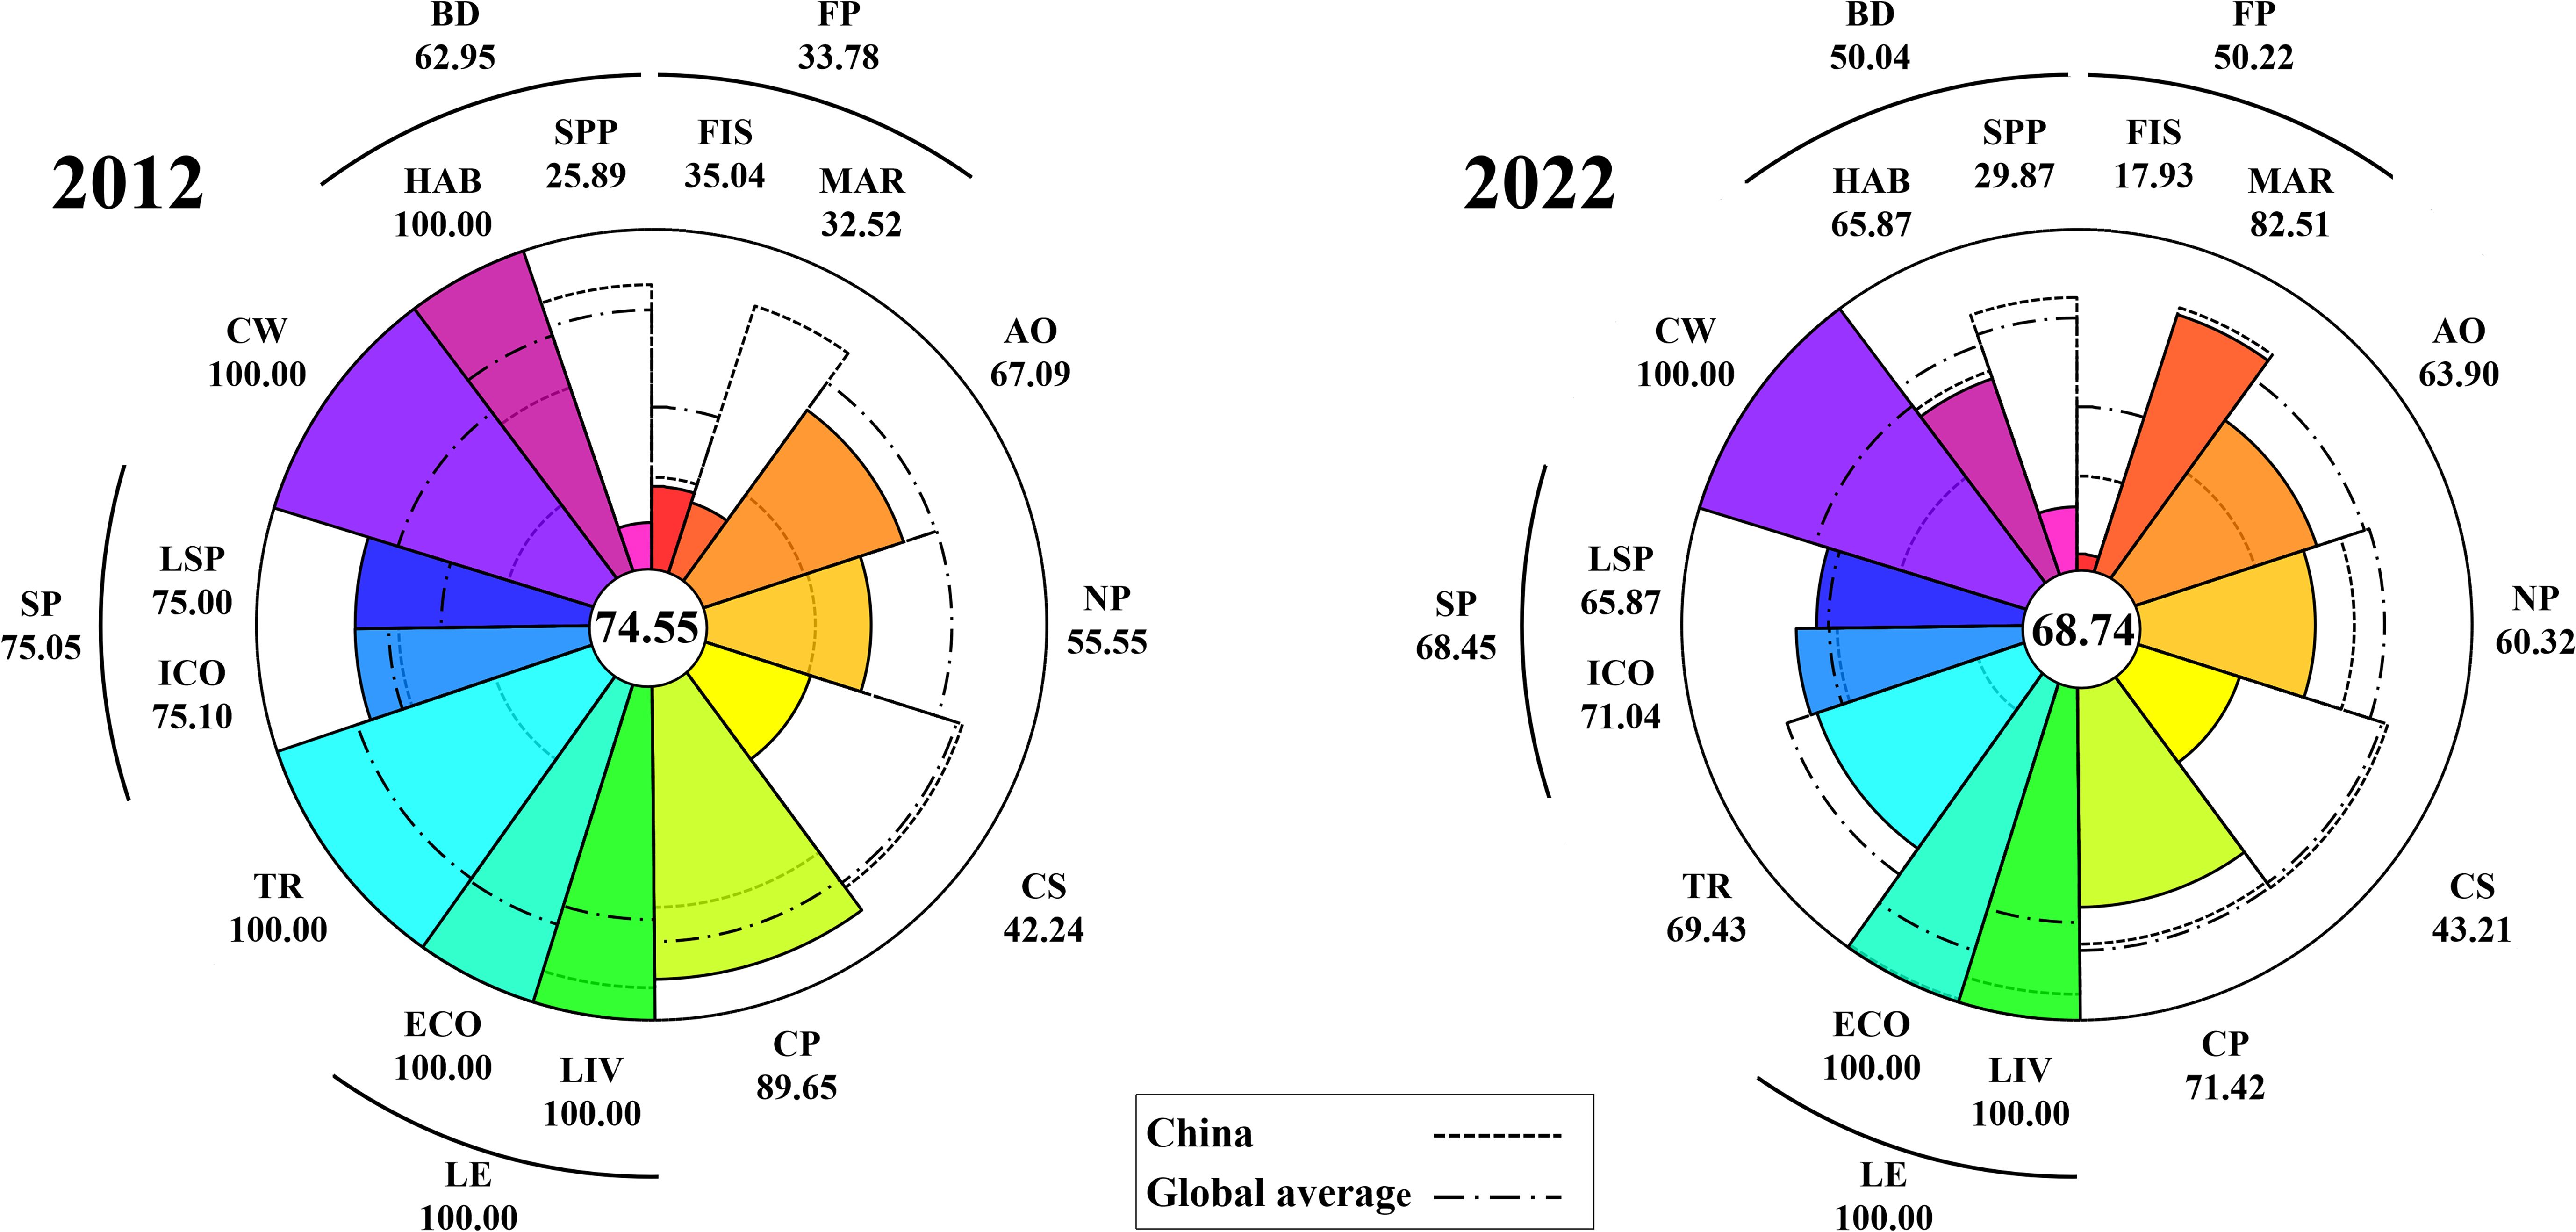
Figure 3. Goal and Sub-goal scores for Dalian.
It was need to be illustrated that the OHI scores presented herein ought not to be regarded as definitive or exact. As with all research endeavors akin to ours, encompassing those that utilize the OHI or comparable frameworks for comprehensive ecosystem evaluations, the scores were contingent upon the data and information readily available to us. It was imperative to acknowledge that all sources inherently possess uncertainties and inconsistencies. When contemplating the results, these factors must be borne in mind. Furthermore, it was far more beneficial to view such scores, both ours and those from other similar endeavors, as indicators of systemic change over time, rather than as precise and absolute endpoints.
Between 2012 and 2022, the score of the overall OHI declined by 5.81 over the decade, while the scores of goals and sub-goals varied. Considering the distribution of results only in this study, a change in scores exceeding 10 points was deemed to be extremely significant, a change between 10 and 5 was considered significant, and a change of 5 or less was deemed insignificant to distinguish the degree of difference between the results. Notably, throughout this decade, only the scores for CW and LE among 10 goals had consistently maintained a score of 100. Among the other goals, scores of FP, NP, and CS had registered an increase, with the score of FP achieving the most significant growth of 16.44, followed by modest gains of 4.77 and 0.97 respectively. In contrast, scores of five goals, TR, CP, BD, SP and AO had declined. Notably, TR witnessed the sharpest decrease of 30.57, while the other four suffered less drops of 18.23, 12.91, 6.60, and 3.19 respectively. The scores of FP, and NP, which were reflective of the supply of marine resources, exhibited a trend of growth. Conversely, indicators of TR and AO, which gauged livelihoods and tourism, had both experienced decreases in their scores. Regarding indicators that assessed the effectiveness of ecological and environmental protection, namely CS, CP, CW, and BD, different changes in their scores had been observed. Specifically, the scores of CS scores had risen, the scores of CW had remained 100.00, while CP and BD scores had declined. Notably, the scores of SP, which measured the value and services of ecosystems, had seen a decrease.
4 Discussion
4.1 The connotation and enlightenment of the OHI in Dalian
4.1.1 Reflecting the urban development trajectory of Dalian to a certain degree
The outcomes objectively unveiled the state of marine health in Dalian, as well as discernible transformations that had occurred over the past decade, possibly aligning with the trajectory of urban growth to a certain degree. Yet we again reminded readers that the results were subject to the quality, accessibility, and reliability of the underlying data and information used in our application of the OHI here. As we outlined earlier in this paper, and was the case with all work like ours, we were limited in the resources available to us, and had to rely on proxies in many cases. We were thoughtful in these decisions, and leveraged as much information as we could, but our findings must be considered in light of that reality. We stressed that this will be true of all work like ours, and that leveraging the OHI. It was useful to view such efforts as providing valuable insights on change over time, and additional qualitative context can help for further evaluation and support. We provided such context in the discussion below, and encouraged others to do the same when using the OHI.
When analyzing the key goals of 2012 and 2022, it became evident that the increase in FP and NP, along with the consistent good performance of LE and CW, and might reflect a more efficient utilization of marine resources, and a stable and excellent state of the seawater environment in Dalian. Compared to other facets, these domains emerged as possible strengths of marine development endeavors in Dalian. Notably, although we had calculated full scores for some parameters, this did not necessarily imply that the performance in these aspects of Dalian was flawless. Again, the selection of reference points contributed to the output score, including those of 100. Additional context and other sources of information could help shed light on and support these scores. Therefore, the full-mark scores attained by CW and LE could consistently highlight the excellent water quality of Dalian’s coastal waters and the capacity to fully utilize marine resources for the development of the marine economy.
In recent years, comprehensive rectification of sea discharge outlets had been carried out in Dalian, a marine sanitation system had been established, and strict control over total nitrogen emissions from rivers entering the sea had been enhanced (The People's Government of Dalian Municipality (DMPG), 2024b). Collectively, these initiatives were aimed at fostering a cleaner marine environment. Over the past five years, the proportion of the coastal area exhibiting excellent or good water quality (meeting the Seawater Quality Standard Grade I and II) had steadfastly surpassed 97%. Notably, in 2023, 99.1% of the coastal area had excellent or good water quality, up by 1.9% compared with the previous year. Within this, an impressive 95.8% of the coastal area met the stringent Standard Grade I criteria. Moreover, all 45 rivers discharging into the sea boasted a perfect water quality compliance rate of 100% (Dalian Municipal Ecology and Environment Bureau (DMEEB), 2023).
A good marine environment served as the cornerstone for marine development and might ensure the progression of the marine industry in Dalian. In terms of scores, although the score for FP had increased, which was primarily due to a significant rise in the MAR, while the score for FIS had declined notably. Meanwhile, LE had consistently maintained a score of 100. As emphasized earlier, the calculated scores were not absolute, as they were influenced by the choice of reference points and alternative parameters. However, the trends in these scores could, to a certain extent, illustrate relevant issues. Just as demonstrated by the changes in scores, the marine capture fisheries in Dalian had indeed declined compared to ten years ago, while the development of marine ranching had increasingly gained attention. Dalian boasted 32 national-level marine ranching sites with a demonstration area exceeding 200 km2, ranking first in China in both number and scale (The People's Government of Dalian Municipality (DMPG), 2024c). In 2023, an annual growth rate of 8.8% was witnessed in the added value of marine fisheries, and a significant surge of 16.1% was recorded in the added value of the marine aquatic product processing sector (People’s Daily, 2024). Furthermore, the score for NP was also showing an upward trend. It should be noted that this might be due to our choice of sea salt as an alternative parameter, and indeed, the sea salt industry in Dalian had developed well. Dalian boasted unique and advantageous conditions that were conducive to the sea salt industry, with seawater characterized by high salinity, climatic conditions that were suitably aligned, and a distinct seasonal distribution of sunshine hours being present. As the largest source of ecological sea salt production and the largest raw salt base among state-designated salt production enterprises in China, the Dalian Salt Chemical Group produced over 700,000 tons of sea salt annually (Ministry of Agriculture and Rural Affairs of the People's Republic of China (MARA), 2023). All of the above industries had made significant contributions to the sustained and stable economic development of Dalian.
However, the score of AO, which served as an indicator reflecting the sustainability of artisanal fishing, had declined, by 3.19 during the same period, which might suggest that the outlook was not optimistic. The adjustment of industrial structure may exert an influence on SSFs, resulting in the displacement of traditional, low-technology fisheries by more mechanized and technologically sophisticated commercial and recreational fisheries (Lloret et al., 2018). In 2017, guidance was issued by China to accelerate the transformation and structural adjustment of the fishing industry, mandating a gradual reduction in domestic fishing capacity and the optimization of marine fishing operations’ structure (Ministry of Agriculture and Rural Affairs of the People's Republic of China (MARA), 2016). Dalian was actively promoting the reduction of fishing vessels and the conversion of fishing jobs, having issued relevant guidance plans to reduce the number of fishing vessels. Currently, counties and districts were accelerating the implementation and promoting the dismantling and disposal of fishing vessels to decrease the intensity of nearshore fishing. In the future, Dalian will fully commit to the reduction of fishing vessels and the conversion of fishing jobs (The People's Government of Dalian Municipality (DMPG), 2023a). However, in developing countries, this transformation might not inherently entail adverse effects, as it could facilitate more efficient resource utilization and conversion. Economically, they might play a crucial role in local areas, potentially bolstering social stability in rural and remote regions (Guyader et al., 2013; Zhao and Jia, 2020). This perspective was corroborated by the falling score observed in AO, the increase in the score of FP scores and the full-mark scores of ECO.
4.1.2 Greater attention should be given to coastal zones protection
Despite the high scores maintained for CW, it had been observed that the scores for the three goals of CP, BD, and SP had all decreased. The primary reason for the decline in scores for the above objectives was the significant reduction in the area of coastal regions, such as nature reserves and coastal wetlands. This suggested that despite the good water quality, significant risks still loom over the future health of the ecosystem.
Since the 1950s, food and aquatic product supplies had been increased through methods such as sea reclamation for salt production, land reclamation, and aquaculture in China. Since the turn of the century, coastal reclamation had seen a surge in scale, with its applications broadening to encompass port logistics, coastal industries, and urban construction. Between 2002 and 2018, a total of 2,976.1 km2 of sea area was reclaimed in China, of which 910.8 km2 were utilized for urbanization and industrialization (Li et al., 2020). From 2000 to 2007, the native natural coastline retention rate in Dalian decreased from 55% to 29%, and after that it decreased slowly (Wang et al., 2018). The area of coastal wetlands in Dalian had reduced from 536,600 hm2 in 2005 to 213400 hm2 in 2016 (Dalian Natural Resources Bureau (DNRB), 2024; Liu et al., 2017; Zhang et al., 2016). It was undeniable that land reclamation had, to a certain extent, mitigated the shortage of coastal land. However, concurrently, illegal and damaging land reclamation had also exerted adverse effects on the marine ecological environment.
There were positive signals of hope. Since the 18th National Congress of the Communist Party of China, important instructions and directives on strictly controlling coastal reclamation and enhancing the protection of coastal wetlands had been repeatedly issued by the Party Central Committee and the State Council of the PRC. A series of systems concerning the management and control of reclamation, the protection and utilization of coastal lines, as well as the paid use of sea areas and uninhabited islands, had been established in China, resulting in the construction of a strict regulatory and control system for reclamation. In 2018, “the Notice on Strengthening Coastal Wetland Protection and Strictly Controlling Coastal Reclamation” was issued by the State Council of the PRC, which put forward stricter and clearer requirements for coastal reclamation. The approval of new reclamation projects was fully halted, and no reclamation projects were allowed to be developed in the Bohai Sea.
In recent years, the regulation of sea areas and coastal zones had been actively promoted in Dalian, with a focus on strengthening the ecological restoration of coastal wetlands. 800 hm2 of coastal wetlands and 23 km of coastline had been restored by projects completed in Pulandian Bay and Fuzhou Bay in 2020 (Dalian Natural Resources Bureau (DNRB), 2022). Since 2021, CNY 800 million in central fiscal support had been applied for by Dalian to carry out marine ecological protection and restoration projects in Zhuanghe City and Changhai County. Since 2023, rectification work on the illegal and irregular occupation of sea areas, tidal flats, and coastal lines had been organized and implemented by Dalian. Over 15500 cases of aquaculture-related sea area issues had been cleared, and approximately 137,200 hm2 of sea area had been rectified (Dalian Ocean Development Bureau (DODB), 2024).
Although policy and efforts in Dalian were advancing marine conservation, the current and future scores for various goals indicated that the preservation of coastal zones continued to face considerable pressure. Significant threats from human activities persist. The coastal zone, being the interface between coastal areas and the ocean, served as a vital ecological security shield. Consequently, it was advisable that future conservation strategies prioritize the protection of coastal zones.
4.1.3 Tourism industry had suffered heavy losses
We noticed a notable decline in the score of TR, with an astonishing drop of 30.57, which were clearly related to the COVID-19 pandemic. To addressed the pandemic, governments around the world had implemented policies such as travel restrictions and social distancing, which were essential measures to safeguard public health (Vo and Tran, 2021). However, these measures had significantly impacted personal mobility and tourism. This impact was incomparable to the consequence of the previous pandemic episodes. The world travel and tourism council (WTTC) estimated the daily loss of a shocking one million jobs in the travel tourism sector for the widespread impact of the COVID-19 pandemic (Škare et al., 2021). International tourist arrivals (overnight visitors) plunged from 1465 million in 2019 to 407 million in 2020, a 72% drop in just one year, impacted by global lockdowns, widespread travel restrictions and the slump in visitor demand (United Nations World Tourism Organization (UNWTO), 2023). The total loss in international tourism revenues was estimated at USD 2.6 trillion for the years 2020, 2021 and 2022 (United Nations World Tourism Organization (UNWTO), 2023).
Clearly impacted by COVID-19, a sharp decline in tourist numbers had been observed since 2019 in Dalian. The number of tourists in 2020 was less than half of that in 2019 (Bureau of Statistics of Dalian (BSD), 2021). Nevertheless, this might not be entirely negative, as it presented new opportunities for the development of the tourism industry in the post-pandemic era, and Dalian was striving to firmly seize this opportunity at a new starting point. Fortunately, through the concerted efforts of all parties involved, the tourism industry in Dalian had gradually regained its former vitality. The number of tourists in 2022 had almost doubled that in 2020 (Bureau of Statistics of Dalian (BSD), 2023). In July 2023, Dalian received a total of 19.3877 million tourists, an increase of 42.87% compared to July 2019; in August, it received 19.1146 million tourists, an increase of 41.87% compared to August 2019, reaching a historic high (The People's Government of Dalian Municipality (DMPG), 2023b). During the Dragon Boat Festival holidays in 2024, Dalian received a total of 2.7179 million tourists, an increase of 23.97% year-on-year and 105.53% compared to 2019 (The People's Government of Dalian Municipality (DMPG), 2024d).
4.2 Comparability and applicability of the OHI in regional assessment
When compared to the global average of the OHI scores, scores of China fell below the global benchmark in both 2012 and 2022. Specifically, in 2012, Dalian’s OHI score surpassed the global average, whereas in 2022, it dipped below. Nonetheless, in both years, Dalian’s score remained higher than that of China (Ocean Health Index, 2023) (Figure 4). Score of Dalian were higher than those of Tianjin, Shanghai and Xiamen in China. Among 10 goals, scores of CW and LE were both higher than those of China and the global average. These scores aligned well with objective facts to a certain extent, as previously mentioned, Dalian indeed excelled in CW, the proportion of the coastal area exhibiting excellent or good water quality exceeded the average of China (85.0%) by 14.1% in 2023 (Ministry of Ecology and Environment of the People's Republic of China (MEE), 2023). Moreover, the development of marine engineering equipment industry was in a leading position in China (The People's Government Of Liaoning Province (LNPG), 2024). However, it should be noted that due to the use of different parameters and reference points in the calculations, the comparability of the evaluation results could only serve as a reference to a certain extent.
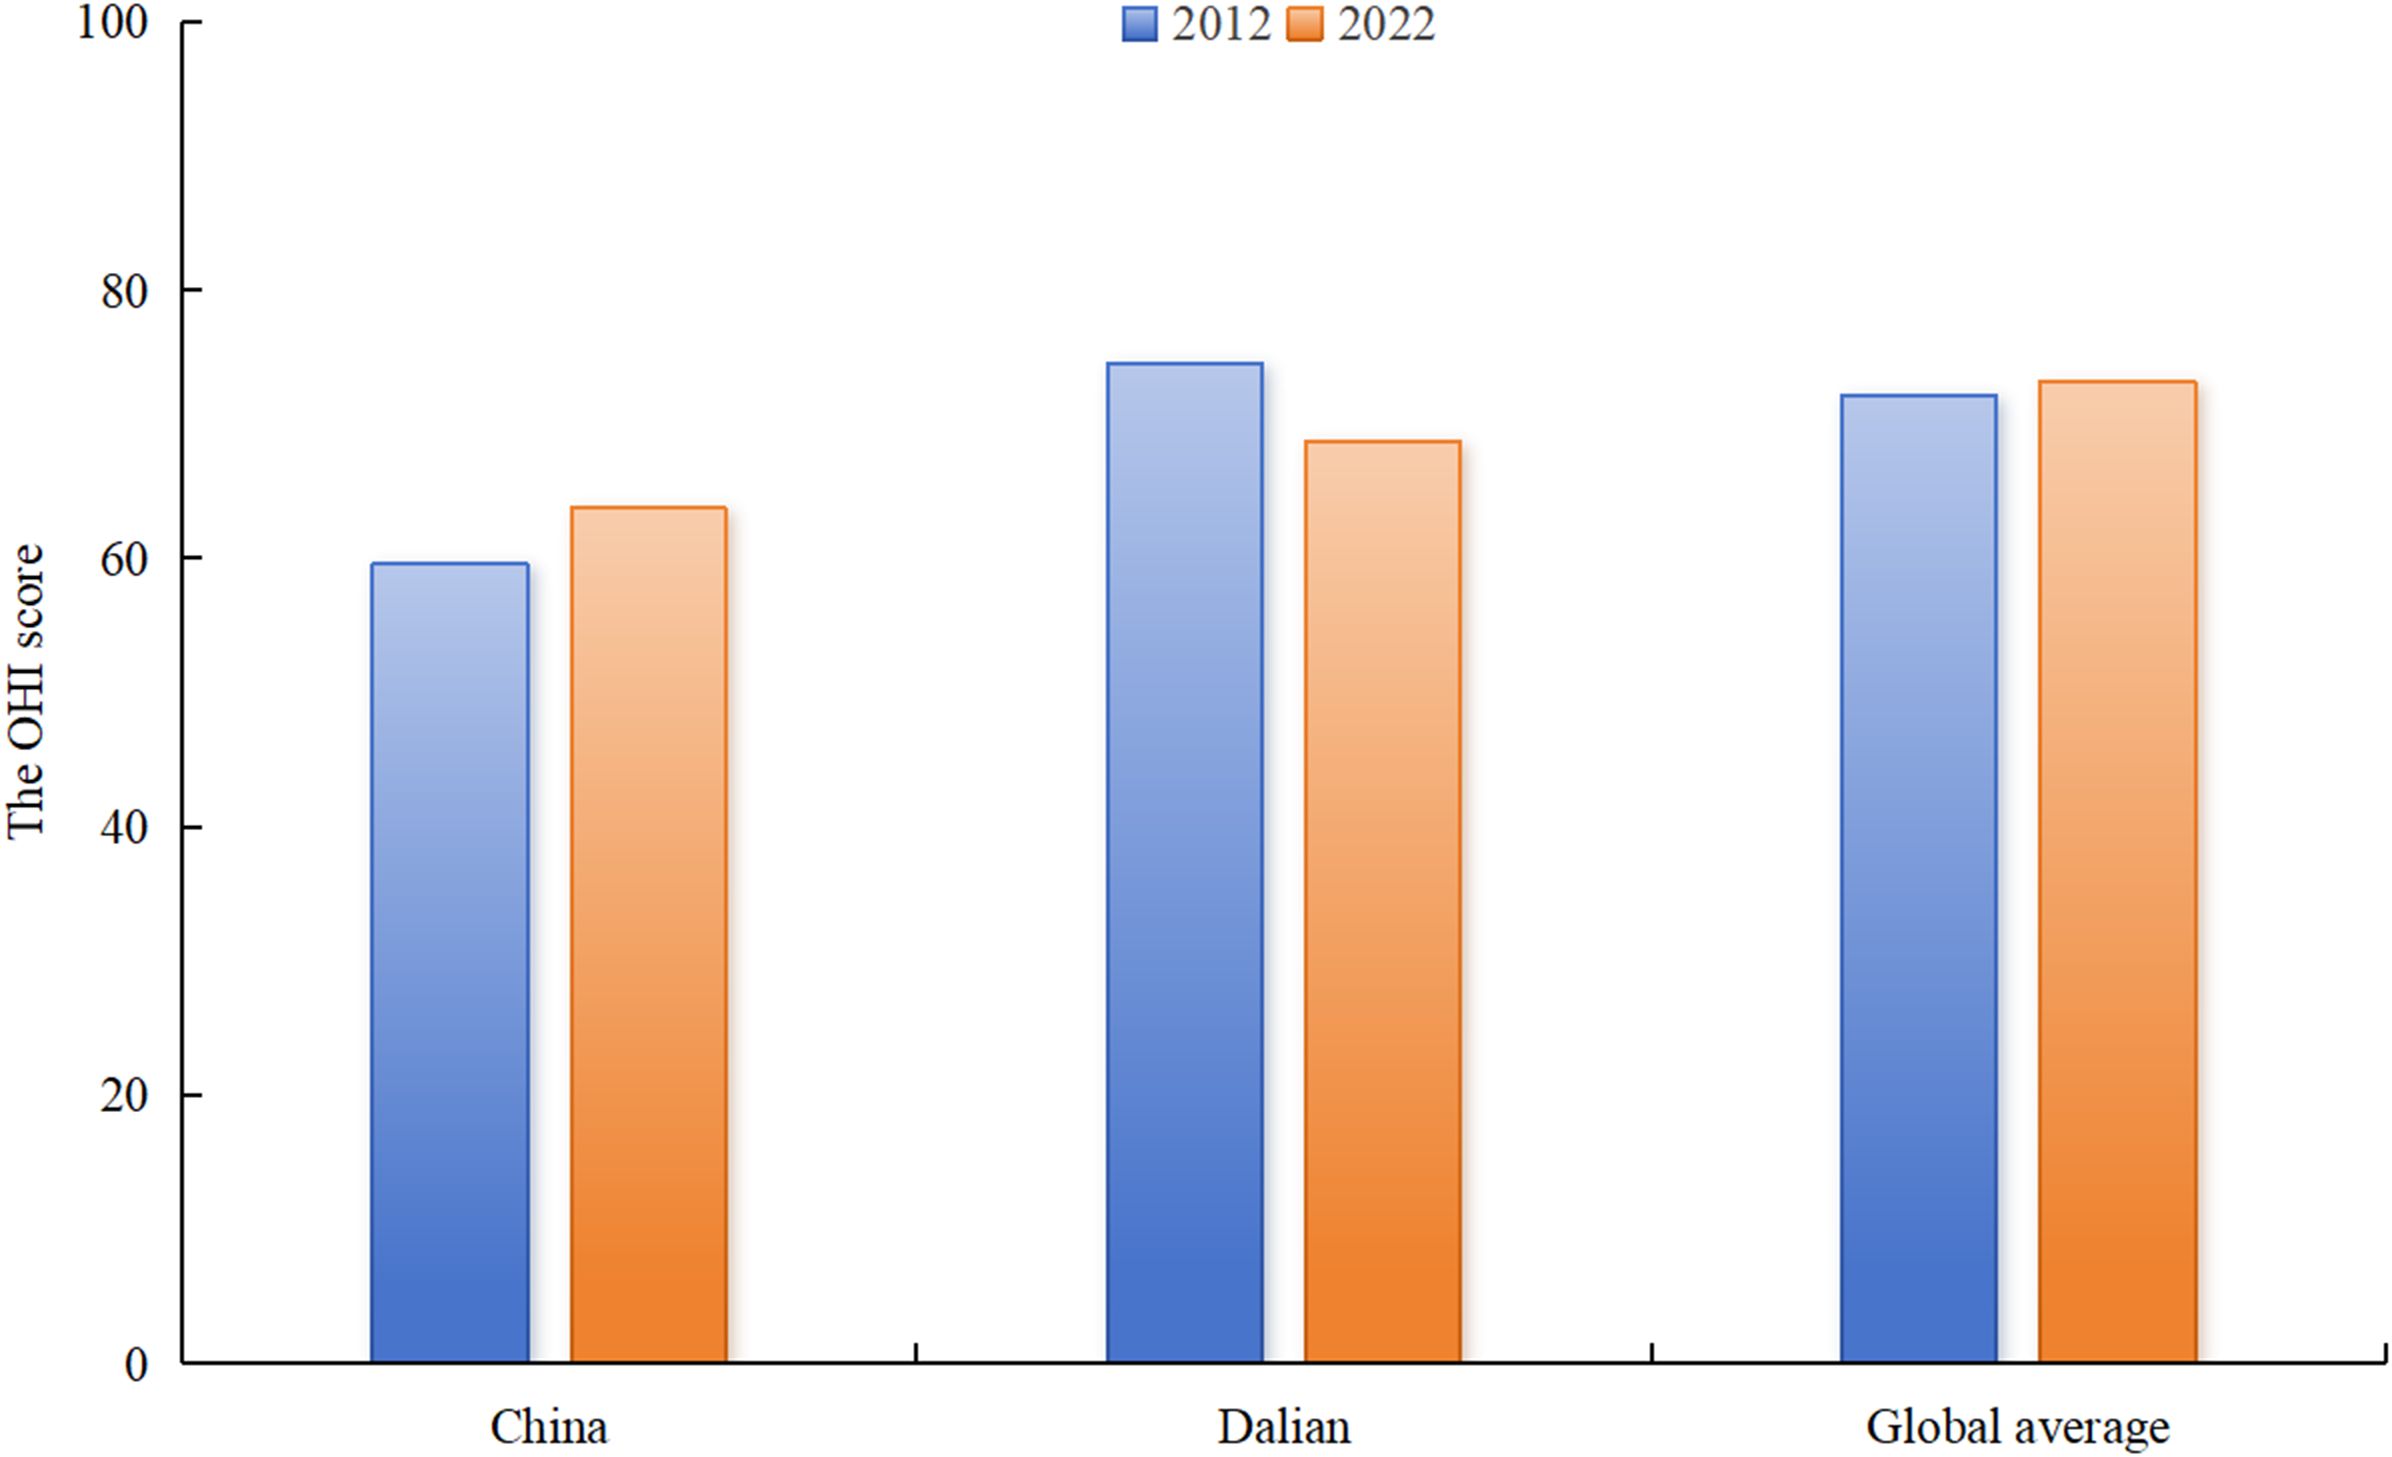
Figure 4. Comparison of the OHI scores of Dalian with those of China and the global average.
In using the OHI, we, along with other scholars, appreciated its flexibility and adaptability. Here, we found it useful to evaluate the ocean health status not only of a country but also of a province, a region, or even a city. Our work demonstrated the use and value in looking more closely at local trends within the larger picture. However, precisely because of our experience, we had identified areas for improvement or special attention in the application of the OHI.
The index comprised 10 goals and several sub-goals, alternative parameters reflecting the goal could be used when certain data are difficult to obtain. In this study, for the evaluation of NP, we only utilized sea salt data due to the lack of data such as marine chemistry and marine bio-pharmaceuticals. Similarly, for CP, given the inability to access official habitat area and status data, we used the data of coastal wetland area and natural shoreline retention rate sourced from various literature and even official news reports as substitutes. This flexibility broadened the index’s applicability, making it suitable for various levels, including national, city, and even smaller regional scales, and providing decision-making suggestions for protecting ocean health, which was the primary purpose of using the OHI index.
However, such flexibility and applicability introduced the issue of comparability. While this might be less of a concern, it became a problem at other regional levels, primarily due to the difficulty in obtaining data, leading to the selection of different alternative parameters. For instance, the choices of parameters varied from one another in the from other regions in China (Ma et al., 2016; Wu et al., 2021; Zheng and You, 2013). When different standards for parameter used, comparisons between assessment results became impossible. Differences in indicators used or substitution of missing data with adjacent years’ data for a particular goal across different regions could all hinder comparability. Furthermore, variations in data acquisition channels prevented comparisons between assessment results. Most of the data in this paper were from statistical yearbooks or official reports, with a minority sourced from literature. We believed that relying on official channels for data ensured reliability and consistency, and strongly indicated the importance of these resources being robust and trustworthy. If sourced from literature, data calculated using different measurement or computation methods by different scholars cannot guarantee comparability.
It was undeniable that the OHI was a good indicator for assessing ocean health status and providing valuable direction for marine conservation efforts to a certain extent. However, based on our experience, when using it as a management tool among cities within a country, the parameters and reference points should be unified to ensure comparability of results and conclusions. When used solely at the regional level, we recommended prioritizing official data in calculating the OHI index. Additionally, provided that high-quality data were accessible, special indicators reflecting regional characteristics could be appropriately added to enhance the comprehensiveness of the evaluation.
Yet these recommendations rest on the quality, consistency, and reliability of official data resources. Moreover, we all know that protecting the ocean is a long-term commitment, further indicating the importance of maintaining information over time as well. To effectively evaluate ocean health status and better guide conservation efforts, it was recommended that governments strengthen ocean monitoring, standardize indicators and monitoring evaluation criteria to ensure data continuity and accuracy, and improve evaluation precision, thereby providing precise support for marine ecological environmental protection and management.
5 Conclusion
The OHI had established a systematic suite of indicators that quantitatively assess ocean health, thereby facilitating enhanced protection of marine ecosystems and achieving sustainable ocean development. Widely employed in global ocean health assessments, the OHI had been complemented in this study through its application at the city-level in China, presenting the first assessment of Dalian between 2012 and 2022, a pivotal coastal city in northern China. It was believed that the results reflected the changing trend of marine health status in Dalian to a certain degree. Although the condition of sea water continued to maintain a high level, marine health condition decreased (OHI decreased by 5.81) over the past decade in Dalian. The economic development was robust and stable, with gradually increasing in its seafood acquisition. Moving forward, emphasis should be placed on coastal zone protection and the revitalization of the tourism industry. Additionally, greater support and efficient management should be provided to the traditional fishing industry.
Data availability statement
The original contributions presented in the study are included in the article/Supplementary Material. Further inquiries can be directed to the corresponding author.
Author contributions
XW: Conceptualization, Funding acquisition, Methodology, Writing – original draft, Writing – review & editing. YW: Formal analysis, Methodology, Writing – original draft, Writing – review & editing. HW: Conceptualization, Methodology, Writing – original draft, Writing – review & editing. JF: Formal analysis, Writing – original draft, Writing – review & editing. ML: Conceptualization, Methodology, Writing – original draft, Writing – review & editing. WH: Conceptualization, Methodology, Writing – original draft, Writing – review & editing.
Funding
The author(s) declare that financial support was received for the research and/or publication of this article. This work was supported by Dalian’s Implementation Plan for Innovative Support Policies of Scientific and Technological Talents: Outstanding Young Scientific and Technological Talents (2022RY19) and the National Natural Science Foundation of China (Grant No. 42106155).
Conflict of interest
The authors declare that the research was conducted in the absence of any commercial or financial relationships that could be construed as a potential conflict of interest.
Generative AI statement
The author(s) declare that no Generative AI was used in the creation of this manuscript.
Publisher’s note
All claims expressed in this article are solely those of the authors and do not necessarily represent those of their affiliated organizations, or those of the publisher, the editors and the reviewers. Any product that may be evaluated in this article, or claim that may be made by its manufacturer, is not guaranteed or endorsed by the publisher.
Supplementary material
The Supplementary Material for this article can be found online at: https://www.frontiersin.org/articles/10.3389/fmars.2025.1532468/full#supplementary-material
References
Bailey H., Brookes K. L., and Thompson P. M. (2014). Assessing environmental impacts of offshore wind farms: lessons learned and recommendations for the future. Aquat. Biosyst. 10, 1–13. doi: 10.1186/2046-9063-10-8
Barange M., Bahri T., Beveridge M. C., Cochrane K. L., Funge-Smith S., and Poulain F. (2018). Impacts of climate change on fisheries and aquaculture. United Nations’ Food Agric. Organ. 12, 628–635.
Barragán J. M. and de Andrés M. (2015). Analysis and trends of the world’s coastal cities and agglomerations. Ocean. Coast. Manage. 114, 11–20. doi: 10.1016/j.ocecoaman.2015.06.004
Bindoff N. L., Willebrand J., Artale V., Cazenave A., Gregory J. M., Gulev S., et al. (2007). “Observations: oceanic climate change and sea level,” in Climate change 2007: the physical science basis. Contribution of Working Group I (Cambridge University Press, Cambridge), 385–428.
Blenckner T., Möllmann C., Stewart Lowndes J., Griffiths J. R., Campbell E., De Cervo A., et al. (2021). The Baltic health index (BHI): Assessing the social–Ecological status of the Baltic Sea. People Nat. 3, 359–375. doi: 10.1002/pan3.10178
Borja A., Bricker S. B., Dauer D. M., Demetriades N. T., Ferreira J. G., Forbes A. T., et al. (2008). Overview of integrative tools and methods in assessing ecological integrity in estuarine and coastal systems worldwide. Mar. Pollut. Bull. 56, 1519–1537. doi: 10.1016/j.marpolbul.2008.07.005
Borja Á., Dauer D. M., and Grémare A. (2012). The importance of setting targets and reference conditions in assessing marine ecosystem quality. Ecol. Indic. 12, 1–7. doi: 10.1016/j.ecolind.2011.06.018
Bureau of Statistics of Dalian (BSD) (2021). Dalian statistical yearbook 2021 (China Statistics Press). Available online at: https://stats.dl.gov.cn/module/download/downfile.jsp?classid=0&showname=2021tjnj.pdf&filename=2409291553034245.pdf.
Bureau of Statistics of Dalian (BSD) (2023). Dalian statistical yearbook 2023 (China Statistics Press). Available online at: https://stats.dl.gov.cn/module/download/downfile.jsp?classid=0&showname=%E5%A4%A7%E8%BF%9E%E7%BB%9F%E8%AE%A1%E5%B9%B42023.pdf&filename=2402020934319104.pdf.
Cochard R., Ranamukhaarachchi S. L., Shivakoti G. P., Shipin O. V., Edwards P. J., and Seeland K. T. (2008). The 2004 tsunami in Aceh and Southern Thailand: a review on coastal ecosystems, wave hazards and vulnerability. Perspect. Plant Ecol. 10, 3–40. doi: 10.1016/j.ppees.2007.11.001
Costanza R., De Groot R., Sutton P., van der Ploeg S., Anderson S. J., Kubiszewski I., et al. (2014). Changes in the global value of ecosystem services. Global. Environ. Change 26, 152–158. doi: 10.1016/j.gloenvcha.2014.04.002
Costello M. J., Coll M., Danovaro R., Halpin P., Ojaveer H., and Miloslavich P. (2010). A census of marine biodiversity knowledge, resources, and future challenges. PloS One 5, e12110. doi: 10.1371/journal.pone.0012110
Dalian Municipal Ecology and Environment Bureau (DMEEB) (2023). Dalian ecology and environment statement 2023. Available online at: https://mp.weixin.qq.com/s?__biz=MzI4ODIyODU2OA==&mid=2247642931&idx=1&sn=fc338fc4b7d927592bd7c651f60e5eb7&chksm=ea6b253df177d0b9d619516f57e84e0cba81fe813955f98606cd3f24d42cd530b64ae742bfab&scene=27.
Dalian Natural Resources Bureau (DNRB) (2022). Reply to the proposal of the first session of the fourteenth municipal people’s political consultative conference on strengthening marine ecological protection and restoration and promoting beautiful bay construction (No. 0015). Available online at: https://zrzy.dl.gov.cn/art/2022/7/11/art_7935_2033204.html (Accessed March 25, 2025).
Dalian Natural Resources Bureau (DNRB) (2024). Reply to the proposal of the third session of the fourteenth municipal people’s political consultative conference on further strengthening the construction and protection of coastal characteristic urban wetland parks in dalian (No. 0300). Available online at: https://zrzy.dl.gov.cn/art/2024/7/1/art_10110_2339348.html (Accessed March 25, 2025).
Dalian Ocean Development Bureau (DODB) (2024). Reply to the proposal of the third session of the fourteenth municipal people’s political consultative conference on strengthening coastline protection, remediation and restoration to create a beautiful seaside scenic line in dalian (No. 0060). Available online at: https://hyfz.dl.gov.cn/art/2024/7/11/art_9940_2339704.html (Accessed March 25, 2025).
Doney S. C., Fabry V. J., Feely R. A., and Kleypas J. A. (2009). Ocean acidification: the other CO2 problem. Annu. Rev. Mar. Sci. 1, 169–192. doi: 10.1146/annurev.marine.010908.163834
Duarte C. M., Agusti S., Barbier E., Britten G. L., Castilla J. C., Gattuso J. P., et al. (2020). Rebuilding marine life. Nature 580, 39–51. doi: 10.1038/s41586-020-2146-7
Elfes C. T., Longo C., Halpern B. S., Hardy D., Scarborough C., Best B. D., et al. (2014). A regional-scale ocean health index for Brazil. PloS One 9, e92589. doi: 10.1371/journal.pone.0092589
European Commission (2023). The EU blue economy report 2023 (Luxembourg: Publications Office of the European Union).
Food and Agriculture Organization of the United Nations (FAO) (2022). The state of world fisheries and aquaculture 2022. Towards blue transformation (Rome: FAO). doi: 10.4060/cc0461en
Guyader O., Berthou P., Koutsikopoulos C., Alban F., Demaneche S., Gaspar M. B., et al. (2013). Small scale fisheries in Europe: A comparative analysis based on a selection of case studies. Fish. Res. 140, 1–13. doi: 10.1016/j.fishres.2012.11.008
Halpern B. S. (2020). Building on a decade of the ocean health index. One Earth 2, 30–33. doi: 10.1016/j.oneear.2019.12.011
Halpern B. S., Longo C., Hardy D., McLeod K. L., Samhouri J. F., Katona S. K., et al. (2012). An index to assess the health and benefits of the global ocean. Nature 488, 615–620. doi: 10.1038/nature11397
Halpern B. S., Walbridge S., Selkoe K. A., Kappel C. V., Micheli F., d’Agrosa C., et al. (2008). A global map of human impact on marine ecosystems. Science 319, 948–952. doi: 10.1126/science.1149345
Intergovernmental Panel on Climate Change (IPCC) (2019). Special report on the ocean and cryosphere in a changing climate (IPCC). Available online at: https://www.ipcc.ch/srocc/.
Le Quéré C., Andrew R. M., Friedlingstein P., Sitch S., Hauck J., Pongratz J., et al. (2018). Global carbon budget 2018. Earth. Syst. Sci. Data. 10, 2141–2194. doi: 10.5194/essd-10-2141-2018
Levitus S., Antonov J. I., Boyer T. P., Baranova O. K., Garcia H. E., Locarnini R. A., et al. (2012). World ocean heat content and thermosteric sea level change (0–2000 m), 1955–2010. Geophys Res. Lett. 39, L10603. doi: 10.1029/2012GL051106
Li F., Ding D., Chen Z., Chen H., Shen T., Wu Q., et al. (2020). Change of sea reclamation and the sea-use management policy system in China. Mar. Policy. 115, 103861. doi: 10.1016/j.marpol.2020.103861
Liu Y., Duan L., Xie P., Liu C., and Lei W. (2017). Managing and protecting countermeasures of coastal wetlands based on its current situation in dalian. Ocean Dev. Manage. 11, 54–60.
Lloret J., Cowx I. G., Cabral H., Castro M., Font T., Gonçalves J. M., et al. (2018). Small-scale coastal fisheries in European Seas are not what they were: ecological, social and economic changes. Mar. Policy. 98, 176–186. doi: 10.1016/j.marpol.2016.11.007
Longo C. S., Frazier M., Doney S. C., Rheuban J. E., Humberstone J. M., and Halpern B. S. (2017). Using the ocean health index to identify opportunities and challenges to improving Southern Ocean ecosystem health. Front. Mar. Sci. 4. doi: 10.3389/fmars.2017.00020
Ma D., Fang Q., and Liao S. (2016). Applying the Ocean Health Index framework to the city level: A case study of Xiamen, China. Ecol. Indic. 66, 281–290. doi: 10.1016/j.ecolind.2016.01.034
Ministry of Ecology and Environment of the People's Republic of China (MEE) (2023). Bulletin of Marine Ecology and Environment Status of China. Available online at: http://english.mee.gov.cn/Resources/Reports/bomeaesoc/202410/P020241031366042359372.pdf.
Ministry of Agriculture and Rural Affairs of the People's Republic of china (MARA) (2016). The ministry of agriculture’s guidelines for accelerating the transformation and adjustment of fisheries structures. Available online at: https://www.gov.cn/zhengce/2016-05/22/content_5075683.htm (Accessed March 25, 2025).
Ministry of Agriculture and Rural Affairs of the People's Republic of china (MARA) (2023). Striving for the sea: dalian, focuses on developing the marine economy. Available online at: https://www.moa.gov.cn/gk/zcfg/qnhnzc/201605/t20160506_5120615.htm (Accessed March 25, 2025).
National Bureau of Statistics of China (NBSC) (2022). China statistical yearbook 2022 (China Statistics Press). Available online at: https://www.stats.gov.cn/sj/ndsj/2022/indexch.htm
Ocean Health Index (2023). Global scores. Available online at: https://oceanhealthindex.org/global-scores/ (Accessed March 25, 2025).
Pendleton L. H., Thébaud O., Mongruel R. C., and Levrel H. (2016). Has the value of global marine and coastal ecosystem services changed? Mar. Policy. 64, 156–158. doi: 10.1016/j.marpol.2015.11.018
People’s Daily (2024). Dalian is focusing on developing the marine economy. Available online at: http://paper.people.com.cn/rmrb/html/2024-08/06/nw.D110000renmrb_20240806_5-01.htm (Accessed March 25, 2025).
Poloczanska E. S., Brown C. J., Sydeman W. J., Kiessling W., Schoeman D. S., Moore P. J., et al. (2013). Global imprint of climate change on marine life. Nat. Clim. Change. 3, 919–925. doi: 10.1038/nclimate1958
Reyjol Y., Argillier C., Bonne W., Borja A., Buijse A. D., Cardoso A. C., et al. (2014). Assessing the ecological status in the context of the European Water Framework Directive: where do we go now? Sci. Total. Environ. 497, 332–344. doi: 10.1016/j.scitotenv.2014.07.119
Riebesell U. and Gattuso J. P. (2015). Lessons learned from ocean acidification research. Nat. Clim. Change. 5, 12–14. doi: 10.1038/nclimate2456
Selig E. R., Frazier M., O’Leary J. K., Jupiter S. D., Halpern B. S., Longo C., et al. (2015). Measuring indicators of ocean health for an island nation: The ocean health index for Fiji. Ecosyst. Serv. 16, .403–.412. doi: 10.1016/j.ecoser.2014.11.007
Shams S., Prasad D. R., Imteaz M. A., Khan M. M. H., Ahsan A., and Karim M. R. (2023). An assessment of environmental impact on offshore decommissioning of oil and gas pipelines. Environments 10, 104. doi: 10.3390/environments10060104
Shao L. (2023). Create a liaoning (Dalian) marine carbon sink trading platform to boost high-quality development of the marine economy (Dalian, China: Dalian Daily). Available at: https://ocean.cctv.com/2023/04/28/ARTIKfxuhoGxZ0Iins9JDPzH230428.shtml (Accessed March 25, 2025).
Škare M., Soriano D. R., and Porada-Rochoń M. (2021). Impact of COVID-19 on the travel and tourism industry. Technological forecasting Soc. Change 163, 120469. doi: 10.1016/j.techfore.2020.120469
Stocker T.F., Qin D., Plattner G.-K., Tignor M., Allen S.K., Boschung J., A., et al (2013). IPCC, 2013: Climate Change 2013: The Physical Science Basis. Contribution of Working Group I to the Fifth Assessment Report of the Intergovernmental Panel on Climate Change (Cambridge, United Kingdom and New York, NY, USA: Cambridge University Press), 1535 pp. Available online at: https://www.ipcc.ch/site/assets/uploads/2017/09/WG1AR5_Frontmatter_FINAL.pdf.
The People’s Government of Dalian Municipality (DMPG) (2023a). Reply to the proposal no. 0485 of the third session of the thirteenth chinese people’s political consultative conference committee on strengthening the management of large-displacement fishing vessels entering the closed fishing area of zhangzi island town, changdao county, dalian, from xingshuitun and other places. Available online at: https://www.dl.gov.cn/art/2023/9/8/art_8768_2193368.html (Accessed March 25, 2025).
The People’s Government of Dalian Municipality (DMPG) (2023b). 19.1146 million tourists came to Dalian for leisure and vacation in August. Available online at: https://www.dl.gov.cn/art/2023/9/8/art_1185_2193324.html (Accessed March 25, 2025).
The People’s Government of Dalian Municipality (DMPG) (2024a). Natural resources. Available online at: https://www.dl.gov.cn/art/2021/2/8/art_3556_525647.html (Accessed March 25, 2025).
The People’s Government of Dalian Municipality (DMPG) (2024b). Dalian Municipal Ecology and Environment Bureau has been committing to prioritizing ecology and harmonious coexistence between humans and the sea, treating ecological protection as the bottom line for the development of the marine economy. Available online at: https://www.dl.gov.cn/art/2024/8/23/art_2555_2347191.html (Accessed March 25, 2025).
The People’s Government of Dalian Municipality (DMPG) (2024c). Navigating maritime power, pioneering new horizons. Available online at: https://www.dl.gov.cn/art/2024/12/27/art_11240_2394037.html.
The People’s Government of Dalian Municipality (DMPG) (2024d). The cultural atmosphere is strong in various scenic spots of Dalian during the Dragon Boat Festival holiday. Available online at: https://www.dl.gov.cn/art/2024/6/12/art_8718_2333760.html (Accessed March 25, 2025).
The People’s Government Of Liaoning Province (LNPG) (2024). Dalian: Seize market opportunities and continuously optimize layout to promote high-quality development of the marine economy. Available online at: https://www.ln.gov.cn/web/ywdt/qsgd/ass_2_1/2024081308583441032/index.shtml (Accessed March 25, 2025).
United Nations (UN) (2015). The first global integrated marine assessment: world ocean assessment I (Cambridge University Press). Available online at: https://www.un.org/regularprocess/ar/content/first-world-ocean-assessment.
United Nations (UN) (2021). The second world ocean assessment (Cambridge University Press). Available online at: https://www.un.org/regularprocess/ar/woa2.
United Nations World Tourism Organization (UNWTO) (2023). International Tourism Highlights: the impact of COVlD-19 on tourism, (2020-2022), 2023 Edition. Available online at: https://www.e-unwto.org/doi/epdf/10.18111/9789284424986.
Vo T. D. and Tran M. D. (2021). The impact of covid-19 pandemic on the global trade. Int. J. Soc. Sci. Economics Invention 7, 1–7. doi: 10.23958/ijssei/vol07-i01/261
Wang P., Lin X., Zhang P., and Yu Y. (2018). Renovation of dalian coastal line based on natural coastal line preservation rate. Ocean Dev. Manage. 35, 47–51.
Wen Q. (2019). Research on the applicability of ocean health index in China (Beijing: Science Press).
World Meteorological Organization WMO (2021). State of the global climate 2020. Available online at: https://library.wmo.int/viewer/56247/download?file=1264_Statement_2020_en.pdf&type=pdf&navigator=1.
Worm B., Barbier E. B., Beaumont N., Duffy J. E., Folke C., Halpern B. S., et al. (2006). Impacts of biodiversity loss on ocean ecosystem services. Science 314, 787–790. doi: 10.1126/science.1132294
Wu Z., Chen R., Meadows M. E., and Liu X. (2021). Application of the Ocean Health Index to assess ecosystem health for the coastal areas of Shanghai, China. Ecol. Indic. 126, 107650. doi: 10.1016/j.ecolind.2021.107650
Yan H. F., Kyne P. M., Jabado R. W., Leeney R. H., Davidson L. N., Derrick D. H., et al. (2021). Overfishing and habitat loss drive range contraction of iconic marine fishes to near extinction. Sci. Adv. 7, eabb6026. doi: 10.1126/sciadv.abb6026
Zhang J., Cui Y., Zhang S., Liu Y., Deng L., and Zhang P. (2016). Analysis of coastal wetland status of Dalian city. Adv. Environ. Prot. 6, 85–91. doi: 10.12677/AEP.2016.65012
Zhao X. and Jia P. (2020). Towards sustainable small-scale fisheries in China: a case study of Hainan. Mar. Policy. 121, 103935. doi: 10.1016/j.marpol.2020.103935
Zheng F., Qiu G., Fan H., and Zhang W. (2013). Diversity, distribution and conservation of Chinese seagrass species. Biodiversity Sci. 21, 517–526.
Zheng T. and You X. Y. (2013). Assessment of marine ecosystem health of Tianjin Offshore, China. Oceanol. Hydrobiol St. 42, 442–450. doi: 10.2478/s13545-013-0100-0
Keywords: marine health assessment, Ocean Health Index, Dalian, city-level marine health, a decade-long perspective
Citation: Wang X, Wang Y, Wang H, Fan J, Li M and Hao W (2025) A decade-long perspective on marine health changes in Dalian, China. Front. Mar. Sci. 12:1532468. doi: 10.3389/fmars.2025.1532468
Received: 22 November 2024; Accepted: 02 May 2025;
Published: 29 May 2025.
Edited by:
Randi D. Rotjan, Boston University, United StatesReviewed by:
Dietriech Geoffrey Bengen, IPB University, IndonesiaEmily S. Klein, Pew Charitable Trusts, United States
Copyright © 2025 Wang, Wang, Wang, Fan, Li and Hao. This is an open-access article distributed under the terms of the Creative Commons Attribution License (CC BY). The use, distribution or reproduction in other forums is permitted, provided the original author(s) and the copyright owner(s) are credited and that the original publication in this journal is cited, in accordance with accepted academic practice. No use, distribution or reproduction is permitted which does not comply with these terms.
*Correspondence: Haining Wang, aG53YW5nQG5tZW1jLm9yZy5jbg==