 Bergur Olsen1
 Tycho Anker-Nilssen2
 Jóhannis Danielsen1
 Eilif Gaard1
 Leivur Janus Hansen3
 Sólvá Jacobsen1Jens-Kjeld Jensen4
 Regin Olsen1
 Ian Salter1
 Hjálmar Hátún1*
- 1Faroe Marine Research Institute, Tórshavn, Faroe Islands
- 2Norwegian Institute for Nature Research, Trondheim, Norway
- 3Faroe Islands National Museum, Hoyvík, Faroe Islands
- 4Independent Researcher, Nólsoy, Faroe Islands
The Faroe Shelf, located on the North Atlantic’s Iceland-Scotland ridge, has historically hosted a rich ecosystem with large seabird populations. However, substantial declines in their population sizes have been observed over the past half century. This study introduces and documents comprehensive decades-long data series from 1972-present on offspring production and adult attendance of four seabird species, the common guillemot, Atlantic puffin, black-legged kittiwake, and Arctic tern, breeding in major colonies in the Faroe Islands. Results show that the highly variable productivity of these seabirds is characterized by marked and synchronized peaks at 5- to 10-years intervals, and these peaks closely mirror indices of primary production and availability of pelagic juvenile fish on the Faroe shelf. These ecological signals are examined in the context of oceanographic changes in the subpolar North Atlantic Ocean, and we argue that the presented seabird series can serve as indicators to enhance the understanding of the Faroe shelf ecosystem and inform the management of both seabird populations and commercial fish stocks.
1 Introduction
Seabirds serve as reliable and cost-efficient indicators of marine ecosystem health, as they feed across multiple trophic levels and habitats from coastal areas to open ocean (Durant et al., 2009; Piatt and Sydeman, 2007). While the Northeast Atlantic hosts significant seabird populations, many have declined over recent decades due to various pressures (Croxall et al., 2012; Davies et al., 2021; Dias et al., 2019; Paleczny et al., 2015; OSPAR, 2023).
Seabird population dynamics are primarily driven by adult mortality and reproductive success, despite variable immigration and emigration rates (Coulson, 2016). As long-lived species with limited annual reproduction, many seabirds prioritize survival over breeding success (Stearns, 1992), making their reproductive performance a sensitive indicator of environmental conditions (Piatt and Sydeman, 2007; Ricklefs, 1990). While breeding success primarily reflects local food availability (Croxall, 1987; Fayet et al., 2021), it can also indicate non-breeding period conditions, via ‘carry-over effects’ (Harris et al., 2020; Keogan et al., 2022; Layton-Matthews et al., 2023). Oceanic winter/spring conditions do, furthermore, strongly influence the survival of adults (Frederiksen et al., 2004; Harris et al., 2005).
The Faroe Islands, located on the north-eastern rim of the North Atlantic (Figure 1) historically supported rich colonies of iconic seabird species (Nørrevang, 1977) with population sizes varying through the centuries (Reinert, 1976). For the Faroese people, seabirds have great recreational value, and species such as the common guillemot (Uria aalge, hereafter guillemot) and Atlantic puffin (Fratercula arctica, hereafter puffin) have traditionally been an important food resource (Nørrevang, 1977). The guillemot population was particularly high in the 1940s and early 1950s, but experienced a gradual decline in the late 1950s, culminating in a rapid drop around 1964 (Olsen, 1990). In response, regular monitoring of guillemots started in the 1970s and was expanded to include black-legged kittiwakes (Rissa tridactyla, hereafter kittiwakes) in the 1980s, but results from these surveys have been largely unreported and only occasionally used in ecological research. Exceptions include a paper linking the attendance of guillemots to variability in the local primary production (Gaard et al., 2002), and one that compares breeding success of kittiwakes in the Faroe Islands with indicator records for the highly variable primary production and production of juvenile fish on the Faroe shelf (Eliasen et al., 2011; Jacobsen et al., 2019). The declining trends in seabird populations hampered harvesting in the Faroe Islands, and to prevent overexploitation, guillemot harvesting has since 1980 been legally restricted to the winter months (Løgtingslóg Nr. 43, logir.fo). Similarly, during the late 1980s, the puffin population experienced a notable reduction. The number of puffins attending the Faroese colonies increased again in the mid-1990s, but from 2002 onwards there was again a sharp decrease in puffin attendance, which led to a halt in hunting activities, and since then the hunting has not continued to the same extent as before (Jensen, 2010; Jensen and Olsen, 2020).
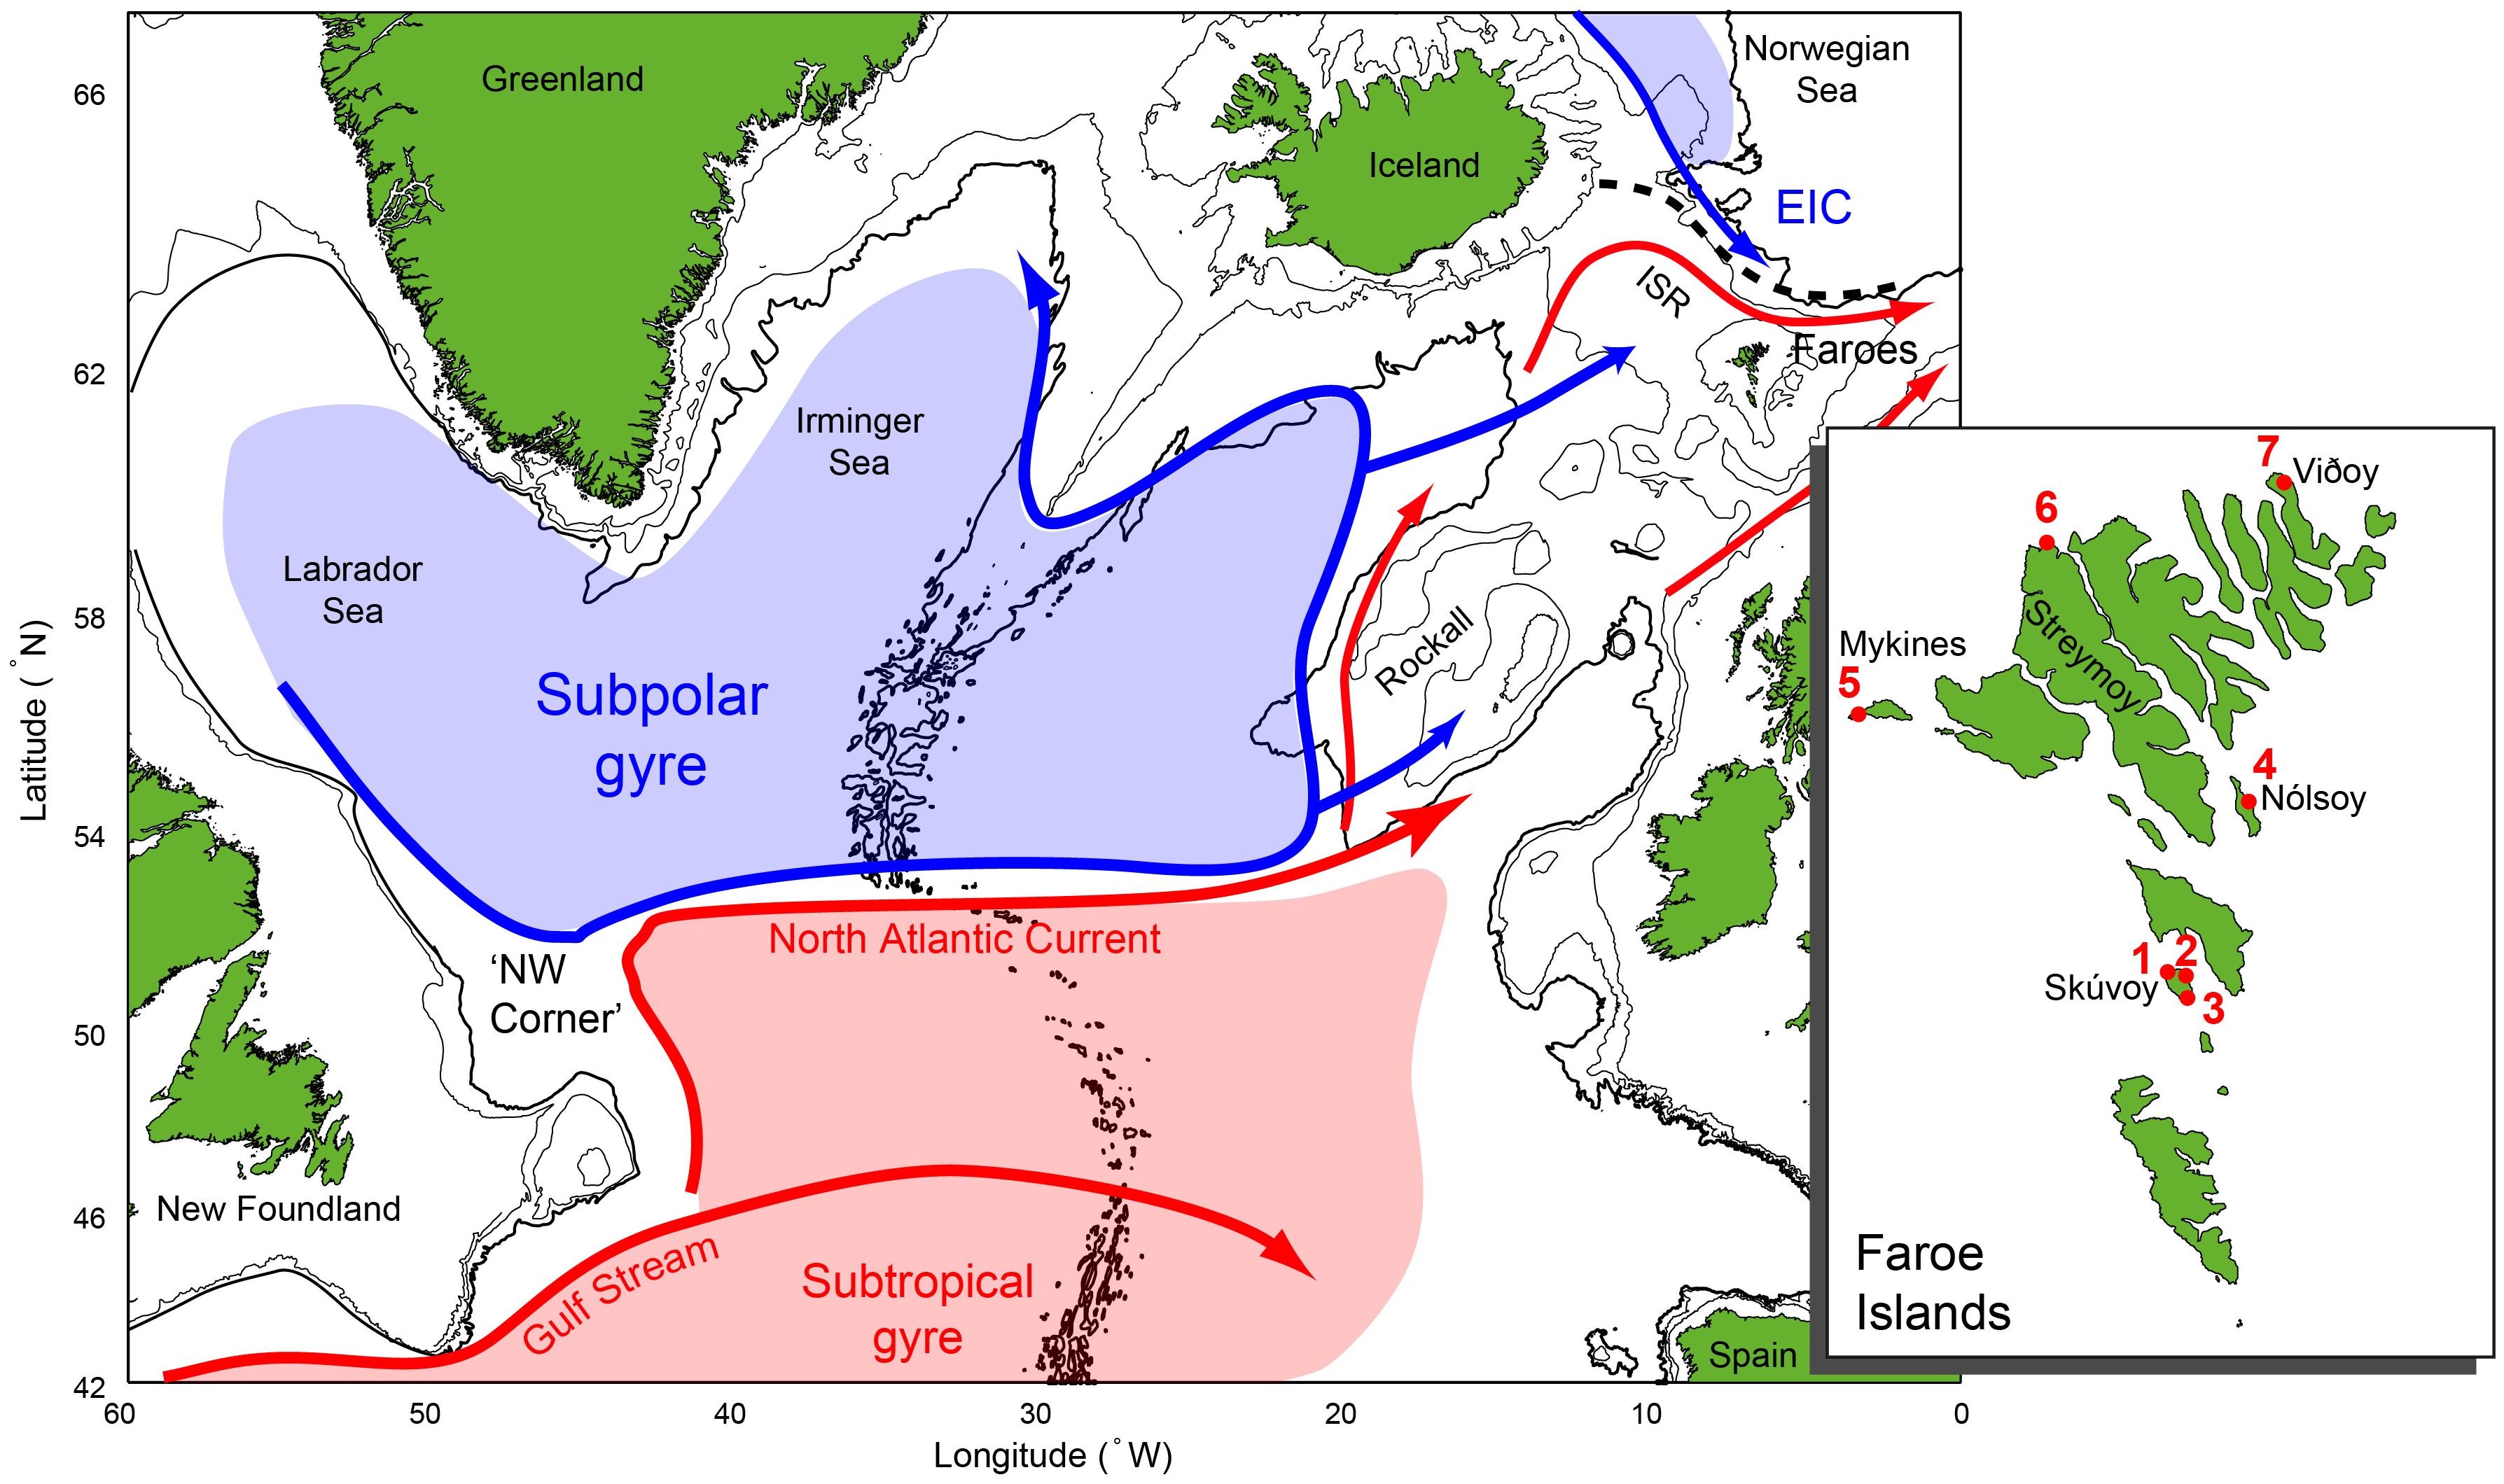
Figure 1. An oceanographic overview over the subpolar North Atlantic (SPNA). Subarctic currents and water masses are shown with blue arrows and shading, while the warmer Atlantic counterpart is shown in red colors. EIC: East Icelandic Current, ISR: Iceland-Scotland Ridge. The insert shows the three seabird monitoring sites in the Faroe Islands (1,2 and 5) and four puffin fowling places (3,4, 6 and 7): 1), Høvdin in Skúvoy, 2) Byrgisbakki in Skúvoy, 3) Bergið in Skúvoy, 4) Urðin in Nólsoy, 5) Lamba and Dalurin in Mykines, 6) Tjørnuvíksstakkur in Streymoy and 7) Settorva in Viðoy.
The marine climate surrounding the Faroe Shelf is to a large extent regulated by the strength of the subpolar gyre (SPG), a large counterclockwise rotating body of nutrient-rich and zooplankton-rich subarctic water (Hátún et al., 2009, 2005). Like many other seabird species in the subpolar North Atlantic (SPNA), Faroese kittiwakes have been shown to spend their winters in vicinity of the SPG (Frederiksen et al., 2012), and the breeding success of Faroese kittiwakes has been linked to the dynamics of this important gyre (Hátún et al., 2017b). Conspicuously, the decline in many Faroese seabird colonies over the last several decades resembles the observed decline in seabird colonies throughout the SPNA, especially along the Norwegian coast and in Vestmannaeyjar in southwest Iceland (Barrett et al., 2006; Brun, 1979; Fauchald et al., 2015; Hansen et al., 2021). This indicates that the population dynamics may be affected not only by local conditions, but also large-scale processes.
The spatially confined Faroe shelf facilitates detailed observations of key ecosystem components, and the Faroe Marine Research Institute (FAMRI) has established and maintained over decades a wide range of valuable time series indicating key aspects of the marine climatology, biogeochemistry, phyto- and zooplankton communities, fish stocks, seabirds and marine mammals in this ecosystem. Recurring peaks in the productivity of several trophic levels on the Faroe shelf have been linked to similar fluctuations in the local primary production (Gaard et al., 2002; Jacobsen et al., 2019; Steingrund and Gaard, 2005). However, longer-term ecological changes and marked shifts, e.g. a stock collapses of Faroe Plateau cod (Gadus morhua) in the late 1980s and early 2000s (ICES, 2023), cannot be explained directly by the current productivity indices of lower trophic levels (Gaard et al., 1998; Jacobsen et al., 2019).
The changing conditions and long-term fluctuations of the Faroe shelf ecosystem make the future of its seabird colonies uncertain. Indicators of seabird performance can therefore act as much needed early warning signals and facilitate the identification and implementation of mitigating management actions. In this perspective, the main objectives of this paper are to: i) introduce and firmly document novel seabird indicator records of four native seabird species, i.e. guillemots, kittiwakes, puffins and Arctic terns (Sterna paradisaea, hereafter just terns) that forage within a limited range around their Faroe Island colonies during the breeding season, ii) test if these records are valid proxies for lower-level productivity, and iii) discuss these signals in the context of larger-scale oceanographic trends and events in the SPNA, and their causes and consequences for marine ecosystems. We thus provide a holistic view of higher trophic level functioning and productivity of the Faroe shelf marine ecosystem. By including previously unpublished time series data reflecting breeding success or population trends in the four mentioned seabird species, we explore the food chain on the Faroe shelf, from primary production (primarily diatoms), via on-shelf zooplankton (primarily the copepod Calanus finmarchicus) and prey fish species (primarily sandeel, Ammodytes spp. and gadids, Gadidae spp.) up to seabirds. The distinctly different foraging strategies of the focal seabird species (Table 1) also indicate they can reflect different parts of the ecosystem and therefore may respond differently to important changes in environmental conditions.
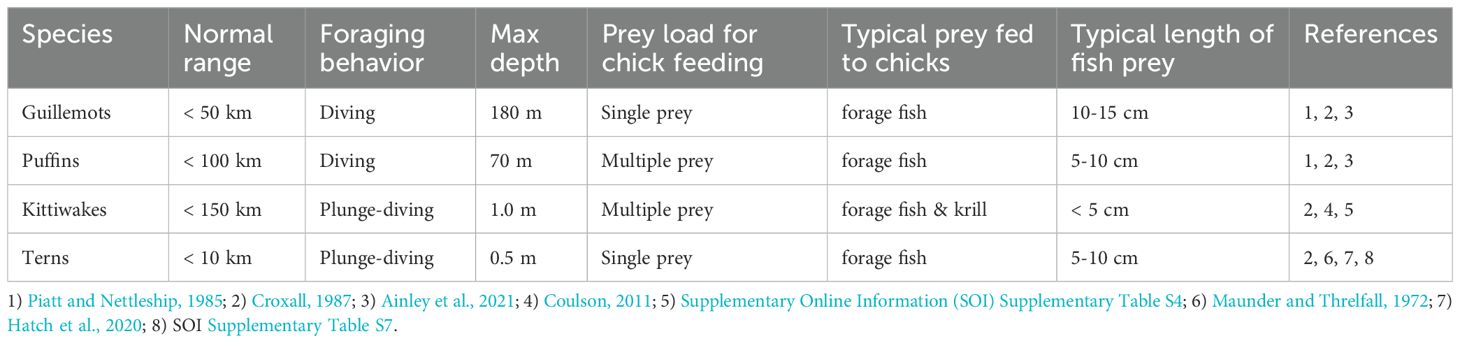
Table 1. Foraging strategies of the focal study species.
In Material and Methods (section 2), we provide comprehensive descriptions of the seabird series, as well as an overview of the established (and here updated) ecological indicator records used. Our Results (section 3) include an overview of the distribution for three out of the four discussed Faroe seabird species during the non-breeding season i.e. August to April (3.1), a scrutiny of the variability in juvenile fish abundances and sizes (3.2), an overview of all seabird productivity records in relation to established lower-level production indicators for the Faroe shelf (3.3), and an assessment of longer-term trends in seabird attendance and harvest records (3.4). These multiple threads are then pulled together in the Discussion (section 4). While acknowledging top-down impacts, seabirds are rarely able to regulate the sizes of their prey stocks (Saraux et al., 2021), and this work focuses on how food-driven (bottom-up) processes affect the reproductive success of seabirds in a relatively well-defined shelf ecosystem in the SPNA – the Faroe shelf.
2 Materials and methods
Tables S1 and S2 in the Supplementary Online Information (SOI) contain the metadata and raw data for all counting units. Each counting unit has been assigned a unique identification number (ID), which is referred to in the text, figures, and Tables S1–S3. Table S1 provides the spatial domain, species, timespan, number of datapoints (years), source data collection, and method for estimating each metric for each ID. The table includes references for previously established methods and a qualitative assessment of each counting unit’s accuracy.
2.1 Indices for primary production and juvenile fish
The index for the total new primary production on the Faroe Shelf (PPI; ID no.1 in Tables S1 and S2), measuring nitrate drawdown in the Central Shelf from typical winter concentrations (~12 μM) to late June levels has been updated, based on(Gaard et al. (1998). The PPI calculation assumes constant shelf-ocean exchange, with nitrate loss likely due to phytoplankton uptake variations.
The 0-group length index (ID no.2), introduced by Jacobsen et al. (2019) has been both updated to 2024 and extended back to 1974. Annual 10-day surveys of juvenile fish abundances and lengths have been conducted on the Faroe Plateau since 1974, typically in late June to early July. Despite replacing the research vessel twice (in 1980 and 2021), consistent methodology has been maintained by using the same trawl throughout. The 0-group length index is calculated by applying principal component analysis (PCA) on the mean lengths of the four most abundant 0-group species: cod, haddock (Melanogrammus aeglefinus), Norway pout (Trisopterus esmakii), and sandeel, averaged across all trawl stations within the 100 m bottom depth contour. Covering the Central Shelf area, the survey included an average of 40 stations (range: 15-52). Specifics regarding trawl dimensions and other survey details can be found in Jacobsen et al. (2019). The robust 0-group length index, derived from the first inverted principal component, reflects high synchrony in species mean lengths. To account for up to two weeks of timing variations, mean lengths were here standardized to 25 June using a linear mixed effect model with sampling date as a fixed effect and year as a random effect.
Abundances of juvenile fish show considerably more variability and are less synchronized across species compared to the mean lengths. For seabirds, prey abundance during the breeding season may also have an effect on breeding success. We therefore include time series for numbers of juvenile fish for each of the mentioned four species: cod, haddock, Norway pout and sandeel (IDs 3-6 in Tables S1, S2), averaged over all trawl stations within the 150 m bottom depth contour (range: 73-78 stations). Large catches were subsampled and adjusted to reflect total catch (Jacobsen et al., 2019).
2.2 Seabirds
2.2.1 Geolocator data
As part of a pan-Atlantic project, global location sensors (GLS, geolocators or light loggers) were first deployed in the Faroe Islands on breeding kittiwakes at Stóra Dímun in 2009 (Frederiksen et al., 2012). The SEATRACK project expanded to four additional species in 2014 (https://seatrack.net/about/) (Strøm et al., 2021). Light-level recordings enable calculating bird movements by tracking daily sunrise, sunset, and day/night duration. Launched in 2014, SEATRACK now covers > 90 study sites across the subpolar and polar North Atlantic (Merkel et al., 2024). We used the SEATRACK open access web application (https://seatrack.seapop.no/diversitymap/) to present the average distribution of Faroe kittiwakes, puffins and guillemots during the non-breeding period, divided by autumn, winter and spring. An overview of the material collected to produce the maps is given in Table 2.
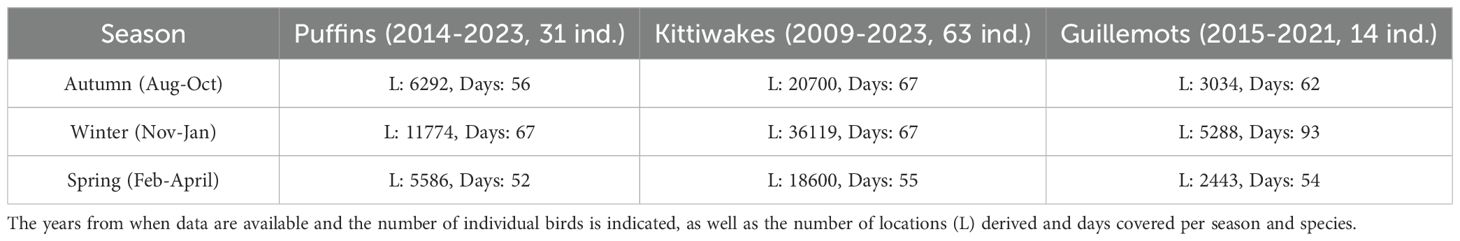
Table 2. Overview over the amount of data used by SEATRACK to produce the composite distribution maps.
2.2.2 Official censuses for the entire Faroes
Due to the reduced guillemot abundances through the 1960s, a census of the entire breeding population in the Faroe Islands was carried out in June-July 1972 (Dyck and Meltofte, 1975, 1973). Adult guillemots were counted by one to three observers across colony segments, with individual averages summed for all islands. All colonies were counted from a boat using binoculars 10x50, with some also counted from land. Photographs were also taken from boats and a helicopter to provide comprehensive visual documentation. To estimate uncertainties caused by diurnal and inter-day variability in the attendance of adult birds, control counts were made from land of the easily observable seabird cliff ‘Høvdin’, the northernmost seabird colony on the island (61°47′N and 6°51′W, Figure 2). Uncertainties arose from variations in observer estimates, ledge visibility, counting conditions, observation locations, and temporal factors, and researchers estimated the overall uncertainty at approximately ±30% (Dyck and Meltofte, 1975, 1973). Censuses were repeated in 1987, 1997-1999 and 2007-2014, by the same observer, following the same protocol. These later censuses included both guillemots and kittiwakes which often breed in the same cliffs. The maps created in 1972 were then updated with more detailed area divisions marked on instant Polaroid photos. We used a smaller boat, allowing us to approach the cliffs more closely than we could in 1972. Guillemots were counted by number of attending birds (ID no.7 in Tables S1, S2), while kittiwake counts focused on the number of nests in use (ID no.8).
2.2.3 Guillemots and kittiwakes at Høvdin
Guillemots and kittiwakes, ranking among the five most abundant seabird species in the Faroe Islands during spring and summer (Hammer et al., 2014, Figure 3), breed along the almost 7 km long west-facing cliff side of Skúvoy, which reaches a height of 394 m above sea level. Høvdin (Figures 1, 2) became the main long-term study colony for these species after the 1972 census (see above). This seabird cliff is about 130 m high and 300 m wide, and guillemots and kittiwakes have been breeding there for centuries (Nørrevang, 1977). Regular collecting of guillemot eggs occurred annually until 1974, after which agreement was made with the hunters to stop this activity on Høvdin. This means that minimal anthropogenic effects have influenced Høvdin in the study period.
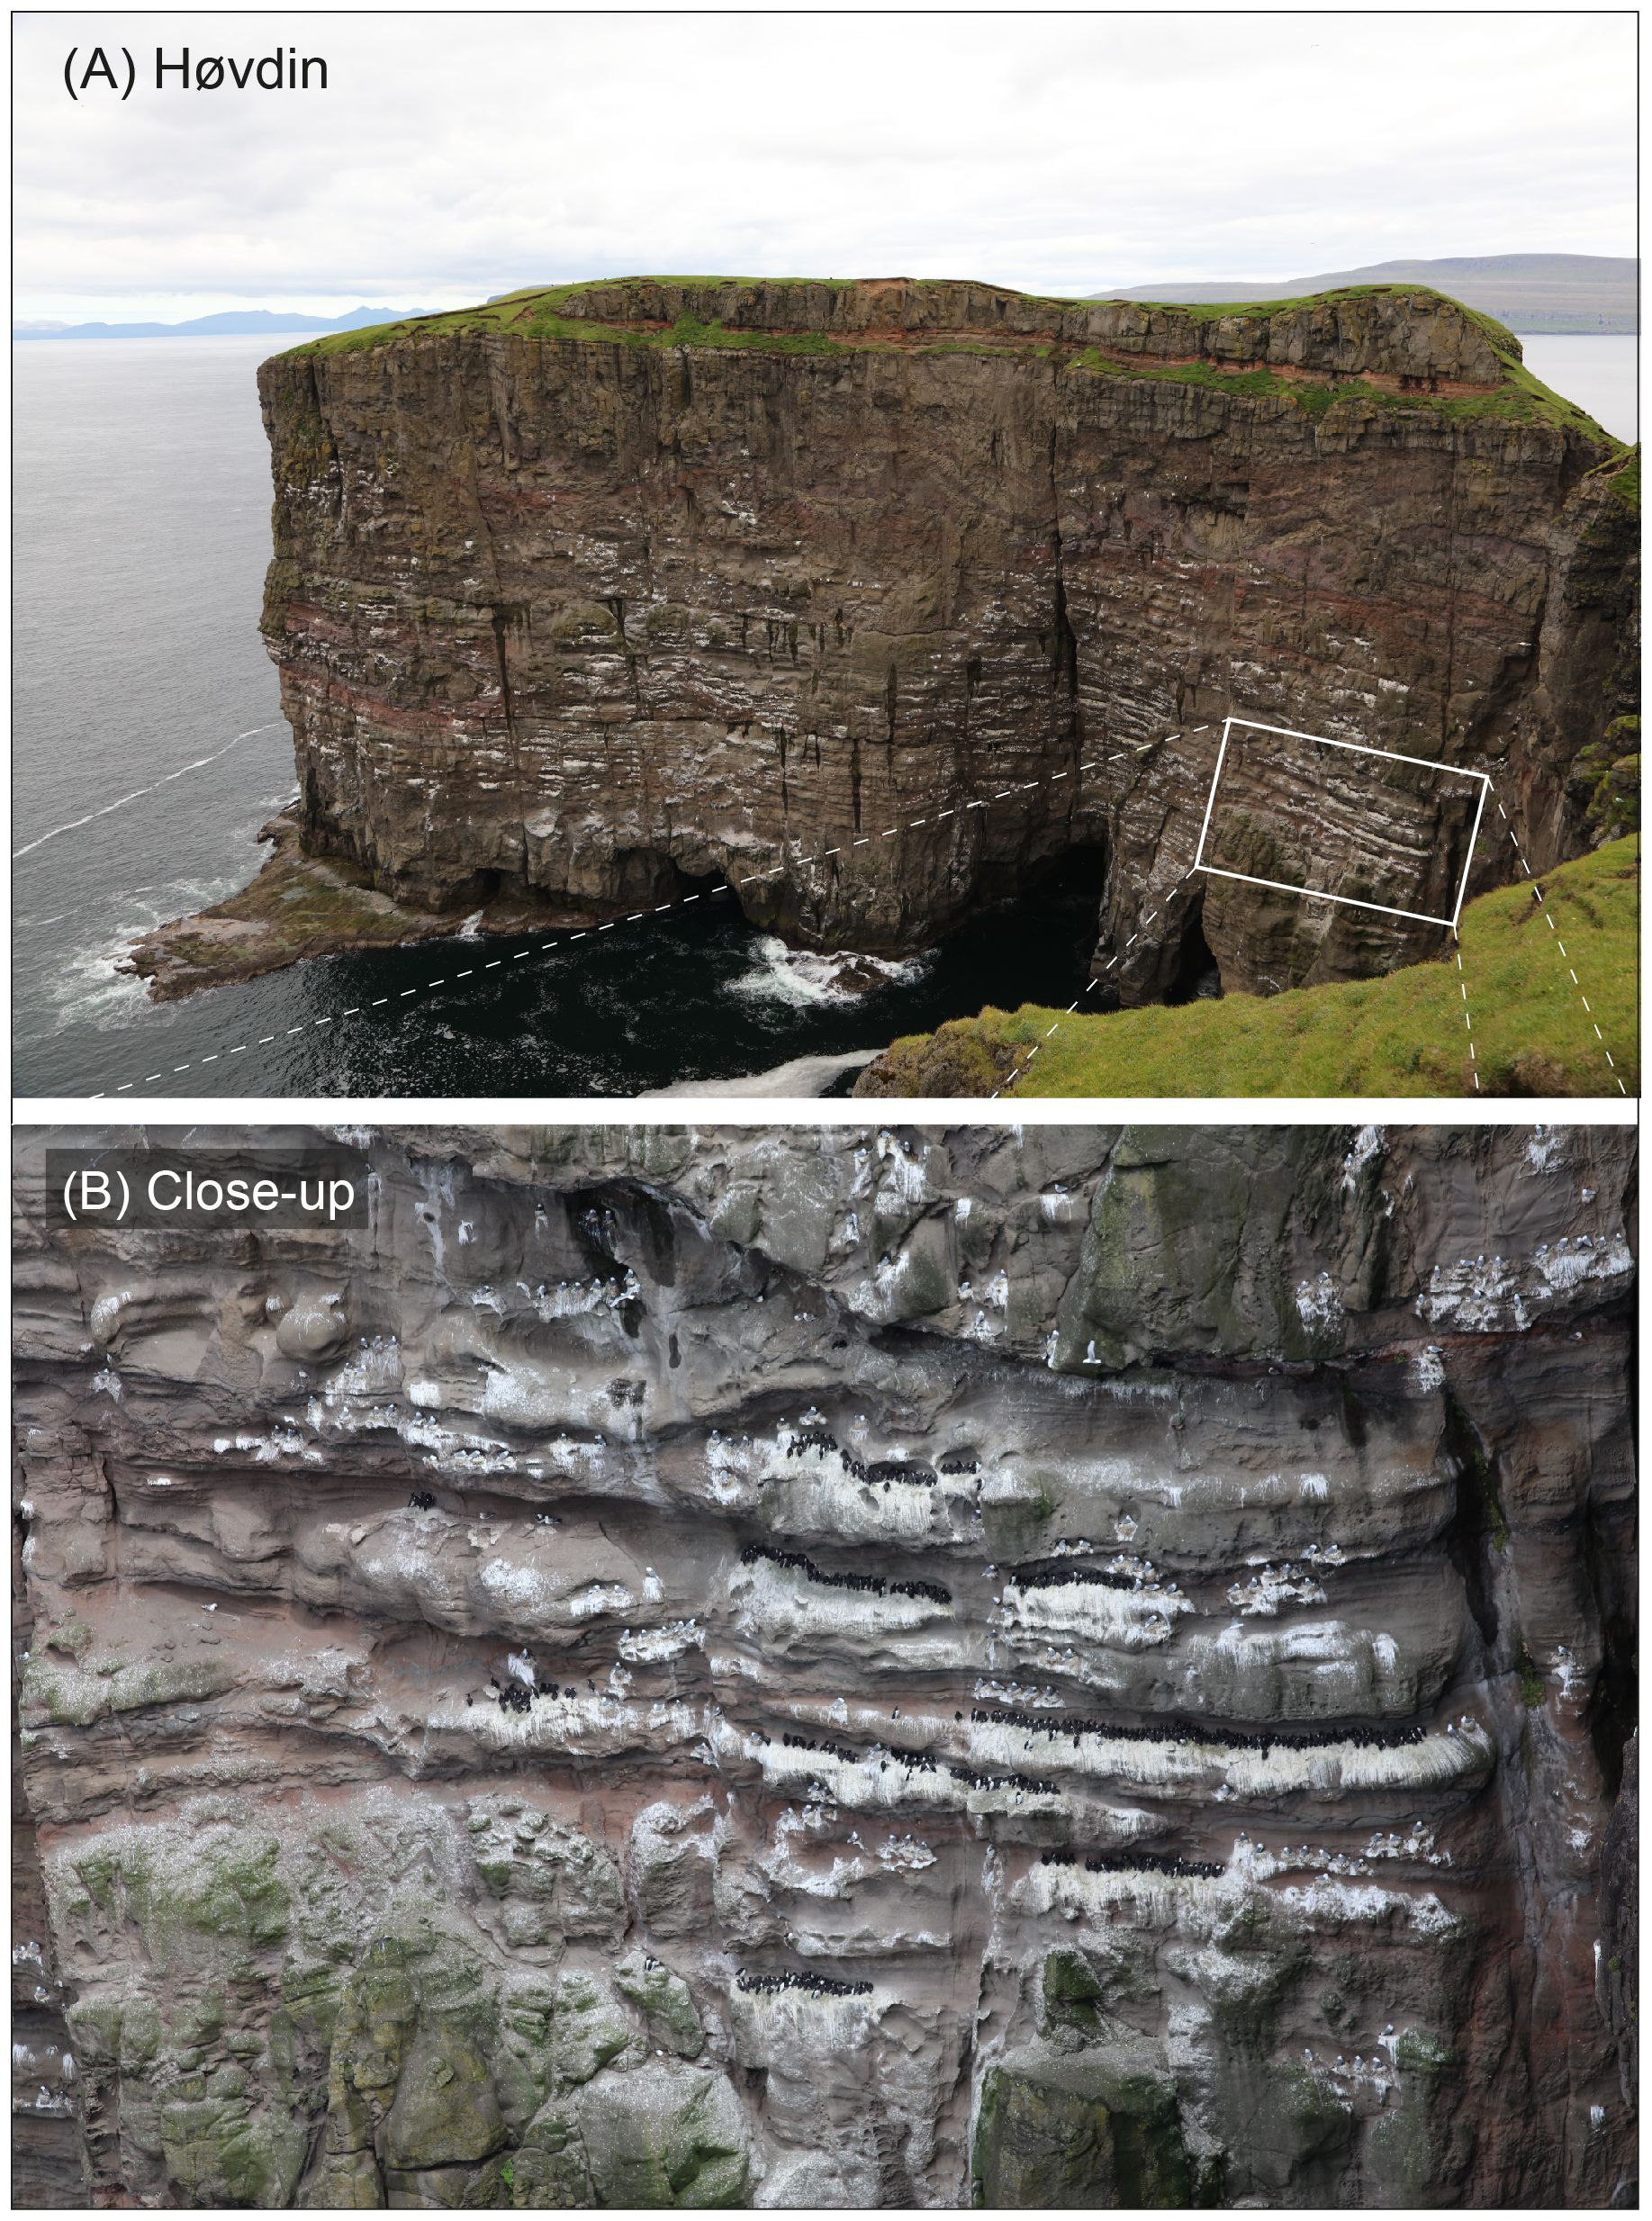
Figure 2. The seabird cliff ‘Høvdin’, as viewed from the hut, which is used to monitor guillemots and kittiwakes (as well as fulmars). (A) The entire cliff and (B) a close-up of a central part of this colony.
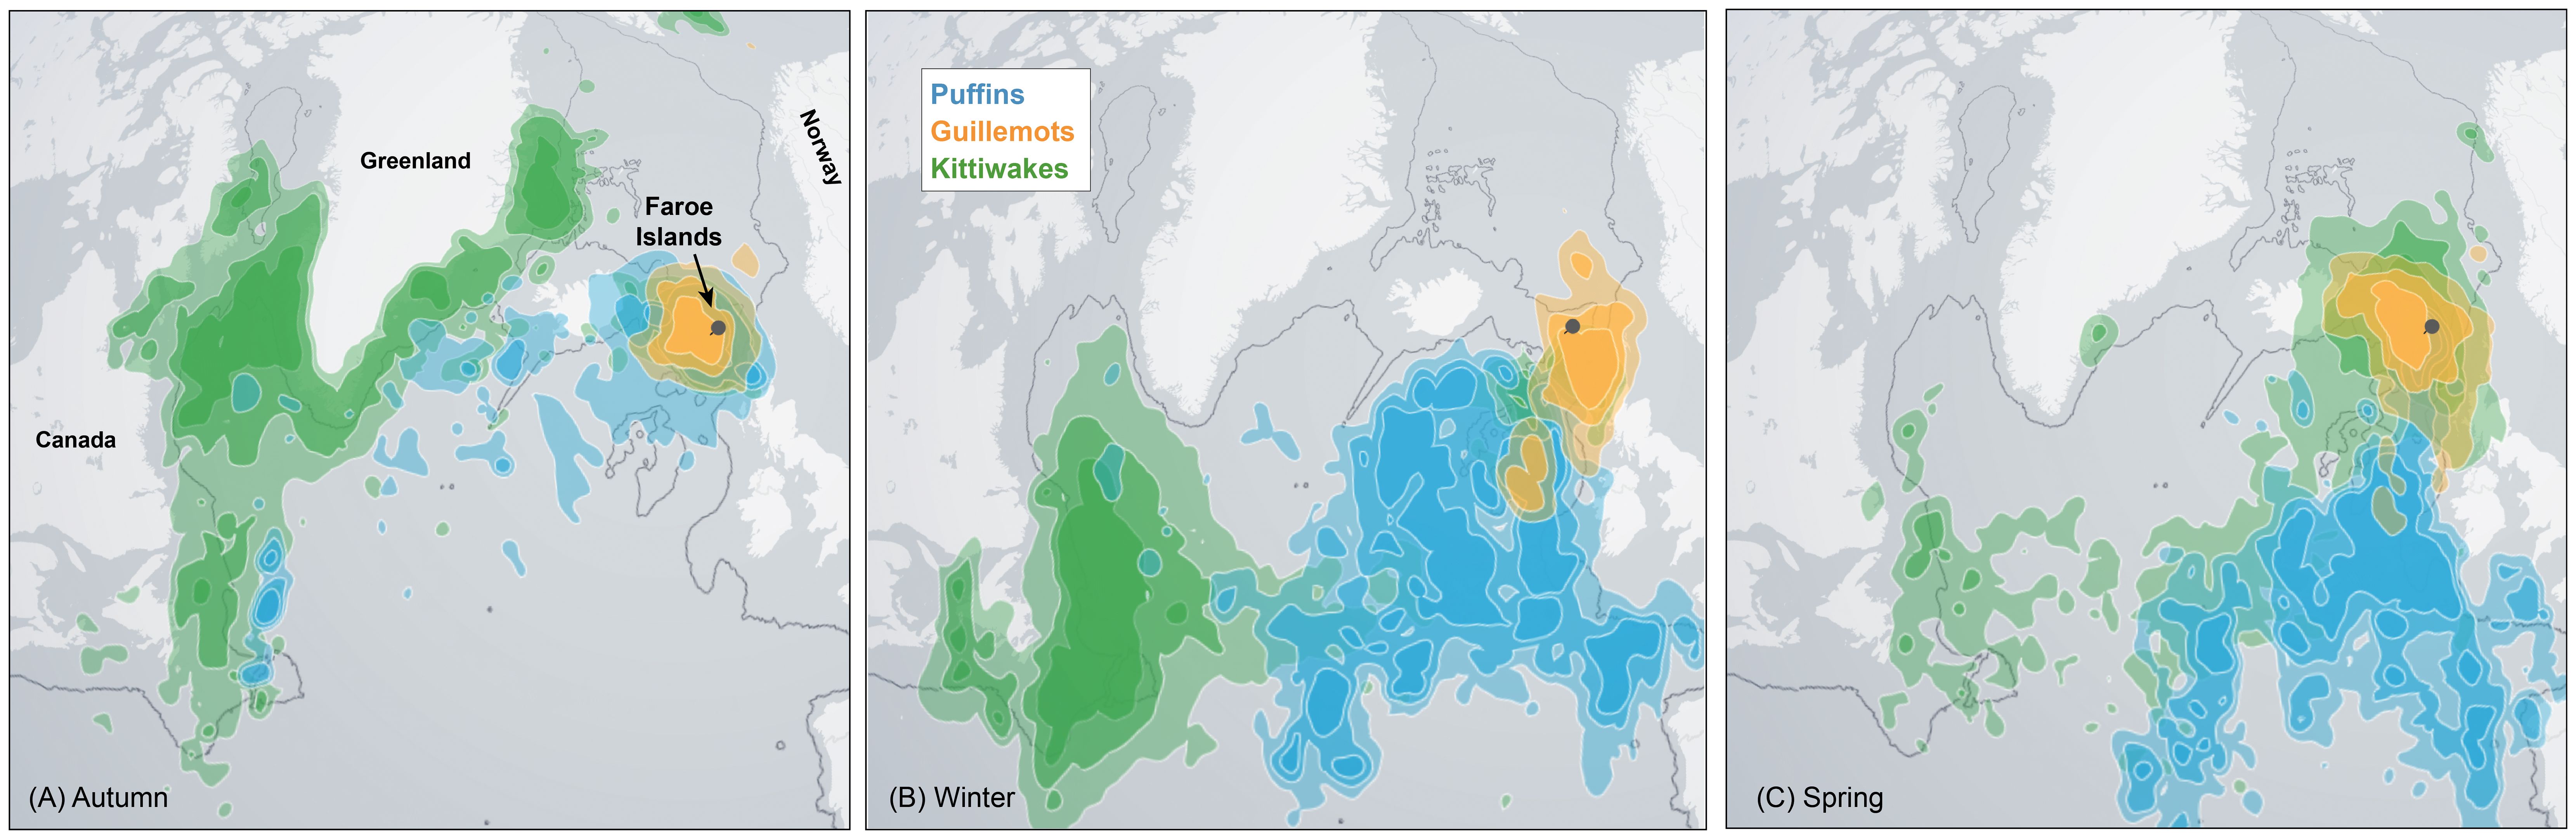
Figure 3. Average non-breeding distribution of kittiwakes (2009-2023), puffins (2014-2023) and guillemots (2015-2021) breeding on the Faroe Islands, segregated into (A) autumn (August-October), (B) winter (November-January) and (C) spring (February-April). The maps depict probability density functions overlaid all available data points (see Table 2). The polygons displayed represent, with increasing color intensity, the 25%, 50% and 75% probability contours of these functions. All maps were produced by courtesy of SEATRACK (https://seatrack.net/about/). A more detailed version of this figure, with individual species in each panel, is provide in Supplementary Figure S4.
Throughout the study period since 1972, we consider natural predation rates to have remained relatively constant based on personal observations and monitoring of predatory birds (Olsen, 2010). There are no ground predators on the island like the house mouse (Mus musculus), brown rat (Rattus norvegicus), and cat (Felis catus), which do populate many of the other islands (Bloch and Fuglø, 1999). Although predatory birds (e.g. great skuas, Stercorarius skua) prey on puffins, guillemots and kittiwakes (eggs, chicks and even adults), we suggest that the significant variations in guillemot attendance and kittiwake chick production primarily reflect the adults’ foraging success.
In 2001, a hut was built at the viewing point for Høvdin, enabling more comprehensive monitoring, particularly during windy conditions. Direct observations were conducted from the hut between 2001 and 2016. In 2017, direct observations transitioned to high-quality digital imaging using a Canon EOS 5DSR SLR camera with an EF 200 mm f/2.8L II lens. Approximately 45 pictures are needed to cover the total cliff, and photographs are taken two times each summer; in June for counting guillemots and in late July for counting kittiwakes, kittiwake chicks and nests, including empty nests that appeared to have been used in the same year.
A 25× spotting scope was used for direct observations throughout the study period. The ability to identify identical birds in both photographic and scope-based observations eliminates the need for a correction factor when combining methodologies. With a single observer conducting nearly all counts, except for three kittiwake surveys in 1990 and 2022-2024, inter-observer variation is minimal.
Guillemots: A sketch plan of the guillemot ledges in 1973 was used in all years. Created from a photographic mosaic, the plan originally documented 302 guillemot ledges and breeding sites (Olsen, 1992). Subsequently, sites were subdivided as bird populations decreased or mapping precision improved. Annual counts were conducted in June or early July, coinciding with egg-sitting and early chick-rearing periods.
To account for diurnal variation, the population count was conducted between 9 a.m. and 7 p.m. local time. Inter-day variation represents another significant potential bias (Walsh et al., 1995), yet logistical constraints permitted only one comprehensive count of the several thousand guillemots in the colony per year. Each annual count was completed within 2–5 days, contingent on weather conditions. To mitigate for diurnal and inter-day variability, the researcher systematically counted 18 control ledges every two hours during the survey period. The error introduced by this short-term variability was not deemed to significantly impact the final results (Olsen, 1990), as detailed in the SOI (Supplementary Figures S1, S2).
Due to the guillemots’ close positioning on eggs and chicks, direct offspring counting was not feasible within the study’s time constraints. The researcher could, however, identify birds sitting on eggs or rearing chicks through their distinctive posture (Olsen, 1990). The remaining birds were classified as off-duty birds – those sitting or standing near their partners, or non-breeding birds (primarily immature individuals) exploring potential breeding sites. Applying this methodology across Høvdin from 1987–2017, an average of 47% of present birds were observed sitting on an egg or small chick (range 34–58%, SD 7%, unpublished data). The majority of observed variation stemmed from fluctuations in off-duty bird populations. Counting units encompassed the total number of attending guillemots and those apparently sitting on eggs or rearing chicks (ID no.9 and 10), enabling the calculation of a productivity proxy.
Kittiwakes: The kittiwake survey utilized the identical sketch map previously employed for the guillemot study. Counting commenced between 20 July and 1 August, with the precise start date annually determined by preliminary colony visits to ensure chicks had reached an appropriate size. The chick count, which provides estimates of fledging success, should be interpreted as a maximum figure, acknowledging that some smaller chicks may not survive to fledging. Before 2001, annual counts involved subsampling, with an average of 1,050 nests examined (ranging from 200 to 1,736). From 2001, the methodology expanded to comprehensive counts encompassing all adults, nests, and chicks, with an average of 2,624 nests (ranging from 1,149 to 4,525). The counting unit is the number of chicks per nest (including also empty nests that apparently were used in the same year) late in the breeding season (c. 20–31 July), (ID no.11) when most of the chicks approached fledging (Hátún et al., 2017b).
2.2.4 Puffin chick production
In the absence of direct breeding success data for puffins, we provide proxy measurements derived from alternative data sources collected on the rat-free islands—Skúvoy, Mykines, and Nólsoy (Figure 1)—spanning various years. Puffin is the second-most abundant seabird in the Faroes, only exceeded by the fulmar (Hammer et al., 2014).
Catches of immature puffins in Nólsoy (1989-2005): Immature, non-breeding puffins can forage in the open ocean during periods of food scarcity in the Central Shelf (Nørrevang, 1977). Analogous to breeding success metrics, the presence of immature birds near land serves as a valuable proxy for local food availability. This indicator was measured by determining the proportion of immature birds (under 3 years old) harvested in Nólsoy. This analysis draws from an extensive biometrical dataset comprising over 5,000 birds (1989 to 2005) collected at Urðin, a colony located on the island’s eastern side (site 4 in Figure 1), which is the primary site for bird harvesting on the island (Jensen, 2010; Jensen and Olsen, 2020). Between 2 July and 8 August, hunters collected birds and submitted them to J.-K. Jensen, who determined their age by examining bill development and the presence of the bursa of Fabricius (Harris and Wanless, 2011). While this metric (ID no.12) may reflect breeding success from 1-2 years prior (corresponding to the age of the harvested birds), it is primarily interpreted as an indicator of contemporary food availability near the colony.
Chick survival in Skúvoy (2010-2023): In 2010, 15 existing natural nests at Byrgisbakki in Skúvoy (Site 2 in Figure 1) were replaced with identical artificial nest boxes, fabricated from plastic tubes and fitted with video cameras. The nest boxes were camouflaged by being embedded in the soil, with specifications of 25 cm diameter, 20 cm height, and a 10 cm entrance diameter. The videos documented annual chick survival per nest, serving as the counting unit (ID no.13) for puffin breeding success in Skúvoy since 2010.
Complementing the artificial nests, a consistent set of natural puffin burrows at Byrgisbakki in Skúvoy were annually visited from 2015 (excluding 2017) during the chick-rearing period to deploy and retrieve GLS loggers on adult birds. These capture attempts, often necessitating multiple visits per burrow, simultaneously facilitated comprehensive chick status monitoring. Despite adults being handled only annually, the estimated breeding success likely represents a conservative minimum due to potential cumulative disturbance from logger tracking. The number of inspected burrows ranged from 27 to 35, with an average of 33. The breeding success—more specifically, fledging success—was calculated as the percentage of burrows containing a viable chick late in the breeding season (ID no.14).
Chick production in Mykines (2011-2024): Mykines and the adjacent islet Mykineshólmur host the largest puffin colonies in the Faroe Islands, with an estimated 125,000 breeding pairs in 1989 (Grimmett and Jones, 1989). From 2011, the puffin colonies at Lamba and Dalurin on Mykines (site 5 in Figure 1) were monitored using methodologies modified from Gilbert et al. (1998). Between 2011 and 2014, chick numbers in selected study plots were directly counted using an endoscope. From 2015 onward, chick presence was inferred from fecal matter found at burrow entrances. This approach relies on the premise that adult puffins seldom defecate within their burrows, thus fecal presence strongly suggests chick occupancy. Camera observations from the previously mentioned Skúvoy colony corroborated this assumption, where simultaneous endoscope and fecal counts revealed a slight underestimation: fecal counts underreported chick numbers by 10% between 2017-2022 and by 8% in 2023. Relative reproductive success (ID no.15) is calculated as the proportion of apparently occupied burrows counted in early June (incubation period) that still contained a chick in late July or early August (late chick period). Annual burrow inspections ranged between 132 and 470.
2.2.5 Puffin harvest
While harvest records cannot directly represent puffin production, they offer valuable insights into long-term productivity trends in the Faroe Islands. The traditional fowling practice targets immature puffins, with the expectation that breeding birds carrying fish will be spared. In Nólsoy, fowling conventionally commenced on 2 July, coinciding with the appearance of the first puffins carrying fish – ‘sildberar’. However, breeding and unsuccessful breeding birds without fish remain vulnerable to capture. Despite the absence of official puffin fowling records in the Faroe Islands, voluntary documentation has been maintained over recent decades (Jensen and Olsen, 2020), from where the following four longest time series (ID no.16-19) are used in this study:
Nólsoy (Figure 1, site 4, ID no. 16): Puffins inhabit most of the island’s coastline, with the highest population density concentrated in the Urðin colony, previously detailed in section 2.2.4.
Streymoy (Tjørnuvíksstakkur, Figure 1, site 6, ID no. 17): Tjørnuvíksstakkur, a rat-free stack, is the sole location on Streymoy where consistent puffin fowling occurred in recent decades. Fowling activity demonstrated significant variability, with annual catches fluctuating from a few hundred to approximately 7,000 birds in year 2000. Responding to puffin population declines in the late 1980s, fowling was prohibited from 1989 to 1993, with an additional ban implemented after 2010.
Viðoy (Settorva, Figure 1, site 7, ID no. 18): Settorva, a steep cliff, represents the sole Viðoy colony with consistent fowling in recent decades, typically harvesting approximately 7,000 puffins each year. While classified as rat-free, occasional rat signs have been observed, prompting fowlers to bring rat poison to the site annually.
Skúvoy (Figure 1, site 3, ID no. 19): Puffins breed across the island’s entire coastline, with the highest population concentrated on the steep southern grass slope. A significant puffin population decline occurred after 2002, resulting in a complete cessation of fowling after 2007.
2.2.6 Arctic terns
A comprehensive registration of Faroese tern colonies was conducted in 1981 (D. Bloch unpubl. data), with Schreiber and Kissling (2005) providing a detailed study of a colony in Kaldbaksbotnur in 2003. The present study draws from a national citizen science monitoring program initiated in 2003 (Olsen and Sørensen, 2018). Land owners and caretakers were initially contacted, with many becoming consistent volunteers, supplemented by approximately 50 additional interested participants, bringing the total to around 90 contributors. Annually, volunteers received a map, questionnaire, and pre-addressed return envelope in the spring. An online questionnaire was introduced in 2023, enabling volunteers to directly record colony coordinates.
Supplementary coordinate data were derived from volunteer-annotated maps. The monitoring program has comprehensively documented 219 colony locations, with many sites repeatedly observed across 16 of the 18 Faroe Islands and 6 islets. (Supplementary Figure S3). Maintaining methodological consistency across years was emphasized to participants. Nevertheless, the volunteer-driven nature of the project led to inconsistent participation, with some participants unable to conduct annual counts and delayed reporting, particularly during years of low breeding activity. Follow-up phone calls were made to solicit missing observations. Feedback report numbers have progressively decreased since 2018, rendering the data beyond 2020 uncertain.
Number of breeding pairs: Based on the reports, the annual number of breeding tern pairs has been estimated for the period 2003-2020. To reduce potential disruption and simplify the counting process, volunteers were instructed to briefly flush the birds (flush counts, Burnell et al., 2023). Aerial bird counts were then multiplied by 0.66 to determine the number of pairs (ID no.20) (Olsen and Sørensen, 2018). In certain locations, nest counts were conducted using binoculars from a distance, avoiding bird disturbance. Bloch and Sørensen (1983) counted 9,000-12,000 pairs in 1981, the number was 7,600 pairs in 2003.
Breeding success in the entire country: National volunteers have counted the number of fledged chicks at the end of the chick-rearing period, before the first young leave the colony. However, accurately measuring breeding success is complicated by the fact that significant numbers of chicks die soon after hatching or just before fledging, and the chicks that survive leave the colony soon after fledging. The breeding success (ID no.21), which is the number of large chicks counted per pair, is thus a conservative estimate of breeding success.
There are mice, rats and cats on many of the islands, but their precise impact on tern populations remains unclear. The largest colonies are found on rat-free islands, suggesting that rats have a negative effect. Sheep are present on all the islands, and have been documented disturbing terns and consuming their eggs and chicks, a behavior also observed in other studies (Furness, 1988; Petersen et al., 2022), despite that the terns dive-bomb them when entering the colonies. Other bird species also pose threats to the terns. For instance, Schreiber and Kissling (2005) documented 26 attacks on a tern colony in Streymoy, from herring gulls (Larus argentatus), great black-backed gulls (Larus marinus) and (Chroicocephalus ridibundus). In addition, severe rain and storms are claimed by the volunteers as reasons why breeding is abandoned.
2.2.7 Qualitative citizen Science data
To complement the more systematic scientific counting, we incorporated information presented on the web-page “The breeding success for the seabirds” (http://jenskjeld.info/artikler/season23.html), where the assessments are based on a citizen science approach. Hunters and enthusiasts from around the Faroes were consulted in autumn, and their observations and data were compiled by J.-K. Jensen. This methodology has been used in several papers (e.g. Harris et al., 2015). For our analysis, we digitized these annual assessments of breeding success based on the following rating scale: very good (4), good (3), average (2), bad (1) and very bad (0).
2.3 Statistics
The seabird breeding success and attendance records are evaluated against the 0-group length index, which is considered a main ecological indicator for the Faroe shelf (Jacobsen et al., 2019). Synchrony between clear peaks in the 0-group length index and the other ecological records (PPI, number of juvenile fish and seabird production) is first illustrated using Tables 3 and 4. Peaks during the same year, or with the 0-group length index preceding by one year are considered coincident.
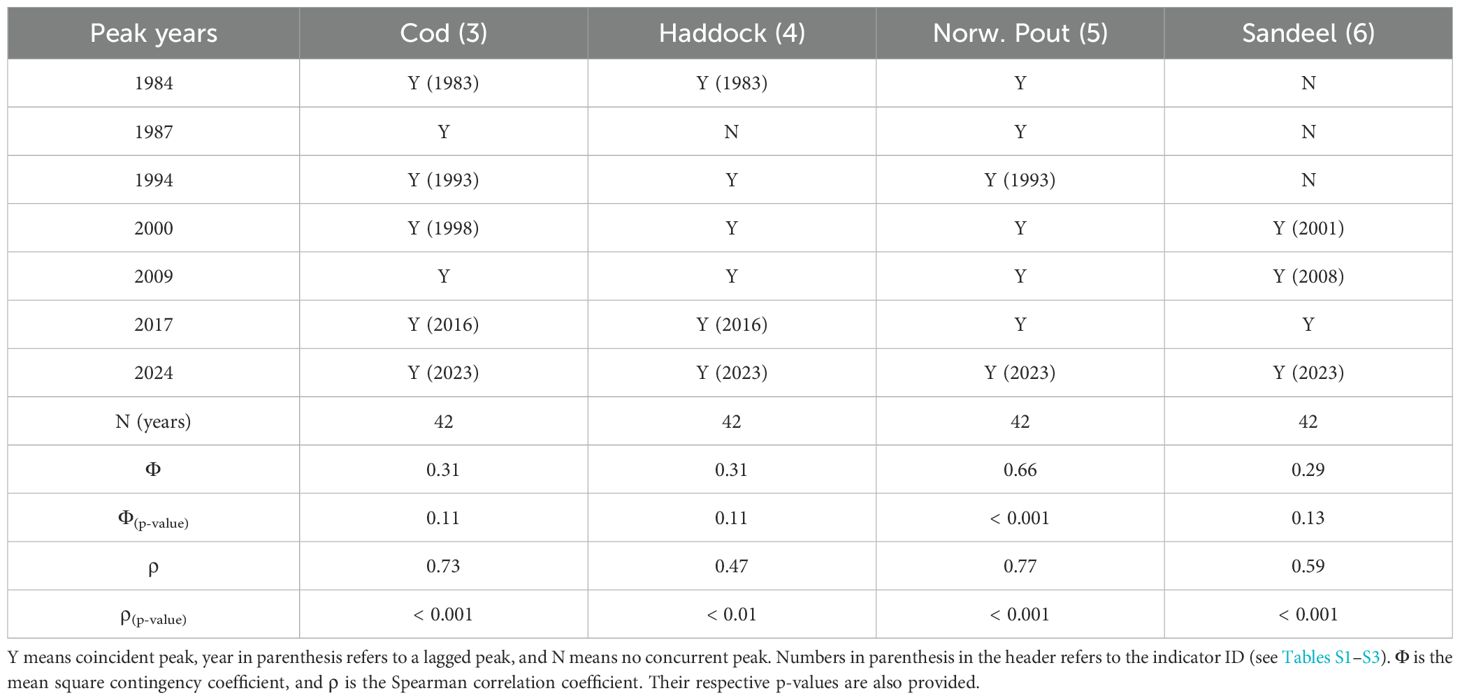
Table 3. Assessment matrix of peaks in the 0-group length index and peaks in the number of juvenile fish.
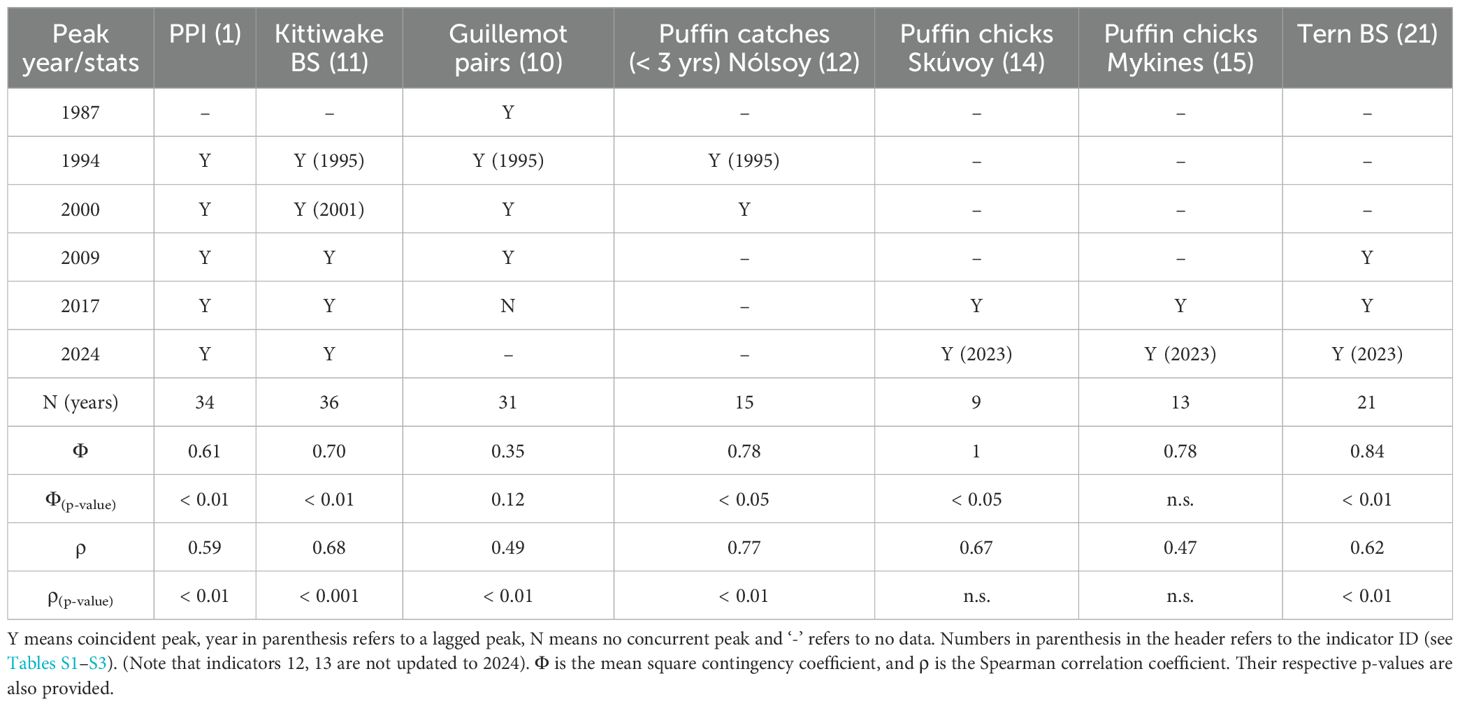
Table 4. Assessment matrix for synchrony between the production peaks (determined by the 0-group index) and the novel seabird productivity records.
Our primary objective was to assess the synchronicity between a shelf productivity indicator (0-group length index) and other ecological time-series. To facilitate this analysis, we transformed the data into binary variables, where 1 represented a peak occurrence and 0 indicated no peak. The preparation of this binary dataset (Table S3) was based on visual inspection of peaks in Figures 4, 5, supported by the MATLAB function findpeaks.m and complemented by auxiliary information (e.g., Table 3).
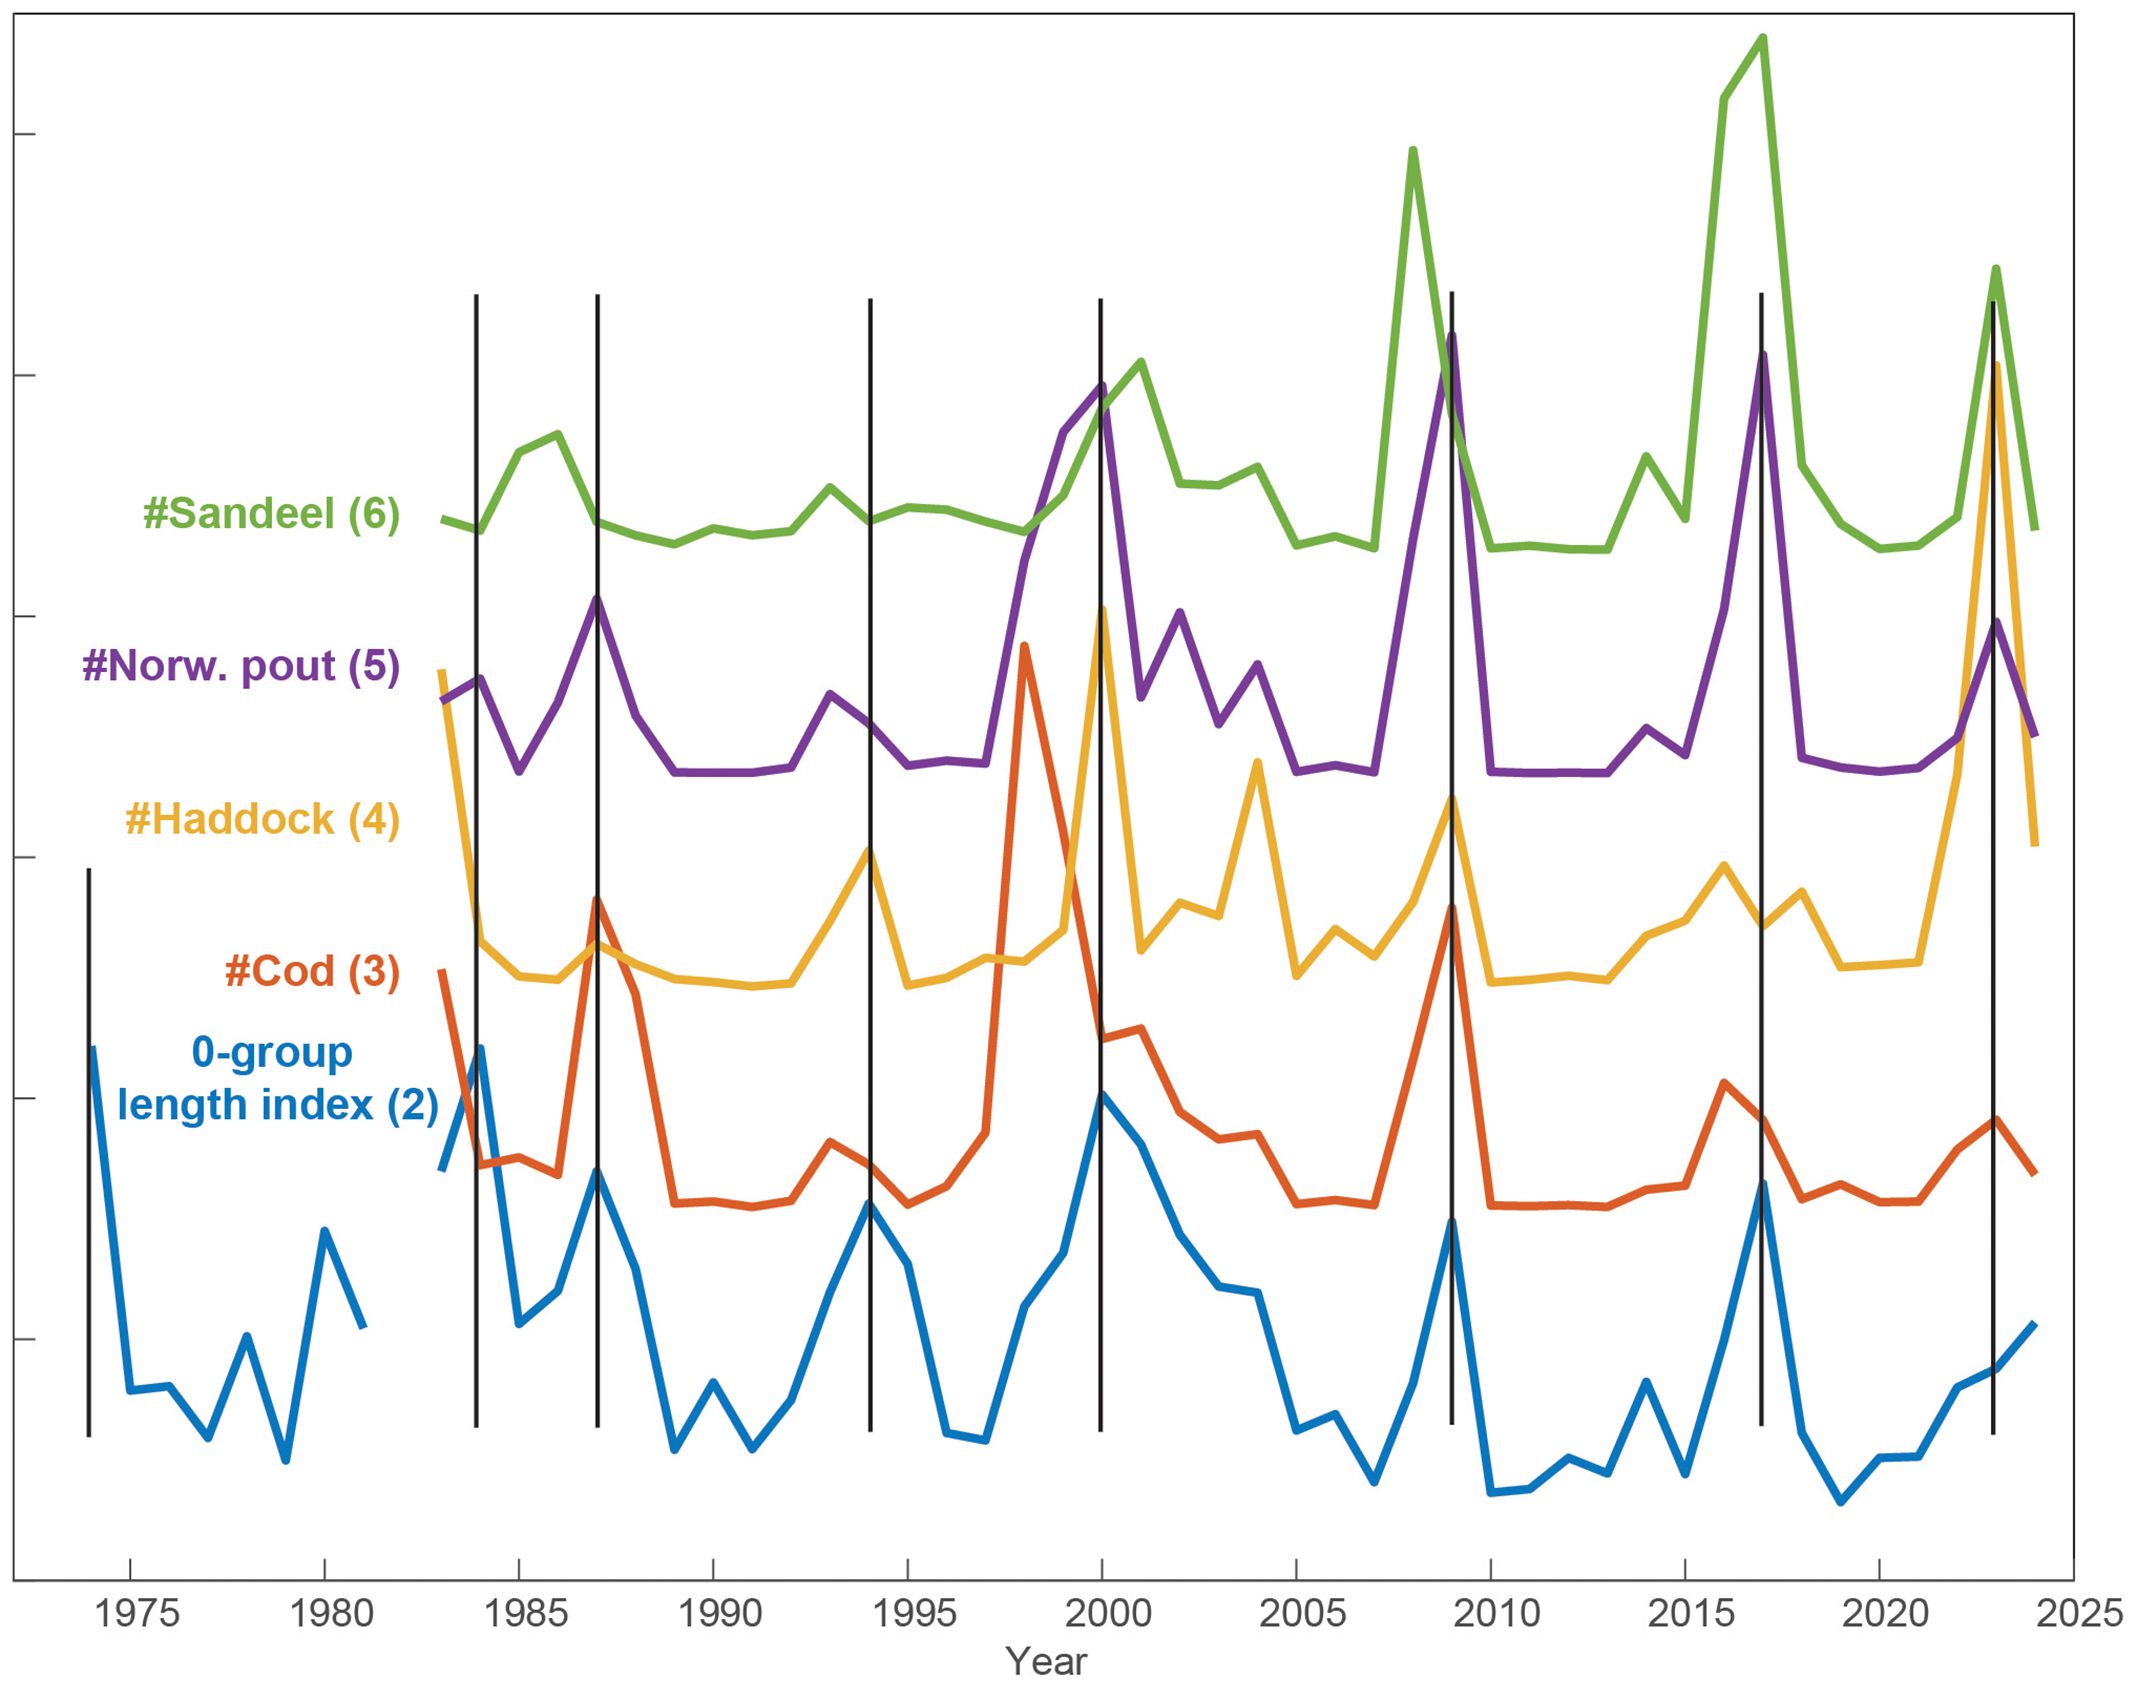
Figure 4. The 0-group length index (updated forward and backward, from Jacobsen et al., 2019) and the number of juvenile fish, for the four species included in this index. Each time series has been normalized, and production peaks are emphasized with vertical lines. The number in parenthesis refers to the indicator ID (see Tables S1–S3).
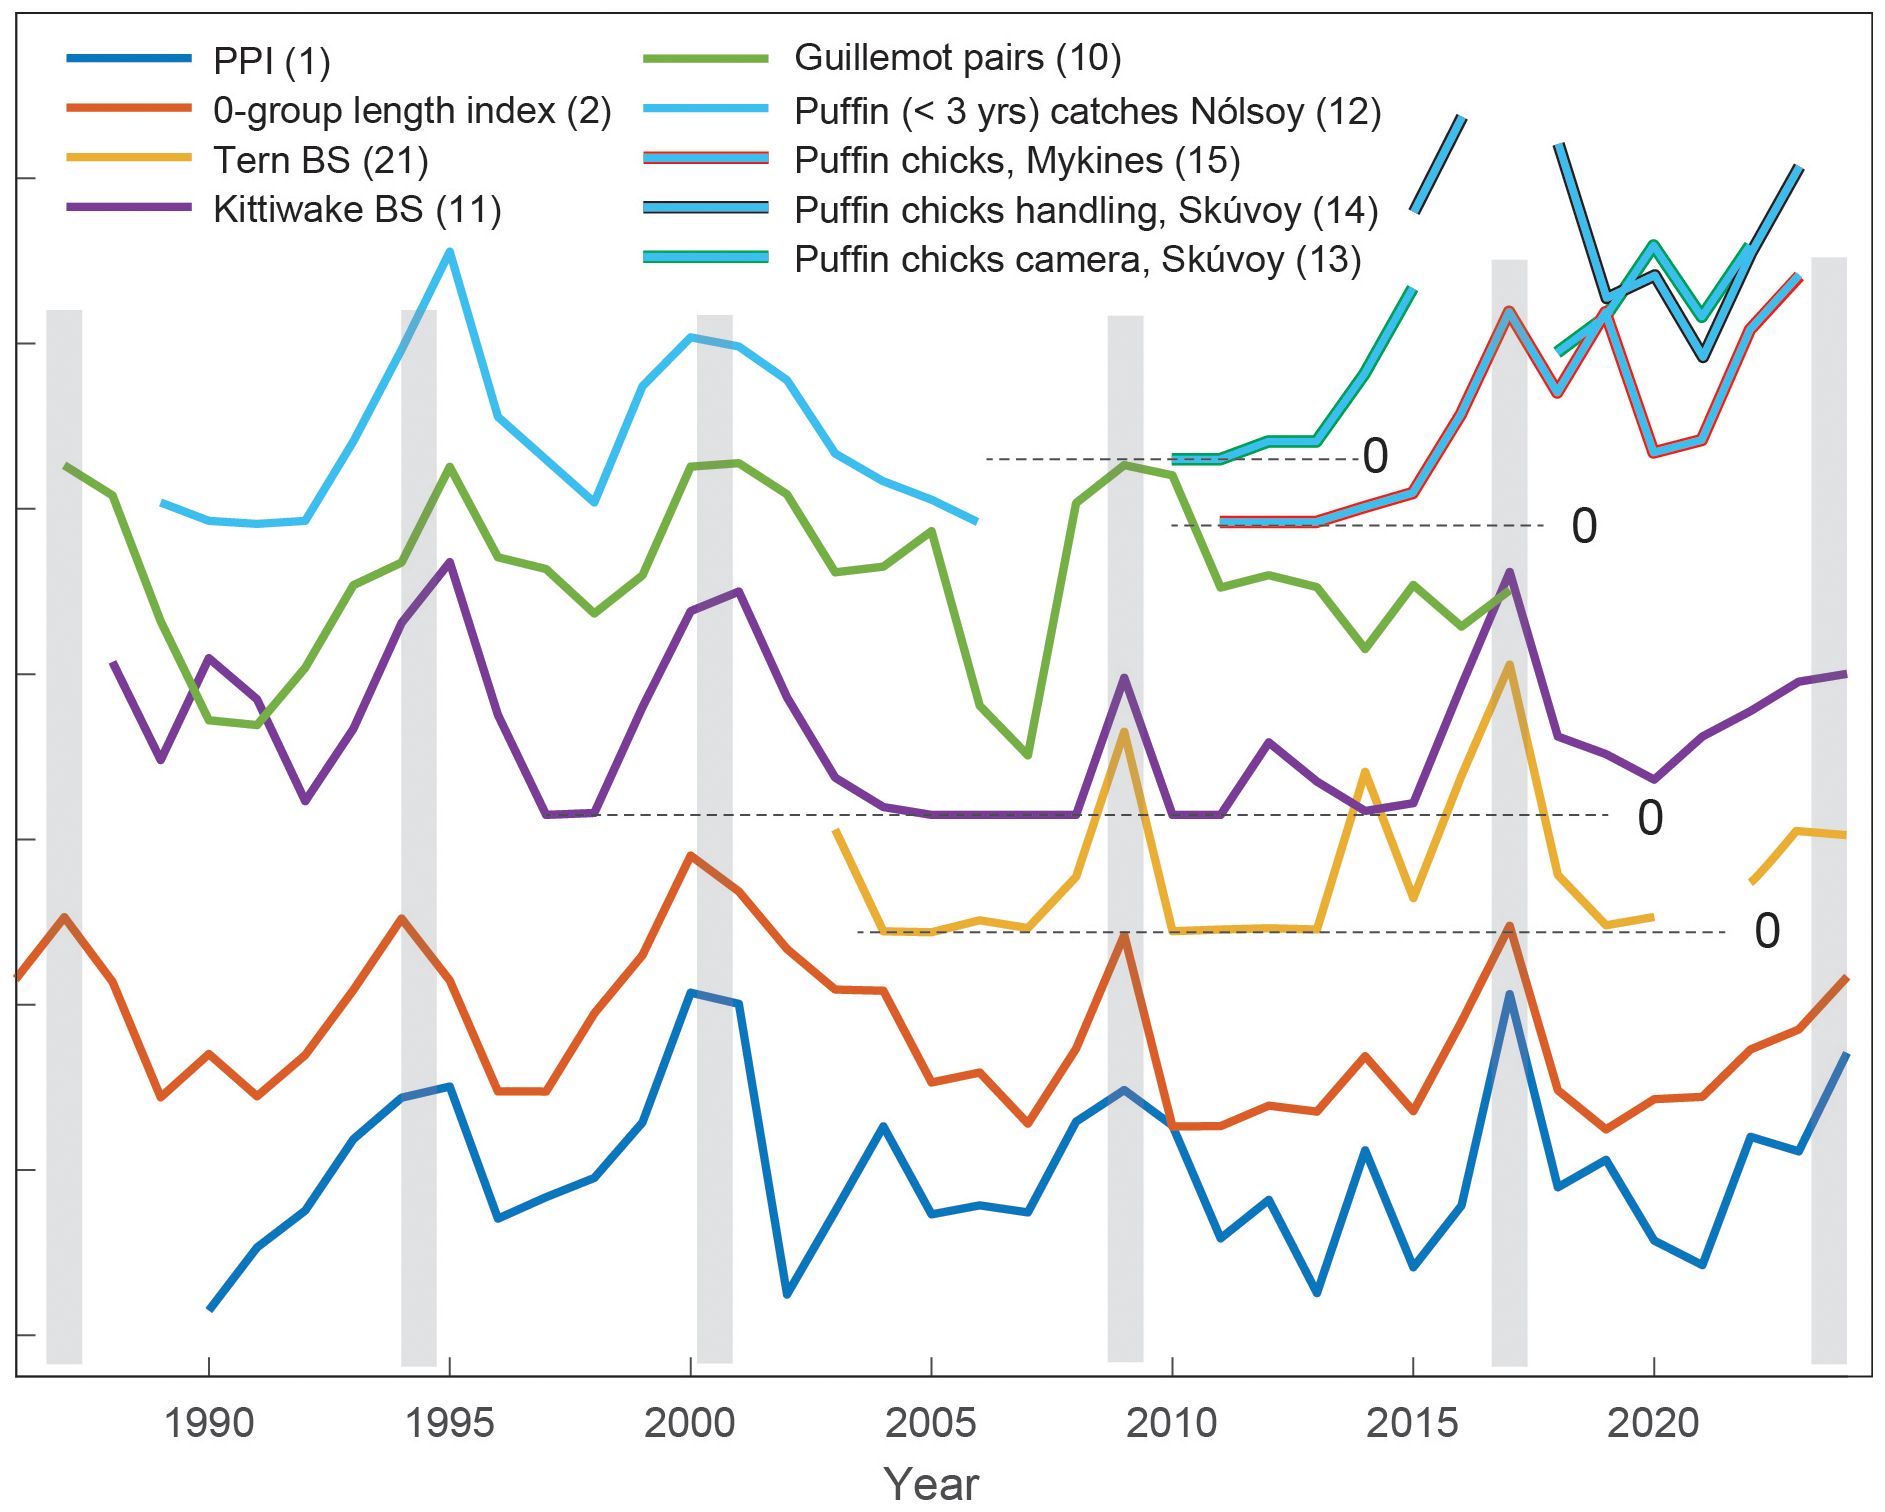
Figure 5. The Primary Production Index (PPI, blue), the 0-group length index (red) and the seabird production indicators (as outlined in the legend). Timing of the production peaks, defined from the 0-group index, is emphasized with vertical grey bars. The series have been normalized, and relevant zero levels are marked. The number in parenthesis refers to the indicator ID (see Tables S1–S3).
The association between peak occurrences was quantified using the mean square contingency coefficient (Φ), commonly referred to as Phi (Cheetham and Hazel, 1969; Salter et al., 2019). This statistic is analytically equivalent to Pearson’s correlation coefficient and ranges from -1 to 1. To address potential biases related to small sample sizes, we estimated the significance of Φ (p-value) using Fisher’s Exact Test. For comparison, we also estimated p-values using a Chi-squared Monte Carlo simulation, with both approaches yielding similar results. To account for Type I errors arising from multiple comparisons, we applied the Benjamini-Hochberg correction to the p-values from Fisher’s Exact Test (Supplementary Table S6).
As a secondary exploratory approach, designed to complement the binary analysis, we examined monotonic relationships between the 0-group index and other ecological variables. To determine whether a parametric test (Pearson’s correlation) could be applied, we first tested whether the data followed a normal distribution using the Shapiro-Wilk Test (Supplementary Table S6) and quantile-quantile (Q-Q) plots (not shown). A variable was classified as normally distributed if the Shapiro-Wilk p-value was greater than 0.05, with verification from Q-Q plots. This analysis indicated that some ecological variables did not follow a normal distribution. Consequently, we employed the non-parametric Spearman’s correlation to test for monotonic relationships between the 0-group index and other ecological variables. To correct for Type I errors arising from multiple comparisons, p-values from Spearman’s correlation were adjusted using the Benjamini-Hochberg correction (Supplementary Table S6).
Potential shifts in the presented records are evaluated using paired t-tests of the hypothesis that data from two apparently contrasting periods come from distributions with equal means (Matlab function ‘ttest.m’). Long-term linear trends are estimated in a least-square sense, using the standard Matlab routine ‘polyfit.m’. The significance level of all statistical tests was set to 5% (p < 0.05), and conducted using R statistical environment (R Core Team, 2022) and MATLAB (R2021a).
3 Results
3.1 Movements of Faroe seabirds outside the breeding season
Overwintering (non-breeding) conditions can, as mentioned, influence breeding success through carry-over effects. The SEATRACK project’s decade-long geolocator data collection (Strøm et al., 2021) provides an important overview of the waters occupied by Faroese breeding seabirds during non-breeding periods (Figure 3).
The Faroese kittiwakes exhibit a clear seasonal movement pattern (Figure 3A). In autumn (August to October), they migrate to the east Greenland slope, then travel south around the southern tip of Greenland, following the southwestern coast of Greenland before reaching the Newfoundland shelf/Basin. During winter (November to January), kittiwakes align along a stretch between the Newfoundland Basin and the Labrador Sea (Figure 3B, see Figure 1). These wintering grounds are shared with kittiwakes from various other populations across the North Atlantic breeding range (Frederiksen et al., 2012). The Faroese kittiwakes then return towards their breeding areas in spring (February to April, Figure 3C).
Similar to Icelandic puffins (Fayet et al., 2017), Faroese puffins can migrate as far as the Labrador and Irminger Seas in autumn (Figure 3A), but remain east of the Mid-Atlantic ridge during winter and spring (Figures 3B, C). They return to the Faroes in spring (see also Supplementary Figure S4). Puffins stay near the colony during the summer breeding season, though their foraging ranges can vary with food availability across seasons, between colonies and between years (Anker-Nilssen and Lorentsen, 1990).
According to the GLS data, Faroese guillemots stay relatively close to the Faroe shelf during autumn (Figure 3A), and primarily occupy the channel areas south and southwest of the Faroes (Faroe-Shetland Channel and the Faroe Bank Channel, Figure 3B) in winter. In spring, they shift northwest, to the waters between Iceland and the Faroe Islands (Figure 3C). No GLS data are yet available for Arctic terns from the Faroes (but see Discussion).
3.2 The 0-group fish species
The 0-group length index (ID. no 2) is, as mentioned, considered to be a primary ecological driver for the discussed species on the Faroe shelf, and peaks in this index are referred to as production peaks, which occurred in the following years: 1987, 1994, 2000, 2009 and 2017 (Jacobsen et al., 2019). Almost all these peaks are also accentuated in the individual abundance series (1983-present) for all four juvenile fish species that are included in the length index; cod, sandeel, Norway pout and haddock (IDs 3-6 in Figure 4, note that these are separate indices from the 0-group length index). The only exceptions are no peak in haddock abundance around 1987 and no peaks in sandeel abundance before 2000. Most peaks in abundance coincide with the 0-group length index peaks (same year), although many precede these with a year (Table 3). However, the amplitudes of the peak numbers do not reflect the amplitudes of the 0-group length index.
Cod: The numbers of juvenile cod precede the 1984, 1994 and 2017 peaks in the 0-group length index by one year, the large 2000 peak precedes by two years (Figure 4; Table 3), whereas the other three peaks (1987, 2009 and 2023) appear in the same year. The highest peak in numbers was in the late 1990s, and the amplitudes of the peaks have declined thereafter. This development is significantly correlated with the 0-group length index, though the Φ statistic is not significant (likely due to the recurrent one-year lags). Sandeel: Peaks in the numbers of juvenile sandeel started to emerge in 2000, and have subsequently been strong. These peaks can both lag (in 2001) and lead (in 2016) the 0-group peaks by one year. Statistical links to the 0-group length index are insignificant, likely due to the weak signal in the sandeel record before 2000. Norway pout: These peaks closely follow the 0-group index (both the correlation and the Φ statistic are significant), with only the 1995 peak preceded by a year. Like for sandeel, the amplitudes of Norway pout peaks have been high since the late 1990s. Haddock: This species had very pronounced peaks in 1983, 2000 and 2023, while the other peaks are less clear. As the sole species, haddock also had a peak in 2004. The correlation with the 0-group length index is significant, while the Φ statistic is not. The last peak (2023) in numbers of juvenile fish was record high for haddock, high for sandeel and Norway pout, and low for cod.
By extending the 0-group length index back to 1974, we reveal peaks in both 1974 and in 1983-1984. The 0-group length index shows a weak negative correlation with time (Spearman’s ρ = -0.34 p < 0.05, Supplementary Table S6; note that the plot in Figure 4 shows normalized values for plotting consistency, raw values are in Table S2).
3.3 Seabird production indices and lower trophic levels
As previously shown by Jacobsen et al. (2019), there is synchrony between peaks in primary production (PPI) and the size of juvenile fish (the 0-group length index) on the Faroe shelf (Figure 5; Table 4). All seabird records introduced here are assessed against these production peaks (Table 4). The updated lower trophic level records reveal an increasing 0-group from 2021 until a peak in 2024 and increased PPI in 2022, similarly followed by a peak in 2024 (Figure 5). Two weaker 0-group length index peaks, in 2004 and 2014, are also discernible in the PPI.
3.3.1 Structured/scientific monitoring
Terns: breeding success for the terns showed marked peaks in 2009 and 2017, concurrent with the prey production peaks. A weaker peak in the lower trophic levels in 2014 was also reflected in the tern breeding success. The statistical association with the 0-group length index is significant, both as represented by the correlation coefficient and the Φ statistic (Table 4). Except from 2008-2009, the tern breeding success was near zero during the entire 2004-2013 period.
Kittiwakes: The previously demonstrated link between the lower trophic level indicators and the kittiwake breeding success (Jacobsen et al., 2019) remains valid. All production peaks are evident in the kittiwake breeding success, including the recent high values in 2023-2024. The breeding success has additional peaks in 1990 and 2012, which do not appear to have corresponding counterparts on the Faroe shelf ecosystem (see Discussion). Both the correlation coefficient and the Φ statistic are significant (Table 4). Notably, except from 2009, nearly no kittiwake chicks survived in the years 2004 to 2015.
Guillemots: The number of breeding guillemot pairs exhibits rounded peaks, which are aligned with the production peaks, except in 2017. This record has not been updated since 2017. Very few guillemot pairs were observed in 1990-1991 and in 2005-2007. This metric is significantly correlated with the 0-group length index, while the Φ statistic is not significant. Unlike for the other seabird species discussed, the guillemot series does not show a great reduction during the 2004-2015 period.
Puffins: The two strong and broad peaks around 1995 and 2000, evident in all hitherto mentioned series, are also clear in the proportion of catches of < 3-year-old puffins in Nólsoy (Figures 1, 5); a puffin food proxy which is statistically associated with the 0-group length index (both the correlation and the Φ statistic). The 2017 peak and the high value in 2023 are clear in puffin breeding success, both from burrows in Skúvoy and Mykines. The statistical association between burrow data and the 0-group length index is not significant, although we should bear in mind that these records are on the shorter limit for making statistical inference.
The puffin reproductive success, based on camera recordings from Skúvoy, showed very few surviving chicks per year during 2010-2013, while the puffin chick survival indices from both Skúvoy (camera-based and manual) and Mykines (feces count) showed a clear and persistent improvement after 2014. It is noteworthy that the Mykines record reveals an additional peak in 2019 (Figure 5), which is not evident in any other of the presented records.
The years 2014-2015 mark a statistically significant shift to increased chick production, particularly for puffins, but also for the kittiwakes (t-test, Section 2.3). This change, hereafter referred to as the ‘post-2014 shift’, cannot be explained by the PPI or the 0-group length index alone, since these drivers do not exhibit any significant concurrent shift.
3.3.2 Citizen science assessment
The chick production peaks identified by the structured monitoring in 2009, 2017, 2023 and 2024 are all preceded by a ‘ramp up’ – in 2008 (2009), 2016 (2017) and 2022 (2023), respectively (Figure 5). The qualitative enumeration of the chick production status compiled from the citizen science web page (Section 2.2.7), supports these findings. All peaks, and their preceding ‘ramp up’ years, as listed above, are clearly evident in Table 5.
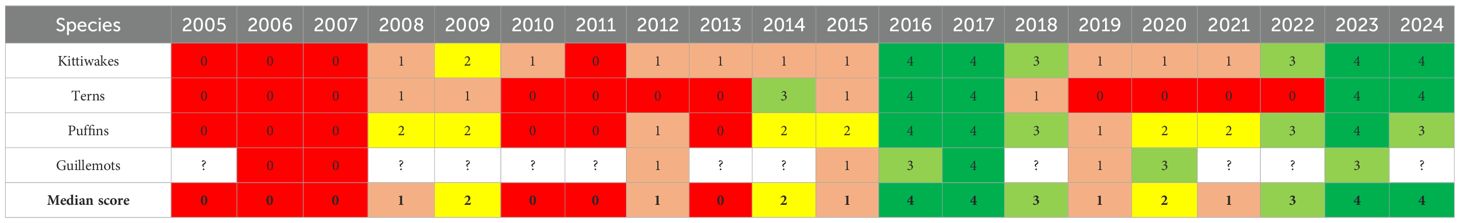
Table 5. Qualitative breeding success assessments of the discussed seabird species based on info derived from the web page www.jenskjeld.info, and applying the following semi-quantitative scheme: very good (4, dark green), good (3, light green), average (2, yellow), bad (1, beige) and very bad (0, red).
The post-2014 shift appears clearer in this data source compared with the scientific monitoring. Except for 2008–2009, all four seabird species experienced near-zero breeding success during the preceding low-production 2004-2014 decade (red, zero-values in Table 5), while only the terns have experienced such poor years after 2014 (in 2019 to 2022).
Kittiwakes, terns and puffins appear to have had successful years in 2023 and 2024. Guillemot population trends remain uncertain.
3.4 Longer-term trends
Long-term trends are assessed using the census of guillemots and kittiwakes, annual counts of guillemots and terns, and puffin harvest records.
Census: The total number of guillemots in the Faroe Islands has declined sharply from approximately 587,000 birds in 1972 to 311,000 birds in 1987. This was followed by a more gradual decline to 252,000 in 1997-1999 and 187,000 guillemots during the period 2007-2014 (Figure 6A). This gradual decline mirrored the numbers of kittiwakes in the Faroes, from 219,000 in 1987 to 159,000 in 1998 and further to 87,000 in 2014.
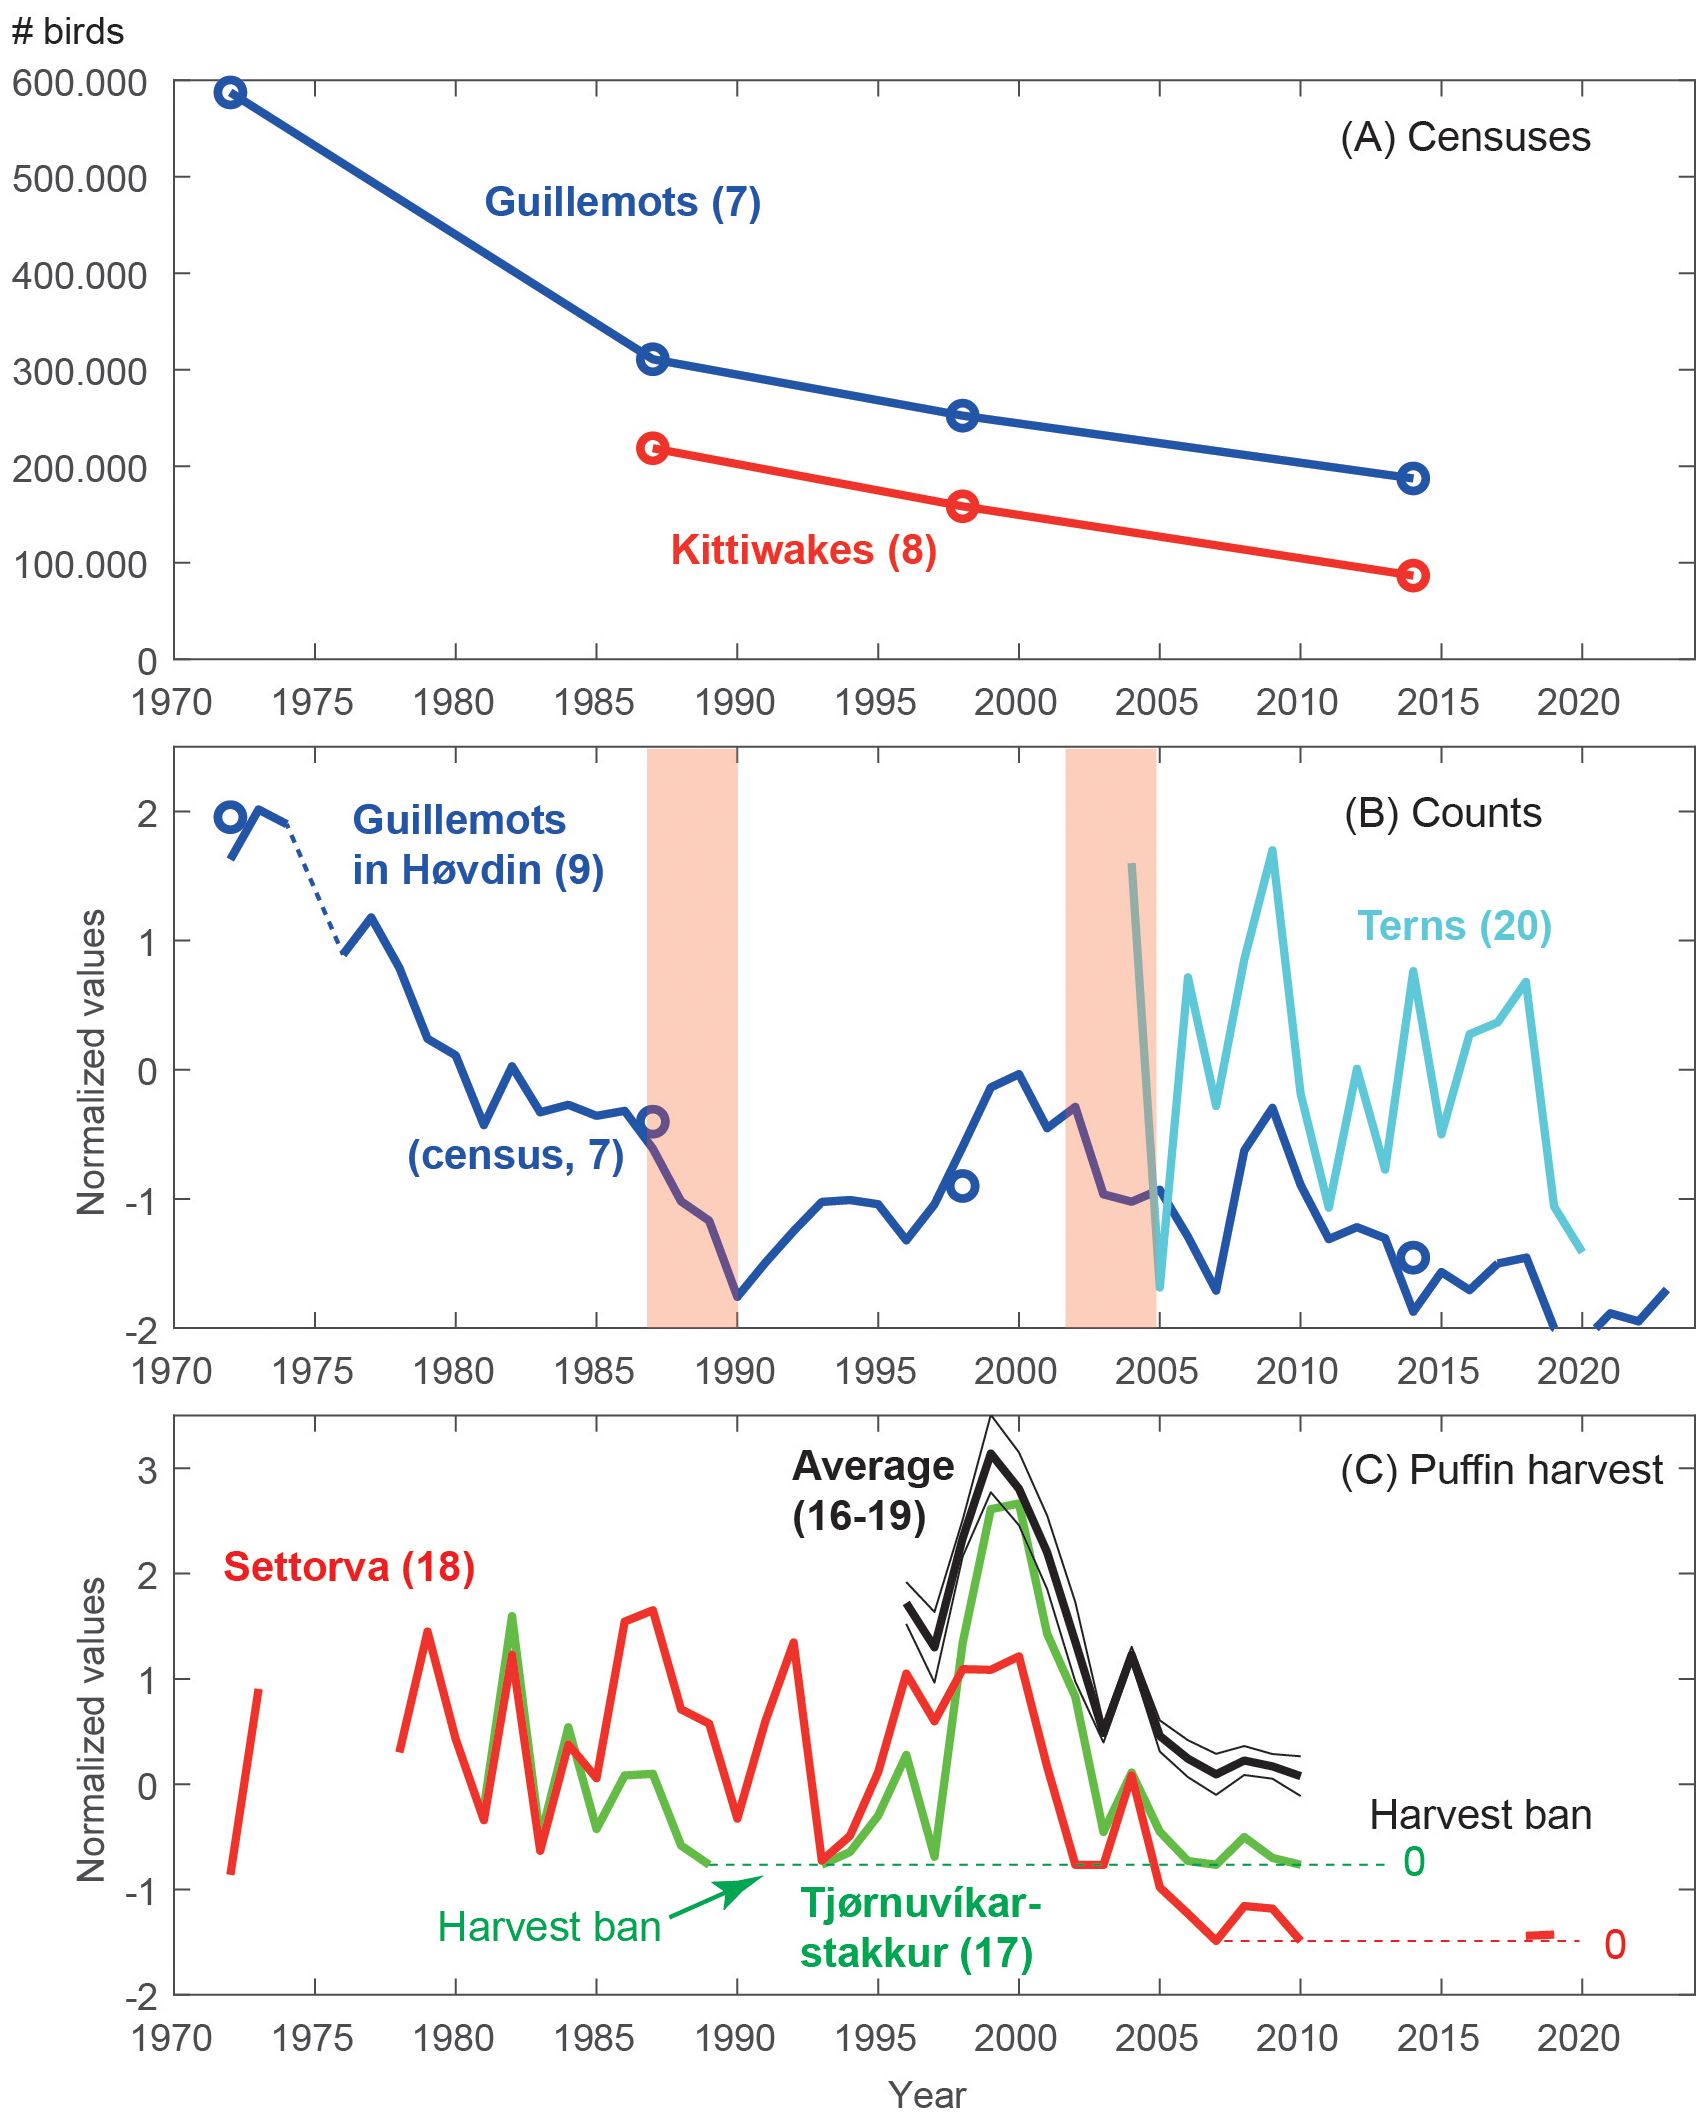
Figure 6. Long-term changes in seabird abundance in the Faroes. (A) Census of the total number of guillemots and kittiwakes in the Faroe Islands. (B) Annual counts of guillemots at the Høvdin monitoring station in Skúvoy (blue, see Figure 1) and total number of tern pairs in the Faroes (cyan). (C) Puffin harvest at the north shore of the Faroes (Settorva/Viðoy, red and Tjørnuvíksstakkur/Streymoy, green), as well as averages of normalized puffin harvest records from these two colonies and including also catch records from Nólsoy and Skúvoy (thick black, see text) ± the standard error (thin black). The pink shaded areas show periods with profound and large-scale decline in biological production in the northern North Atlantic (see Discussion). The number in parenthesis refers to the indicator ID (see Tables S1–S3).
Annual counts: Similar to the total censuses of guillemots, the guillemot attendance at Høvdin (section 2.2.2) has declined from approximately 9,500 birds in 1972 to 2,800 birds in the early 2020s – a reduction of about 70% (Figure 6B). As with the censuses, most of the decline took place before 1990 (~ -3,200 individuals/decade, r = -0.96, p < 0.001), while the decline after 1990 has been more moderate (~-440 individuals/decade, r = -0.49, p = 0.02). This similarity supports that the attendance of guillemots at Høvdin represents the entire Faroese population. The annual counts furthermore show that the abundance dropped drastically during the 1970s, became stable during the early 1980s (after summer harvest was banned), and continued to drop during the late 1980s. There was an increase through the 1990s, followed by yet another steep drop until 2007. After two good years in 2008-2009, the number of attending birds has continued to decrease. Figure 5 shows that the number of breeding guillemot pairs has remained relatively stable since 1987 (negligible trend), which means that the moderate decline in total number of birds after 1987 is primarily caused by a reduction in off-duty guillemots.
The number of tern pairs has fluctuated strongly with a weak negative trend (-1130 pairs/decade, r = -0.29, p = 0.26, Figure 6B). Large numbers of breeding pairs were observed in 2004, 2008–2009, and during a build-up until 2017, which is roughly in synchrony with the production peaks.
Puffin harvest: The two longest puffin fowling records, at Tjørnuvíksstakkur and Settorva (Section 2.2.5), show both similarities and dissimilarities (Figure 6C). The 1980s were characterized by strong synchronous fluctuations followed by a rapid drop after 1987. Due to the low number of birds, fowling in Tjørnuvíksstakkur was banned during the years 1989–1993. In contrast with all other series presented in this work, puffin fowling at Settorva increased sharply in 1991–1992, followed by a drop in 1993. The fowling increased again at both locations from 1995 until 1999–2000, declined dramatically until 2003, showed a small peak in 2004, followed by a further decline until fowling had been discontinued at most locations in 2010. Close covariability in harvest records from four main colonies (Tjørnuvíksstakkur, Settorva, Nólsoy and Skúvoy), illustrated by an average of standardized catches at these four colonies (black line in Figure 6C), shows that the negative trend in 1995–2010 likely reflected the total puffin harvest in the Faroes.
4 Discussion
In this paper, we have introduced several previously unpublished long-term indicators of seabird productivity in the Faroes using data from both scientific investigations and citizen science, and demonstrated that they can effectively complement existing lower trophic level indicator series. In addition to peaks in the 0-group length index in 1974 and 1983, all records are characterized by marked recurrent production peaks around 1987 (weak), 1994, 2000, 2009, 2017, and a recent weak peak after 2022. The seabird records are statistically linked to the production at lower trophic levels on the Faroe shelf, proxied by the 0-group length index, despite some minor discrepancies. This strongly indicates that breeding success of the four seabird species covered by the study is highly dependent on, and determined by, the local abundance of 0-group fish. Inter-specific differences in breeding success are likely related to differences in breeding biology (clutch size, incubation period, nestling period) feeding methods (surface plunging and underwater pursuit) and other factors, including anthropogenic influence, affecting their breeding performance and population dynamics. These cost-efficient indicators are therefore well-suited for understanding the trophic role and dynamics of Faroe seabird populations and predict future changes, as well as to inform management and guide further research and monitoring. As the seabirds’ own consumption only has the potential to significantly affect their prey stocks when food is scarce (Saraux et al., 2021), they are also known to respond in a rather uniform manner when the availability of forage fish drops below a critical level (Cury et al., 2011). The demonstrated fish-seabird synchrony thus strongly indicates that nowcasting using these early seabird indicators has potential to improve advice on commercial fish stock quotas. Fish stock assessment models need the inclusion of the 2–3-year-old age classes to converge, and presently reliable estimates of fish recruitment are delayed by this time frame (Beverton and Holt, 1993).
4.1 Ups and downs in seabird breeding success: the importance of food and large-scale oceanographic variability
While strong on-shelf primary production is key for supporting higher trophic levels on the Faroe shelf, other factors can be comparably important in determining overall ecosystem prosperity. This is discussed below.
The marked PPI fluctuations have previously been discussed in relation to nutrient (silicate) levels in the oceanic waters surrounding the Faroe shelf (Hátún et al., 2022a; Jacobsen et al., 2019), and to ocean-shelf interactions (Eliasen et al., 2017; Hansen et al., 2005). While growth of juvenile fish (0-group length index) is clearly related to the PPI, it also depends on the abundance of oceanic zooplankton, and thus influx of zooplankton to the Central Shelf (Jacobsen et al., 2025). The production peaks, here identified for the Faroe shelf, concur with intensified winter convection in the Irminger Sea, increased abundances of C. finmarchicus within the SPG in May, and peaks in total dry weight of zooplankton on the south Iceland shelf (primarily C. finmarchicus) (Hátún et al., 2016).
The GLS loggers significantly broaden our understanding of the non-breeding distribution of Faroese seabirds, which previously was based on recoveries of ringed birds (Hammer et al., 2014). The fact that kittiwakes occupy waters along the SW Greenland coast and Newfoundland (Figure 3) is in agreement with the ringing data. However, a detailed analysis of the logger data provides a more detailed picture of how the kittiwakes are drawn to an eddy-rich region in the northeastern Labrador Sea (Hátún et al., 2007) in autumn, and congregate along the strong ocean fronts, associated with the Northwestern Corner of the North Atlantic Current (see Figure 1) during winter; both regions that are impacted by the dynamics of the SPG. Our understanding of the non-breeding migration and ecology of Faroese puffins is consequently much improved compared to the uncertainties linked to the ringing data. A large percentage of puffins target the mixing region between subarctic and warmer and more saline Atlantic water in the Rockall region (see Figure 1), whose marine climate is strongly regulated by the SPG (Hátún et al., 2005). The guillemot’s apparent occupation of the Faroe-Shetland Channel during winter contrasts with previous assumptions based on ringing (Olsen, 1980), which suggested that this species migrates primarily towards the Norwegian coast during fall/winter. The cause of this discrepancy is simply that recoveries of ringed birds are totally dependent on human presence, which is not only extremely unevenly distributed, but virtually non-existent at sea outside of key fishing areas and periods. Although no GLS data are yet available for Faroese terns, we know from other colonies in the North Atlantic that they perform an impressive migration towards Antarctica. Furthermore, this trip includes a ‘stop-over’ near the ‘Northwestern Corner’ (Figure 1), now the designated marine protected area North Atlantic Current and Evlanov Sea-basin (NACES) (Egevang et al., 2010; Morten et al., 2023; Skyllas et al., 2023), which is an important staging area for a wide variety of North Atlantic seabirds (Davies et al., 2021).
The large peaks in the 0-group length index in 1974 and 1983 (Figure 4) concur with very deep convection in the Labrador and Irminger Seas (Hátún et al., 2016). These peaks also coincide with strong recruitment peaks for both benthic fish stocks on the Faroe shelf (cod and haddock) (ICES, 2023) and for seabird reproduction in Norway (Anker-Nilssen and Røstad, 1993; Vader et al., 1990). This underscores the geographically and trophically extensive imprint of the signals discussed here. The dramatic drops in both guillemot and puffin abundances during the late 1980s (Figure 6) were most likely caused by large-scale oceanographic changes accompanied by an associated deteriorated food supply. Convection in the Irminger Sea gradually weakened after the mid-1980s, and a concurrent drop in both the pre-bloom silicate concentration (Hátún et al., 2017a) and krill abundance occurred after 1987 - across the SPNA (Edwards et al., 2021), as well as in the Faroe 0-group length index (Figures 5, 6). Equally severe trends were also observed in Norwegian auk colonies during the 1980s (Anker-Nilssen and Røstad, 1993; Vader et al., 1990).
The increase in guillemot attendance and puffin abundance through the 1990s is likely linked to one or more of the following causes: much-improved breeding success in 1993-1996, reduced mortality during the non-breeding seasons, limited hunting and increased food availability near the colonies in the breeding season. Food availability, as proxied by the quality of the key fish species fed to the chicks, has been shown to significantly increase puffin colony attendance (Anker-Nilssen et al., 2024), and the 0-group length index was indeed higher than average in 1993-1995. Convection and the SPG circulation intensified in the early 1990s (Hátún et al., 2005; Yashayaev and Loder, 2017), pre-bloom silicate concentrations increased through the mid-1990s (Hátún et al., 2017a) and the euphausiid abundances increased up to 1998 (Edwards et al., 2021). Additionally, large, lipid-rich copepods (Calanus hyperboreus and large stages of C. finmarchicus) from the East Icelandic Current continued to flow into the southern Norwegian Sea throughout the 1990s, providing a high-quality food source for seabirds during the breeding season (Kristiansen et al., 2016; Skagseth et al., 2022).
The abundances of Faroese guillemots and puffins dropped again in the early 2000s, and following this detrimental shift the breeding success was nearly zero for many seabird species for many consecutive years (except in 2009) (Figure 6). The combined influence of a very weak SPG, much increased northward flow of nutrient poor subtropical water from the Bay of Biscay (González-Pola et al., 2025) together with a suddenly weakened Norwegian Sea Gyre (Hátún et al., 2021) and reduced influx from the East Icelandic Current around 2003 (Kristiansen et al., 2019), resulted in high temperatures and salinities, and low silicate content, in the NE Atlantic and the Nordic Seas. Concurrent with this shift, the abundance of the nutritious oceanic zooplankton declined (Kristiansen et al., 2019), the sandeel abundance declined (ICES, 2018) and the prosperity of several seabird species along most of the European margin declined strongly (Burnell et al., 2023; Coulson, 2011), including puffins at the world’s largest colonies in the Westman Islands on the south Iceland shelf and in the Røst archipelago of the Lofoten Islands in NW Norway (e.g. Layton-Matthews et al., 2023). It is thus plausible that these oceanographic changes may have caused the poor conditions on the Faroe shelf after 2003. Whether causal environmental effects were via a reduction in ocean-shelf nutrient onwelling (Eliasen et al., 2017), scarcity of oceanic zooplankton (Jacobsen et al., 2025), a direct temperature influence on e.g., sandeel (Eliasen et al., 2011), or a combination of these mechanisms, remains an open question.
Intensified convection in the Labrador-Irminger Seas after 2014 (Yashayaev and Loder, 2016) managed to re-invigorate the SPG (Hátún and Chafik, 2018), which caused the most rapid salinity drop in historical records in the same region (Holliday et al., 2020). Adding to this turn towards more subarctic conditions, the East Icelandic Current influx increased yet again around 2017, which immediately brought more of the subarctic copepods to the waters north of the Faroes, and even east to the Norwegian slope (Kristiansen et al., 2022; Skagseth et al., 2022). The demonstrated improvement for both kittiwake and puffins, relative to the 2004-2014 decade (Figure 6), could therefore also be driven by large-scale oceanographic changes; a statement supported by the fact that both the 0-group length index and the PPI were below average during 2018-2020. Note that there was reduced scientific monitoring of terns after 2019. And in recent years, there has been puffin fowling in some of the colonies where the fowlers have seen an improvement in the population. The low-productivity decade 2004-2014 has also been referred to as the Atlantic period (Hátún et al., 2022b; Skagseth et al., 2022).
After much reduced mixed layer depths in the Labrador Sea in winter 2020-2021, convection intensified again in winter 2022-2023 (Tesdal et al., 2022), after which many of the presented indicator records show an upturn and are followed by a peak in 2023. Winters with strong convection in the Labrador and Irminger Sea and intensified SPG are generally associated with a high North Atlantic Oscillation (NAO) index (Hátún et al., 2016; Hurrell, 1995).
While sandeel and Norway pout are principal food items for Faroese puffins, adult birds can prey on capelin (Falk et al., 1992; Harris et al., 2015), and also bring juvenile capelin to their chicks (Joensen and Tåning, 1970; Supplementary Table S4). Capelin is a key prey species for puffins in northern Iceland, and an expatriate fish species transported from Icelandic waters towards the Faroes. This drift likely occurs in a low-salinity surface layer of the East Icelandic Current from the north Iceland slope towards the north Faroe slope (Perkins et al., 1998), although more research is required to firmly demonstrate this. The largest observed abundance of capelin on the Faroe shelf occurred in June 1991 (Jákupsstovu and Reinert, 2002), and during the same year, puffin carried juvenile capelin (on average 46 mm long, Supplementary Table S4) to their chicks, at almost equal rates as sandeel; something that is highly unusual (Joensen and Tåning, 1970). One can thus speculate whether this influx of capelin can also have caused the anomalous peak in puffin catches in the northern island of Viðoy (Settorva colony) in 1991-1992 (Figure 4C). In this context, it is worth noting that the 1990-1991 peak in kittiwake breeding success coincides with increased zooplankton abundances south of Iceland (Hátún et al., 2017b). Large numbers of juvenile capelin were again observed in FAMRI’s spring sprat and sandeel surveys in and near Faroese fjords in 2020 (www.hav.fo/utgavur/turfragreidingar/#2020), and subsequently out on the Faroe shelf in 2021 (Supplementary Figures S5, S6). These were years with both low PPI (Figure 3), and when puffins had high reproductive success, unlike the terns and kittiwakes. Again, it was noticed that puffins carried capelin to the burrows (Bergur Olsen, pers. obs; Rúni Poulsen pers. comm.). We therefore postulate that anomalous influxes of capelin can improve survival of puffin chicks on the Faroe shelf, especially during generally unproductive years (low PPI). Could e.g., the increased production of puffin chicks in Mykines in 2019, when other seabird species experienced a poor success (Figure 6), be explained by an influx burst of capelin?
4.2 Trends and outlook
Reductions in seabird colonies around the SPNA during several decades is an indisputable fact, and the Faroese guillemot population dropped, as mentioned, markedly from the late 1950s to the early 1970s (Nørrevang, 1977; Olsen, 1990). The presented census of guillemots and kittiwakes for the entire Faroes, and the annual counts of guillemot attendance at the Høvdin monitoring site demonstrate a continuation of this unfortunate negative trend since the early 1970s, with the steepest drop from 1972 to around 1990 (Figure 4B). This development is further supported by guillemot counts for the whole of Skúvoy, the island with the largest guillemot population (Olsen et al., 2024). The spatially complete, albeit infrequent censuses, and the annual counts at a key colony thus complement each other, showing that the records from the Høvdin monitoring station likely represent the entire country, and that trends from the census should be interpreted in light of interannual variability.
Peaks and long-term shifts after 1990 dominate many of the seabird records presented here, making it difficult to discern trends. Although the PPI does not exhibit any trend (Figure 6), the winter (pre-bloom) silicate concentration and the krill abundance in the SPNA have, as mentioned, decreased since the early 1980s, with major drops in the late 1980s and in the early 2000s (Hátún et al., 2017a; Edwards et al., 2021). Furthermore, the 0-group length index exhibits a negative trend (Figure 5), meaning that juvenile fish in the Faroe shelf in late June have become smaller since the early 1970s.
Determining whether a current or recent change represents a temporary pulse, a shift to a new state, or a continuing trend is complex. The Intergovernmental Panel on Climate Change projects reductions in animal biomass at lower latitudes over the next century due to global warming, primarily because of increased seawater stratification and reduced nutrient upwelling (Pörtner et al., 2019). The most dramatic reduction is expected to take place in the northeastern Atlantic, likely because this region is sensitive to convection processes. If the post-2014 shift was only a temporary ‘relief’ from continuing trends of e.g., warming and nutrient decline, a worst-case scenario could be a drastic reduction of some seabird species from the Faroe shelf. This underscores the importance of maintaining seabird indicator records, like those presented here. Although we have demonstrated the validity of these indicators there is definitely room for improvements, e.g., by better use of modern technology such as automated camera surveillance systems, machine learning models for image analysis and drones (Edney et al., 2023). Although the implementation of such techniques will require time and money, continued and facilitated seabird monitoring can provide early signals for fish recruitment and important ecological change (Frederiksen et al., 2007; Lorentsen et al., 2018; Sydeman et al., 2017), and such efforts are still relatively inexpensive. Monitoring population trends, breeding performance and diets of seabirds are thus a highly valuable and cost-efficient element when building the competence for a more ecosystem-based management of marine resources.
5 Conclusions
We have presented several novel and decades-long data series on seabirds from the Faroe Islands. These include chick production (breeding success) of Arctic terns, black-legged kittiwakes, common guillemots and Atlantic puffins, population trends of the terns, kittiwakes and guillemots and long-term hunting statistics of Atlantic puffins. We show that these records closely reflect marked changes in lower trophic levels on the Faroe shelf, proxied by updated indices of primary production and the abundance and sizes of juvenile fish. The new and updated seabird indicators reflect both the recurrent production peaks in lower trophic levels, as well as longer-term shifts that also impact breeding numbers and success of seabirds and recruitment to several commercial fish stocks in Faroese waters. With these time series, we have obtained new and useful ecological indicator records for higher trophic levels on the Faroe shelf, and likely the wider subpolar North Atlantic as well, which can support rational management of marine resources in these biologically productive waters.
Data availability statement
The original contributions presented in the study are included in the article/Supplementary material, further inquiries can be directed to the corresponding author/s.
Ethics statement
Ethical approval was not required for the study involving animals in accordance with the local legislation and institutional requirements because This has, hitherto, not been a requirement in the Faroe Islands.
Author contributions
BO: Data curation, Funding acquisition, Investigation, Project administration, Resources, Writing – original draft, Writing – review & editing. TA-N: Writing – original draft, Writing – review & editing. JD: Data curation, Investigation, Resources, Writing – original draft, Writing – review & editing. EG: Data curation, Investigation, Writing – review & editing. LH: Data curation, Investigation, Writing – review & editing. SJ: Conceptualization, Data curation, Formal analysis, Investigation, Methodology, Visualization, Writing – original draft, Writing – review & editing. JJ: Data curation, Investigation, Writing – original draft, Writing – review & editing. RO: Data curation, Investigation, Writing – original draft, Writing – review & editing. IS: Formal analysis, Methodology, Writing – original draft, Writing – review & editing. HH: Conceptualization, Formal analysis, Methodology, Writing – original draft, Writing – review & editing.
Funding
The author(s) declare that financial support was received for the research and/or publication of this article. Faroe Marine Research Institute has allocated resources for monitoring juvenile fisheries and seabirds for the last half decade. This is based on permanent governmental funding, and a broad selection of scientific projects.
Acknowledgments
Anna and Óli Jákup Hentze from Skúvoy are recognized for their remarkable half a century commitment to hosting the principal seabird counter (BO). A huge thanks to the large number of volunteers, who helped collecting the Arctic tern data. The current and previous research staff of the Fisheries and Marine Research Institute (FAMRI) are also acknowledged for their dedicated field data collection.
Conflict of interest
The authors declare that the research was conducted in the absence of any commercial or financial relationships that could be construed as a potential conflict of interest.
The reviewer HH declared a past collaboration with the author TA-N to the handling editor.
Generative AI statement
The author(s) declare that no Generative AI was used in the creation of this manuscript.
Publisher’s note
All claims expressed in this article are solely those of the authors and do not necessarily represent those of their affiliated organizations, or those of the publisher, the editors and the reviewers. Any product that may be evaluated in this article, or claim that may be made by its manufacturer, is not guaranteed or endorsed by the publisher.
Supplementary material
The Supplementary Material for this article can be found online at: https://www.frontiersin.org/articles/10.3389/fmars.2025.1544866/full#supplementary-material
References
Ainley D. G., Nettleship D. N., Storey A. E. (2021). “Common murre (Uria aalge),” in Birds of the World. Eds. Billerman S. M., Rodewald P. G., Keeney B. K. (Cornell Lab of Ornithology). doi: 10.2173/bow.commur.02
Anker-Nilssen T., Kadin M., Hilde C. H. (2024). Stay or go? Changing breeding conditions affect sexual difference in colony attendance strategies of Atlantic puffins Fratercula arctica. Ecol. Evol. 14, 1–10. doi: 10.1002/ece3.11681
Anker-Nilssen T., Lorentsen S.-H. (1990). Distribution of Fratercula arctica feeding off Røst, northern Norway, during the breeding season, in relation to chick growth, prey and oceanographical parameters. Polar Res. 8, 67–76. doi: 10.3402/polar.v8i1.6805
Anker-Nilssen T., Røstad O. W. (1993). Census and monitoring of Puffins Fratercula arctica on Røst, N Norway 1979-1988. Ornis Scand. 24, 1–9. doi: 10.2307/3676402
Barrett R. T., Lorentsen S.-H., Anker-Nilssen T. (2006). The status of seabirds breeding in mainland Norway, in Atlantic Seabirds, 97–126. Available at: https://www.seabirdgroup.org.uk/journals/atlantic-seabirds-8/as-8-3.pdf
Beverton R. J. H., Holt S. J. (1993). On the Dynamics of Exploited Fish Populations (Dordrecht: Springer Netherlands). doi: 10.1007/978-94-011-2106-4
Bloch D., Fuglø E. (1999). Villini súgdjór í Útnorðri (Tórshavn: Føroya Náttúrugripasavn og Føroya Skúlabókagrunnur).
Bloch D., Sørensen S. (1983). Yvirlit yvir Føroya fuglar. Fróðskaparrit 31, 1–84. doi: 10.18602/fsj.v31i.549
Brun E. (1979). “Present status and trends in population of seabirds in Norway,” in Conservation of Marine Birds of Northern North America. Eds. Bartonek J. C., Nettleship D. N. (U.S. Department of the Interior, Fish & Wildlife Service Report 11), 289–231. Available at: https://uploads.guim.co.uk/2024/09/16/Brun_1979_USFS_Wild_Res_Rep.pdf.
Burnell D., Perkins A. J., Newton S. F., Bolton M., Tierney T. D., Dunn T. E. (2023). Seabird counts - A census og breeding seabirds in Britain and Ireland, (2015-2021) (Barcelona: Lynx Nature Books).
Cheetham A. H., Hazel H. E. (1969). Binary (presence–absence) similarity coefficients. Paleontology 43, 1130–1136. Available at: https://www.jstor.org/stable/1302424.
Coulson J. C. (2016). A review of philopatry in seabirds and comparisons with other waterbird species. Waterbirds 39, 229–326. doi: 10.1675/063.039.0302
Croxall J. P. (1987). Seabirds: feeding ecology and role in marine ecosystems (Cambridge University Press).
Croxall J. P., Butchart S. H. M., Lascelles B. E. N., Stattersfield A. J., Sullivan B., Symes A., et al. (2012). Seabird conservation status and threats: A global assessment of priorities. Bird Conserv. Int. 22, 1–34. doi: 10.1017/S0959270912000020
Cury P. M., Boyd I. L., Bonhommeau S., Anker-Nilssen T., Crawford R. J. M., Furness R. W., et al. (2011). Global seabird response to forage fish depletion - One-third for the birds. Sci. (80-.). 334, 1703–1706. doi: 10.1126/science.1212928
Davies T. E., Carneiro A. P. B., Tarzia M., Wakefield E., Hennicke J. C., Frederiksen M., et al. (2021). Multispecies tracking reveals a major seabird hotspot in the North Atlantic. Conserv. Lett. 14, 1–14. doi: 10.1111/conl.12824
Dias M. P., Martin R., Pearmain E. J., Burfield I. J., Small C., Phillips R. A., et al. (2019). Threats to seabirds: A global assessment. Biol. Conserv. 237, 525–537. doi: 10.1016/j.biocon.2019.06.033
Durant J., Hjermann D., Frederiksen M., Charrassin J., Le Maho Y., Sabarros P., et al. (2009). Pros and cons of using seabirds as ecological indicators. Clim. Res. 39, 115–129. doi: 10.3354/cr00798
Dyck J., Meltofte H. (1975). The guillemot (Uria aalge) population of the Faeroes 1972. Dansk Ornitol. Foren. Tidsskr. 69, 55–64.
Edney A. J., Hart T., Jessopp M. J., Banks A., Clarke L. E., Cugniere L., et al. (2023). Best practice for using drones for seabird monitoring. Mar. Ornithol. 51, 265–280.
Edwards M., Hélaouët P., Goberville E., Lindley A., Tarling G. A., Burrows M. T., et al. (2021). North Atlantic warming over six decades drives decreases in krill abundance with no associated range shift. Commun. Biol. 4, 1–10. doi: 10.1038/s42003-021-02159-1
Egevang C., Stenhouse I. J., Phillips R. A., Petersen A., Fox J. W., Silk J. R. D. (2010). Tracking of Arctic terns Sterna paradisaea reveals longest animal migration. Proc. Natl. Acad. Sci. 107, 2078–2081. doi: 10.1073/pnas.0909493107
Eliasen K., Reinert J., Gaard E., Hansen B., Jacobsen J., Grønkjær P., et al. (2011). Sandeel as a link between primary production and higher trophic levels on the Faroe shelf. Mar. Ecol. Prog. Ser. 438, 185–194. doi: 10.3354/meps09301
Eliasen S. K., Hátún H., Larsen K. M. H., Jacobsen S. (2017). Faroe shelf bloom phenology – The importance of ocean-to-shelf silicate fluxes. Cont. Shelf Res. 143, 43–53. doi: 10.1016/j.csr.2017.06.004
Falk K., Jensen J., Kampp K. (1992). Winter diet of Atlantic puffins (Fratercula arctica) in the Northeast Atlantic. Colon. Waterbirds 15, 230–235. doi: 10.2307/1521457
Fauchald P., Anker-Nilssen T., Barrett R. T., Bustnes J. O., Bårdsen B. J., Christensen-Dalsgaard S. (2015). The status and trends of seabirds breeding in Norway and Svalbard. Available online at: https://www.nina.no/archive/nina/PppBasePdf/rapport%5C2015%5C1151.pdf.
Fayet A. L., Clucas G. V., Anker-Nilssen T., Syposz M., Hansen E. S. (2021). Local prey shortages drive foraging costs and breeding success in a declining seabird, the Atlantic puffin. J. Anim. Ecol. 90, 1152–1164. doi: 10.1111/1365-2656.13442
Fayet A. L., Freeman R., Anker-Nilssen T., Diamond A., Erikstad K. E., Fifield D., et al. (2017). Ocean-wide drivers of migration strategies and their influence on population breeding performance in a declining seabird. Curr. Biol. 27, 3871–3878.e3. doi: 10.1016/j.cub.2017.11.009
Frederiksen M., Mavor R., Wanless S. (2007). Seabirds as environmental indicators: the advantages of combining data sets. Mar. Ecol. Ser. 352, 205–211. doi: 10.3354/meps07071
Frederiksen M., Moe B., Daunt F., Phillips R. A., Barrett R. T., Bogdanova M. I., et al. (2012). Multicolony tracking reveals the winter distribution of a pelagic seabird on an ocean basin scale. Divers. Distrib. 18, 530–542. doi: 10.1111/j.1472-4642.2011.00864.x
Frederiksen M., Wanless S., Harris M. P., Rothery P., Wilson L. J. (2004). The role of industrial fisheries and oceanographic change in the decline of North Sea black-legged kittiwakes. J. Appl. Ecol. 41, 1129–1139. doi: 10.1111/j.0021-8901.2004.00966.x
Furness R. W. (1988). The predation of tern chicks by sheep. Bird Study 35, 199–202. doi: 10.1080/00063658809476989
Gaard E., Hansen B., Heinesen S. P. (1998). Phytoplankton variability on the Faroe Shelf. ICES J. Mar. Sci. 55, 688–696. doi: 10.1006/jmsc.1998.0373
Gaard E., Hansen B., Olsen B., Reinert J. (2002). “Ecological features and recent trends in the physical environment, plankton, fish stocks, and seabirds in the Faroe Shelf ecosystem,” in Large Marine Ecosystems of the North Atlantic. Eds. Sherman K., Skjoldal H. R. (Elsevier Science), 245–265. doi: 10.1016/S1570-0461(02)80060-X
Gilbert G., Gibbons D. W., Evans J. (1998). Bird Monitoring Methods: A Manual of Techniques for Key UK Species (RSPB, Cornell University).
González-Pola C., Somavilla R., Graña R., Viloria A., Ibáñez-Tejero L. (2025). A decade-long flow reversal in the intergyre region of the eastern north Atlantic. Prog. Oceanogr. 231, 103406. doi: 10.1016/j.pocean.2024.103406
Grimmett R. F. A., Jones T. A. (1989). Important bird areas in Europe (Cambridge: International Council for Bird Preservation).
Hammer S., Madsen J. J., Jensen J., Pedersen K. T., Bloch D., Thorup K. (2014). The Faroese Bird Migration Atlas (Tórshavn: Faroe University Press).
Hansen B., Eliasen S. K., Gaard E., Larsen K. M. H. (2005). Climatic effects on plankton and productivity on the Faroe Shelf. ICES J. Mar. Sci. 62, 1224–1232. doi: 10.1016/j.icesjms.2005.04.014
Hansen E. S., Sandvik H., Erikstad K. E., Yoccoz N. G., Anker-Nilssen T., Bader J., et al. (2021). Centennial relationships between ocean temperature and Atlantic puffin production reveal shifting decennial trends. Glob. Change Biol. 27, 3753–3764. doi: 10.1111/gcb.15665
Harris M. P., Anker-Nilssen T., McCleery R. H., Erikstad K. E., Shaw D. N., Grosbois V. (2005). Effect of wintering area and climate on the survival of adult Atlantic puffins Fratercula arctica in the eastern Atlantic. Mar. Ecol. Prog. Ser. 297, 283–296. doi: 10.3354/meps297283
Harris S. M., Descamps S., Sneddon L. U., Bertrand P., Chastel O., Patrick S. C. (2020). Personality predicts foraging site fidelity and trip repeatability in a marine predator. J. Anim. Ecol. 89, 68–79. doi: 10.1111/1365-2656.13106
Harris M. P., Leopold M. F., Jensen J., Meesters E. H., Wanless S. (2015). The winter diet of the Atlantic Puffin Fratercula arctica around the Faroe Islands. Ibis (Lond. 1859). 157, 468–479. doi: 10.1111/ibi.12272
Hatch J. J., Gochfeld M., Burger J., Garcia E. (2020). “Arctic tern (Sterna paradisaea),” in Birds of the World. Ed. Billerman S. M. (Cornell Lab of Ornithology). doi: 10.2173/bow.arcter.01
Hátún H., Azetsu-Scott K., Somavilla R., Rey F., Johnson C., Mathis M., et al. (2017a). The subpolar gyre regulates silicate concentrations in the North Atlantic. Sci. Rep. 7, 14576. doi: 10.1038/s41598-017-14837-4
Hátún H., Chafik L. (2018). On the recent ambiguity of the North Atlantic subpolar gyre index. J. Geophys. Res. Ocean. 123, 5072–5076. doi: 10.1029/2018JC014101
Hátún H., Chafik L., Larsen K. M. H. (2021). The Norwegian sea gyre – A regulator of Iceland-Scotland ridge exchanges. Front. Mar. Sci. 8. doi: 10.3389/fmars.2021.694614
Hátún H., Eriksen C. C., Rhines P. B. (2007). Buoyant eddies entering the Labrador Sea observed with gliders and altimetry. J. Phys. Oceanogr. 37, 2838–2854. doi: 10.1175/2007JPO3567.1
Hátún H., Larsen K. M. H., Eliasen S. K., Mathis M. (2022a). “Major nutrient fronts in the northeastern Atlantic – from the subpolar gyre to adjacent shelves,” in Chemical Oceanography of Frontal Zones, 97–141. doi: 10.1007/978-3-662-65839-0
Hátún H., Lohmann K., Matei D., Jungclaus J. H., Pacariz S. V., Bersch M., et al. (2016). An inflated subpolar gyre blows life toward the northeastern Atlantic. Prog. Oceanogr. 147, 49–66. doi: 10.1016/j.pocean.2016.07.009
Hátún H., Olsen B., Pacariz S. V. (2017b). The dynamics of the North Atlantic subpolar gyre introduces predictability to the breeding success of kittiwakes. Front. Mar. Sci. 4. doi: 10.3389/fmars.2017.00123
Hátún H., Payne M. R., Beaugrand G., Reid P. C., Sandø A. B., Drange H., et al. (2009). Large bio-geographical shifts in the north-eastern Atlantic Ocean: From the subpolar gyre, via plankton, to blue whiting and pilot whales. Prog. Oceanogr. 80, 149–162. doi: 10.1016/j.pocean.2009.03.001
Hátún H., Sandø A. B., Drange H., Hansen B., Valdimarsson H. (2005). Influence of the Atlantic subpolar gyre on the thermohaline circulation. Science 309, 1841–1844. doi: 10.1126/science.1114777
Hátún H., Silva T. S. G., Skagseth Ø., Grønkjær P. (2022b). Editorial: Physical drivers of biogeographical shifts in the Northeastern Atlantic – and adjacent shelves. Front. Mar. Sci. 9. doi: 10.3389/fmars.2022.1062204
Holliday N. P., Bersch M., Berx B., Chafik L., Cunningham S., Florindo-López C., et al. (2020). Ocean circulation causes the largest freshening event for 120 years in eastern subpolar North Atlantic. Nat. Commun. 11, 585. doi: 10.1038/s41467-020-14474-y
Hurrell J. W. (1995). Decadal trends in the North-Atlantic oscillation - regional temperatures and precipitation. Science 269, 676–679. doi: 10.1126/science.269.5224.676
ICES (2018). Report of the Herring Assessment Working Group for the Area South of 62°N (HAWG). doi: 10.17895/ices.pub.5307
ICES (2023). Northwestern Working Group (NWWG) Vol. 5 (ICES Sci. Reports). doi: 10.17895/ices.pub.23267153
Jacobsen S., Gaard E., Hátún H., Steingrund P., Larsen K. M. H., Ólafsdóttir S. R., et al. (2019). Environmentally driven ecological fluctuations on the faroe shelf revealed by fish juvenile surveys. Front. Mar. Sci. 6, 559. doi: 10.3389/fmars.2019.00559
Jacobsen S., Vang H.B.M., Eliasen S.K., Larsen K.M.H., Gaard E., Grønkjær P., et al. (2025). Identifying a growth and survival bottle neck: Oceanic zooplankton abundance and Faroe shelf primary production jointly influence the survival of Faroe Plateau cod larvae. J Plankton Res. In press.
Jákupsstovu S. H. Í., Reinert J. (2002). Capelin in Faroese waters - A messenger of harsh times? ICES J. Mar. Sci. 59, 884–889. doi: 10.1006/jmsc.2002.1245
Jensen J. K., Olsen B. (2020). Traditions for puffin fowling in the Faroe Islands the last decades. J. Nat. Faroe Islands 1, 1–17.
Joensen J. S., Tåning V. (1970). “Marine and freshwater fishes,” in The Zoology of the Faroes. Veld. Eds. Sparck R., Tuxen S. L. (Pedersen Bogtrykkeri, Copenhagen), 53–241.
Keogan K., Daunt F., Wanless S., Phillips R. A., Alvarez D., Anker-Nilssen T., et al. (2022). Variation and correlation in the timing of breeding of North Atlantic seabirds across multiple scales. J. Anim. Ecol. 91, 1797–1812. doi: 10.1111/1365-2656.13758
Kristiansen I., Gaard E., Hátún H., Jónasdóttir S., Ferreira A. S. A. (2016). Persistent shift of Calanus spp. in the southwestern Norwegian Sea since 2003, linked to ocean climate. ICES J. Mar. Sci. 73, 1319–1329. doi: 10.1093/icesjms/fsv222
Kristiansen I., Hátún H., Jacobsen J. A., Eliasen S. K., Petursdottir H., Gaard E. (2022). Spatial variability of the feeding conditions for the Norwegian spring spawning herring in May. Front. Mar. Sci. 9. doi: 10.3389/fmars.2022.823006
Kristiansen I., Hátún H., Petursdóttir H., Gislason A., Broms C., Melle W., et al. (2019). Decreased influx of Calanus spp. into the south-western Norwegian Sea since 2003. Deep Sea Res. Part I Oceanogr. Res. Pap. 149, 103048. doi: 10.1016/j.dsr.2019.05.008
Layton-Matthews K., Reiertsen T. K., Erikstad K., Anker-Nilssen T., Daunt F., Wanless S., et al. (2023). Consequences of cross-season demographic correlations for population viability. Ecol. Evol. 13, 1–12. doi: 10.1002/ece3.10312
Lorentsen S.-H., Anker-Nilssen T., Erikstad K. (2018). Seabirds as guides for fisheries management: European shag Phalacrocorax aristotelis diet as indicator of saithe Pollachius virens recruitment. Mar. Ecol. Prog. Ser. 586, 193–201. doi: 10.3354/meps12440
Maunder J. E., Threlfall W. (1972). The breeding biology of the black-legged kittiwake in Newfoundland. Auk 89, 789–816. doi: 10.2307/4084109
Strøm H., Bråthen V., Descamps S., Fauchald P., Moe B., Tarroux A., et al. (2024). SEATRACK Preliminary Annual Report 2024 (Norwegian Polar Institute & Norwegian Institute for Nature Research).https://hdl.handle.net/11250/3161788
Morten J. M., Buchanan P. J., Egevang C., Glissenaar I. A., Maxwell S. M., Parr N., et al. (2023). Global warming and Arctic terns: Estimating climate change impacts on the world’s longest migration. Glob. Change Biol. 29, 5596–5614. doi: 10.1111/gcb.16891
Nørrevang A. (1977). Ringmerking av lomviga ı́ Føroyum. (Ringing of guillsmots in the Faroes). Report to Føroya Løgting. Tórshavn.
Olsen B. (1990). Metoder til optælling av lomvier Uria aalge i de færøske fuglefjelde. (Monitoring methods for guillemots Uria aalge in the Faroese bird cliffs). Master thesis. Copenhagen: Zoological Museum.
Olsen B. (1992). Teljingar av lomviga ı́ Høvdanum á Skúvoynni 1973 til 1991. (Monitoring of guillemots in Høvdin, Skúvoy, 1973-1991). Fiskirannsóknir 7, 6–15. Tórshavn.
Olsen B. (2010). Heiðafuglur í Skúvoy 2010 (Inland birds on Skúvoy 2010). Report, Faroe Marine Research Institute. Tórshavn.
Olsen I., Hammer S., Dinesen L., Sonne J. (2024). Population trends of marine versus terrestrial bird species on Skúgvoy, Faroe Islands 1961–2023. Bird Study, 1–13. doi: 10.1080/00063657.2024.2419093
Olsen B., Sørensen S. (2018). Talið á ternum og ternubølum minkað seinastu 15 árini. Sjóvarmál, 31–34.
OSPAR (2023). Marine Birds Thematic Assessment. In: OSPAR, 2023: Quality Status Report 2023 (London: OSPAR Commission). Available at: https://oap.ospar.org/en/ospar-assessments/quality-status-reports/qsr-2023/thematic-assessments/marine-birds/.
Paleczny M., Hammill E., Karpouzi V., Pauly D. (2015). Population trend of the world’s monitored seabirds 1950-2010. PloS One 10, 1–11. doi: 10.1371/journal.pone.0129342
Perkins H., Hopkins T. S., Malmberg S., Poulain P. M., Warn-Varnas A. (1998). Oceanographic conditions east of Iceland. J. Geophys. Res. 103, 21531–21542. doi: 10.1029/98JC00890
Petersen A., Thorstensen S., Brides K., Trust W. (2022). Sauðfé étur kríuegg og unga. Náttúrufræðingurinn 9, 132–137.
Piatt J. F., Nettleship D. N. (1985). Diving depths of four alcids, Vol. 102. 293–297. doi: 10.2307/4086771
Piatt I., Sydeman W. (2007). Seabirds as indicators of marine ecosystems. Mar. Ecol. Prog. Ser. 352, 199–204. doi: 10.3354/meps07070
Pörtner H. O., Roberts D., Masson-Delmotte V., Zhai P., Tignor M., Poloczanska E. S., et al. (2019). IPCC Special Report on the Ocean and Cryosphere in a Changing Climate. Available at: https://www.ipcc.ch/srocc/
Reinert A. (1976). Lomvigin, six articles in the newspaper. Dimmalætting 97: 4 98:5 100: 3 102: 5 107:3 114, 4–5.
Ricklefs R. E. (1990). Seabird Life Histories and the Marine Environment: Some Speculations, Vol. 13. 1–6. doi: 10.2307/1521414
Salter I., Joensen M., Kristiansen R., Steingrund P., Vestergaard P. (2019). Environmental DNA concentrations are correlated with regional biomass of Atlantic cod in oceanic waters. Commun. Biol. 2, 1–9. doi: 10.1038/s42003-019-0696-8
Saraux C., Sydeman W. J., Piatt J. F., Anker-Nilssen T., Hentati-Sundberg J., Bertrand S., et al. (2021). Seabird-induced natural mortality of forage fish varies with fish abundance: Evidence from five ecosystems. Fish Fish. 22, 262–279. doi: 10.1111/faf.12517
Schreiber J., Kissling W. D. (2005). Factors affecting the breeding success of Arctic terns (Sterna paradisaea) in a colony at Kaldbaksbotnur, Faroe Islands. Atl. Seabirds 7, 97–105.
Skagseth Ø., Broms C., Gundersen K., Hátún H., Kristiansen I., Larsen K. M. H., et al. (2022). Arctic and Atlantic waters in the Norwegian basin, between year variability and potential ecosystem implications. Front. Mar. Sci. 9. doi: 10.3389/fmars.2022.831739
Skyllas N., Loonen M. J. J. E., Bintanja R. (2023). Arctic tern flyways and the changing Atlantic Ocean wind patterns. Clim. Change Ecol. 6, 100076. doi: 10.1016/j.ecochg.2023.100076
Steingrund P., Gaard E. (2005). Relationship between phytoplankton production and cod production on the Faroe Shelf. ICES J. Mar. Sci. 62, 163–176. doi: 10.1016/j.icesjms.2004.08.019
Strøm H., Descamps S., Ekker M., Fauchald P., Moe B. (2021). Tracking the movements of North Atlantic seabirds: Steps towards a better understanding of population dynamics and marine ecosystem conservation. Mar. Ecol. Prog. Ser. 676, 97–116. doi: 10.3354/meps13801
Sydeman W. J., Thompson S. A., Piatt J. F., García-Reyes M., Zador S., Williams J. C., et al. (2017). Regionalizing indicators for marine ecosystems: Bering Sea–Aleutian Island seabirds, climate, and competitors. Ecol. Indic. 78, 458–469. doi: 10.1016/j.ecolind.2017.03.013
Team R. C. (2022). A language and environment for statistical computing (Vienna, Austria: R Found. Stat. Comput). Available at: https://www.r-project.org/.
Tesdal J. E., Ducklow H. W., Goes J. I., Yashayaev I. (2022). Recent nutrient enrichment and high biological productivity in the Labrador Sea is tied to enhanced winter convection. Prog. Oceanogr 206, 22. doi: 10.1016/j.pocean.2022.102848
Vader W., Anker-Nilssen T., Bakken T., Barrett R., Strann K.-B. (1990). Regional and temporal differences in breeding success and population development of fish-eating seabirds in Norway after collapses of herring and capelin stocks. Trans. 19th IUGB Congr. Trondheim 1989, 143–150.
Walsh P. M., Halley D. J., Harris M. P., del Nevo A., Sim I. M. W., Tasker M. L. (1995). Seabird monitoring handbook for Britain and Ireland (Peterborough: JNCC/RSPB/ITE/Seabird Group).
Yashayaev I., Loder J. W. (2016). Recurrent replenishment of Labrador Sea Water and associated decadal-scale variability. J. Geophys. Res. 121, 8095–8114. doi: 10.1002/2016JC012046
Keywords: Faroe Shelf ecosystem, ecological indicators, monitoring, seabirds, breeding success, physical drivers, subpolar North Atlantic, marine management
Citation: Olsen B, Anker-Nilssen T, Danielsen J, Gaard E, Hansen LJ, Jacobsen S, Jensen J-K, Olsen R, Salter I and Hátún H (2025) Half a century of environmental variability and seabird trends on the Faroe Shelf in the North Atlantic Ocean. Front. Mar. Sci. 12:1544866. doi: 10.3389/fmars.2025.1544866
Received: 13 December 2024; Accepted: 03 March 2025;
Published: 28 April 2025.
Edited by:
Chiara Piroddi, Joint Research Centre, ItalyReviewed by:
Jan Marcin Weslawski, Polish Academy of Sciences, PolandHenry Häkkinen, Zoological Society of London, United Kingdom
Copyright © 2025 Olsen, Anker-Nilssen, Danielsen, Gaard, Hansen, Jacobsen, Jensen, Olsen, Salter and Hátún. This is an open-access article distributed under the terms of the Creative Commons Attribution License (CC BY). The use, distribution or reproduction in other forums is permitted, provided the original author(s) and the copyright owner(s) are credited and that the original publication in this journal is cited, in accordance with accepted academic practice. No use, distribution or reproduction is permitted which does not comply with these terms.
*Correspondence: Hjálmar Hátún, aGphbG1hcmhAaGF2LmZv