 Joshua W. Chamberlin1*
 Oleksandr Stefankiv2
 Eric M. Beamer3
 Correigh M. Greene1
 W. Gregory Hood3
 Stuart H. Munsch4
- 1Northwest Fisheries Science Center, National Marine Fisheries Service, National Oceanic and Atmospheric Administration (NOAA), Seattle, WA, United States
- 2Applied Coastal Research and Engineering Section, Washington Department of Ecology, Lacey, WA, United States
- 3Skagit River System Cooperative, La Conner, WA, United States
- 4Northwest Fisheries Science Center, National Marine Fisheries Service, National Oceanic and Atmospheric Administration (NOAA), Pasco, WA, United States
Estuaries provide many important functions for numerous aquatic species across life stages. However, these habitats have been widely impacted due to their characteristics and features that support agriculture and industrialization. Within Puget Sound, estuary restoration has been a primary tool to support recovery of Chinook salmon which are known to rely heavily on estuaries during early life history. Tracking habitat gains via restoration and evaluating effectiveness of these actions is necessary to ensure recovery targets are met. We used aerial imagery from two distinct time periods to measure estuarine habitat and estimate rates of change over two decades in Puget Sound. In addition, we developed a method to estimate functional trajectories for restoration projects based on allometry of planform geometry features for tidal deltas. A total of 72 restoration actions across nine tidal deltas added ~147 ha and ~410 km of tidal channel habitat in Puget Sound between 1997 and 2018. While positive overall, time series of rearing habitat change for individual tidal deltas varied reflecting the frequency and magnitude of restoration actions as well as the response of individual actions to natural processes. Estimated functional footprints for restoration projects were below total footprints for all deltas. Functional footprints appeared to track total footprint well for some deltas but indicated potential limitations in others that may be related to particular planform geometry metrics for individual sites. Overall restoration of estuarine habitats in Puget Sound since 1997 have added substantial rearing habitat in support of recovery for Chinook salmon populations. While total gains are positive, our estimates of functional trajectories provide additional information that may support adaptive management to ensure efforts remain beneficial to target species. Continuing to accurately track changes to estuarine habitat should benefit recovery efforts and support management decisions in the future.
Introduction
Estuarine habitats support numerous biological systems and ecosystem services around the world (Barbier et al., 2011). In particular, estuaries provide nursery habitats globally and maintain a suite of functions that enable juvenile fish to develop and support coastal ecosystems (Beck et al., 2001; Sheaves et al., 2015; Lefcheck et al., 2019). Moreover, a wide range of taxa, such as bivalves, diadromous fishes, migratory birds, and marine mammals rely on estuaries. However, human activities have diminished estuarine habitats in many regions. Because estuaries are located where the sea meets rivers, they are logical places for economically significant ports and infrastructure. Similarly, estuaries often have desirable soil conditions to support agriculture. As a result, many estuaries have been completely developed, diked, and/or transformed to support these activities, reducing the ability of these habitats to maintain natural functions. Indeed, in many locations, development of tidal deltas has reduced estuarine habitat by an estimated 75 - 99% compared to historical conditions (Brophy et al., 2019; Lotze et al., 2006). Furthermore, the ongoing impacts of sea level rise threaten to reduce, or shift, estuarine footprints and/or alter restoration project trajectories, further threatening the existence, extent, and function of these important habitats (Moritsch et al., 2022).
To combat estuarine habitat loss, many natural resource agencies have prioritized delta habitat conservation programs, including habitat protection, mitigation, and restoration. On the US Pacific Coast, much of these efforts revolve around habitat restoration to support the recovery of listed Pacific salmon stocks, Chinook salmon (Oncorhynchus tshawytscha) in particular. Recovery plans often include language about critical habitat, and one delisting criterion for Pacific salmon concerns certainty of long-term protections of critical habitat. Each recovery plan typically sets habitat targets to guide restoration actions and ensure progress is made toward population recovery.
While mediating habitat loss through restoration actions is undoubtedly important, it is equally important to understand the performance of restored sites. It is generally accepted that full ecological benefits of a restoration project are not instantaneous after project completion but are lagged and accumulate over time (Hobbs and Norton, 1996; Simenstad and Thom, 1996; Thom et al., 2002). As such, mature sites are in an equilibrium condition while restored sites accumulate ecosystem function over time. The accumulation, or lack of, function over time could have important implications for populations or species intended to benefit from restoration actions. Understanding how well a site functions and trends towards a benchmark over time could provide important information for planning, evaluation, and adaptive management of projects supplemental to accounting for absolute habitat increases through restoration.
Given extensive estuary restoration actions over the last few decades, tracking their progress, status, and trends is important. Fundamentally, managers should be concerned about trends in habitat change, whether conservation gains are outpacing losses, and how these changes are influencing target populations. As the focus of these actions is generally to support ecological functions for some target species or group of species, tracking changes to habitat condition can be compared to population response metrics to evaluate success (Greene et al., 2025). Such exercises inform progress toward recovery targets and goals and likely contribute toward adaptive management processes and decisions. In addition, as these actions are generally capital intensive, tracking progress and success is imperative to ensure positive cost-benefit scenarios and maintain transparency for public facing projects.
Estuaries in Puget Sound, like elsewhere, have experienced extensive loss since the 1800s. In response, state, tribal, and federal partnerships have instituted estuary restoration as a primary conservation mechanism to improve degraded habitat conditions. Actions to date have largely focused on the restoration of tidal connectivity via dike breaches and/or setbacks, improvements to fish passage, and barrier removal. Proper accounting of wetland gains from restoration projects is crucial to determine recovery, evaluate species response to habitat conservation actions, address population resilience to climate change, and inform adaptive management.
Here we estimate estuarine habitat change, both natural and through restoration actions, across several large river deltas throughout Puget Sound. Specifically, we use aerial and satellite imagery and GIS methodologies to build a time series of habitat change to describe gains from restoration actions and track increases to nursery habitat for juvenile salmonids. This work goes beyond quantifying project footprints and includes estimates of change for specific channel features known to support fish during estuary residence of tidal delta. Furthermore, we provide an estimate of functional trajectory for restoration project sites using a subset of selected channel metrics and comparing our measurements with expected natural conditions. This work provides an updated assessment and account of numerous restoration actions and habitat availability for juvenile salmon in larger river deltas throughout the region.
Methods
Study area
Puget Sound is a semi-enclosed estuarine complex formed largely during the most recent glaciation and dominated by numerous large river drainages (Booth, 1994; Collins et al., 2003). Glacial advance/retreat over several millennia created various geomorphically distinct river valleys and deltas (Collins and Montgomery, 2011) that provide habitat for listed populations of Chinook salmon (Beechie et al., 2001). Recovery of local Chinook salmon populations rely heavily on habitat restoration to support rebuilding abundance and productivity, including within tidal deltas. Accurate and ecologically relevant tracking of habitat changes as a function of these actions remains critical for meeting recovery goals.
The goal of this work was twofold: 1) provide a continuous estimate of juvenile salmon estuary rearing habitat change over two decades, and 2) describe the functional trajectory of restoration projects using habitat structure as a measure of functional equivalency (Simenstad and Thom, 1996). We quantified natural habitat change (where evident) and change through restoration actions for 9 tidal deltas throughout the region (Table 1). The selected deltas encompass 83% of the total large river delta wetland area and 88% of the delta restoration projects in Puget Sound (Ramirez, 2019a). Specifically, we quantified change in area (ha) and length (km) of primary deltas features. In addition, we tracked total and functional restoration project footprint, the latter an estimate relative to observed norms regarding planform geometry in tidal deltas across the region. Our results provide a time series of deltas habitat change over two decades in Puget Sound to support analysis and evaluation of recovery actions and targets for listed species.
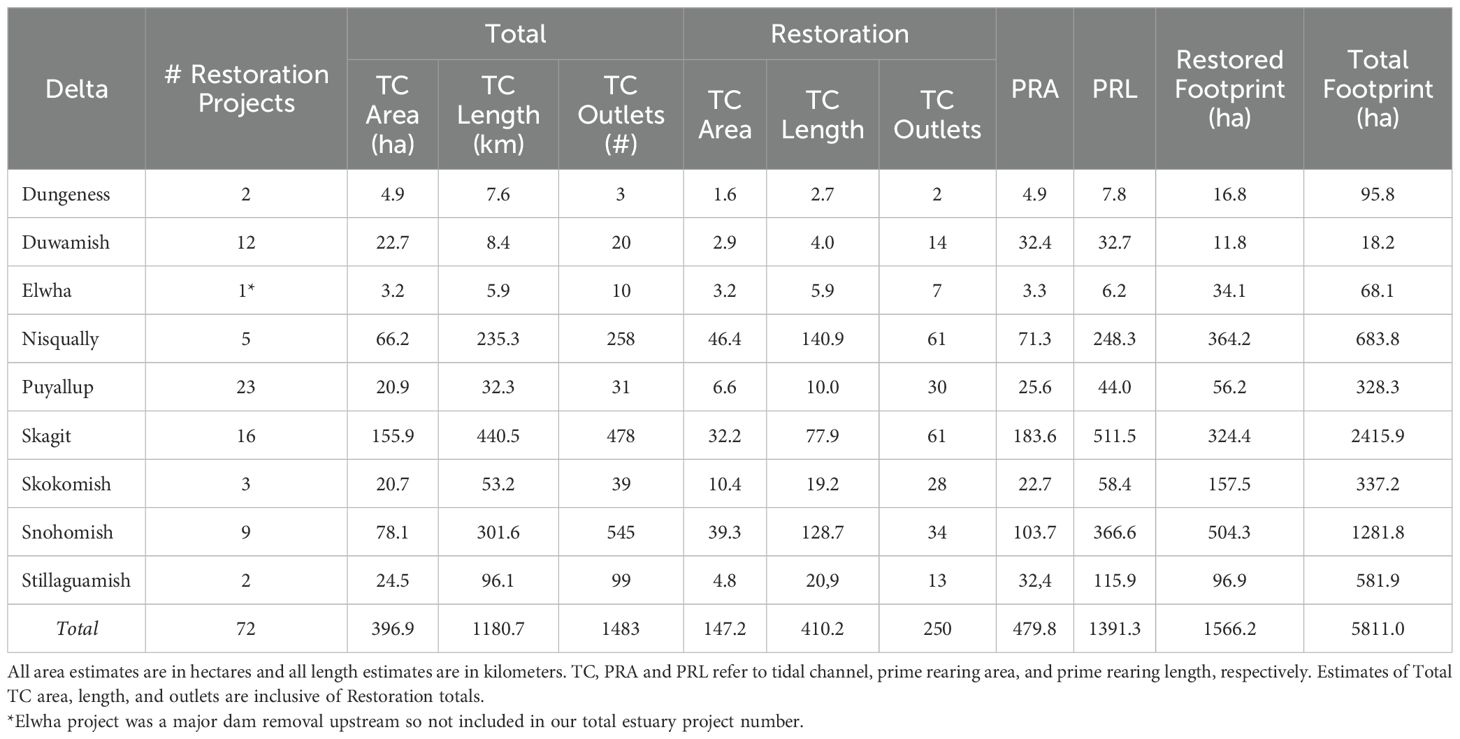
Table 1. Summary of tidal delta habitat change analysis for each Puget Sound tidal delta in our analysis.
Estimating extent and change of vegetated wetlands
Methods for documenting habitat change can vary widely and estimates are generally sensitive to baseline conditions, units of measurement, and the specific goal for assessment (e.g., spatial distribution, quality; see Lengyel et al., 2008; Nagendra et al., 2013). Several studies have provided assessments of estuarine habitat extent within Puget Sound (Puget Sound Nearshore Ecosystem Project Change Analysis, 2011; Ramirez, 2019b; Brophy et al., 2019), including the addition of habitat through restoration actions. Though our project builds on and corroborates these efforts, we sought to expand on previous work by providing two additional products: 1) a time series of delta habitat change over the last two decades, and 2) estimates for functional footprints for individual restoration projects within the selected deltas. Time series are useful because they track change and may be applied in further studies to link habitat changes with biological outcomes. Functional footprints are useful for evaluating project development relative to intended target, or reference, conditions.
Delta habitat change
We estimated wetland habitat change within each of the nine river deltas from 1997 - 2018 (Figure 1). While a primary goal of the exercise was to track habitat restoration, habitat change within each delta was attributable to both restoration actions and natural changes. Restoration actions included in this analysis focus entirely on actions that add habitat primarily through actions such as dike breach, dike removal, or dike setback. We focused our initial change analysis on blind tidal channels and distributaries, habitat features that are primarily used by juvenile Chinook salmon during estuarine residence (Beamer et al., 2024). Blind tidal channels are defined as channels with bidirectional movement of water that coincides with the patterns of tidal exchange. These channels may or may not completely dewater on an ebbing tide. Distributary channels are defined as the primary network by which water moves through a delta network. Water flow in distributary channels is generally unidirectional (seaward) though remains tidally influenced. Distributary channels are generally much larger (deeper, wider) than blind tidal channels.
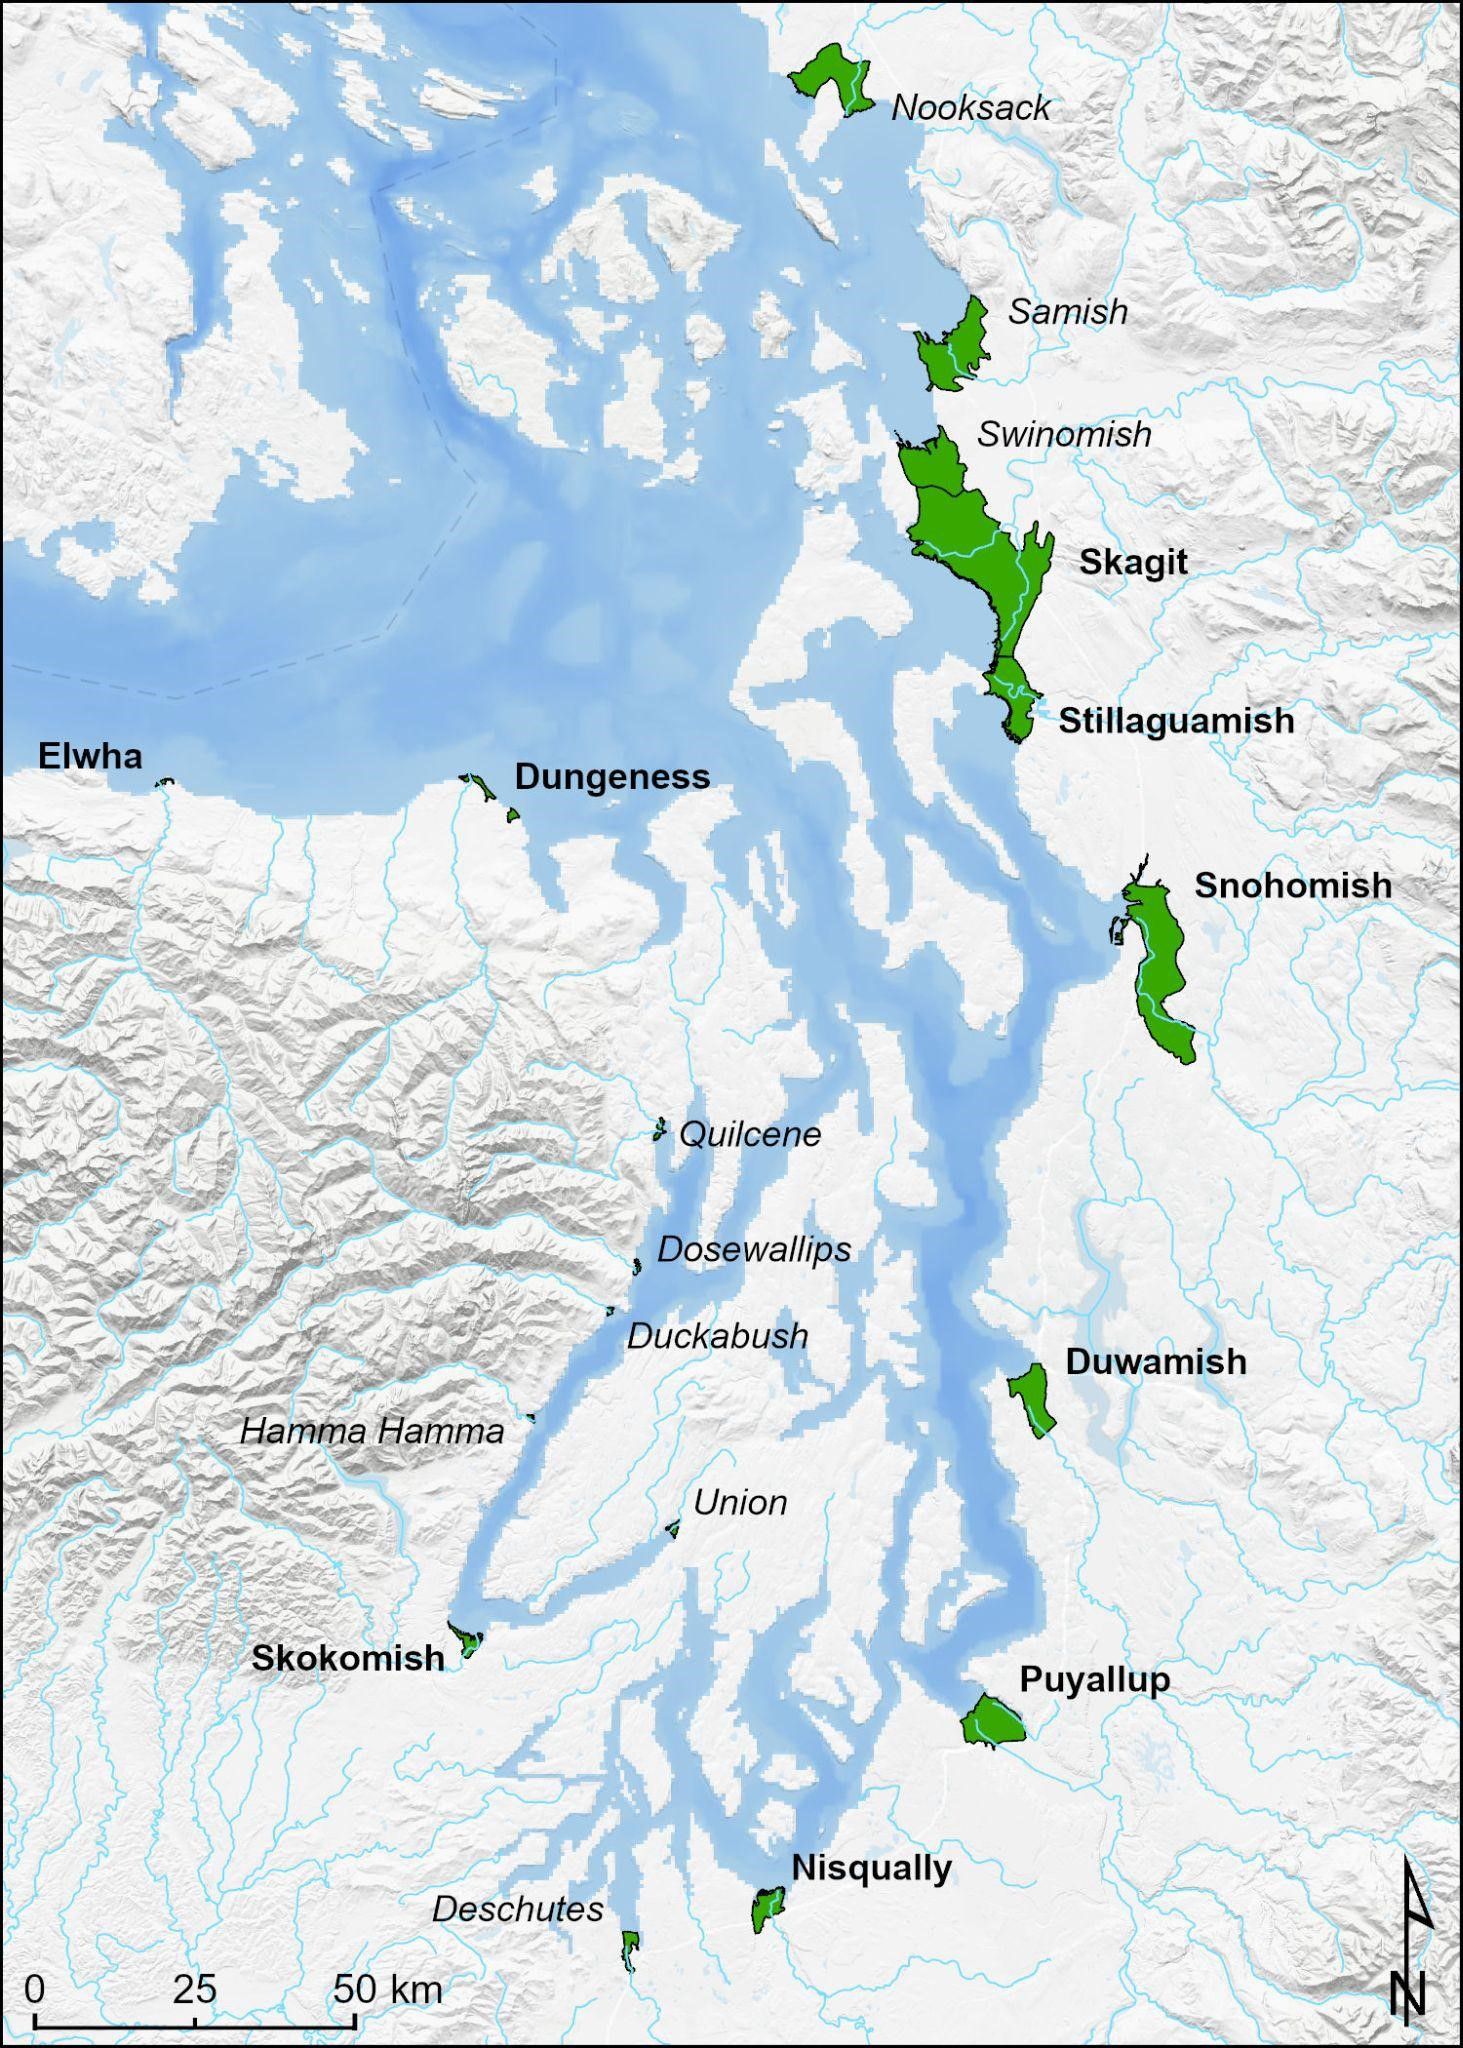
Figure 1. Large river deltas in Puget Sound. Of these, italicized deltas were not included due to a paucity of restoration projects and/or low abundance of natural-origin Chinook salmon.
We quantified wetland change as the change in area and length of blind tidal and distributary channel features within a defined estuary extent for each delta. We adopted boundaries of estuary extent from Beechie et al. (2017), based in part on current extent in Brophy et al. (2019). To quantify change, we digitized delta habitat features using aerial and satellite imagery from two time periods: 2010–2011 and 2017–2020. Exact years differed among deltas based on image availability though all reported habitat change was standardized to the period 1997–2018 using the methods described below. Blind tidal channels and distributaries were digitized from 30 cm resolution true-color 2010–2011 Microsoft Global Ortho Program aerial imagery, 30 cm resolution false-color 2017 HxGN Imagery Program aerial imagery, 30 cm resolution true-color 2018 and 2020 Worldview-3 satellite imagery, and 15 cm resolution false-color 2019 Snohomish County aerial imagery, set at 1:750 to 1:1000 scale. Methods for digitizing delta habitat features are described in detail in Stefankiv et al. (2019). The difference in area or length between the two time periods was used to calculate a rate of change for each delta, feature, and metric. We then used rates of change to back-calculate values to 1997 or project initiation for 1) restoration actions, and 2) natural changes (see below). For example, if we calculate an absolute change of 40 ha over the period of 10 years, we would apply a rate of change of 4 ha per year to calculate the habitat values for any given year within the range that was not directly measured. We use 1997 as the baseline for our time series because it represents the first year of long-term fish monitoring within the region. Where imagery from 2019 and 2020 were used for our updated estimates we report the back-calculated values for 2018 to make the time series consistent across all deltas. The result of this exercise was a time series of estimated change in tidal delta habitat for the greater Puget Sound region. All features and estimates were vetted with local co-manager groups prior to finalization.
A primary goal of estuary restoration in Puget Sound is to support the recovery of listed salmon populations. As such, we attempted to track changes in total juvenile salmon rearing habitat using several metrics. First, we calculated total change in tidal channel length and area during the period 1997 – 2018. The addition of tidal channel habitat is a fundamental objective of estuary restoration actions in the regions. This metric is the net change of tidal channel features but importantly does not include distributary channel features. In addition, we also calculated two metrics that more specifically represent juvenile salmon rearing habitat: Prime Rearing Length (PRL) and Prime Rearing Area (PRA). These prime rearing metrics were intended to represent our best estimate of the habitat actually used by juvenile Chinook salmon during estuary residence, based on extensive study of juvenile salmonids in Puget Sound tidal deltas over the last two decades (Beamer et al., 2005; synthesis by Chamberlin, 2022). PRL is simply the sum of the lengths of all channel habitat, tidal channels and distributary channels, and is generally equivalent to total tidal channel length for each delta in each year. PRA is a conservative estimate of “usable” habitat area that includes only the 2m edge of distributary channels excluding the deeper, higher velocity areas farther from the channel edges. This approach has been used as a reasonable definition for juvenile Chinook salmon habitat for comparable analyses in Puget Sound (Beamer et al., 2005; Greene et al., 2021).
To calculate change from restoration projects, we established timelines and estimated footprints based on project design and implementation documents. We determined project boundaries using as-built design plans which were vetted through conversations with project managers and individuals familiar with project implementation and monitoring. Vetted project boundaries were used to estimate restoration project footprints (i.e., surface area). For each restoration project, we also digitized habitat features within the project boundaries and compared between time periods to estimate change. For projects that occurred prior to our base imagery period, we used methods described above to estimate habitat change for each feature and metric. For projects that occurred between image periods (i.e. only one measurable estimate for each habitat feature), we were unable to calculate empirical estimates for rates of habitat change.
We defined natural habitat change as changes that occurred in the absence of restoration actions. We estimated natural habitat changes and natural delta footprints for all features that occurred outside of restoration project boundaries within a given delta. We calculated the natural footprint (i.e. extent) of a given delta using estimates of wetland area classified as fully or partially connected from Hall et al. (2021) within our defined estuarine extent. These estimates accounted for and removed all developed and inaccessible areas within the defined extent polygon for each delta. From these estimates we subtracted the footprints of all restoration actions between 1997 and 2018 to determine the natural estuary footprint.
To determine natural changes to habitat features, we used polygons from the base period (2010/2011) and overlaid them onto the updated imagery. Any discrepancies between layers were measured and updated in the new layer. For the majority of tidal deltas, these changes were negligible or not detected. However, for the Skagit and Elwha River deltas, natural changes were substantial and are described below.
Functional trajectories
While the above metrics provide linear and areal extents of available tidal wetland, they do not necessarily indicate how well these areas have achieved natural function. Hence, in addition to our accounting of restoration footprints, we estimated a functional footprint for each project site within each delta. Restoration projects are intended to function similarly to natural wetland habitats, but the progression toward a reference condition generally takes many years (Simenstad and Thom, 1996; Thom et al., 2002; Gray et al., 2002). Tracking “functional equivalency” via measurable characteristics may provide critical information for restoration actions. If we assume natural habitats exist in an equilibrium state and offer 100% functionality, then it follows that a restoration project at any given time may represent reduced or proportional function as it progresses toward a natural (i.e. mature) state (Figure 2). As the site matures it should be expected to approach some range of values for a given metric informed by the target site (see yellow shaded area in Figure 2) and therefore represent some form of functional equivalency. However, if the site trajectory begins to change, becoming horizontal or even decreasing, it may suggest some limitation or failure that should be addressed through adaptive management (Lawrence et al., 2018; Stewart et al., 2024).
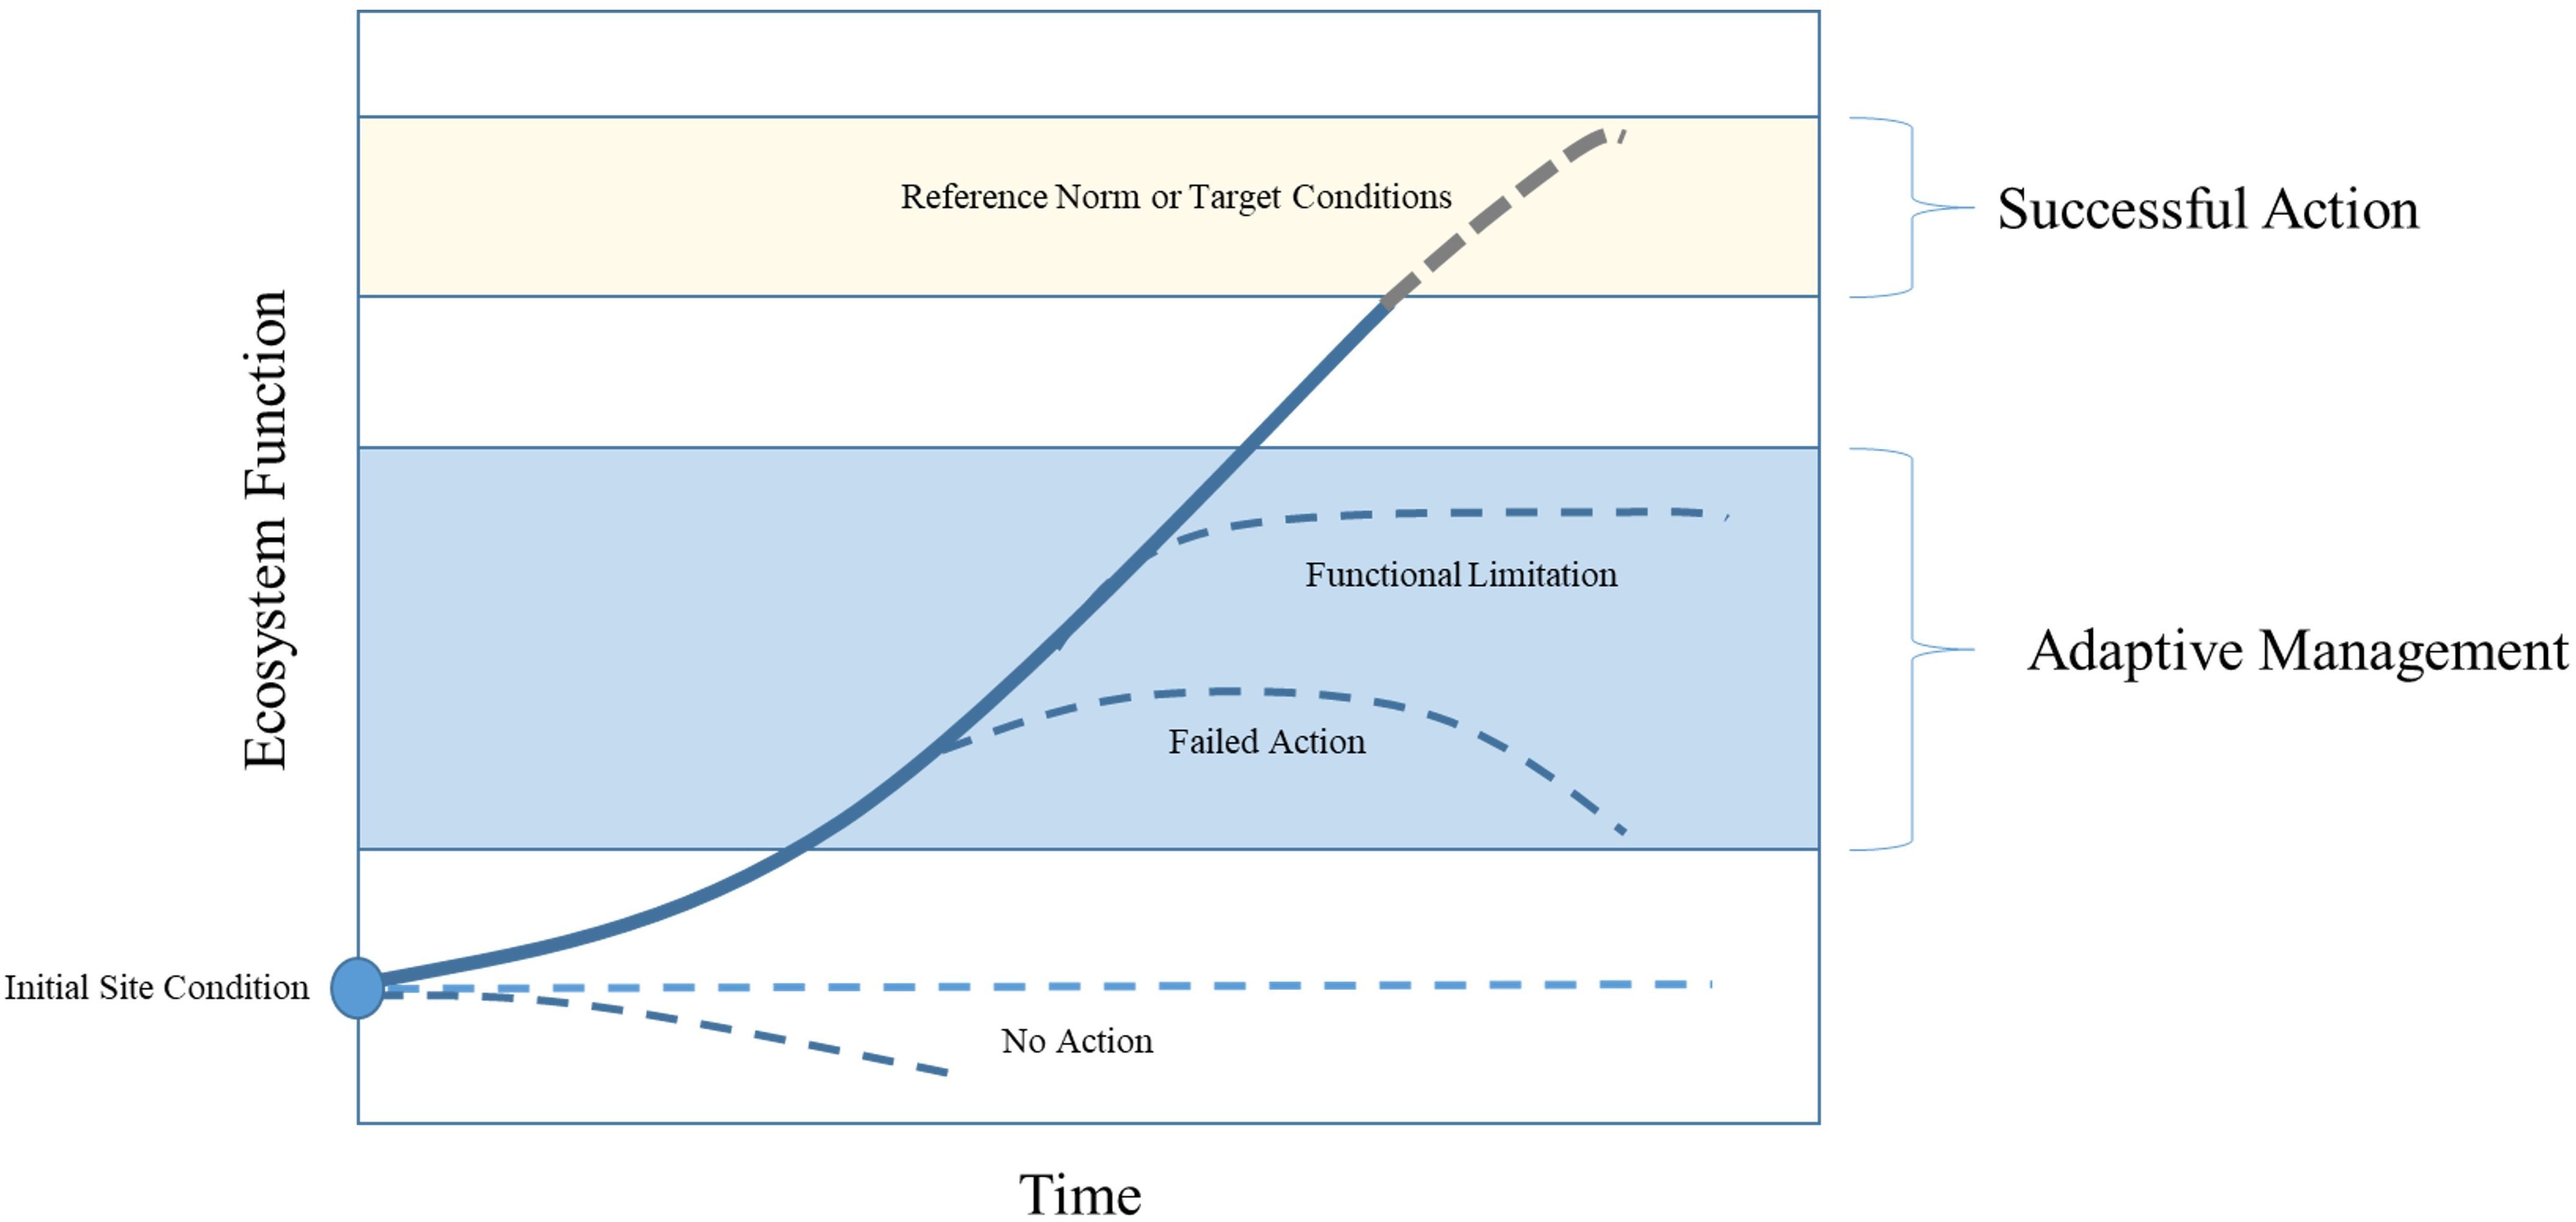
Figure 2. Conceptual progression of a restoration site toward target conditions or reference norm (i.e. 100% functionality) for some given metric of ecosystem function. Evaluating the trend over time can provide useful information for potential adaptive management actions. For example, after an initial upward progression toward reference conditions, if the trend becomes horizontal or begins to decrease may indicate a limitation or failure that should be addressed through subsequent action.
To conceptualize an application of the functional trajectory of key ecosystem attributes linked to juvenile salmon we hypothesize that juvenile salmon use estuaries for: 1) productive foraging, 2) physiological transition, and 3) refugia from predators (Simenstad et al., 1982). The productive foraging function for juvenile salmonids in estuarine habitat requires 1) wet areas for fish to occupy (inundation), 2) access to those areas (fish passage opportunity), and 3) abundant nutritious prey. Restoring hydrology to a site footprint could achieve bullets 1 and 2 immediately after restoration but bullet 3 would be lagged as site characteristics (e.g., sediment type, elevation) and natural processes (e.g., hydrology, sediment dynamics) interact to form channel networks that create sustainable conditions for vegetation and support prey production. Tidal channel networks function as the primary arterial system transporting water, sediment, nutrients, and organisms between the site and the surrounding landscape (French and Stoddart, 1992; Rinaldo et al., 2004; Fagherazzi et al., 2013). While these networks are critical for habitat forming processes, channel metrics (e.g. area, density, etc.) may also relate directly to vegetation development and colonization (Sanderson et al., 2000; Wu et al, 2020) as well as influence the distribution of fish and other aquatic organisms (Williams and Zedler, 1999; Gewant and Bollens, 2012; Beamer et al., 2024).
Restoration actions that aim to restore hydrology to a site (e.g., dike setback, dike breach) commonly include constructed tidal channels as part of the project design. While information exists to inform proper network design for restoration actions (Hood, 2002, 2007, 2014, 2015; Williams et al., 2002), there may be physical (subsidence, sediment compaction) or socio-political (flood protection, recreation) constraints, including cost-benefit analysis, that limit the construction of networks to mimic, exactly, naturally occurring wetland sites after implementation (Elliott et al., 2016). As such, it may be more appropriate to think of these design goals (e.g., tidal channel network metrics) as end points and assume the constructed networks will evolve toward the natural conditions or targets (Figure 2; Zeff, 1999; Rozsa, 2012). Given the documented relationship between tidal channel networks and habitat forming processes, tracking a suite of measurable tidal channel metrics may be a convenient way to estimate a functional trajectory for estuary restoration sites.
Landform features including the number of tidal channels, the length/area of tidal channels, and the number of outlets in naturally occurring delta habitats scale with marsh footprint enabling a predictable estimate for each metric across restoration sites within each delta (Hood, 2007, 2014, 2015). In plain terms, the estimated value for a suite of tidal channel metrics can be predicted with reasonable accuracy given the size (i.e. surface area or footprint) of a restoration site. These allometric estimates may be referred to as habitat feature “norms” where the value, for example total channel length, would represent the estimate of the metric for a site of given size in its natural, equilibrium state. As these norms represent a site at 100% functionality, we can compare our measurements of selected habitat features within a restoration project and determine their relative difference from the calculated norm to estimate functionality through time. We used regression parameters from Hood (2015) to estimate the mean and 80% confidence intervals for estimated tidal channel length, tidal channel area, and channel outlet count for each restoration project within all deltas. We included the 80% CI estimates given the high degree of variability that can occur within and across deltas (Hood, 2015). Habitat feature metrics (channel area, length, outlets) that fell within the 80% CI estimated for the allometric reference norm (the estimated value of each metric for each site) were estimated as 100% functional. Values that fell above or below the 80% CI were estimated as the relative difference above/below the upper/lower CI estimates. The result is a percent of allometric norm for tidal channel length, tidal channel area, and tidal channel outlet count for each project in each available image/period during which the project existed. Similar to our methods for estimating habitat change between image periods described above, we used rates of change in proportional allometric norms between the periods of measurement to interpolate percentages in years where images were not available. To arrive at a final functional footprint, we averaged across our estimates of percent functionality for each individual feature metric and multiplied by the total project footprint for each project(see Supplementary Figure 1). Functional footprints were then summed across sites within years to create a functional trajectory for each delta.
Results
Restoration projects and tidal channel habitat
We measured habitat features within 72 restoration projects across nine Puget Sound tidal deltas implemented between 1997 and 2018 (Table 1). Overall, restoration actions added 147.2 ha and 410.2 km of tidal channel habitat in Puget Sound since 1997. These actions account for increases of 59% and 53% in tidal channel area and length, respectively, throughout the region. The number of restoration projects and the total area of tidal channels added via those projects varied by delta. The Puyallup (n = 22) followed by the Duwamish (n = 13) and the Skagit (n = 12) tidal deltas had the highest number of projects implemented during the time period. The amount of tidal channel area added through restoration varied by delta and ranged between 1.6 and 46.4 ha. The largest absolute additions in tidal channel area occurred in the Skagit, Snohomish, and Nisqually (Figure 3). Absolute changes in tidal channel length also varied considerably among delta and ranged between 2.7 and 140.9 km. The largest absolute increases in tidal channel length also occurred in the three largest deltas; the Skagit, Snohomish, and Nisqually (Figure 3). Changes in distributary features due to restoration were isolated to the Skokomish delta whereby a large tidal channel evolved into a distributary shortly after a restoration action in 2009. We report these changes in our discussion of time series below.
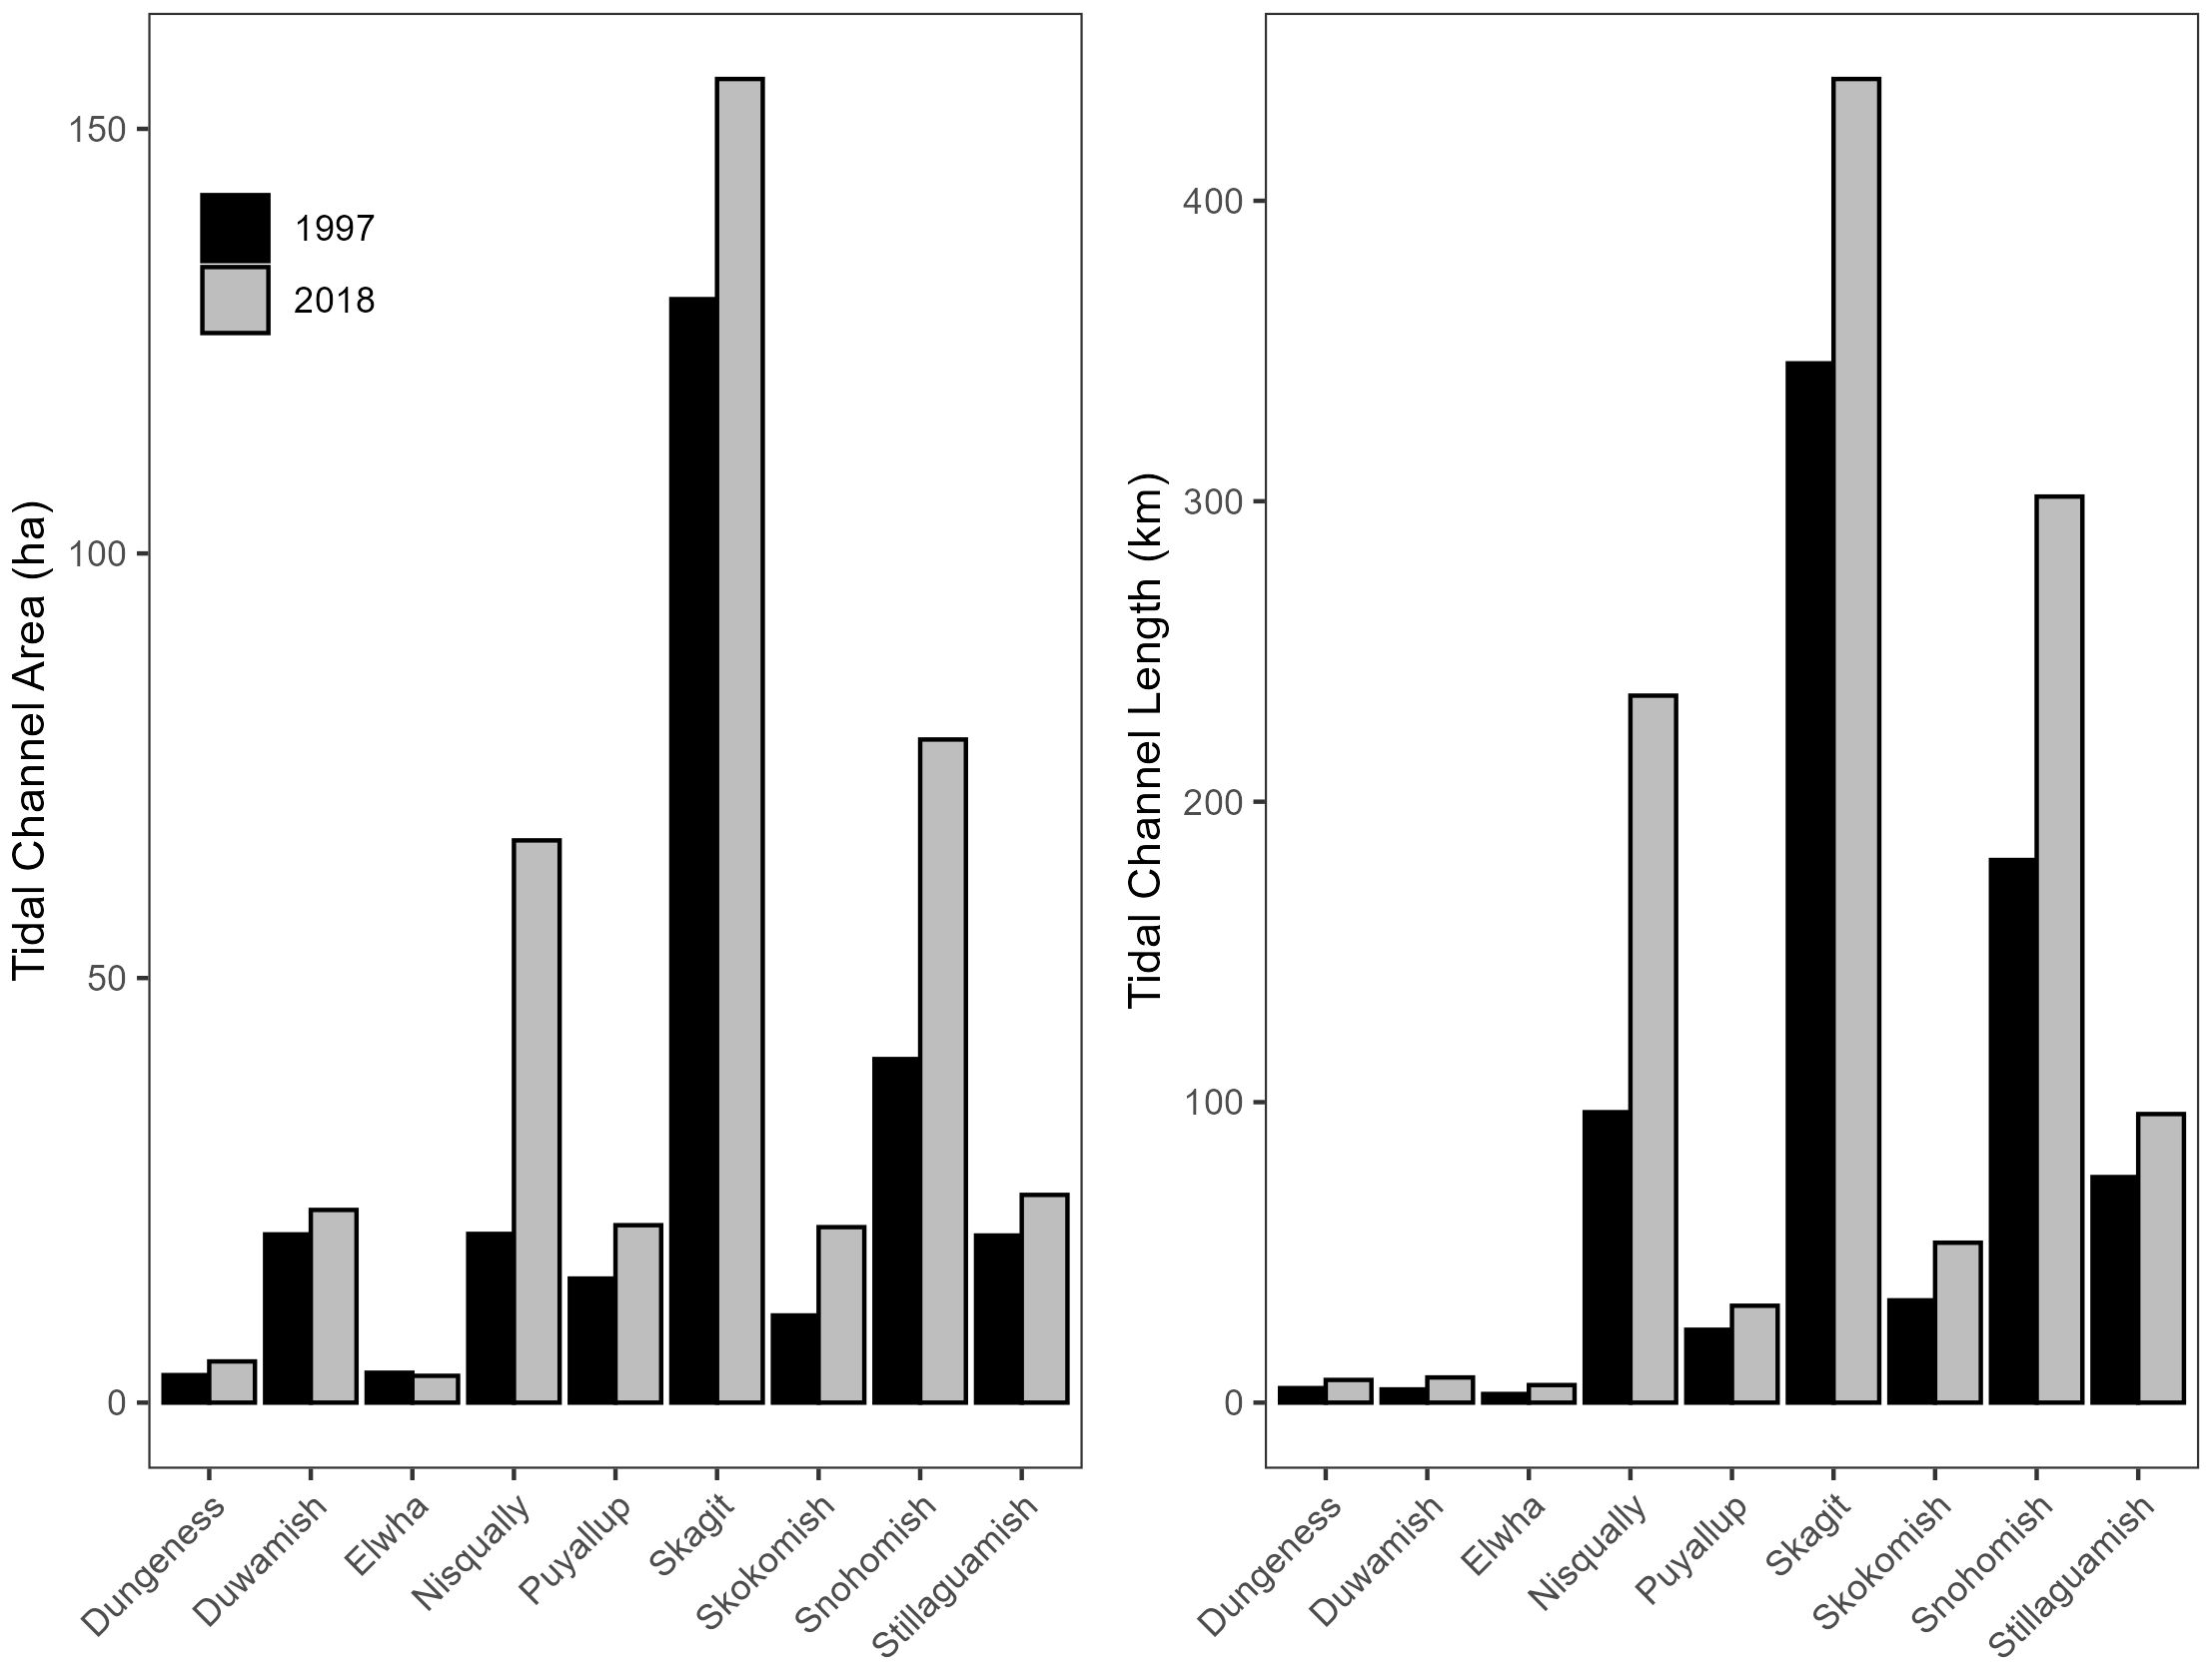
Figure 3. Total tidal channel area and length by delta in 1997 and 2018. Difference in total area/length includes natural changes (minimal) and habitat added through restoration.
Despite differences in absolute change in tidal delta habitat among deltas, relative changes in tidal channel area and length due to restoration actions were considerable across Puget Sound. Although the largest relative changes in channel area occurred in the Nisqually delta (234%), channel area in both the Snohomish and Skokomish deltas also doubled compared to pre-restoration conditions (101% in both deltas). In addition, channel area increased by 45% and 49% in the Puyallup and Dungeness deltas, respectively. Additionally, tidal channel length increased by 90% in the Duwamish and 74% in the Snohomish, while increases of 56% and 55% occurred within the Skokomish and Dungeness, respectively.
Natural changes in tidal deltas
Natural changes were discernible in only 3 of the 10 deltas we evaluated: the Skagit, Snohomish, and Elwha River deltas. Changes in tidal channel habitat within the Snohomish delta were due to natural dike breaches that created additional outlets for existing tidal channels. These additional connections increased tidal channel area and length in the system by 0.25 ha and 0.54 km, respectively. In both the Skagit and Elwha, natural changes in the delta actually reduced the amount of available habitat over the time series. Between 1996 and 2018 we estimate that tidal channel habitat in the Skagit declined from 125.57 ha to 123.36 ha, a loss of 2.21 ha of tidal channel habitat. Part of this loss can be attributed to an avulsion along the lower N Fork of the Skagit River that altered the flow path of the distributary channel in the lower estuary and cut off previously available habitat. The avulsion also reduced distributary habitats by 25.73 ha. In addition to changes from the avulsion, erosion of wetlands reduced habitat along the seaward fringe, likely from sea level rise and storm surge (Hood et al., 2016). In the Elwha delta, the removal of two large dams in the upper watershed diminished tidal channel habitat via the delivery of an enormous amount of trapped sediment (Warrick et al., 2015). Between 2010 and 2018, tidal channel habitat within the Elwha River delta declined by 36%, from 3.52 to 1.27 ha. However, these changes were concurrent with marsh expansion seaward which increased total marsh area. Although dam removal was a significant restoration action, we consider the changes in the delta natural as the river naturally redistributed sediment trapped within the reservoirs through the watershed.
Time series of tidal delta habitat change
Prime rearing length and area
Overall, PRL and PRA increased in all deltas from 1997–2018 with the exception of PRA in the Elwha delta (Figure 4). Although PRL and PRA generally increased across deltas, individual trends were quite variable (Figure 4). In some deltas (e.g. Skagit, Snohomish, Puyallup) increases in both metrics resembled a stair-step pattern punctuated by large restoration actions then followed by more gradual increase after project completion. In other deltas (Nisqually and Duwamish), increases in PRL and PRA were characterized by a single dramatic increase due to restoration followed by gradual change or subsequent small actions. Patterns in the Elwha River were unique in that PRL increased while PRA decreased quickly and steadily from 2010 onward. These changes have resulted in seaward movement of the delta and establishment of several new, and smaller, channels at the seaward delta boundary. While the overall trend for both metrics for most deltas generally increased over the entire time series, each metric also appeared to decrease periodically after restoration actions in most deltas. However, periodic decreases in PRA after a restoration action were much more common than estimated for PRL. Decreases in both metrics were largely due to loss of tidal channel features from sediment filling remnant irrigation ditches in newly restoring sites. Notably, the Skokomish delta saw a relatively dramatic decrease in PRA after 2010, which was largely the result of a large tidal channel evolving into a distributary feature. Given the 2 m buffer used on distributary features when calculating PRA, this change reduced the overall total for PRA in the delta. Lastly, comparing relative changes between PRL and PRA within each delta showed now consistent pattern across deltas. That is, relative changes in PRL or PRA were not consistently higher for either metric over the entire time series.
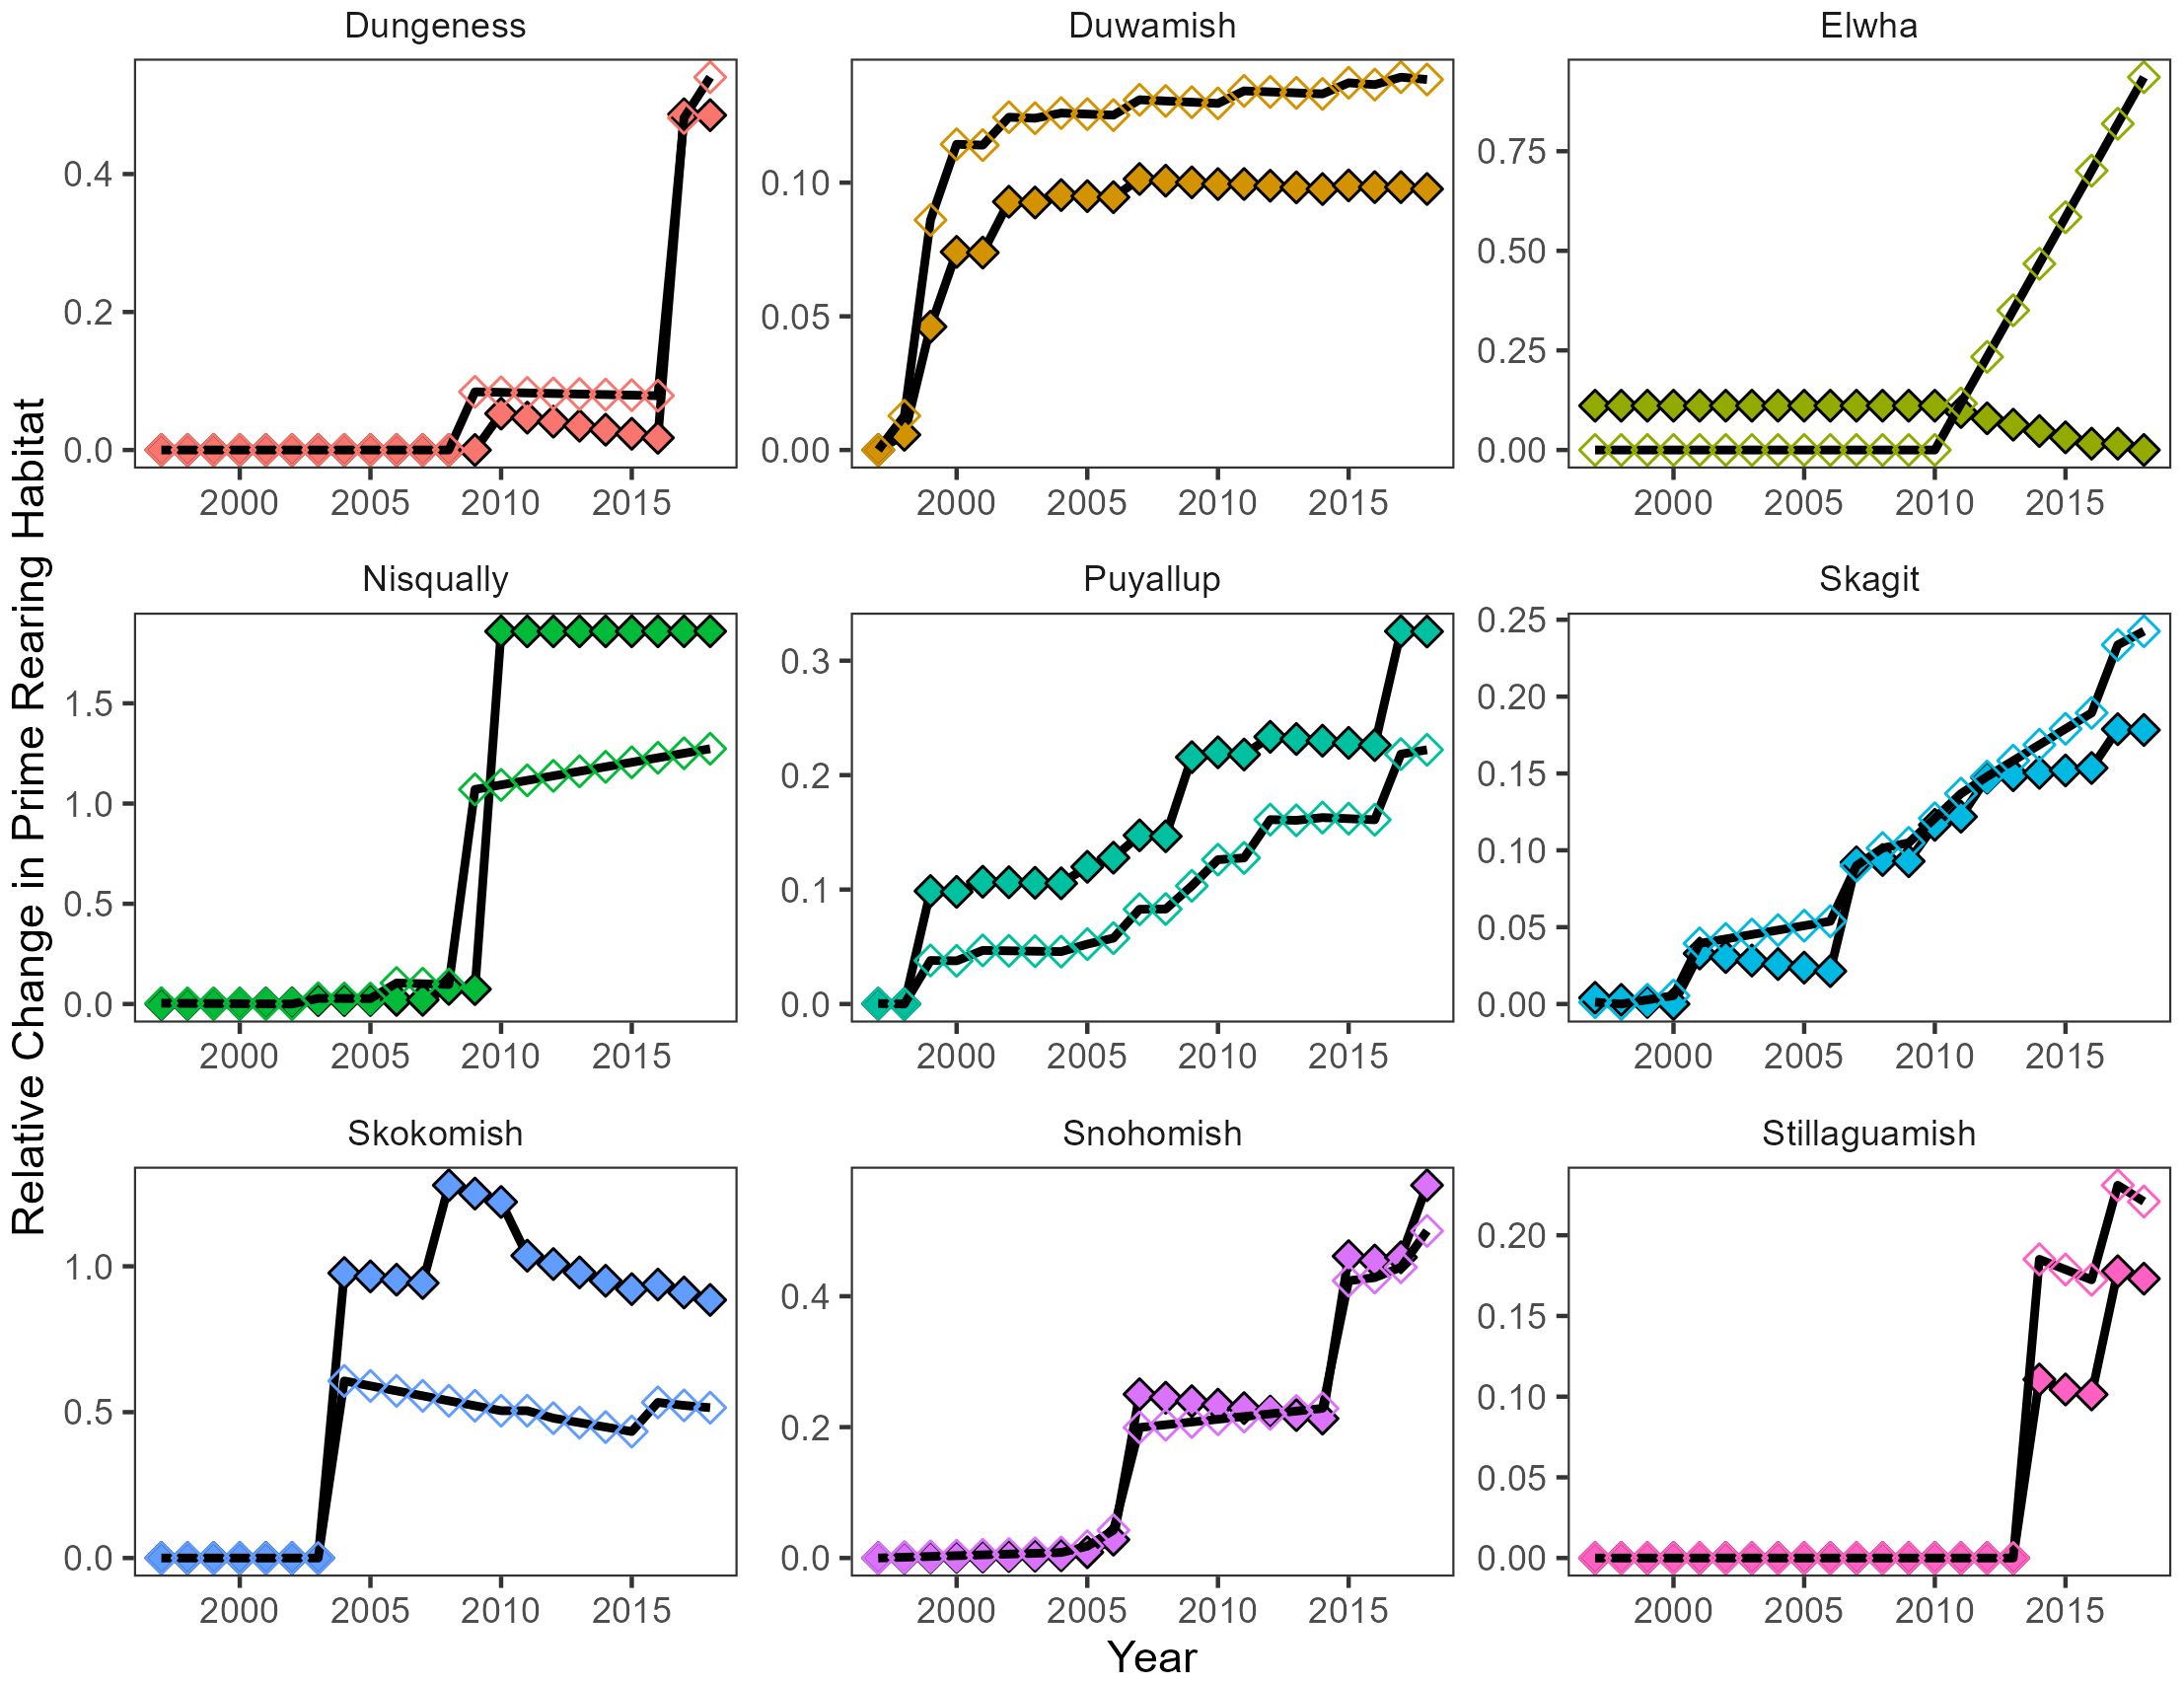
Figure 4. Time series of relative change in juvenile salmon rearing habitat metrics, Prime Rearing Length (unfilled) and Prime Rearing Area (filled) by delta. Note free y-axis scales to improve visibility.
Restoration project footprints
In addition to tracking changes in channel habitat, we also estimated changes to both total and functional restoration footprints within each delta (Figure 5). Total restoration footprint increased in all deltas between 1997 and 2018. The largest absolute increases in total restoration footprint occurred in the Snohomish (+ 472 ha) and Nisqually (+ 360 ha) deltas. However, the largest relative changes (% change relative to natural footprint) occurred in the Duwamish (+180%), Nisqually (+110%), and Skokomish (+87%) deltas.
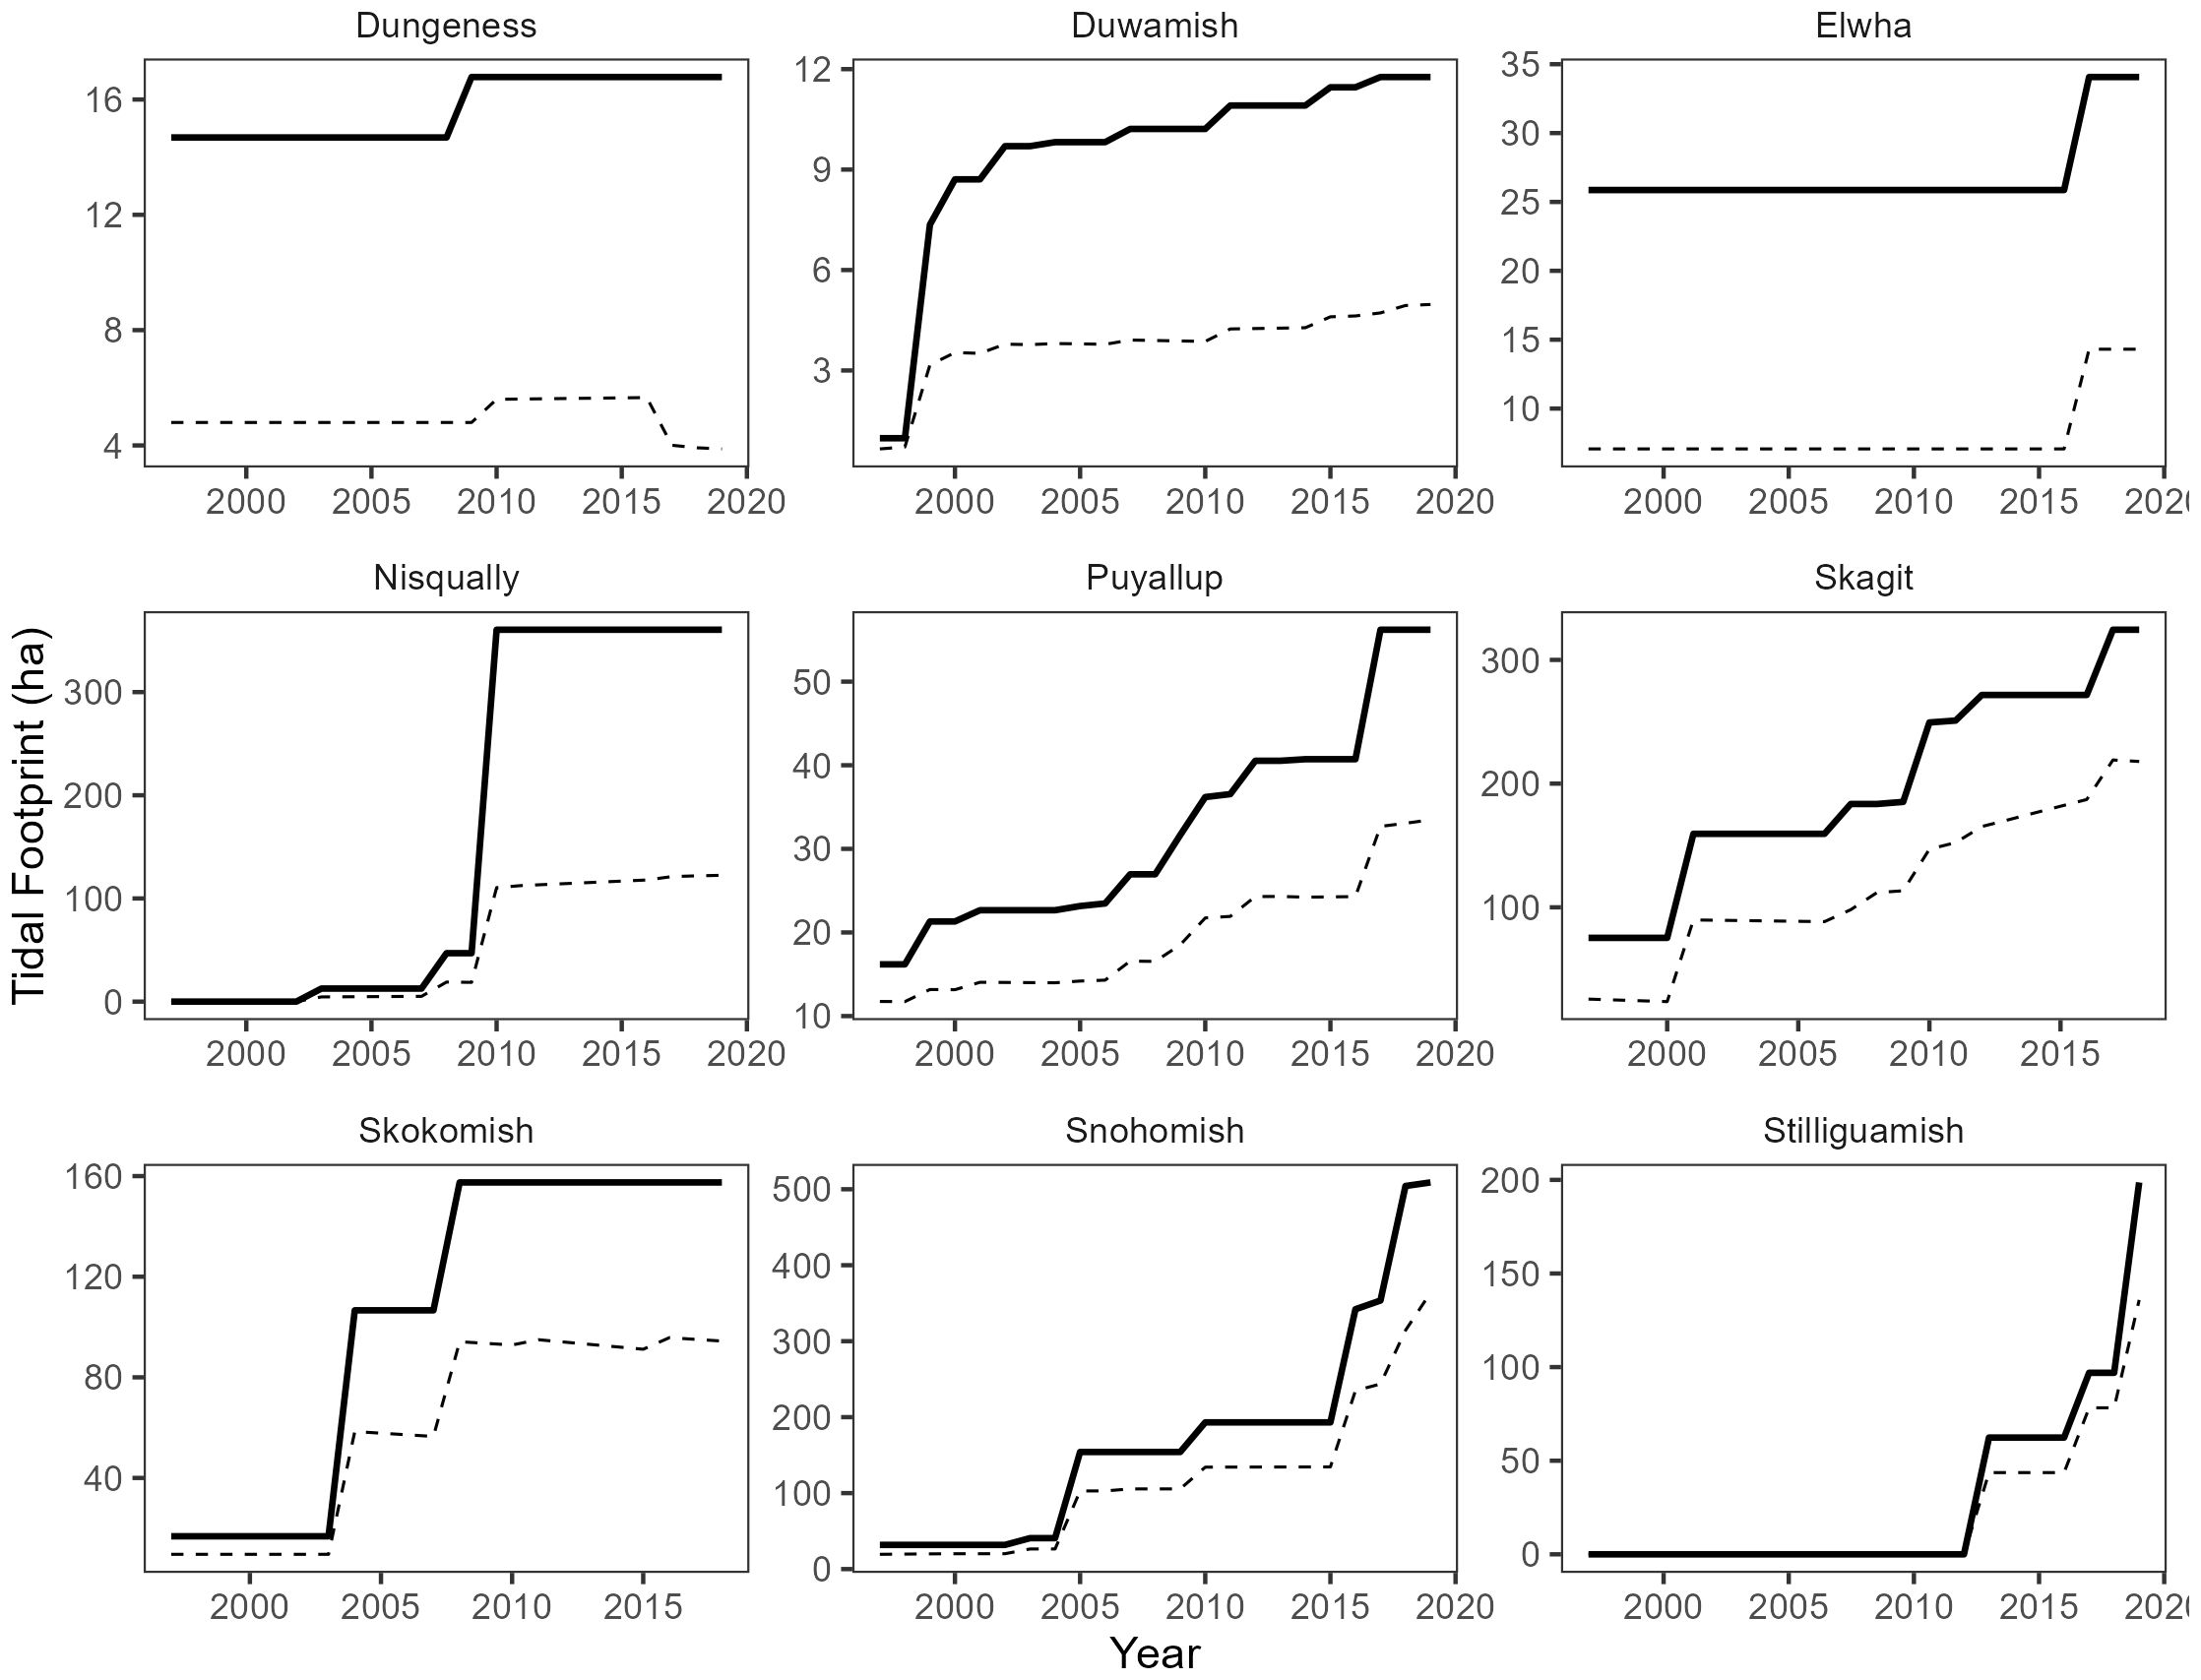
Figure 5. Time series of total project footprint (solid line) and functional project footprint (dashed line) by delta. Note free y-axis scales to improve visibility.
Functional footprints were less than estimates for total footprints for all projects and in all deltas (Figure 5). On average, functional footprints were 52% of estimated allometric norms for the planform features, channel area, channel length, and channel outlet count. Functional footprints ranged between 23% in the Dungeness delta to 81% in the Stillaguamish delta. Trends in functional footprint largely followed the total restoration footprints, increasing proportionally with the addition of restoration projects through time. However, while functional footprint in some deltas appear to be evolving and increasing through time (e.g. Stillaguamish, Skagit, Snohomish), the functional trajectory in other deltas suggests a stable trend that is below estimated norms (e.g. Nisqually, Skokomish, Duwamish, Dungeness). Functional footprints were largely limited by the total channel area and number of channel outlets (Figure 6). Median proportion of estimated allometric norms were 0.76, 0.32, and 0.5 for channel length, channel area, and channel outlet count, respectively. However, estimates for channel area and channel outlet count appeared to track total restoration footprint: deltas with larger increases in total project footprint generally had higher than average proportions of allometric norms for channel area and lower than average proportions for channel outlet count. The opposite was true for deltas with the smallest increase in project footprints. In plain terms, it appears that larger deltas with presumably larger projects are limited more by channel outlet count whereas smaller deltas, and thus smaller projects are more limited by channel area.
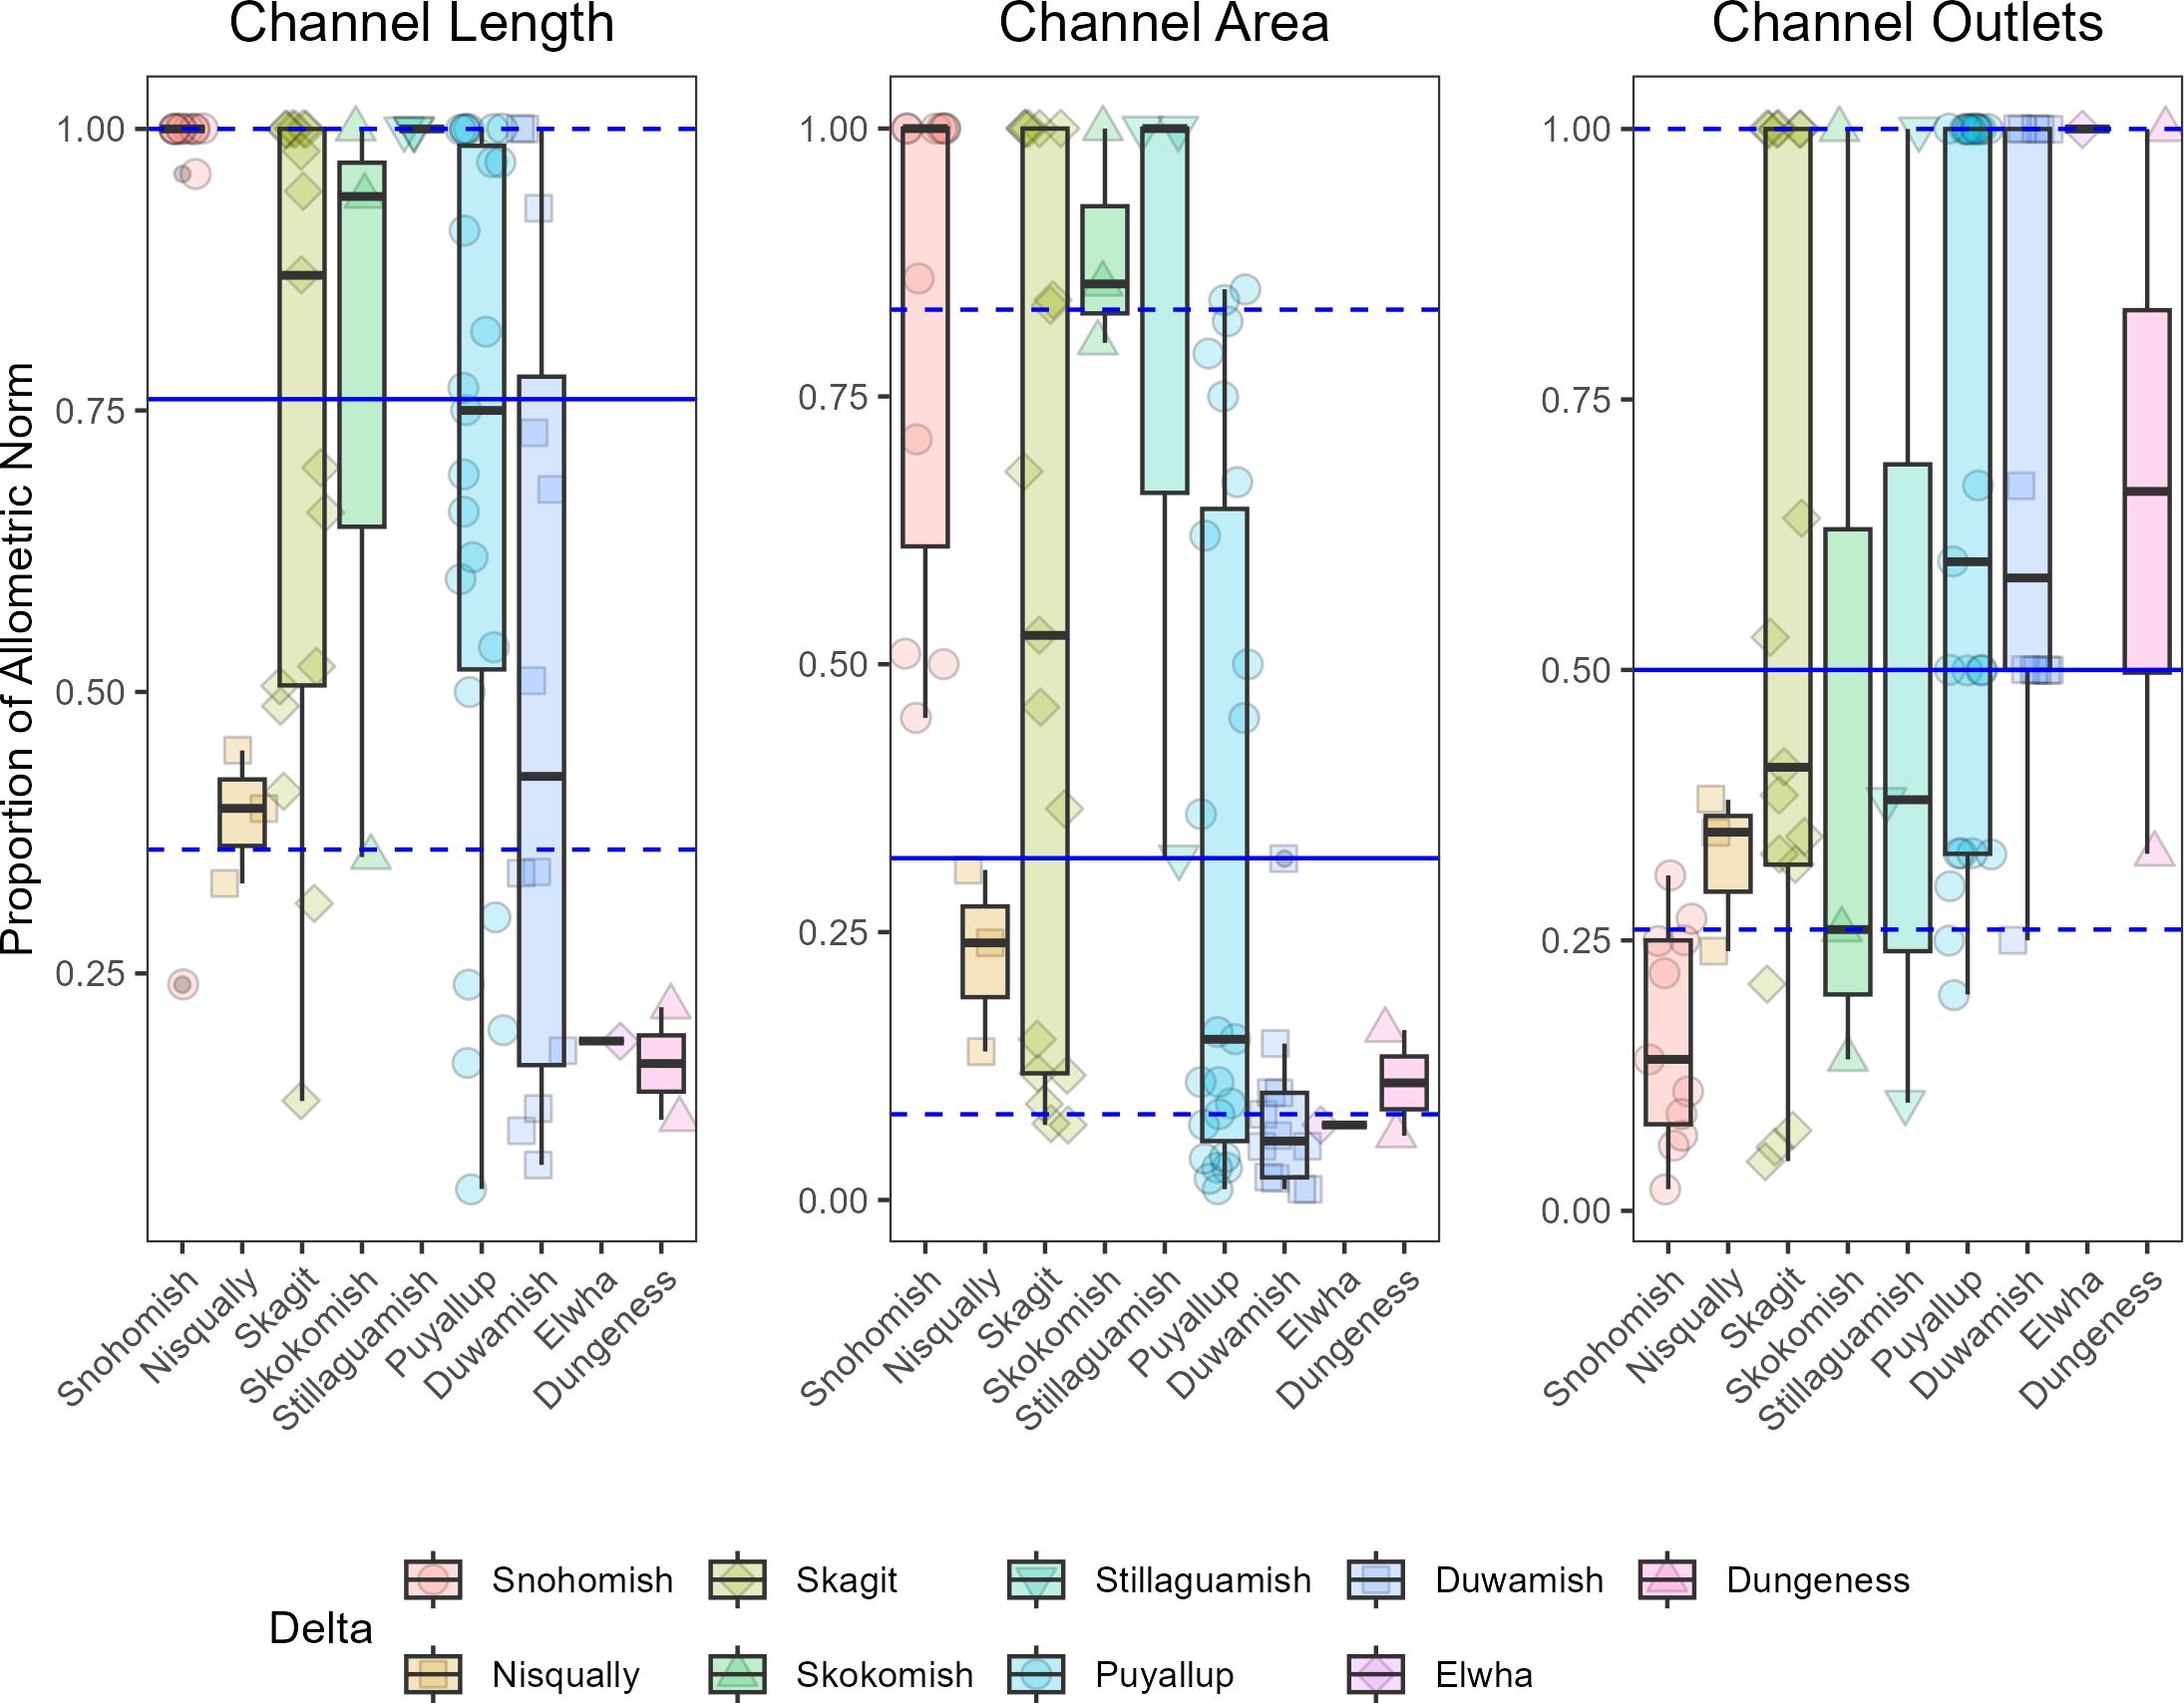
Figure 6. Boxplots for the proportion of estimated allometric norm across all projects for each of the tidal delta landform features used to calculate functional footprints. Each point represents an individual restoration project as estimated in 2018. Deltas are ordered along the x axis from highest to lowest increase in total restoration footprint. Blue lines represent median (solid), 25th (dashed), and 75th (dashed) quantiles for each feature over all deltas.
Discussion
Our analysis of habitat change in tidal deltas across Puget Sound indicates restoration actions have increased estuarine habitat throughout the region. Restoration actions have successfully increased the total footprint of available habitat as well as the length and area of tidal channels within and across all deltas we evaluated. While trends in habitat change are generally positive, trajectories of the habitat increases remain variable among deltas. Estimated trends in functional footprints were also positive in most deltas though they never reached 100% functionality during the years we evaluated. In some locations they appear to remain flat in comparison to increases in total footprint. Discrepancies between total and functional footprint appear to be driven by the number of channel outlets within each project site rather than tidal channel length or area, though there may be some relationship between delta and/or project size that influences this relationship. Below we interpret and discuss nuances among deltas with respect to channel area and length, total and functional footprints, and the implications for fish use and local recovery/restoration planning.
Though both PRA and PRL increased across the majority of deltas, slight differences existed between the trends for each metric and among deltas. After each restoration action, PRL and PRA increased immediately, reflecting newly available habitat within each project site. However, decreases in both PRA and PRL were observed among several deltas. In general, changes in PRL and PRA were due to channel filling after tidal reconnection; this was most observable where previously existing channels (e.g. agricultural/irrigation ditches) remained initially after project completion but quickly filled in with mobilized sediment. Decreases in PRL of any notable magnitude occurred in only the Skokomish and Stillaguamish deltas and were attributed to channel filling. Decreases in PRA were more widespread and occurred in greater magnitude compared to changes in PRL. However, the decrease within the Skokomish was largely attributed to a substantial change to a previously large tidal channel which became a distributary channel after project completion. Changes within the Elwha delta were unique for several reasons. First, the habitat change measured in our time series was the result of a large dam removal and not due to restoration within the tidal delta. Dam removal mobilized 11 Mt of sediment trapped within two upstream reservoirs (Warrick et al., 2015). Prior to dam removal the Elwha delta was characterized by few large tidal channels. After removal and mobilization of sediment, the majority of the large channels were filled, the delta front moved seaward, and numerous small channels were formed. The result was a substantial decrease in PRA with concurrent increases in PRL and delta footprint.
Tidal channel morphology after restoration of tidal connectivity is highly dynamic and depends upon several local features and processes (D’Alpaos et al., 2005; Belliard et al., 2015). Changes in tidal channel length often occur rapidly after initial actions that restore connectivity (Vandenbruwaene et al., 2012) whereas changes in area generally occur in cross-section, which influences channel volume (D’Alpaos et al., 2006). The observed changes in PRA using our methods may not completely reflect the physical processes that may occur in these tidal channels post-restoration. For example, simultaneous changes to depth that would increase channel volume would not be detected by tracking channel surface area.
Comparisons between total and functional footprints revealed notable patterns with potentially large implications for restoration and recovery. Functional footprints were lower than total footprints in all deltas, and this discrepancy varied considerably among deltas. In some cases, functional footprints were 3-4x less than the area estimated by total footprint representing a reduction of up to 75% for functional habitat. Among the features we used to estimate functionality, the median proportion of allometric norm across all deltas was lowest for channel area. This was especially true for the deltas with the smallest footprints (Figure 6). Small projects generally include a single, yet large, tidal channel that is often well over the predicted allometric norm for tidal channel area given the small footprint. Channel outlet counts also appeared to limit functional trajectories, most notably in larger deltas which include the larger project footprints (Figure 6). Evaluating these apparent limitations and developing strategies to improve functionality for existing and planned actions should be a regional priority.
While the current assessment provides a suitable tool for tracking habitat change, methods for documenting status and trends in habitat availability and functionality can continue to be improved. Most notably, increasing the frequency of periodic assessments would likely improve the accuracy of estimates for absolute habitat change, the rate of change within each project site/delta, and our understanding of how restoring habitats evolve through time and on shorter time scales. Ideally, assessments performed after implementation of each individual project within a given delta would provide a notable improvement. However, such efforts can be both costly and time intensive creating a challenge for researchers and managers regionally. Finding a balance between improved accuracy and practical challenges of these exercises is warranted.
Our estimates of functional footprints are based upon a definition of functionality that is practical but remains rather coarse and has limitations. We focus on only three easily measured features of tidal channels to evaluate the functional trajectory compared to a reference norm. Several other planform features exist (e.g. channel magnitude, channel order), each with similar scaling properties, and could be added or substituted in a model to potentially improve estimates of functionality (Hood, 2015). However, to the extent that planform geometry is an indicator of channel and elevational structure that result in beneficial velocities and predator refugia, this metric may be a coarse proxy for functionality within a restoration project. Our use of planform geometry features to estimate functionality may be more representative of capacity and opportunity rather than actual realized function (physiological or behavior response; Simenstad and Cordell, 2000). Our assessment does not capture changes in function due to expansion/contraction of marsh surface area, and in particular vegetated surface area. Sediment deposition/distribution, elevation changes, and vegetation recruitment may be more representative of true function as they relate to prey inputs and thermal conditions. Nevertheless, these processes depend entirely on tidal channel networks and planform features as the primary pathways controlling where, and how quickly, changes within a site occur and the trajectory toward functionality (French and Stoddart, 1992; Rinaldo et al., 2004; Fagherazzi et al., 2013; Fleri et al., 2019). Further research into tools to estimate functionality would clarify the degree to which planform geometry supports further habitat function from elevational and vegetation change.
The observed increases in estuary habitat over the last two decades in Puget Sound are undoubtedly positive for the species that rely on these habitats. Specifically, juvenile Chinook salmon have been documented extensively inhabiting tidal deltas throughout the region (Greene et al., 2021; Chamberlin et al., 2022; Davis et al., 2019; David et al., 2014; Cordell et al., 2011). Puget Sound Chinook salmon populations have benefited in multiple ways as a function of restoration of degraded estuarine habitats. Demographic benefits are apparent soon after restoration due to increased availability of tidal delta habitat and expanded capacity to support higher abundances (Greene et al., 2025). Estuary restoration has also resulted in increased survival to adulthood, a direct influence on population recovery (Greene et al., 2024). The former benefits were apparent immediately after restoration and the latter appeared to materialize after a number of years. Therefore, tracking both species/population response and restoration project trajectory toward functionality through time well beyond the completion of restoration actions remain critical.
The time series of habitat change adds to a body of work informing progress toward current recovery goals with respect to habitat restoration. Our work builds upon previous efforts by providing a multi-metric assessment of habitat change across numerous deltas that expands the conventional measurement for habitat restoration in Puget Sound estuaries (hectares/acres) to be more inclusive and representative of juvenile salmon habitat. Our methods for estimating functional footprint provide both an additional accounting metric that is useful for comparing against restoration goals as well as informing adaptive management actions. Current recovery plans generally set restoration goals based on total footprint such as achieving a particular amount of estuary habitat by a particular date. These targets are often based on projections of capacity or ability to support some level of population moving toward or at recovered levels. However, if we believe that estimates of functional footprint are more directly relevant to fish use and habitat productivity, incorporating this alternative metric into recovery plans may create targets that align more closely with true ecological function. As a tool for measuring incremental effectiveness of a specific site based on the trajectory toward comparable norms, periodic assessment of an individual project may provide managers with useful data points for adaptive management decisions. Should estimates for functional footprint stabilize below projected norms managers could identify adaptive management actions necessary to improve habitat structure to guide the project toward its intended state and optimal function.
Conclusions
Efforts by tribes, as well as local, state, federal agencies, to restore severely degraded estuarine habitats have contributed substantially toward the recovery of an iconic species. Benefits to juvenile salmon are clearly evident and continue to accrue where additional habitat is restored throughout the region. In addition, these benefits extend beyond listed salmonids, creating functional habitat to support multiple species as well as provide ecosystem services for the people that depend upon these environments. As a result of these collaborative actions, trends in habitat loss that began in the 1800s have, for the time being, been reversed. Yet, challenges remain as climate change and sea level rise continue to threaten these habitats and the recent gains from restoration. Continuing to accurately track changes to estuarine habitat and improving estimates for functionality should benefit recovery efforts and support management decisions in the future.
Data availability statement
The raw data supporting the conclusions of this article will be made available by the authors, without undue reservation.
Author contributions
JC: Conceptualization, Data curation, Formal Analysis, Funding acquisition, Methodology, Supervision, Writing – original draft, Writing – review & editing. OS: Formal Analysis, Methodology, Visualization, Writing – review & editing. EB: Conceptualization, Data curation, Methodology, Writing – review & editing. CG: Conceptualization, Methodology, Writing – review & editing. WGH: Data curation, Writing – review & editing. SM: Writing – review & editing.
Funding
The author(s) declare that financial support was received for the research and/or publication of this article. This work was funded by the Washington Recreation and Conservation Office through the Washington Department of Fish and Wildlife Estuary and Salmon Restoration Program grant # 18-2248.
Acknowledgments
We’d like to thank the many individuals that provided guidance on restoration actions within specific deltas, Specifically, Lisa Bellaveau and Joeseph Pavel (Skokomish), Andrew Berger and Russ Ladley (Puyallup), Chris Ellings and Sayre Hodgson (Nisqually). We would also like to thank Mary Ramirez, Jason Hall, and Shelby Burgess for their input during initial discussion and providing additional data for the project.
Conflict of interest
The authors declare that the research was conducted in the absence of any commercial or financial relationships that could be construed as a potential conflict of interest.
Generative AI statement
The author(s) declare that no Generative AI was used in the creation of this manuscript.
Publisher’s note
All claims expressed in this article are solely those of the authors and do not necessarily represent those of their affiliated organizations, or those of the publisher, the editors and the reviewers. Any product that may be evaluated in this article, or claim that may be made by its manufacturer, is not guaranteed or endorsed by the publisher.
Supplementary material
The Supplementary Material for this article can be found online at: https://www.frontiersin.org/articles/10.3389/fmars.2025.1549344/full#supplementary-material
Supplementary Figure 1 | Process for estimating percent functionality for a given restoration project across three metrics tidal channel attributes.
References
Barbier E. B., Hacker S. D., Kennedy C., Koch E. W., Stier A. C., and Silliman B. R. (2011). The value of estuarine and coastal ecosystem services. Ecol. Monogr. 81, 169–193. doi: 10.1890/10-1510.1
Beamer E., McBride A., Greene C., Henderson R., Hood G., Wolf K., et al. (2005). Delta and Nearshore Restoration for the Recovery of Wild Skagit River Chinook Salmon: Linking Estuary Restoration to Wild Chinook Salmon Populations (La Conner, WA: Appendix D of the Skagit Chinook Recovery Plan, Skagit River System Cooperative).
Beamer E. M., Greene C. M., Chamberlin J. W., Hood W. G., Ellings C. S., Hodgson S., et al. (2024). Landscape determinants of aquatic estuarine habitat use by juvenile Chinook salmon. Can. J. Fisheries Aquat. Sci. 81, 747–767. doi: 10.1139/cjfas-2023-0249
Beck M. W., Heck K. L., Able K. W., Childers D. L., Eggleston D. B., Gillanders B. M., et al. (2001). The Identification, Conservation, and Management of Estuarine and Marine Nurseries for Fish and Invertebrates: A better understanding of the habitats that serve as nurseries for marine species and the factors that create site-specific variability in nursery quality will improve conservation and management of these areas. BioScience 51, 633–641. doi: 10.1641/0006-3568(2001)051[0633:TICAMO]2.0.CO;2
Beechie T. J., Collins B. D., and Pess G. R. (2001). “Holocene and recent geomorphic processes, land use, and salmonid habitat in two North Puget Sound River Basins,” Geomorphic processes and riverine habitat, eds. Dorava, et al. Pages 37-54. (American Geophysical Union), 253. doi: 10.1029/WS004p0037
Beechie T. J., Stefankiv O., Timpane-Padgham B. L., Hall J., Pess G. R., Rowse M. L., et al. (2017). Monitoring Salmon Habitat Status and Trends in Puget Sound: Development of Sample Designs, Monitoring Metrics, and Sampling Protocols for Large River, Floodplain, Delta, and Nearshore Environments. U.S. Department of Commerce, NOAA Technical Memorandum NMFS-NWFSC-13. doi: 10.7289/V5/TM-NWFSC-137
Belliard J. P., Toffolon M., Carniello L., and D’Alpaos A. (2015). An ecogeomorphic model of tidal channel initiation and elaboration in progressive marsh accretional contexts. J. Geophysical Res.: Earth Surface 120, 1040–1064. doi: 10.1002/2015JF003445
Booth D. B. (1994). Glaciofluvial infilling and scour of the Puget Lowland, Washington, during ice-sheet glaciation. Geology 22, 695–698. doi: 10.1130/0091-7613(1994)022<0695:GIASOT>2.3.CO;2
Brophy L. S., Greene C. M., Hare V. C., Holycross B., Lanier A., Heady W. N., et al. (2019). Insights into estuary habitat loss in the western United States using a new method for mapping maximum extent of tidal wetlands. PloS One 14, e0218558. doi: 10.1371/journal.pone.0218558
Chamberlin J. (2022). Chinook Salmon Use of Tidal Delta Habitats: Synthesis for Snohomish Recovery Plan Revision (Seattle WA: U.S. Department of Commerce, NOAA Contract Report NMFS-NWFSC-CR-2022-01).
Chamberlin J. W., Hall J., Zackey W. T., Leonetti F., Rustay M., and Rice C. (2022). Spatial and temporal variability in Chinook salmon abundance reflects opportunity to support life history diversity in an estuarine landscape. Estuaries Coasts 45, 882–896. doi: 10.1007/s12237-021-00994-3
Collins B. D. and Montgomery D. R. (2011). The legacy of Pleistocene glaciation and the organization of lowland alluvial process domains in the Puget Sound region. Geomorphology 126, 174–185. doi: 10.1016/j.geomorph.2010.11.002
Collins B. D., Montgomery D. R., and Sheikh A. J. (2003). “Reconstructing the historical riverine landscape of the Puget Lowland,” Restoring Puget Sound Rivers, eds. Montgomery, et al. pages 79–128. (Seattle, WA: University of Washington Press), 512.
Cordell J. R., Toft J. D., Gray A., Ruggerone G. T., and Cooksey M. (2011). Functions of restored wetlands for juvenile salmon in an industrialized estuary. Ecol. Eng. 37, 343–353. doi: 10.1016/j.ecoleng.2010.11.028
D’Alpaos A., Lanzoni S., Marani M., Fagherazzi S., and Rinaldo A. (2005). Tidal network ontogeny: Channel initiation and early development. J. Geophysical Res.: Earth Surface 110. doi: 10.1029/2004JF000182
D’Alpaos A., Lanzoni S., Mudd S. M., and Fagherazzi S. (2006). Modeling the influence of hydroperiod and vegetation on the cross-sectional formation of tidal channels. Estuarine Coast. Shelf Sci. 69, 311–324. doi: 10.1016/j.ecss.2006.05.002
David A. T., Ellings C. S., Woo I., Simenstad C. A., Takekawa J. Y., Turner K. L., et al. (2014). Foraging and growth potential of juvenile chinook salmon after tidal restoration of a large river delta. Trans. Am. Fisheries Soc. 143, 1515–1529. doi: 10.1080/00028487.2014.945663
Davis M. J., Woo I., Ellings C. S., Hodgson S., Beauchamp D. A., Nakai G., et al. (2019). Freshwater Tidal Forests and Estuarine Wetlands May Confer Early Life Growth Advantages for Delta-Reared Chinook Salmon. Trans. Am. Fish. Soc. 148 (2), 289–307.
Elliott M., Mander L., Mazik K., Simenstad C., Valesini F., Whitfield A., et al. (2016). Ecoengineering with Ecohydrology: Successes and failures in estuarine restoration. Estuarine Coast. Shelf Sci. 176, 12–35. doi: 10.1016/j.ecss.2016.04.003
Fagherazzi S., Wiberg P. L., Temmerman S., Struyf E., Zhao Y., and Raymond P. A. (2013). Fluxes of water, sediments, and biogeochemical compounds in salt marshes. Ecol. Processes 2, 3. doi: 10.1186/2192-1709-2-3
Fleri J. R., Lera S., Gerevini A., Staver L., and Nardin W. (2019). Empirical observations and numerical modelling of tides, channel morphology, and vegetative effects on accretion in a restored tidal marsh. Earth Surface Processes Landforms 44, 2223–2235. doi: 10.1002/esp.v44.11
French J. R. and Stoddart D. R. (1992). Hydrodynamics of salt marsh creek systems: Implications for marsh morphological development and material exchange. Earth Surface Processes Landforms 17, 235–252. doi: 10.1002/esp.3290170304
Gewant D. and Bollens S. M. (2012). Fish assemblages of interior tidal marsh channels in relation to environmental variables in the upper San Francisco Estuary. Environ. Biol. Fishes 94, 483–499. doi: 10.1007/s10641-011-9963-3
Gray A., Simenstad C. A., Bottom D. L., and Cornwell T. J. (2002). Contrasting functional performance of juvenile salmon habitat in recovering wetlands of the Salmon River estuary, Oregon, USA. Restor. Ecol. 10, 514–526. doi: 10.1046/j.1526-100X.2002.01039.x
Greene C. M., Beamer E., Chamberlin J., Hood G., Davis M., Larsen K., et al. (2021). Landscape, density-dependent, and bioenergetic influences upon Chinook salmon in tidal delta habitats: Comparison of four Puget Sound estuaries (ESRP Report 13-1508) (Olympia WA: Estuary and Salmon Restoration Program).
Greene C. M., Beamer E. M., Munsch S. H., Chamberlin J. W., LeMoine M. T., and Anderson J. H. (2025) Population responses of Chinook salmon to two decades of restoration of estuary nursery habitat. Front. Mar. Sci. 12 - 2025.
Greene C. M., Chamberlin J., Munsch S., Anderson J., Beamer E., Belleveau L., et al. (2024). Multi-scale assessment of population responses to estuary restoration for Puget Sound Chinook Salmon, Final report (ESRP Project 18-2248) (Olympia WA: Estuary and Salmon Restoration Program), 188.
Hall J., Burgess S., Ross K., Small D., Gatchell R., Beechie T., et al. (2021). Mapping tidal connectivity restrictions to support identification and evaluation of restoration opportunities in Puget Sound. PRISM 18-2250P. Final Report to the Washington State Restoration and Conservation Office Estuary and Salmon Restoration Program, Olympia, WA.
Hobbs R. J. and Norton D. A. (1996). Towards a conceptual framework for restoration ecology. Restor. Ecol. 4, 93–110. doi: 10.1111/j.1526-100X.1996.tb00112.x
Hood W. G. (2002). Application of landscape allometry to restoration of tidal channels. Restor. Ecol. 10, 213–222. doi: 10.1046/j.1526-100X.2002.02034.x
Hood W. G. (2007). Scaling tidal channel geometry with marsh island area: A tool for habitat restoration, linked to channel formation process. Water Resour. Res. 43. doi: 10.1029/2006WR005083
Hood W. G. (2014). Differences in tidal channel network geometry between reference marshes and marshes restored by historical dike breaching. Ecol. Eng. 71, 563–573. doi: 10.1016/j.ecoleng.2014.07.076
Hood W. G. (2015). Geographic variation in Puget Sound tidal channel planform geometry. Geomorphology 230, 98–108. doi: 10.1016/j.geomorph.2014.11.009
Hood W. G., Grossman E. E., and Veldhuisen C. (2016). Assessing Tidal Marsh Vulnerability to Sea-Level Rise in the Skagit Delta. Northwest Science 90, 79–93.
Lawrence P. J., Smith G. R., Sullivan M. J. P., and Mossman H. L. (2018). Restored saltmarshes lack the topographic diversity found in natural habitat. Ecol. Eng. 115, 58–66. doi: 10.1016/j.ecoleng.2018.02.007
Lefcheck J. S., Hughes B. B., Johnson A. J., Pfirrmann B. W., Rasher D. B., Smyth A. R., et al. (2019). Are coastal habitats important nurseries? A meta-analysis. Conserv. Lett. 12, e12645. doi: 10.1111/conl.12645
Lengyel S., Déri E., Varga Z., Horváth R., Tóthmérész B., Henry P.-Y., et al. (2008). Habitat monitoring in Europe: a description of current practices. Biodiversity Conserv. 17, 3327–3339. doi: 10.1007/s10531-008-9395-3
Lotze H. K., Lenihan H. S., Bourque B. J., Bradbury R. H., Cooke R. G., Kay M. C., et al. (2006). Depletion, degradation, and recovery potential of estuaries and coastal seas. Science 312 (5781), 1806–1809. doi: 10.1126/science.1128035
Moritsch M. M., Byrd K. B., Davis M., Good A., Drexler J. Z., Morris J. T., et al. (2022). Can coastal habitats rise to the challenge? Resilience of estuarine habitats, carbon accumulation, and economic value to sea-level rise in a puget sound estuary. Estuaries Coasts 45, 2293–2309. doi: 10.1007/s12237-022-01087-5
Nagendra H., Lucas R., Honrado J. P., Jongman R. H. G., Tarantino C., Adamo M., et al. (2013). Remote sensing for conservation monitoring: Assessing protected areas, habitat extent, habitat condition, species diversity, and threats. Ecol. Indic. 33, 45–59. doi: 10.1016/j.ecolind.2012.09.014
Puget Sound Nearshore Ecosystem Project Change Analysis. (2011). Puget Sound Nearshore Report No. 2011-01 (Seattle, Washington: Washington Department of Fish and Wildlife, Olympia, Washington, and U.S. Army Corps of Engineers).
Ramirez M. (2019a). Estuary extent in Puget Sound: reporting on the Chinook Salmon Recovery Estuaries Common Indicator (Seattle WA: Puget Sound Partnership, University of Washington, Seattle).
Ramirez M. (2019b). Tracking estuarine wetland restoration in Puget Sound: Reporting on the Puget Sound Estuaries Vital Sign Indicator (Seattle WA: Puget Sound Partnership, University of Washington, Seattle).
Rinaldo A., Belluco E., D’Alpaos A., Feola A., Lanzoni S., and Marani M. (2004). “Tidal Networks: form and Function,” in The Ecogeomorphology of Tidal Marshes (American Geophysical Union), 75–91.
Rozsa R. (2012). “Restoration of Tidal Flow to Degraded Tidal Wetlands in Connecticut,” in Tidal Marsh Restoration: A Synthesis of Science and Management. Eds. Roman C. T. and Burdick D. M. (Island Press/Center for Resource Economics, Washington, DC), 147–155.
Sanderson E. W., Ustin S. L., and Foin T. C. (2000). The influence of tidalchannels on the distribution of salt marsh plant species in PetalumaMarsh, CA, USA. Plant Ecol. 146, 29–41. doi: 10.1023/A:1009882110988
Sheaves M., Baker R., Nagelkerken I., and Connolly R. M. (2015). True value of estuarine and coastal nurseries for fish: incorporating complexity and dynamics. Estuaries Coasts 38, 401–414. doi: 10.1007/s12237-014-9846-x
Simenstad C. A. and Cordell J. R. (2000). Ecological assessment criteria for restoring anadromous salmonid habitat in Pacific Northwest estuaries. Ecol. Eng. 15, 283–302. doi: 10.1016/S0925-8574(00)00082-3
Simenstad C. A., Fresh K. L., and Salo E. O. (1982). “The role of Puget Sound and Washington coastal estuaries in the life history of Pacific salmon: an unappreciated function,” in Estuarine comparisons (New York, NY: Academic Press), 343–364.
Simenstad C. A. and Thom R. M. (1996). Functional equivalency trajectories of the restored Gog-Le-Hi-Te estuarine wetland. Ecol. Appl. 6, 38–56. doi: 10.2307/2269551
Stefankiv O., Hall J. E., Timpane-Padgham B. L., Nicol C., Fogel C., Beechie T. J., et al. (2019). Salmon habitat status and trends: Monitoring protocols (Seattle, WA: NWFSC Processed Report 2019-03, Northwest Fisheries Science Center, National Marine Fisheries Service, National Oceanic and Atmospheric Administration).
Stewart D., Lievesley M., Paterson J. E., Hennigar D., Ingham R., Knight R., et al. (2024). Factors influencing the resilience of created tidal marshes in the fraser river estuary, British Columbia. Wetlands 44, 53. doi: 10.1007/s13157-024-01802-x
Thom R. M., Zeigler R., and Borde A. B. (2002). Floristic development patterns in a restored Elk River estuarine Marsh, Grays Harbor, Washington. Restor. Ecol. 10, 487–496. doi: 10.1046/j.1526-100X.2002.01038.x
Vandenbruwaene W., Meire P., and Temmerman S. (2012). Formation and evolution of a tidal channel network within a constructed tidal marsh. Geomorphology 151-152, 114–125. doi: 10.1016/j.geomorph.2012.01.022
Warrick J. A., Bountry J. A., East A. E., Magirl C. S., Randle T. J., Gelfenbaum G., et al. (2015). Large-scale dam removal on the Elwha River, Washington, USA: Source-to-sink sediment budget and synthesis. Geomorphology 246, 729–750. doi: 10.1016/j.geomorph.2015.01.010
Williams P. B., Orr M. K., and Garrity N. J. (2002). Hydraulic geometry: A geomorphic design tool for tidal marsh channel evolution in wetland restoration projects. Restor. Ecol. 10, 577–590. doi: 10.1046/j.1526-100X.2002.t01-1-02035.x
Williams G. D. and Zedler J. B. (1999). Fish assemblage composition in constructed and natural tidal marshes of San Diego Bay: Relative influence of channel morphology and restoration history. Estuaries 22, 702–716. doi: 10.2307/1353057
Wu Y., Liu J., Yan G., Zhai J., Cong L., Dai L., et al. (2020). The size and distribution of tidal creeks affects salt marsh restoration. J. Environ. Manage. 259, 110070. doi: 10.1016/j.jenvman.2020.110070
Keywords: estuary, restoration, habitat function, functional trajectory, juvenile salmon
Citation: Chamberlin JW, Stefankiv O, Beamer EM, Greene CM, Hood WG and Munsch SH (2025) Estimating estuary habitat change and functional trajectory of restoration projects over two decades in Puget Sound, WA. Front. Mar. Sci. 12:1549344. doi: 10.3389/fmars.2025.1549344
Received: 20 December 2024; Accepted: 30 May 2025;
Published: 11 July 2025.
Edited by:
Alberto Basset, University of Salento, ItalyReviewed by:
Susan Harrell Yee, United States Environmental Protection Agency, United StatesAshley Mae McDonald, Dauphin Island Sea Lab, United States
Zachary Long, University of North Carolina Wilmington, United States
Copyright © 2025 Chamberlin, Stefankiv, Beamer, Greene, Hood and Munsch. This is an open-access article distributed under the terms of the Creative Commons Attribution License (CC BY). The use, distribution or reproduction in other forums is permitted, provided the original author(s) and the copyright owner(s) are credited and that the original publication in this journal is cited, in accordance with accepted academic practice. No use, distribution or reproduction is permitted which does not comply with these terms.
*Correspondence: Joshua W. Chamberlin, am9zaHVhLmNoYW1iZXJsaW5Abm9hYS5nb3Y=