 Jincheng Zhao1,2
 Jiawei He1,2
 Cai Li1,3,4*Zeming Yang1,5Cong Liu1,2Xianqing Zhang1,2Min Qin1,2Dejing Tang1,2
 Wen Zhou1Zhantang Xu1
 Yuanyue Cheng1
- 1State Key Laboratory of Tropical Oceanography, South China Sea Institute of Oceanology, Chinese Academy of Sciences, Guangzhou, China
- 2University of Chinese Academy of Sciences, Beijing, China
- 3Laboratory of Tropical Oceanography, South China Sea Institute of Oceanology, Chinese Academy of Sciences, Guangzhou, China
- 4Guangdong Key Lab of Ocean Remote Sensing, South China Sea Institute of Oceanology, Chinese Academy of Sciences, Guangzhou, China
- 5Sanya Institute of Ocean Eco-Environmental Engineering, Sanya, China
Nutrients are crucial factors for the growth of phytoplankton, and their biogeochemical processes directly impact marine biodiversity. In this study, based on two cruise observations in spring and summer of 2024, the seasonal and spatial variations of nutrients, chlorophyll a, and other ecological indicators in Daya Bay were explored. The results indicated that the average concentrations of dissolved inorganic nitrogen and silicate were 3.61 ± 3.99 µM and 26.27 ± 13.91 µM in summer, respectively, compared with 2.48 ± 1.53 µM and 23.8 ± 6.77 µM in spring. The average concentration of dissolved inorganic phosphate was 0.29 ± 0.12 µM in summer, lower than 0.32 ± 0.09 µM in spring. The stoichiometric proportion among nutrients at most monitoring stations were far from Redfield ratio, and a succession from N-limited to P-limited was observed. A transformation has been observed in the dominant composition of dissolved inorganic nitrogen, shifting from ammonia to total oxidized nitrogen as the main component, which is mainly attributable to the decrease in aquaculture activities in Daya Bay over the last 3 years. In addition, the warm wastewater discharge from nuclear power stations directly influences the distribution of phytoplankton in the surrounding areas. This study provides timely information regarding recent shifts in ecological indicators and is significant to the ecological protection, environmental management, and policy adjustment in Daya Bay.
1 Introduction
As critical yet ecologically vulnerable transition zones, bays sustain dynamic interactions between marine and terrestrial ecosystems, thereby holding significant ecological functions and resource value (Greening et al., 2014; Zhang et al., 2020). However, the rapid marine economic expansion and intensified coastal development have amplified anthropogenic disturbances (e.g., industrial effluents, aquaculture effluents, and land reclamation), which disrupt nutrient cycling, accelerate biodiversity decline, and degrade ecosystems within bays (Liu et al., 2011; Jordan et al., 1997; Tsujimoto et al., 2006; Möllmann et al., 2009).
Daya Bay, located in the northern part of the South China Sea (113.50–114.83°E, 22.52–22.83°N), is an approximately 600-km2 semi-enclosed drowned-valley bay with both subtropical and tropical characteristics. The depth ranges from 6 to 16 m, and the average depth is 10 m (Xu, 1989). The Dan’ao River is the largest river discharging into Daya Bay, with an annual freshwater discharge of approximately 1.6 × 10⁸ m–3 a–1 (Li et al., 2019). With the large-scale economic development around the bay, the industry and aquaculture have experienced rapid growth. As the only bay with two nuclear power plants operating simultaneously in China, the effluent from nuclear power plants warmed the seawater with an average rate of 0.07°C year–1 (Yu et al., 2010; Wu et al., 2017), which decreased the abundance and diversity of plankton and consequently declined the fishery production (Hao et al., 2016). The nutrient input pathways into the bay included diffuse-source input (e.g., runoff input, atmospheric deposition, and subterranean groundwater efflux) and point-source input (e.g., terrestrial outfalls and aquacultural effluents). Approximately 1,150 m3/h sewage from petrochemical industries was directly discharged into the bay, containing petroleum hydrocarbons, heavy metals, sulfide, ammonia, and so on. The nutrient deposition (both dry and wet deposition) is predominantly dominated by nitrogen, with nitrogen deposition peaking during spring and summer, while phosphorus deposition flux remains relatively consistent throughout the year. Feed utilization inefficiencies also result in dissolved inorganic nutrients to aquatic environment. In Daya Bay, the mariculture area has expanded multifold (e.g., Dapeng cove, Aotou harbor, and Fanhe harbor), with a diversified aquaculture matrix integrating traditional wooden cages, deepwater cages, shellfish suspended longline culture, and bottom-seeding proliferation. Notably, this multi-aquaculture landscape coexists with substantial quantities of unregulated floating fish farms operating outside legal frameworks. The silicate in Daya Bay is primarily derived from terrestrial inputs, the coastal upwelling of eastern Guangdong, and organic matter decomposition, while its cycling processes within the ecosystem are predominantly mediated by plankton. Daya Bay is climatically governed by the East Asian Monsoon system and tidal current is of the irregular semi-diurnal type, characterized by a small tidal range and moderately low hydrodynamic exchange capacity (Rao et al., 2021). The residual currents predominantly form a clockwise circulation, which exhibits limited capacity to dilute and disperse nutrients (Wu et al., 2007). The peak period of feed input in deepwater cage mariculture typically occurs between June and August annually, and the nitrogen and phosphorus input accumulated and persisted within the bay over extended periods, leading to structural shifts in aquatic nutrient composition (Qingyang et al., 2017). Consequently, the long-term ecological monitoring networks supported by the Chinese Ecosystem Research Network (CERN) have been established in the aforementioned types of area to evaluate pollution load and ecological risk level. It is very important for socio-economical sustainable development to draft the relative management policy as well as recognize these environmental variations after regulation.
Previous studies have demonstrated that environmental degradation in Daya Bay is predominantly pollution-induced. In response to these findings, the Huizhou Municipal Government has implemented a suite of targeted management policies and mitigation measures since 2020 to address pollution-driven environmental deterioration, including stricter industrial discharge controls and aquaculture zoning regulations. However, significant knowledge gaps persist regarding the post-intervention spatial and seasonal variation, composition, and ecological impacts of dissolved inorganic nutrients in Daya Bay. Therefore, the purposes of this study are (1) to investigate the distribution characteristics of nutrients, Chl a, and other ecological indicators during seasons associated with importance of phytoplankton; (2) to elucidate the relationship between these indicators and gain insight into the biogeochemical cycles; and (3) to explore the reasons in the variation of nutrient composition. The results of this study provide timely information regarding the recent shift in the ecological indicators and are significant for the ecological protection, environmental management, and policy adjustment in Daya Bay.
2 Materials and methods
2.1 Study area
To comprehensively understand anthropogenic influence, nutrient levels, and its spatiotemporal variations in Daya Bay, the investigation was carried out at 16 stations in Daya Bay (Figure 1) based on the natural environmental characteristics and socio-economic activities and in conjunction with the CERN at Daya Bay and “Specifications on spot location of monitoring sites related to coastal area environment” in China (HJ730, 2014). S3, S8, S11, and S15 are located in the cage-culture waters. S4 and S5 are adjacent to nuclear power plants, Daya Bay, and Ling’ao nuclear power plants (red starts in Figure 1), which are the thermal discharge impact area. Seawater of bay interior is exchanged with that of Daya Bay through the bay mouth. S1 and S2 are set outside the bay mouth in order to compare with stations in the bay interior. S16 is set in the downstream area of the Dan’ao River, within a region significantly impacted by petrochemical industrial activities. S14 reflects the Fanhe harbor aquatic environment.
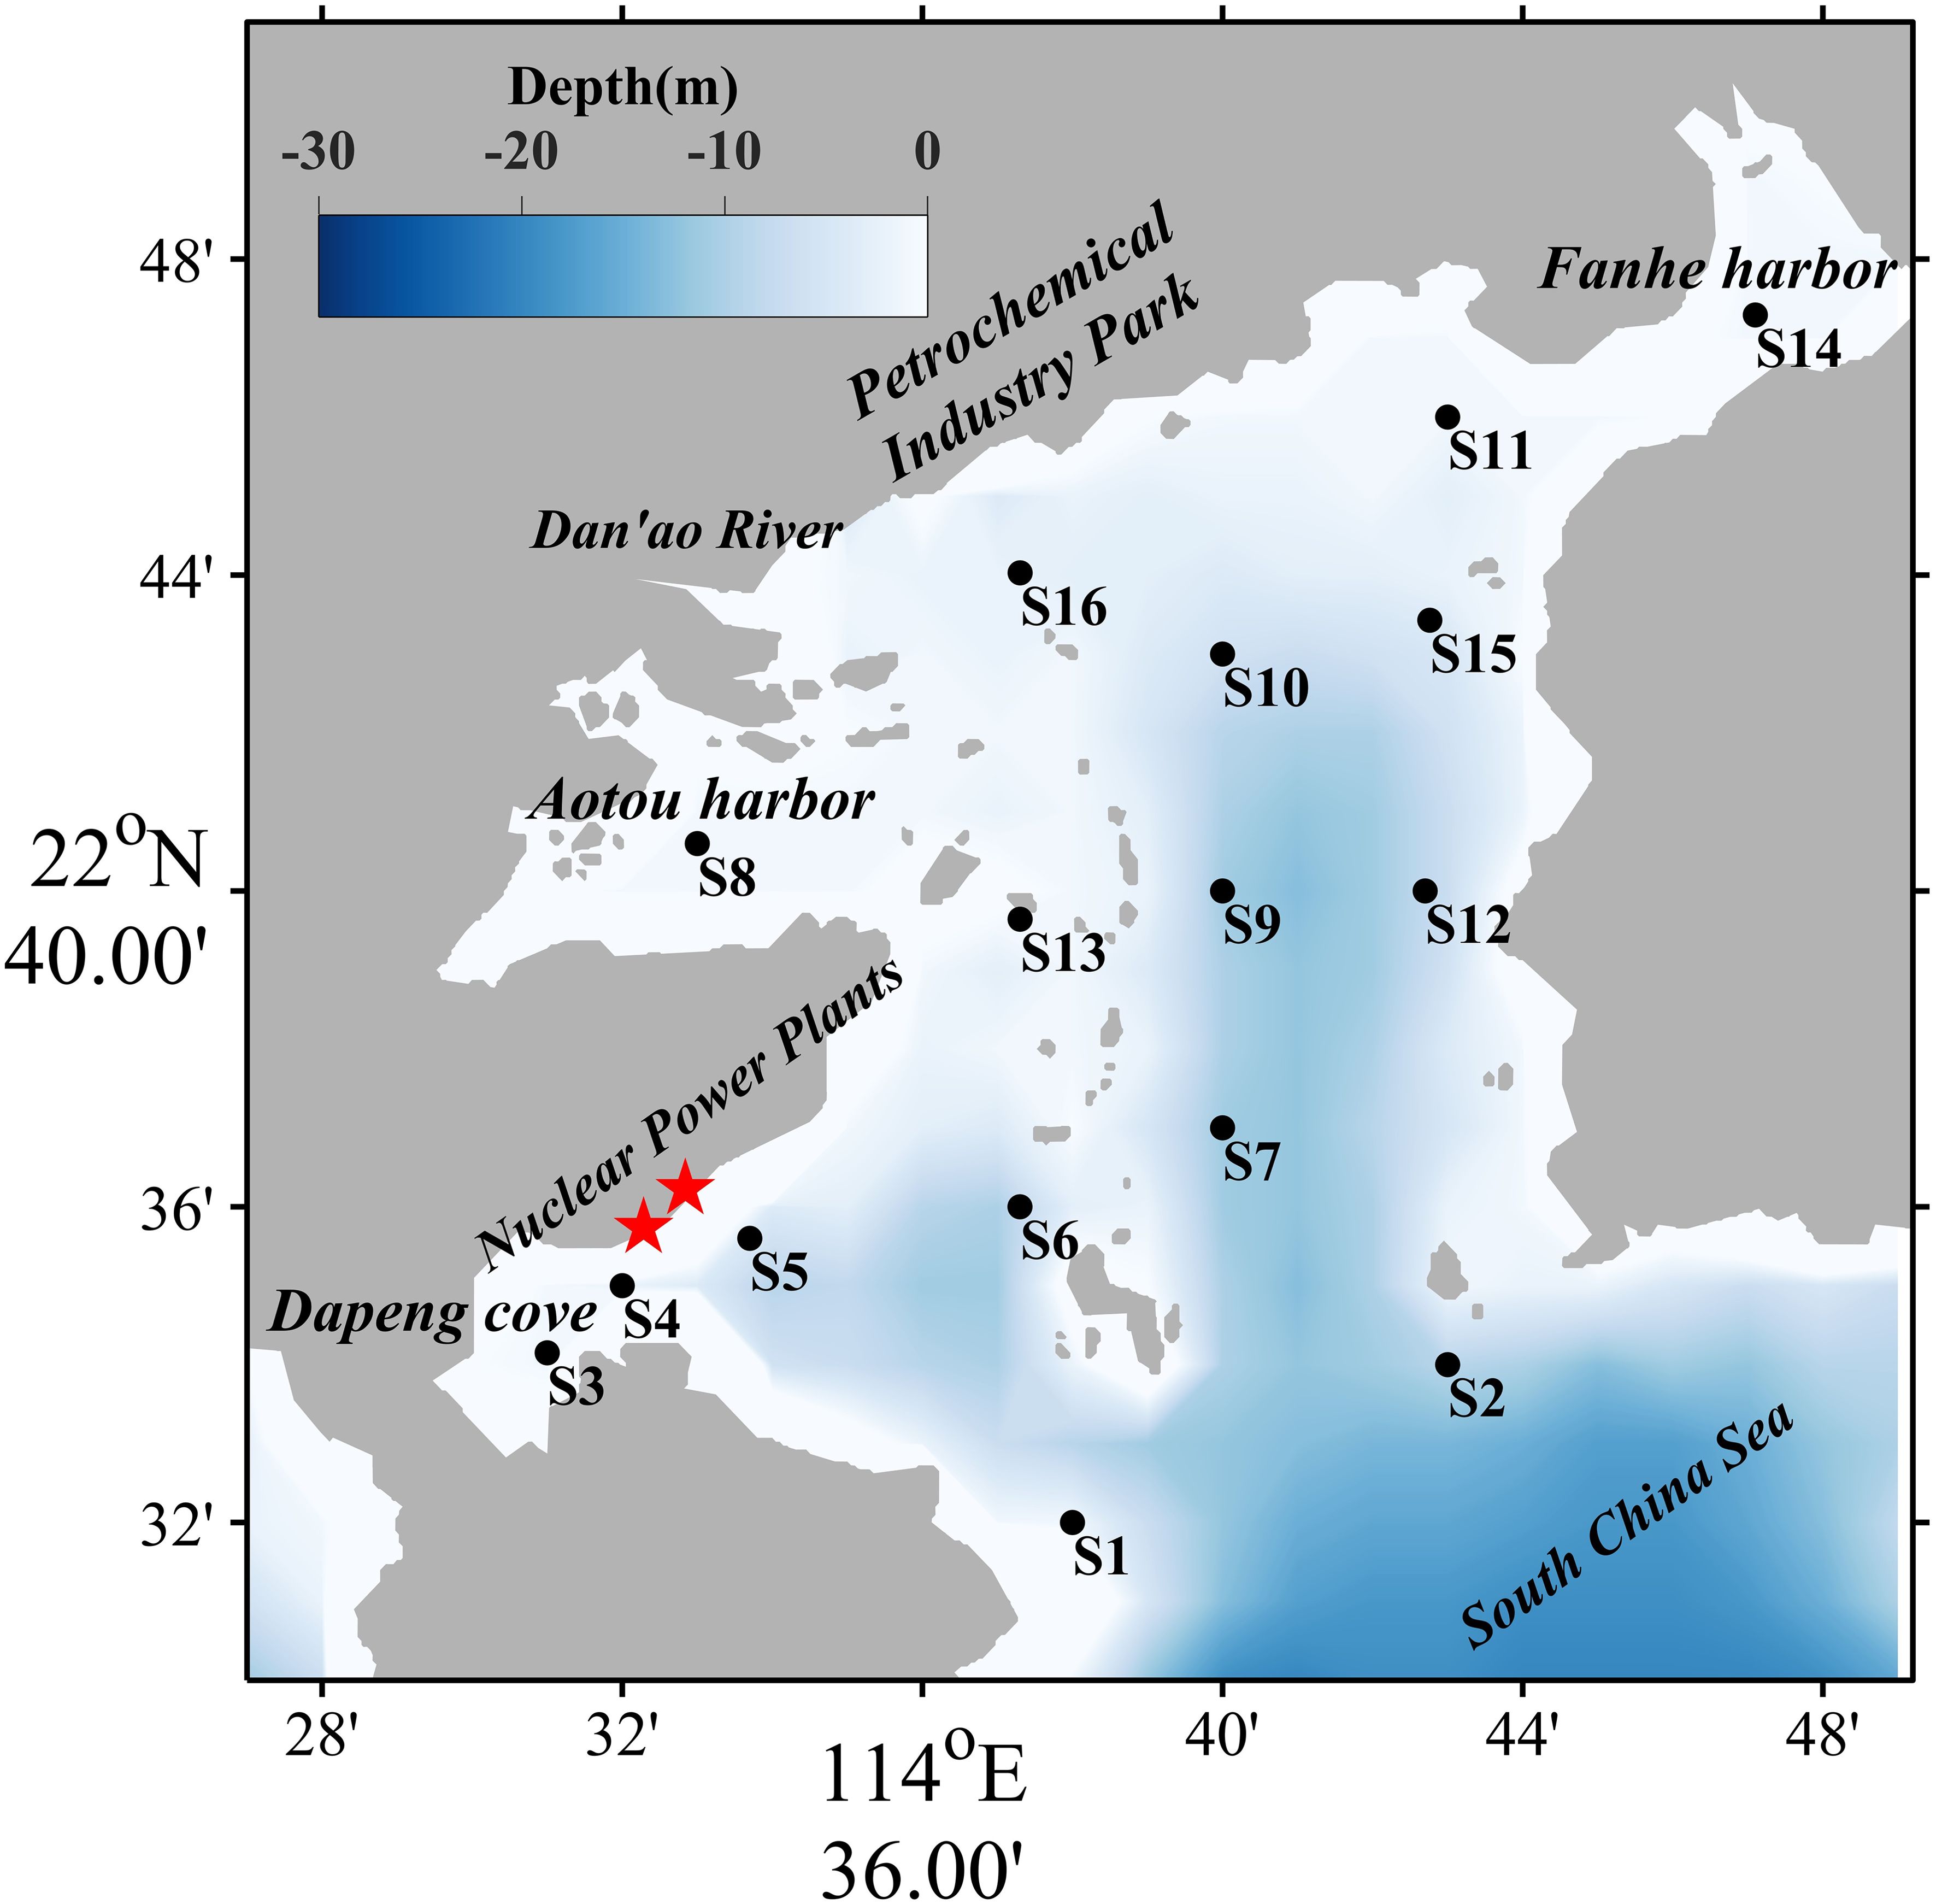
Figure 1. Stations for field sampling in Daya Bay.
2.2 Sample collection and analyses
According to the “Technical specification for offshore environmental monitoring” in China (HJ442.3, 2020), two research cruises were carried out in April and July in 2024, which referred to the spring and summer season, respectively, and the surface layer seawater samples were taken at 0.5 m below the surface using a portable water sampler, and the bottom layer seawater samples were acquired approximately 1 2 m above the seabed. The collected surface and bottom seawater samples were manually filtered by 0.22 m pore-size nylon syringe filters and then were frozen and transported to the laboratory on the same day for total oxidized nitrogen (nitrate plus nitrite, -N), ammonia (-N), phosphate (-P) and silicate (-Si) measurement, which were finished by microfluidic analyzers (Zhao et al., 2024; Yang et al., 2024) and a spectrophotometer (Lambda 650S, PerkinElmer, U.S.A) based on “The specification for marine monitoring” in China (GB17378.4, 2007). In this study, DIN included -N and -N, and -P and -Si were considered as DIP and DSi, respectively. Chl a, DO, salinity, turbidity, pH, temperature, and pressure were measured in situ by MINIpack CTD115M (Sea & Sun Technology, Germany). All data were consolidated using MATLAB and analyzed utilizing a correlation coefficient for the relationship between the ecological indicators mentioned above. Additionally, the relationships among all of these indicators were also analyzed by performing principal component analysis (PCA).
3 Results
3.1 The seasonal and spatial variations of nutrients in the surface and bottom seawater
DIN concentration in the surface seawater varied from 0.74 to 5.66 µM in spring, with an average of 2.67 ± 1.34 µM (Figure 2a); DIN concentration in the bottom seawater varied from 0.46 to 6.60 µM, with an average of 2.78 ± 1.72 µM (Figure 2b). The spatial distribution of DIN in the surface conformed with that in the bottom in spring, decreasing gradually from the bay interior to the bay mouth. The spatial distributions of DIN in summer are shown in Figures 2c, d, which exhibited a distinct difference between surface and bottom seawater. DIN concentration of surface seawater ranged from 0.74 to 12.27 µM, with an average of 2.89 ± 3.15 µM; the concentration of DIN decreased from the bay mouth to the bay interior. Bottom seawater DIN varied from 0.72 to 16.39 µM, with an average of 4.33 ± 4.69 µM, and the highest value occurred at S5 nearby nuclear power plants.
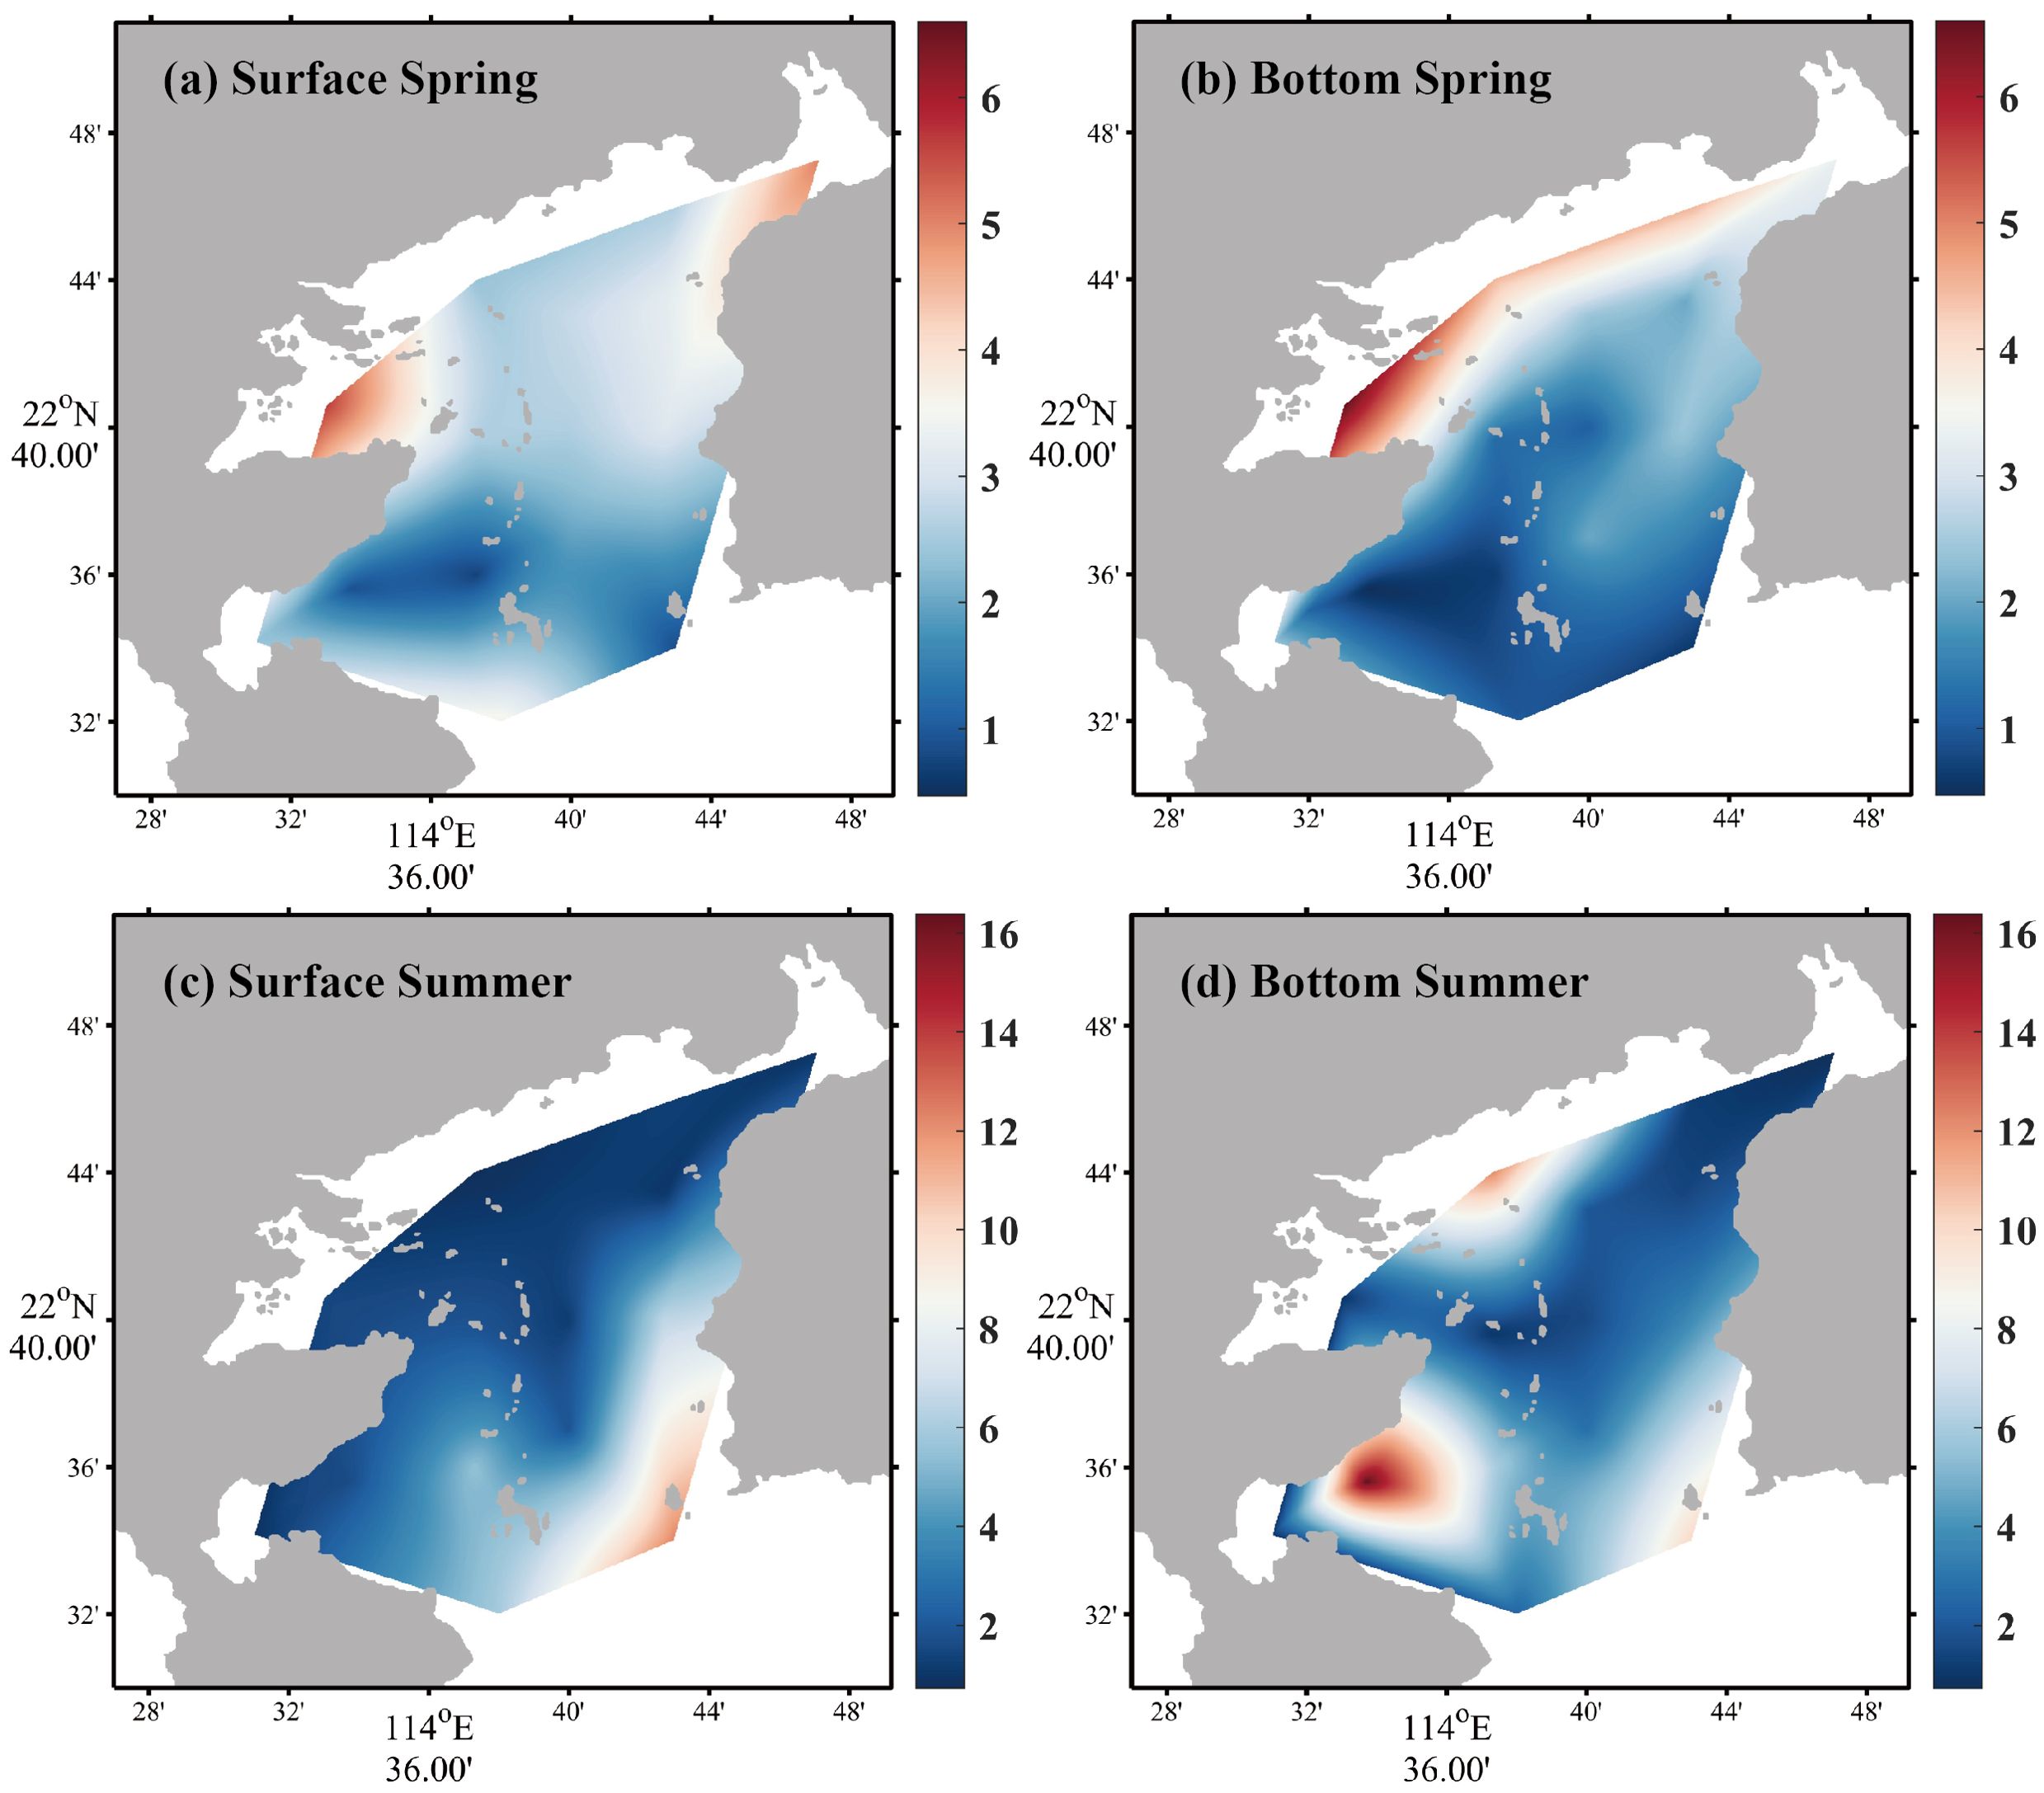
Figure 2. Horizontal distributions of DIN in spring [(a) surface seawater, (b) bottom seawater] and summer [(c) surface seawater, (d) bottom seawater].
The most noteworthy feature was that the average concentration of -N was higher than that of -N. In spring, the -N average concentrations in the surface and bottom seawater were 1.73 ± 1.03 µM and 1.50 ± 1.38 µM, respectively. In summer, the -N average concentrations in the surface and bottom seawater were 2.60 ± 3.17 µM and 4.06 ± 4.68 µM, respectively. It suggested that -N concentration accounted for a minor share of DIN. The results were totally at variance with the survey in Daya Bay reported before (Sun et al., 2011).
For DIP, in spring, the average concentration in the surface seawater was 0.33 ± 0.11 µM, with the concentration range of 0.21–0.65 µM (Figure 3a), and DIP concentration of bottom seawater changed narrowly from 0.19 to 0.42 µM, with an average of 0.32 ± 0.06 µM (Figure 3b). In summer, DIP average concentration in the surface seawater was 0.27 ± 0.11 µM, with the concentration range of 0.15–0.55 µM (Figure 3c); bottom seawater DIP changed from 0.10 to 0.63 µM, with an average of 0.31 ± 0.12 µM (Figure 3d). Except for the bottom seawater in spring, the concentration of DIP was relatively high at S14 compared to other areas of the bay.
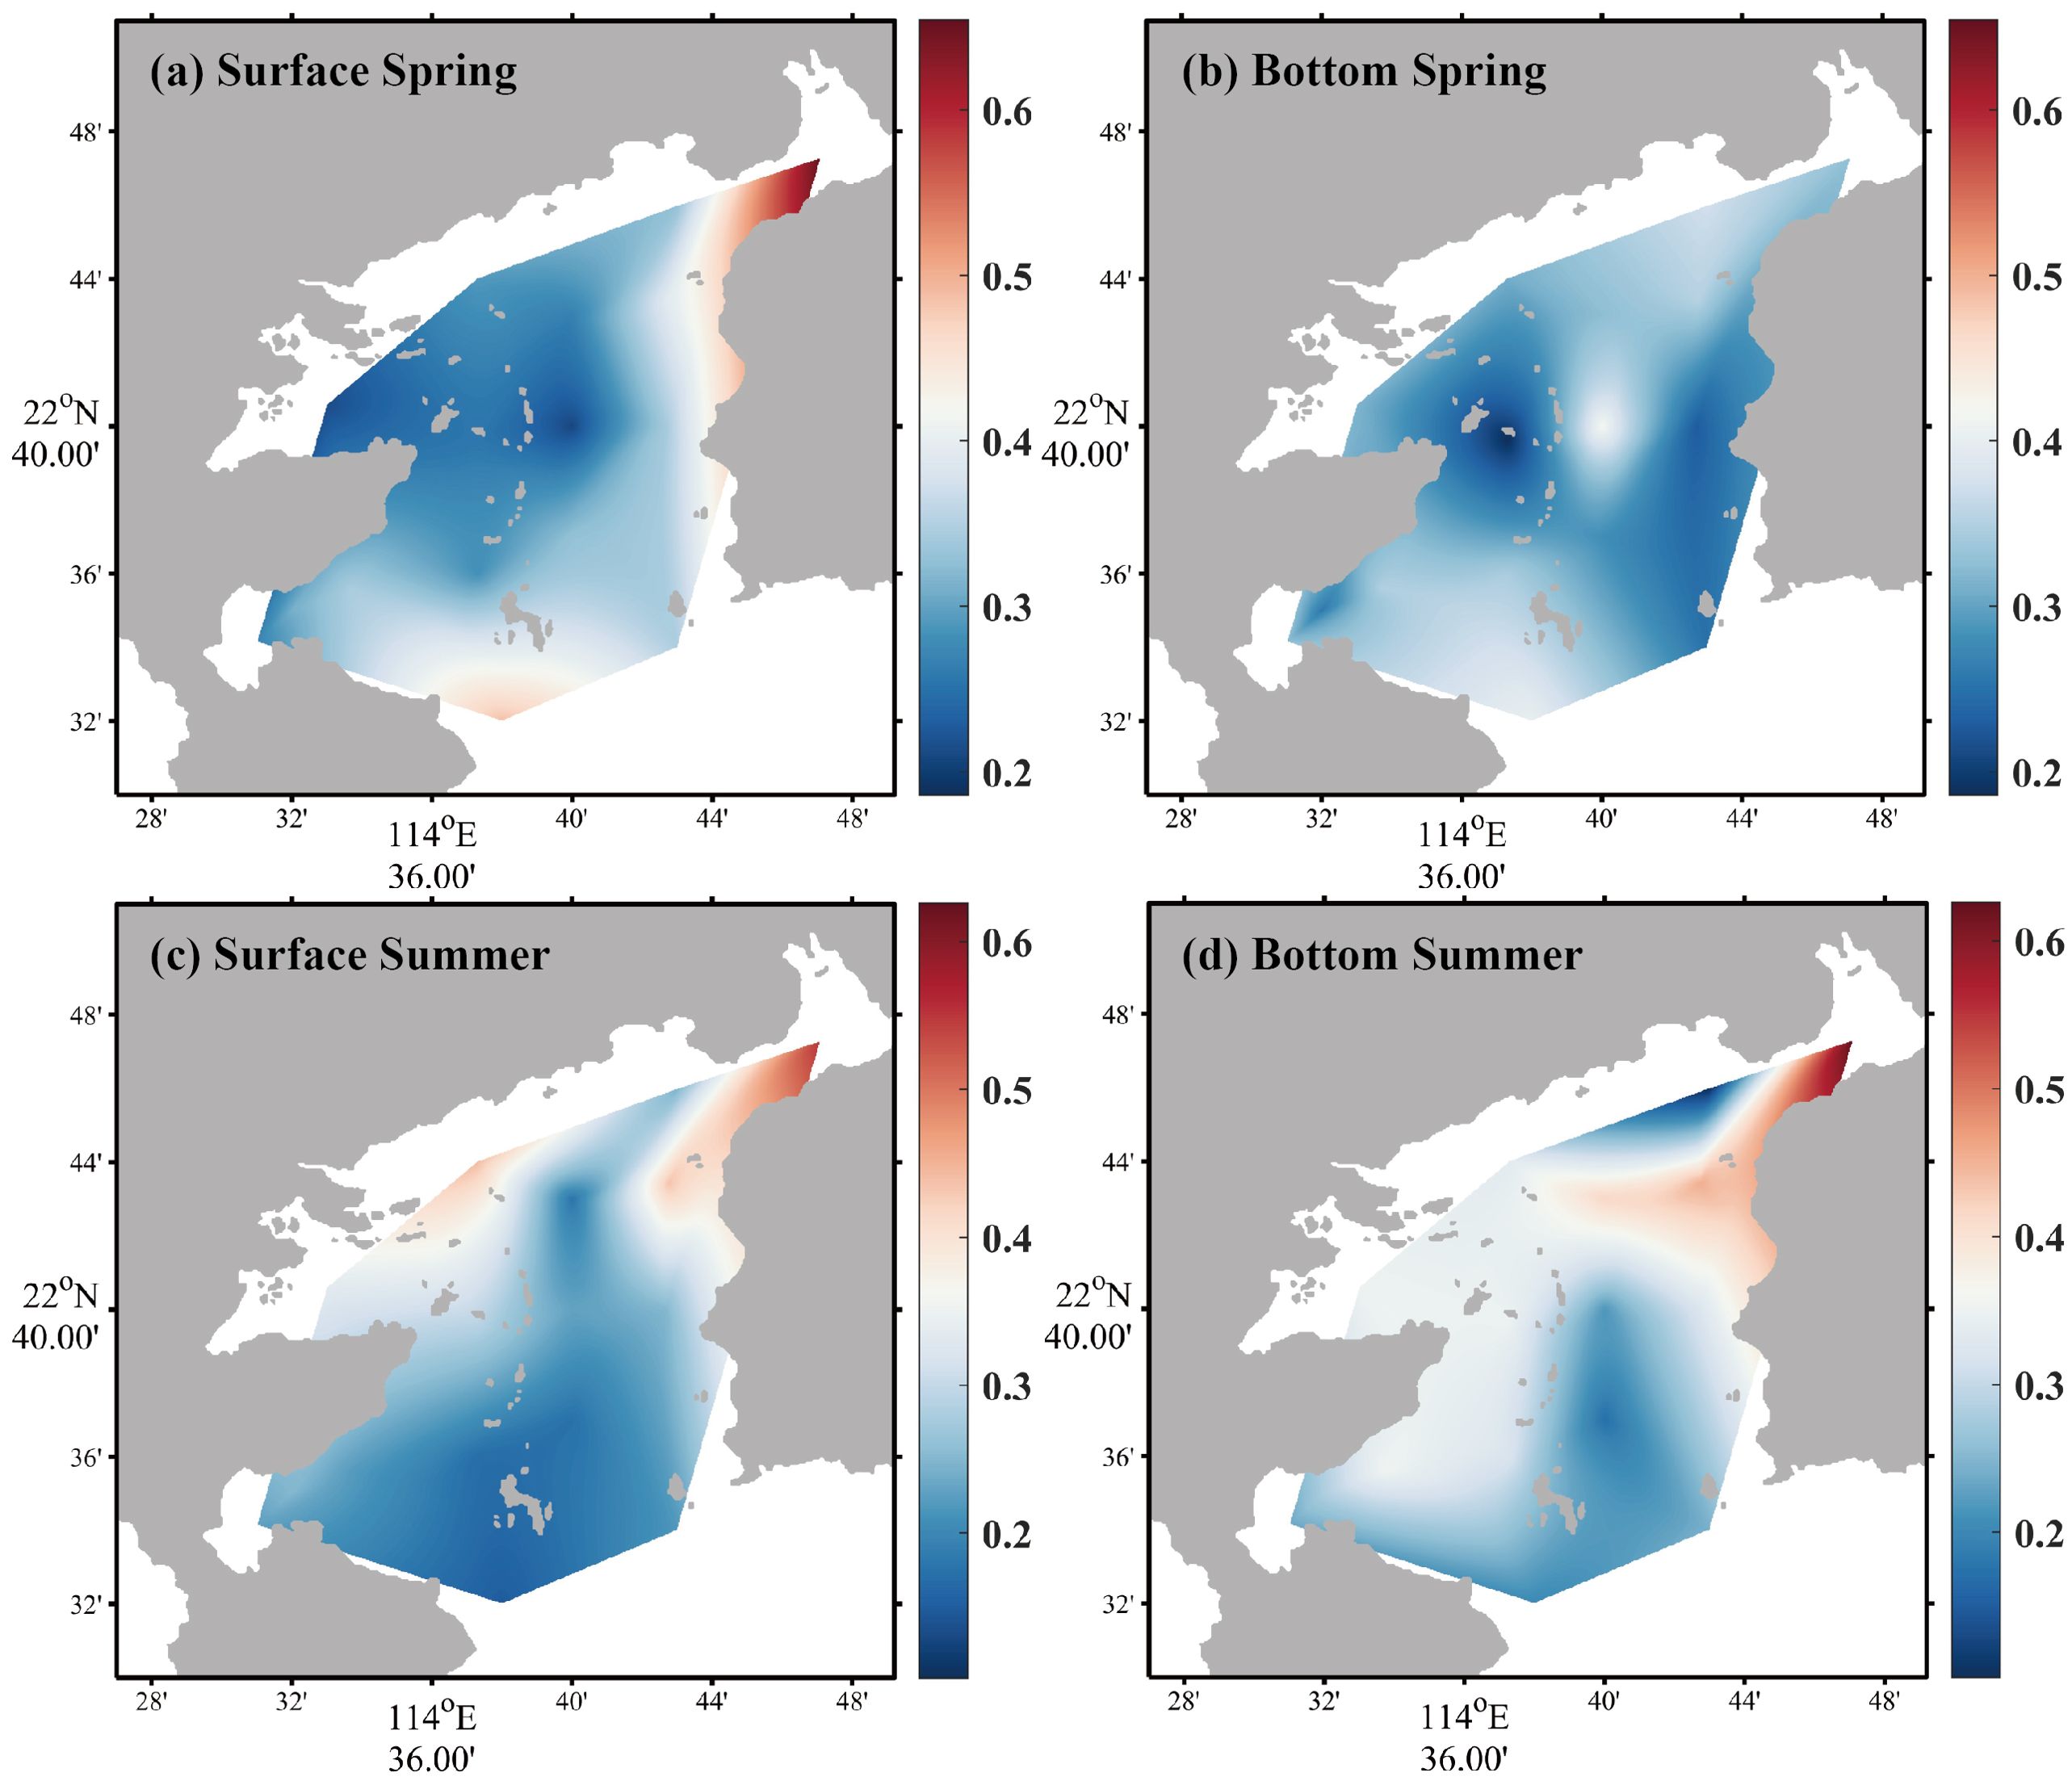
Figure 3. Horizontal distributions of DIP in spring [(a) surface seawater, (b) bottom seawater] and summer [(c) surface seawater, (d) bottom seawater].
Compared with DIN and DIP, DSi concentration was considerably high overall. In spring, the DSi concentration in the surface seawater ranged from 13.09 to 32.97 µM, with an average of 24.63 ± 5.29 µM (Figure 4a) and DSi in the bottom seawater varied from 10.92 to 42.05 µM, with an average of 22.97 ± 8.08 µM (Figure 4b). In summer, DSi concentration in the surface seawater ranged from 3.13 to 47.48 µM, with an average of 22.96 ± 13.31 µM (Figure 4c); DSi in the bottom seawater varied from 12.64 to 58.22 µM, with an average of 29.58 ± 14.11 µM (Figure 4d).
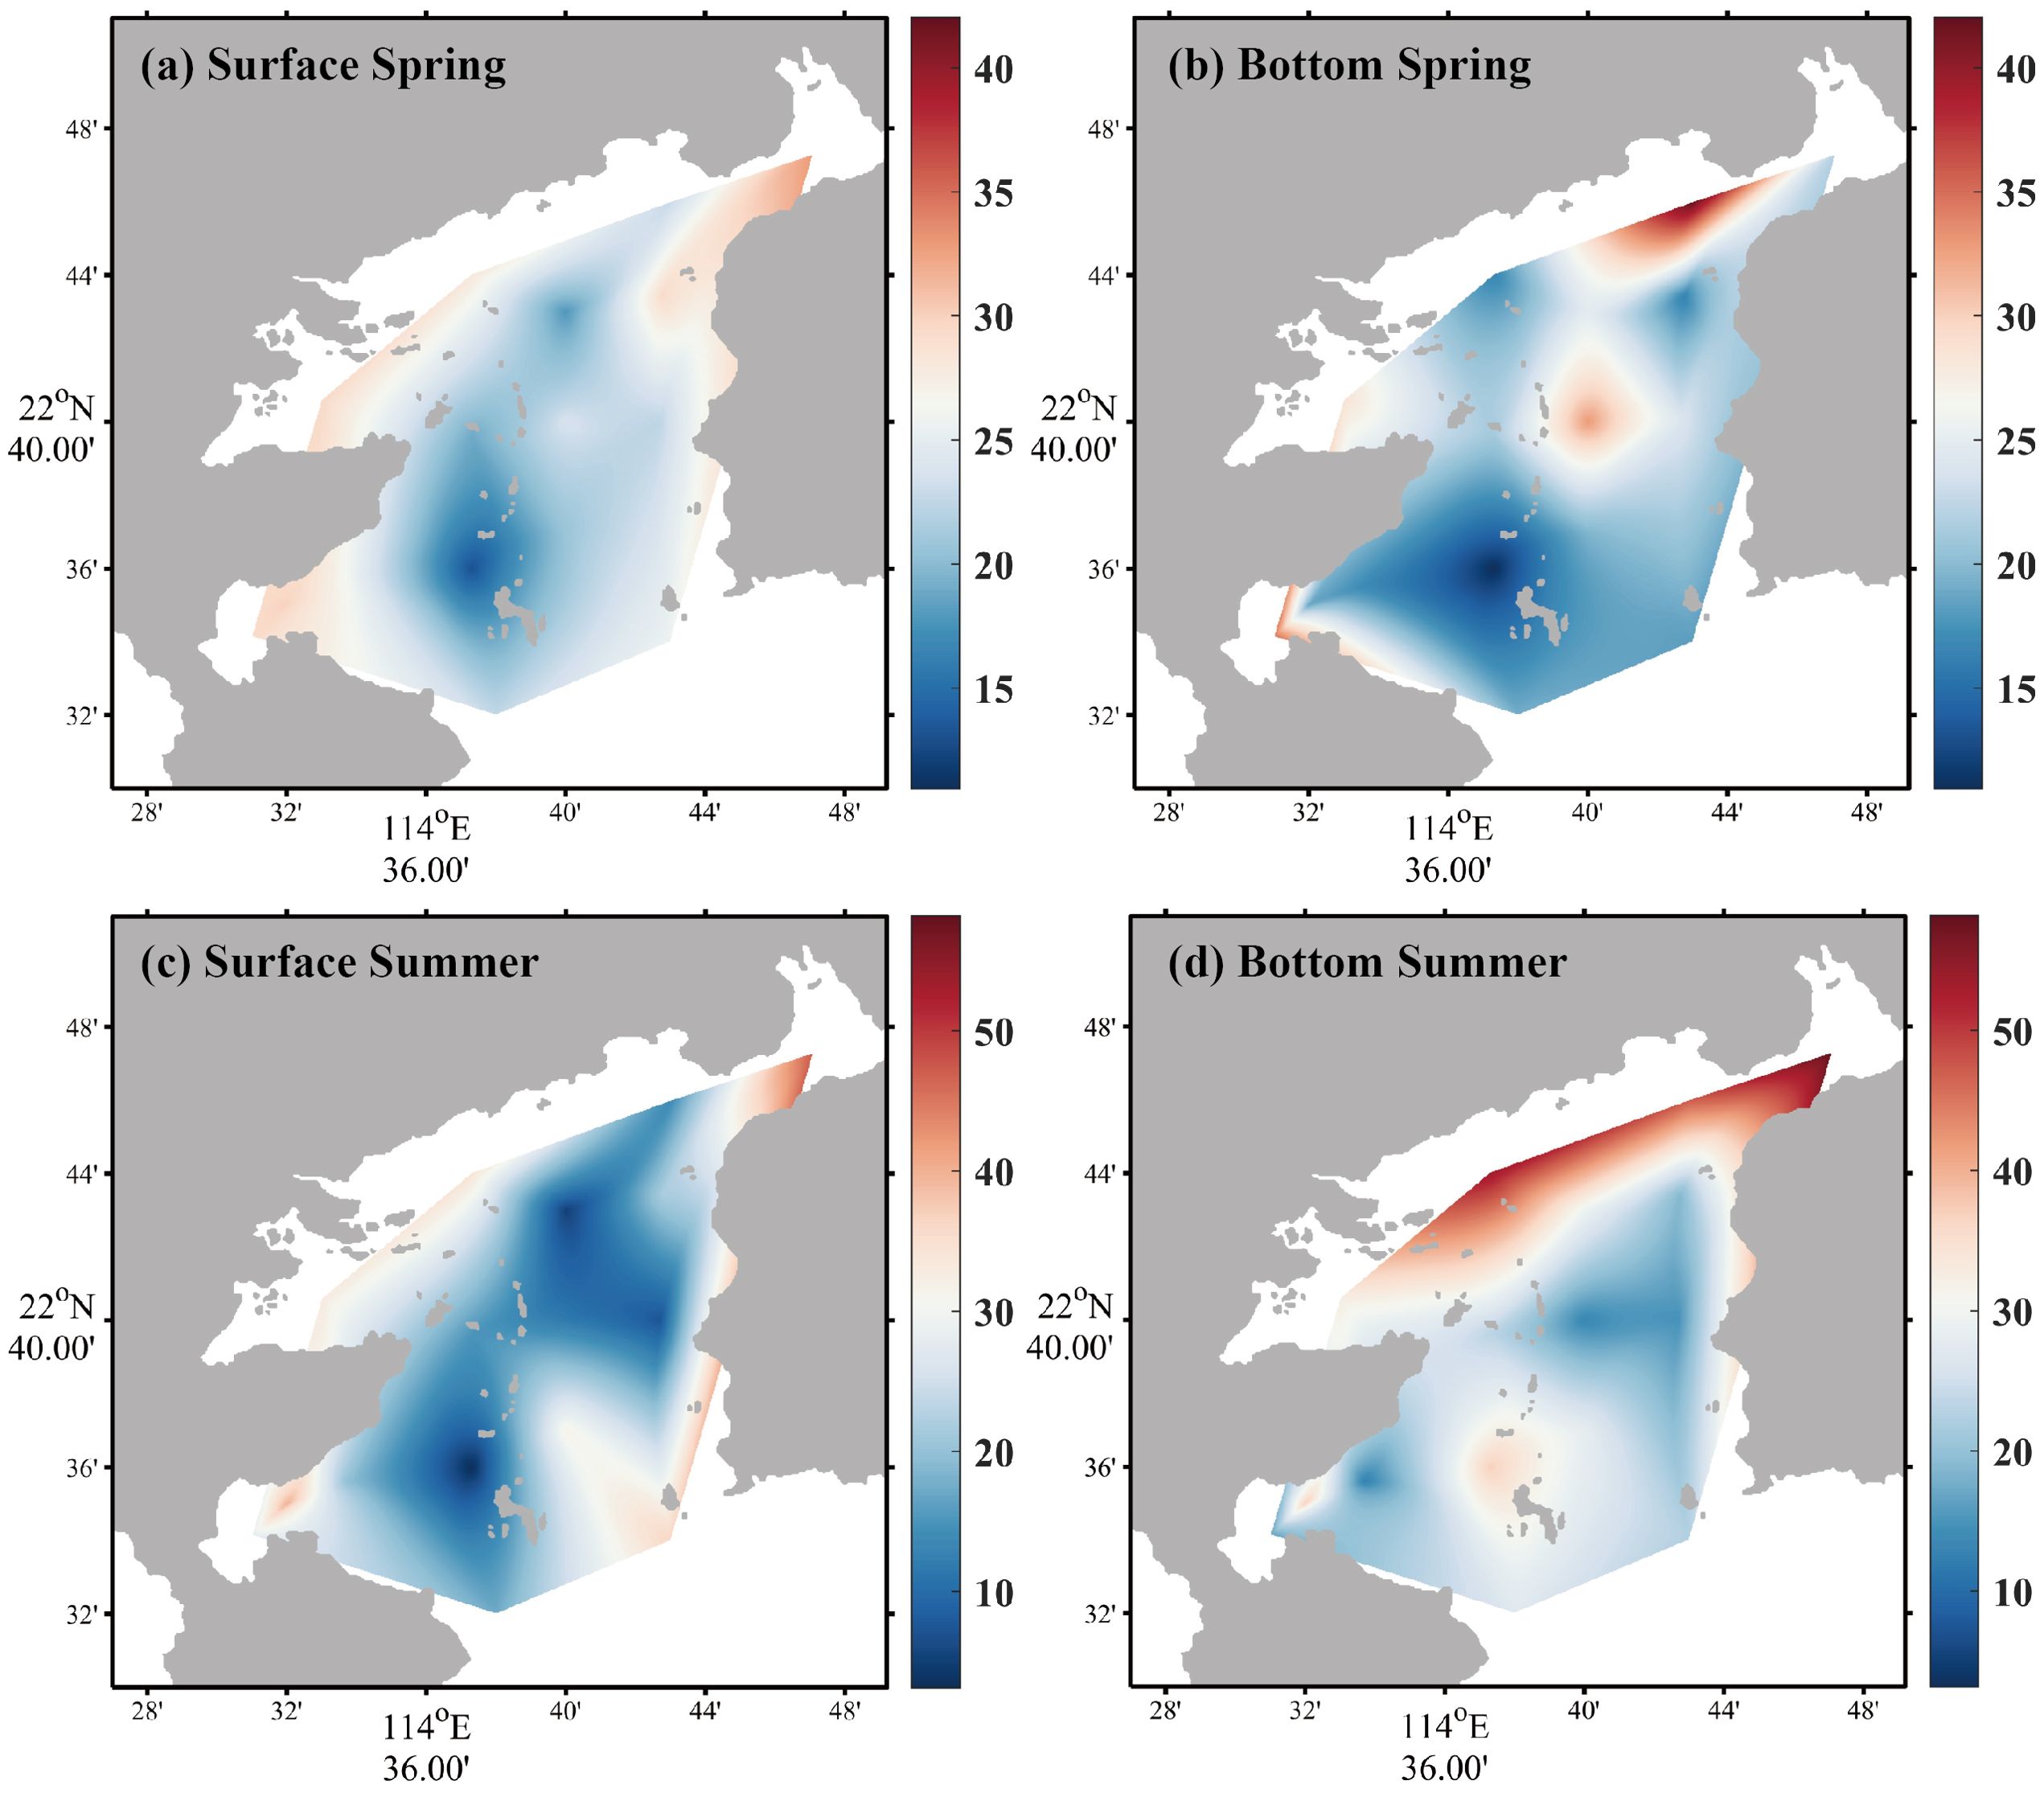
Figure 4. Horizontal distributions of DSi in spring [(a) surface seawater, (b) bottom seawater] and summer [(c) surface seawater, (d) bottom seawater].
3.2 The distribution characteristics of chlorophyll a and dissolved oxygen
The variations of Chl a and DO are shown in Figures 5 and 6, and the rest of the ecological indicators are shown in the Supplementary Material. During the spring survey, MINIpack CTD115M was out of order at S2, resulting in the lack of Chl a at this station. The Chl a average concentrations in the surface and bottom seawater in spring were 2.11 ± 0.93 µg/L and 2.00 ± 0.70 µg/L, respectively, which was lower than that in summer. In summer, the least value area in the surface seawater was found at the southeast region of nuclear power plants (S4 and S5), while Chl a in bottom seawater was approximately 5.2 to 6.7 times higher than surface seawater and the horizontal variation presented a general decline from bay interior to bay mouth. For DO, on the whole, the concentration in the surface water was higher than that in the bottom, and the concentration in spring was higher than that in summer. The average concentrations in the surface and bottom seawater were 6.93 ± 0.99 mg/L and 5.99 ± 0.40 mg/L in spring, respectively, while the average concentrations in the surface and bottom seawater in summer were 6.61 ± 0.15 mg/L and 4.17 ± 1.31 mg/L, respectively.
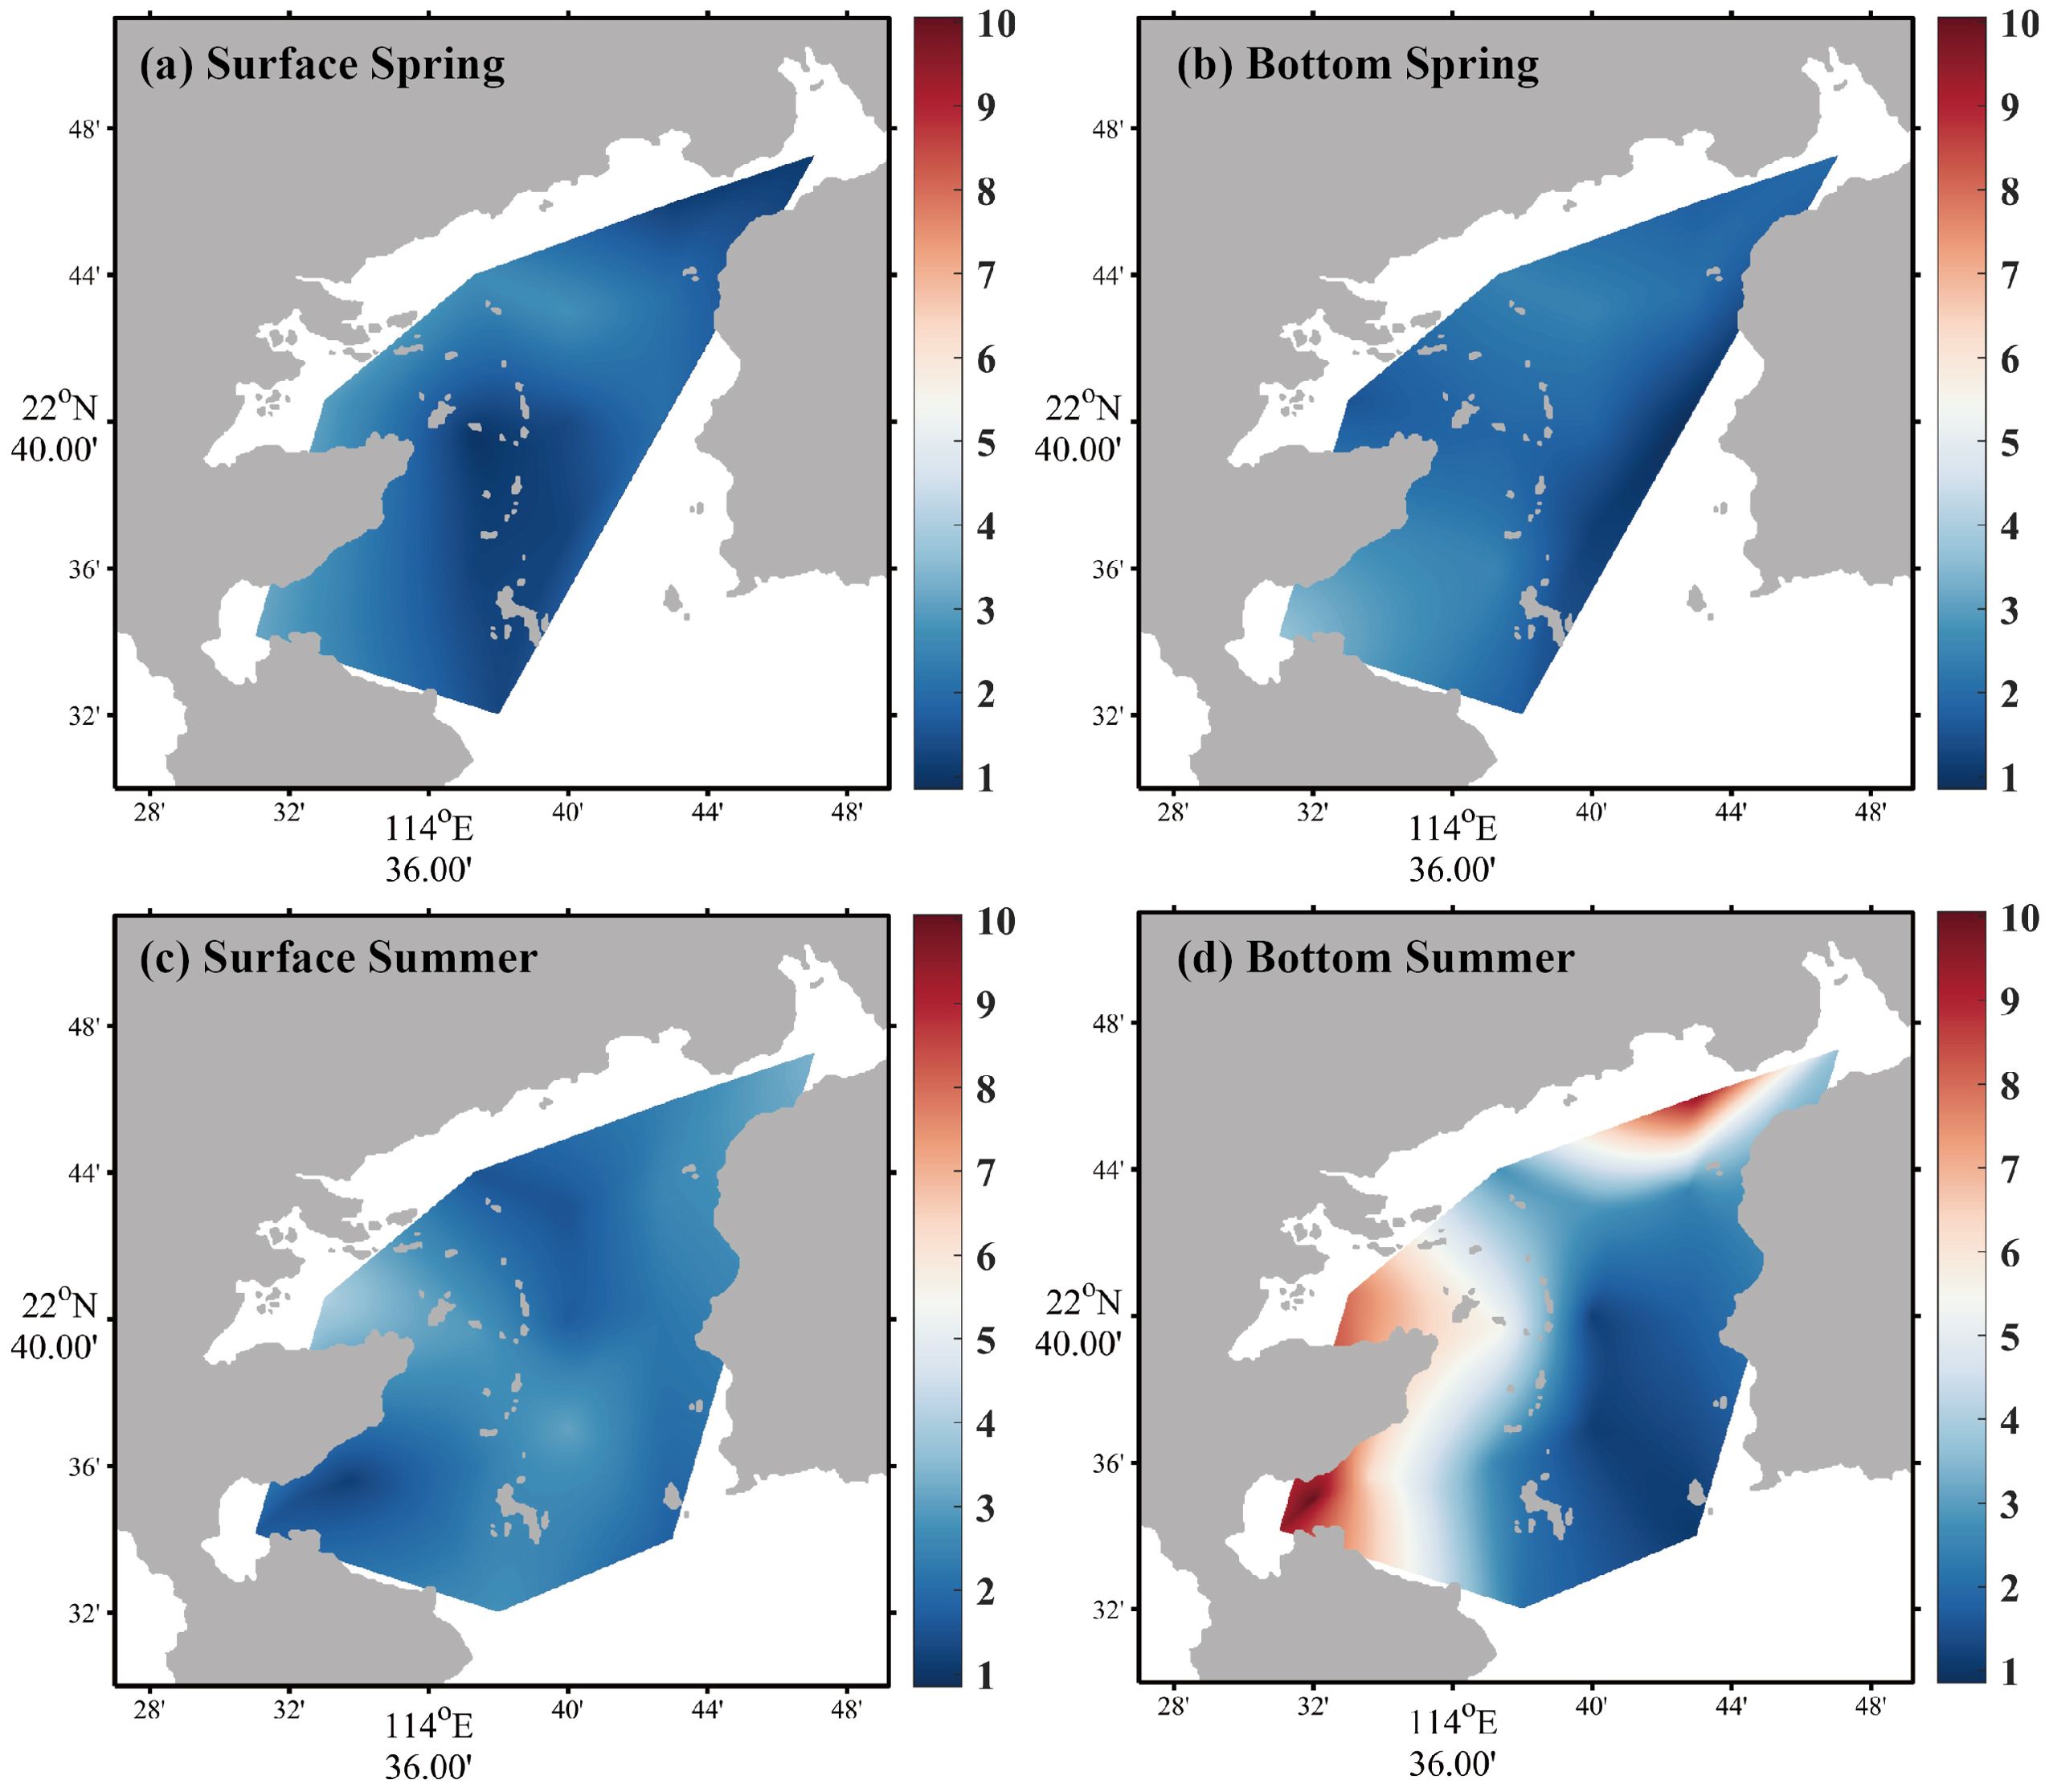
Figure 5. Horizontal distributions of Chl a in spring [(a) surface seawater, (b) bottom seawater] and summer [(c) surface seawater, (d) bottom seawater].
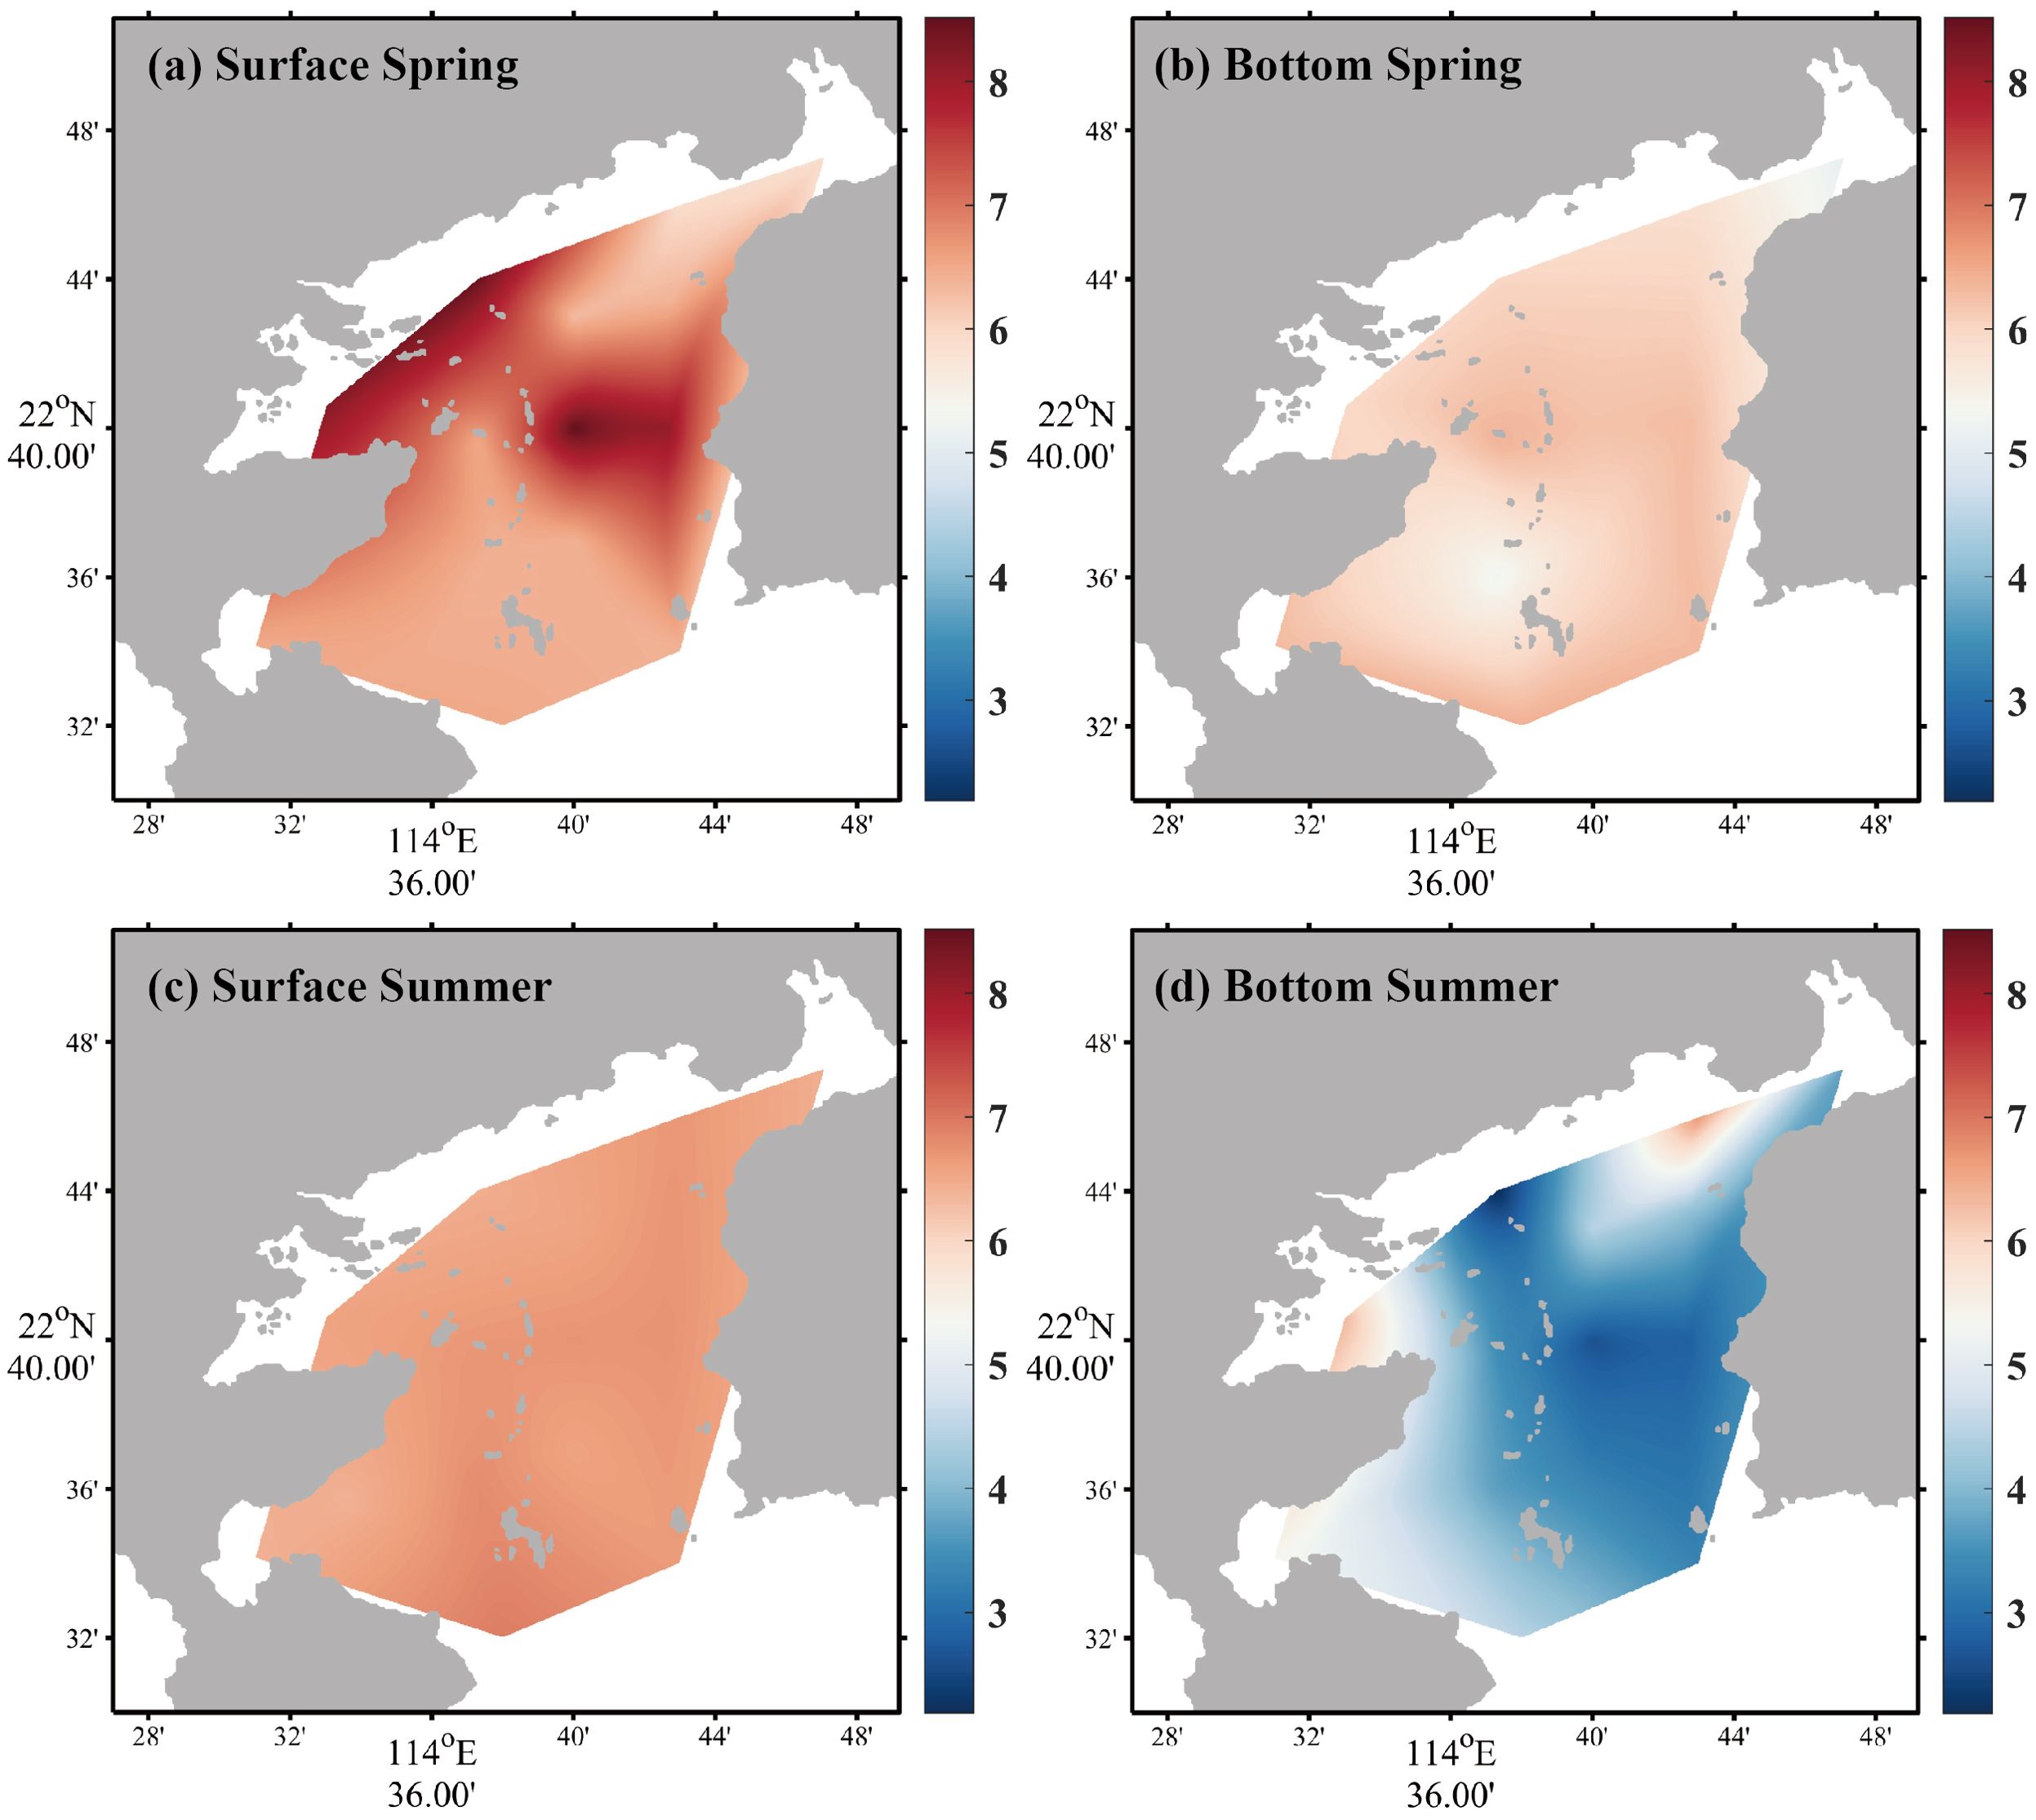
Figure 6. Horizontal distributions of DO in spring [(a) surface seawater, (b) bottom seawater] and summer [(c) surface seawater, (d) bottom seawater].
3.3 Nutrient proportion and limitation
Nutrient availability exerts a major influence on the phytoplankton species composition and primary productivity. Variations in the proportion between N, P, and Si in seawater have been identified as a vital signature of phytoplankton dynamics. Phytoplankton take up nutrients in a certain ratio, known as the Redfield ratio, which is accepted to be 16/1/16 of the N/P/Si (Redfield et al., 1963). As shown in Figure 7, the areas of potentially limiting nutrients were demarcated by the DSi/DIN = 1, DIN/DIP = 16, and DSi/DIP = 16 lines (Rocha et al., 2002). There are six areas with each characterized by the potentially limiting nutrients in order of priority. During the survey, the DIN/DIP fluctuated between 1.15 and 56.14 with a mean value of 11.14 ± 11.66. The mean value of DIN/DIP in the surface and bottom seawater increased from 8.60 ± 5.54 and 7.37 ± 5.32 in spring to 13.57 ± 16.19 and 15.02 ± 14.34 in summer. The DSi/DIP varied from 18.33 to 465.29, with an average of 80.73 ± 60.32. The DSi/DIP proportion of each site was scattered around the upper area of the DSi : DIP line. In spring, the DIN/DIP at S8 was found to be higher than the Redfield ratio, which was 26.38 on the surface and 20.86 at the bottom. All the remaining sampling stations, converged on the area of DIN DIP DSi, were characterized by a consistent nutrient concentration pattern: DIN DIP DSi, which implicated that the structure of nutrients displayed a similar characteristic even though the distribution of those existed a horizontal difference in spring. In summer, the highest record occurred at S2, where the DIN/DIP in the surface and bottom seawater were 56.14 and 41.26, respectively. The surface seawater (S1, S2, S6, and S12) and the bottom seawater (S2, S5, and S16) were characterized by phosphate limitation, and the surface seawater at S6 and the bottom seawater at S5 displayed an inferior DSi concentration compared with DIN.
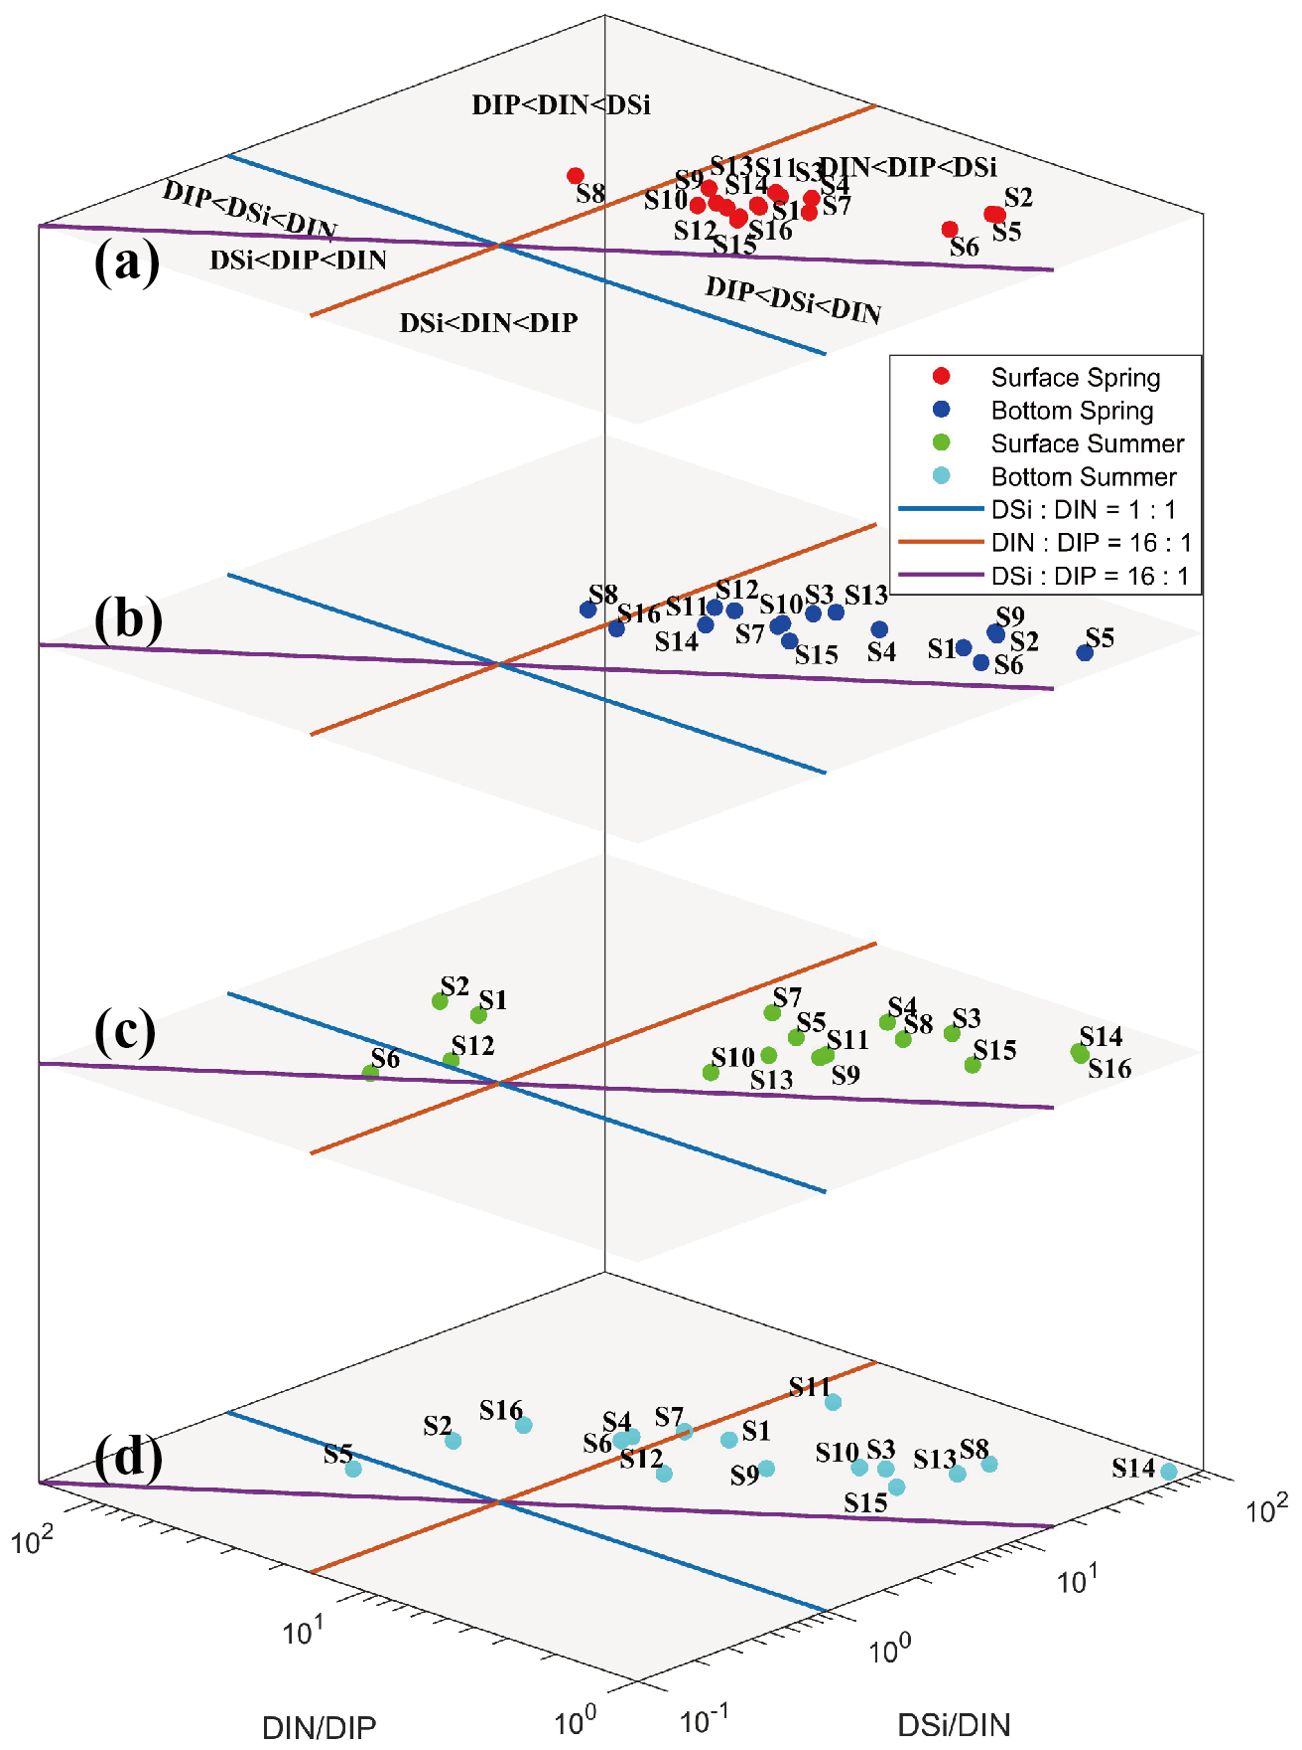
Figure 7. Logarithmic plot of nutrient ratios of DSi: DIN: DIP in each site [(a) surface spring, (b) bottom spring, (c) surface summer, (d) bottom summer].
4 Discussion
4.1 Environmental effect under policy constraints and anthropogenic activities
The average ratio of DIN/DIP in summer was so close to the Redfield ratio suitable for phytoplankton growth that the Chl a concentrations were higher than in spring overall (Figure 5). In summer, the area with both the lowest Chl a concentration in the surface seawater and the highest Chl a concentration in the bottom seawater occurred at the southeast region of the nuclear power plants (S4 and S5), and the Chl a concentration in the surface seawater was lower than that in spring, whereas the Chl a concentration in the bottom seawater was significantly higher than that in spring. This area was adjacent to the outfall of thermal effluent of cooling system in nuclear power plants, and the temperature of this area and its downstream was higher than other sites caused by the discharge of warm wastewater (Supplementary Figure S4 in the Supplementary Material). Because of the entrainment effect, the residual chlorine effect, and high temperature, the cell structure of phytoplankton was damaged and injured, which influenced the life activities of phytoplankton, resulting in a large difference of horizontal distribution. Furthermore, the heat of cooling water was conducted to the bottom seawater, resulting in the increase of temperature. According to Xie et al.’s field investigation and simulated experiments, the optimal growth temperature range for phytoplankton is approximately 28–32°C in summer (Fuwu et al., 2018). The temperature in bottom seawater approached the optimal range for phytoplankton growth at Stations S4 and S5 (Supplementary Figure S4D), which supported the fact that Chl a was significantly higher than other sites except for the aquaculture area (Supplementary Figure S4B), which support the fact that Chl a was significantly higher than other sites except for the aquaculture area (Figure 5d).
In terms of the DIN ( 14.28 µM) and DIP ( 0.97 µM) concentrations (Guo et al., 1998), nutrient level can be attributed to oligotrophy, wherein nutrient level at S5 in the bottom seawater was characterized by medium eutrophication of phosphate limitation (DIN/DIP = 46.00, DIN = 16.39 µM) based on the potential eutrophication assessment model, and that of S2 inferiorly approximated this range (DIN/DIP = 48.70, DIN = 11.17 µM). Though nutrients did not exhibit a clear cycle due to insufficient frequency of survey, a transition in the limiting factors from N-limited in spring to P-limited in summer had an inkling of the matter in Figure 7. As known, the species number, abundance, and community structure of phytoplankton in Daya Bay are closely related to nutrients (Qu et al., 2000; Sun et al., 2006), and the dominant species of phytoplankton varied in Daya Bay from diatoms in summer to chrysophyta and cyanobacteria in winter, and the nutrient levels of seawater displayed N-limited in summer, while the seawater in winter contained 11 times more phosphate than in summer (Su et al., 2019). Additionally, the dominant species of phytoplankton was diatom in Daya Bay from November 2017 to July 2018, and the proportion of diatom decreased from 72% in spring to 65% in summer (Li, 2020), and this change should be directly related to the variation in the nutrient proportion during spring and summer, as shown in Figure 7.
Significant variations of DIN composition have been observed in Daya Bay over the last 40 years (Guo et al., 2023). The -N concentrations demonstrated a sustained upward tendency from 2015 to 2020, with a sharp surge recorded from 2019 to 2020 (Figure 8a). In detail, Figure 8b showed that the -N proportions remained relatively stable below 50% of DIN composition during autumn 2019 and spring 2020 (Ma et al., 2023). In the aquaculture area, the amount of residue of organic aerobic matter resulted in the high reducibility of seawater, which was attributed to the impact of microbiological degradation for DO depletion, enhancing ammonization and weakening nitrification (Huang et al., 2008a, 2008b). However, the DIN composition substantially changed from 2020 to 2021 and the -N became the dominant component of the DIN after 2020. In this study, a good linearity was observed in Figure 8c, demonstrating that -N accounted for a major portion in DIN. Variations of DIN composition were attributed to implement the clearance of unregulated mariculture operations and the eviction of fish farming in Daya Bay (www.dayawan.gov.cn, Notice of Clearance for Breeding and Fishing Platoon in Daya Bay Economic Development Zone). The quantity of feed input declined and the retention period decreased in Daya Bay, reducing the quantity of dissolved inorganic nutrients released into the aquatic environment. DO concentrations were relatively high even in the aquaculture area (Figure 6). Thus, this oxidizing condition promoted nitrification, leading to a higher proportion of -N in DIN.
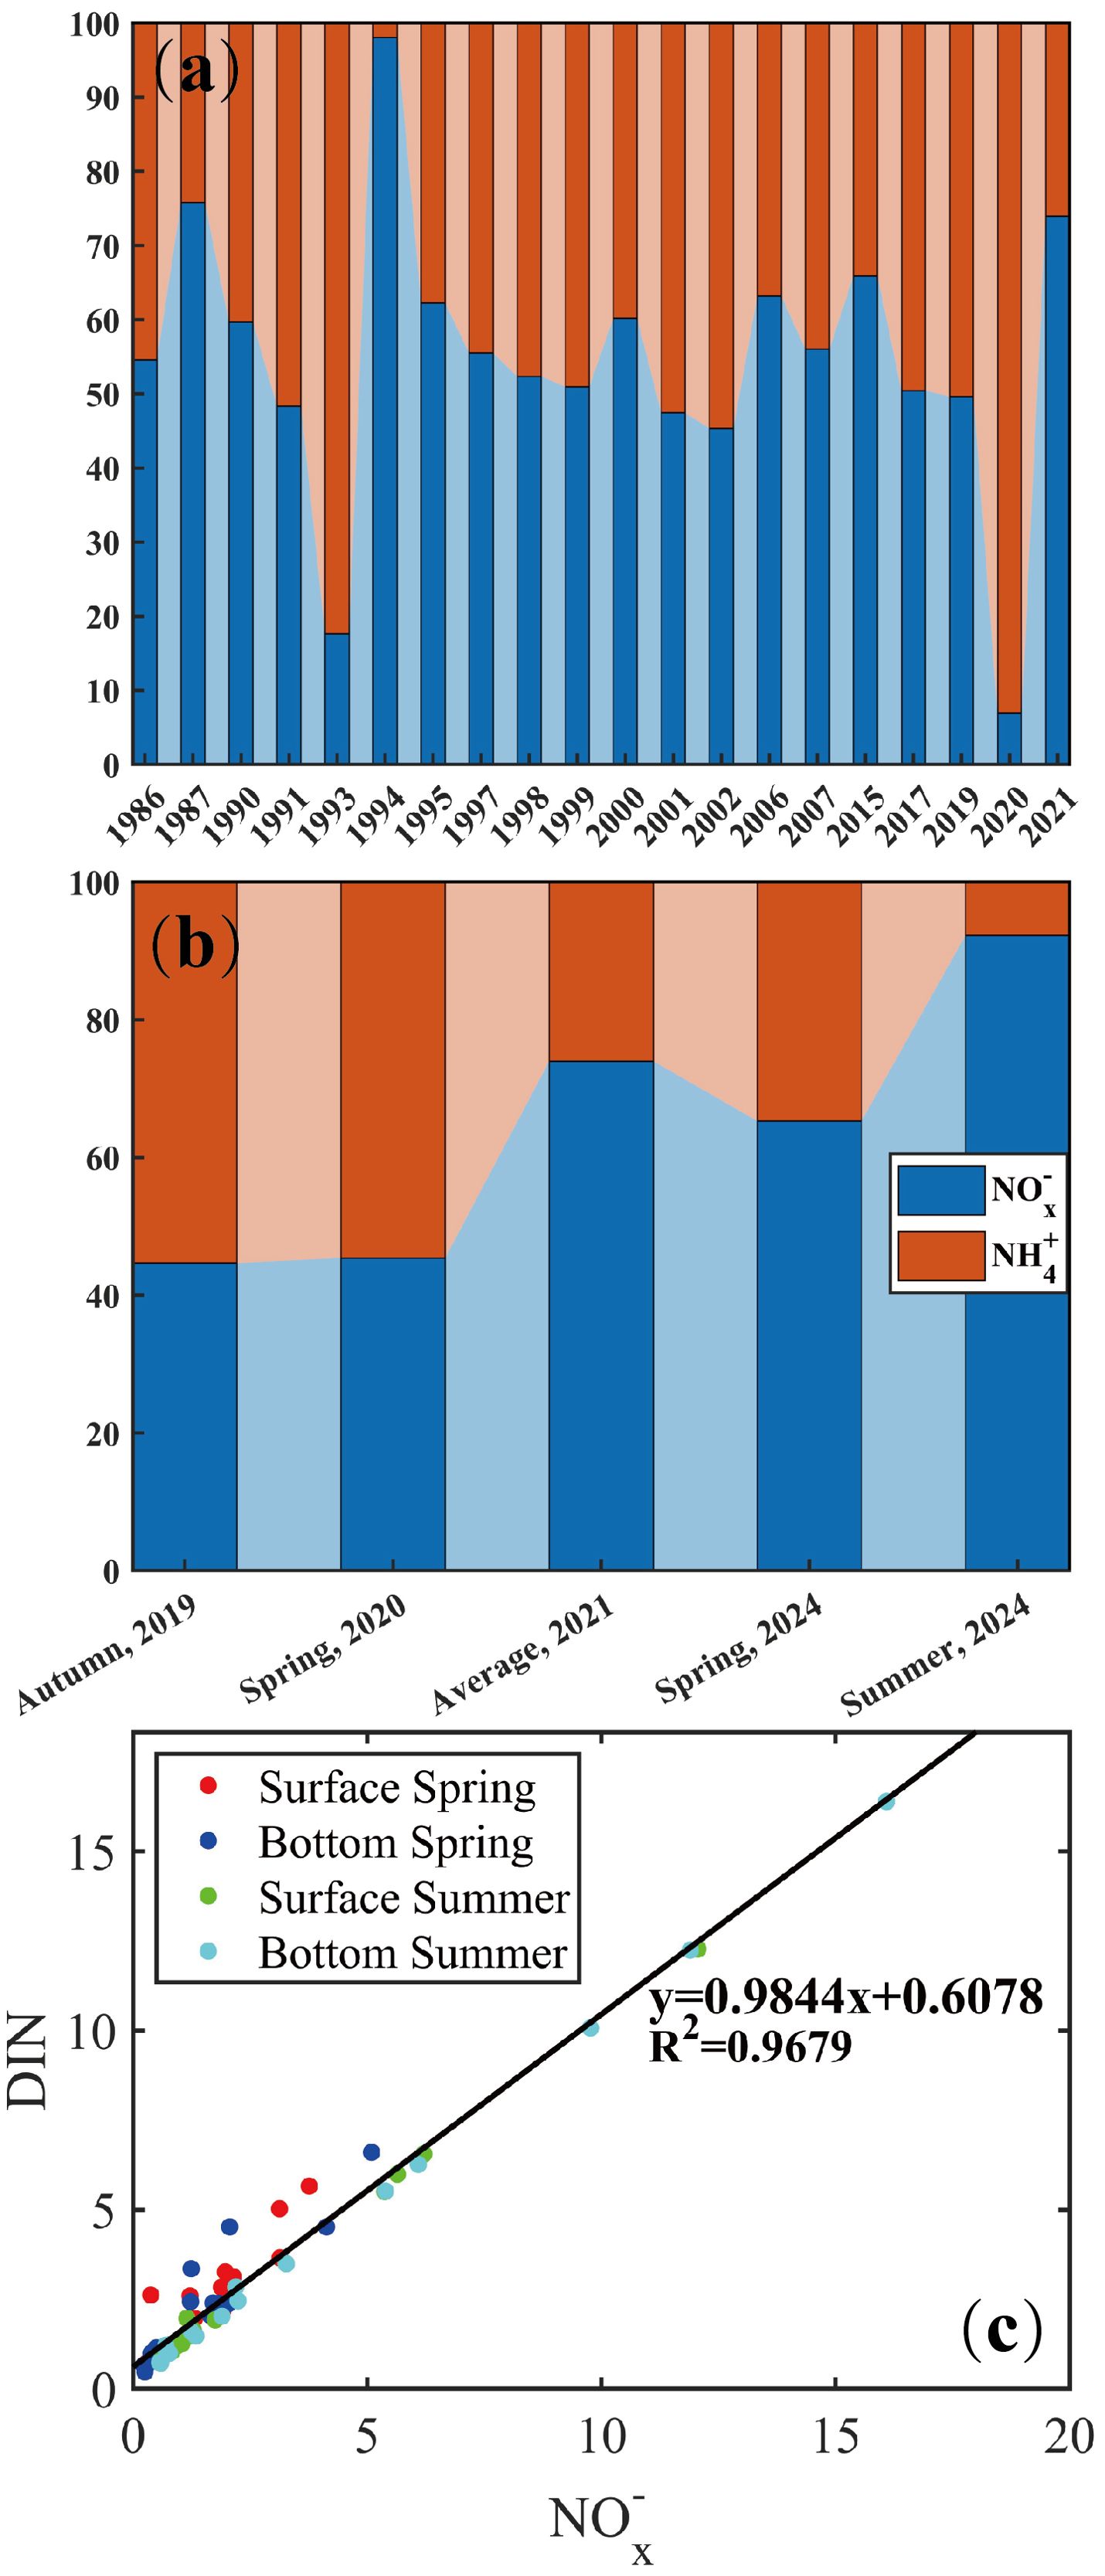
Figure 8. (a, b) Variation in DIN composition in Daya Bay from 1985 to 2024. (c) Linear regression between DIN and -N.
4.2 Correlation among ecological indicators in Daya Bay
To avoid misclassification caused by the difference in numerical dimensionality, ecological indicators were normalized with a mean and variance of zero and one, respectively, and then the eigenvalues and eigenvectors from the covariance matrix of origin variables were obtained by PCA. The loadings of the four retained PCs are shown in Supplementary Table S1 in the Supplementary Material.
In spring, the first canonical axis (21.80% of the variance) was negatively correlated with DO and Chl a but positively correlated with the rest of the ecological indicators, which was mainly contributed by -P, -N, salinity, and temperature (Figure 9a). The second axis (18.60% of the variance) was mainly contributed by -Si and -N with loadings of 0.5002 and 0.4821, respectively. In summer, the first canonical axis (40.46% of variance) was mainly contributed by DO, pH, temperature, and salinity. The loadings of DO, pH, and temperature were 0.4626, 0.4832, and 0.4828, respectively, while salinity gave a negative loading of −0.4770. In summer, compared with the loadings of the ecological indicators in the spring, the scores of all stations in the surface seawater mainly distributed in the first and fourth quadrants, which implied that DO, pH, and temperature contributed to PCA more than other ecological indicators (Figure 9b). The second canonical axis (16.62% of variance) was mainly contributed by -P with a loading of 0.6339. According to the results of PCA, the important components included temperature, salinity, DO, and pH in Daya Bay. From the scores of samplings between surface and bottom seawater, spatial distribution of water quality demonstrated a seasonal difference in Daya Bay. The surface and bottom layer seawater were vertically mixed under the influence of the northeast monsoon from November to April of the following year in the bay (Zhan et al., 1990; Chen et al., 2006). As shown in Figure 9a, the scores between surface and bottom demonstrated that the water column was vertically homogeneous in spring. However, the scores of samplings were separated in the plane (Figure 9b). In summer, the water with a lower temperature and high salinity intrudes into Daya Bay along the bottom layer, resulting in oceanic stratification (Wu et al., 2011). The results of PCA implied that the ecological indicators had a significant difference between surface and bottom due to the stratification in summer, which can be distinctly observed in DO, salinity, temperature, and pH in this study (Supplementary Figures S1, S3, and S4 and Figure 6).
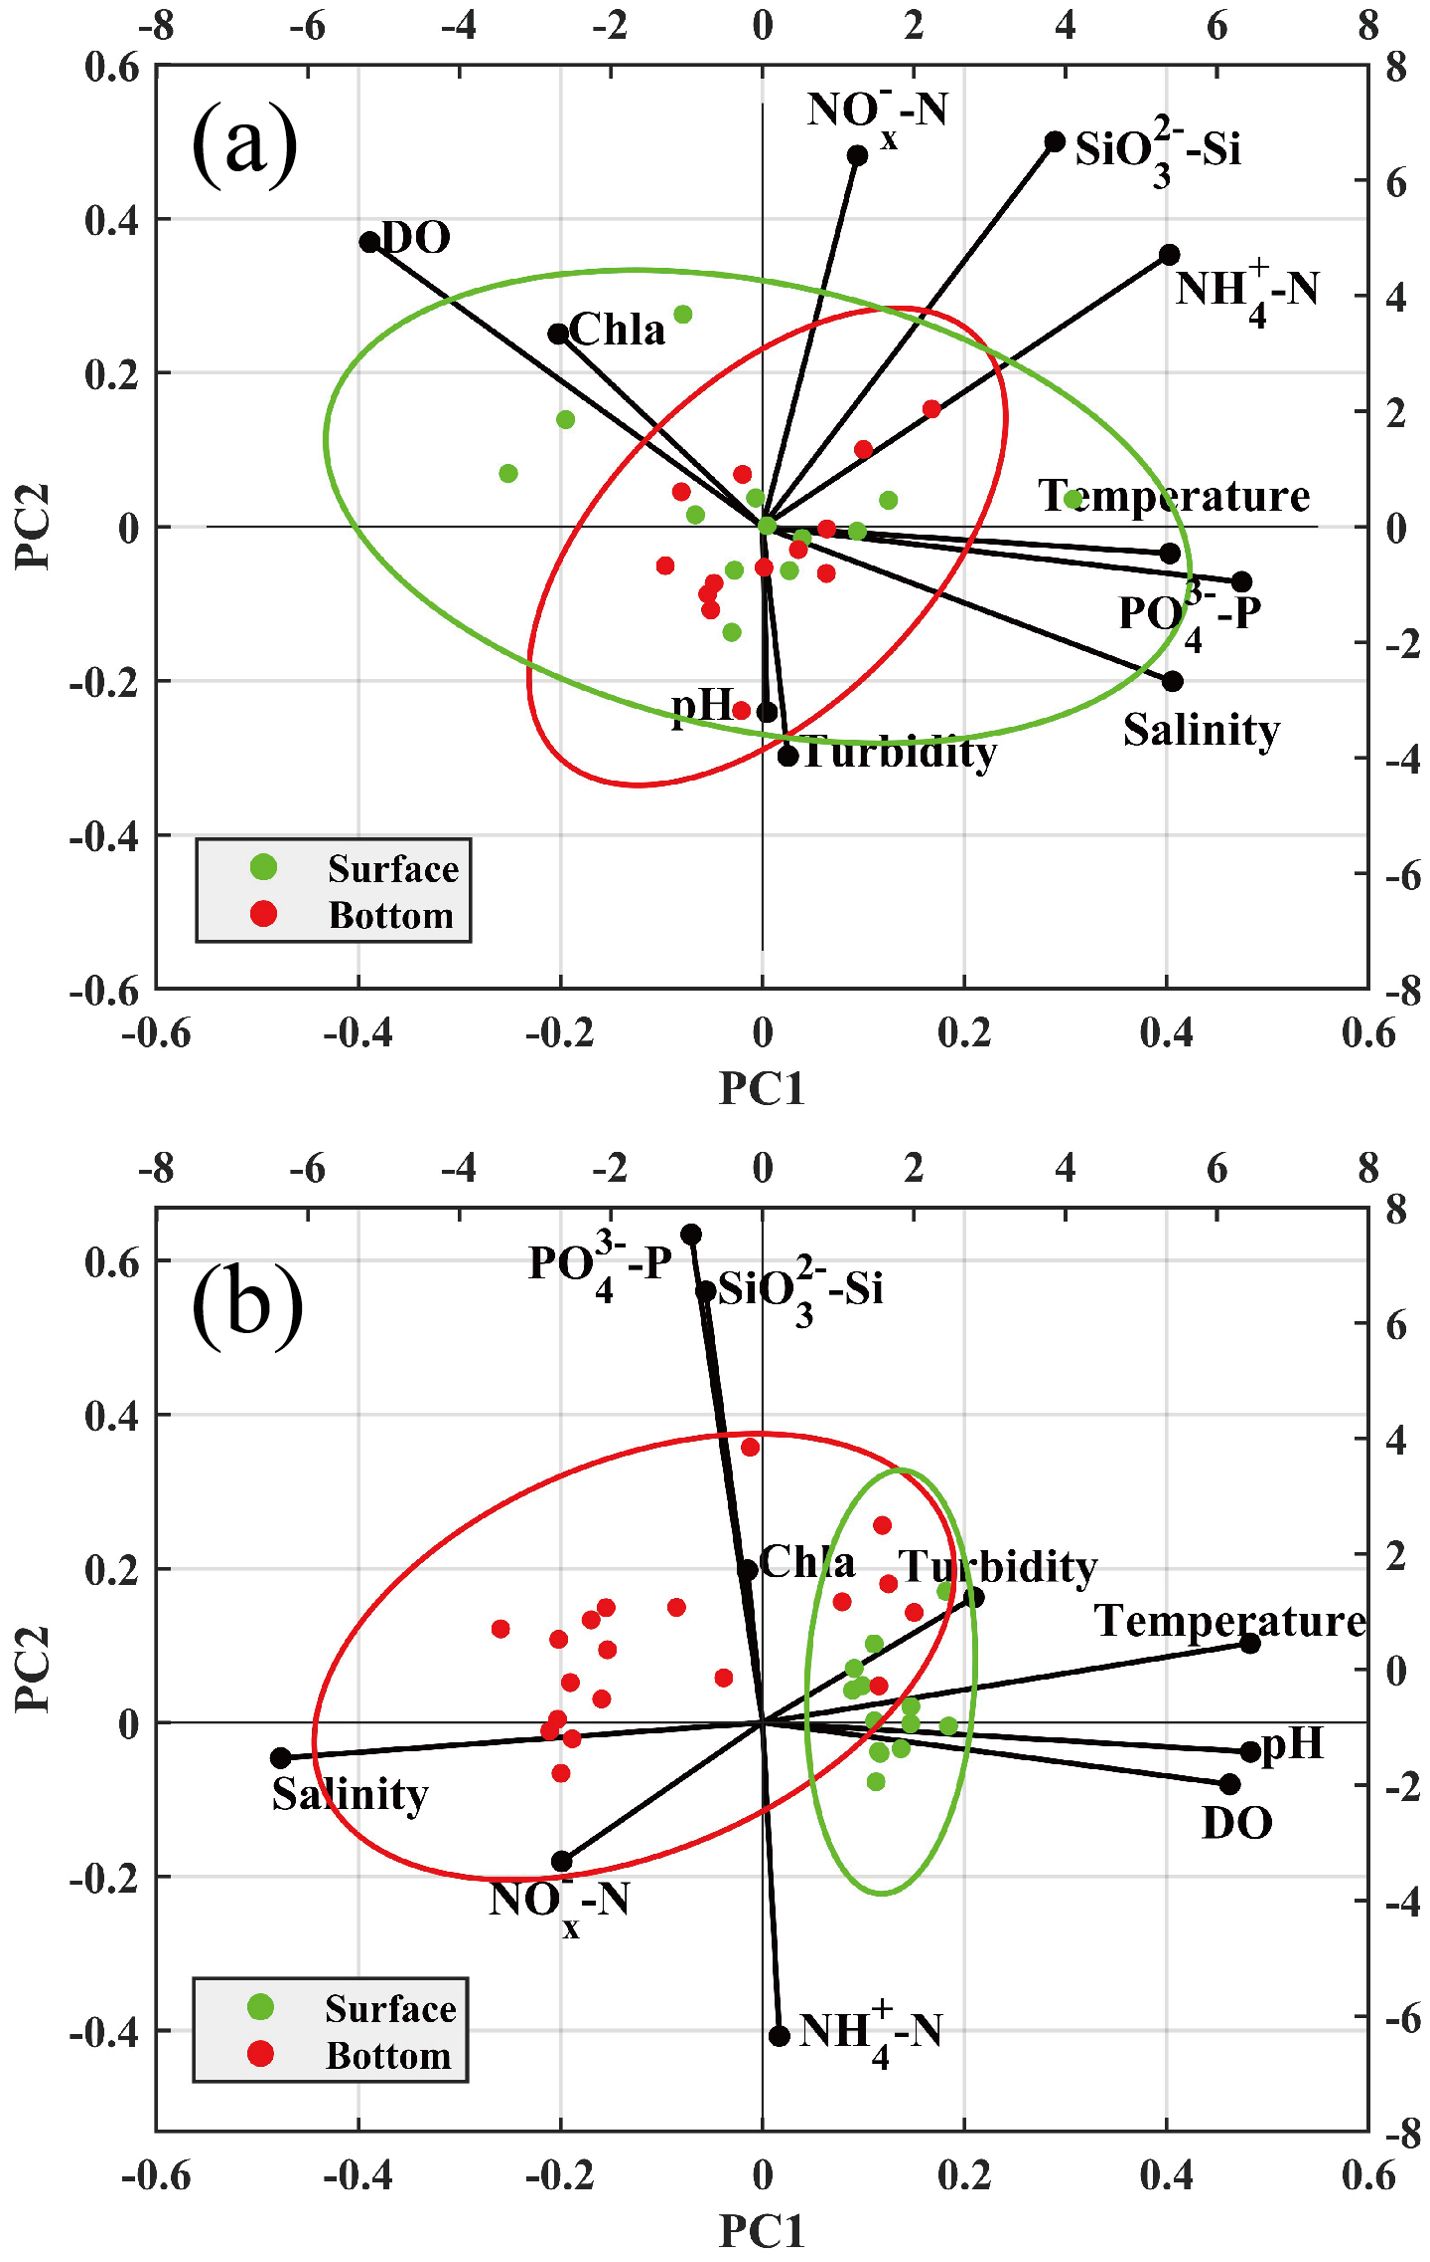
Figure 9. Principal component analysis (PCA) (Axes I and II) made on the loadings of ecological indicators and the scores of the sampling stations in spring (a) and summer (b).
The relationships among nutrients, Chl a, DO, pH, turbidity, and other ecological indicators in Daya Bay are shown in Figure 10. In spring, -N was positively correlated with -Si and turbidity (p 0.05, r = 0.55) and DO was negatively correlated with temperature (p 0.01, r = −0.79) in the surface seawater (Figure 10a), while -N was negatively correlated with pH (p 0.01, r = −0.70) in the bottom seawater (Figure 10b). The negative correlation between pH and -N was attributed to the equilibrium between ammonia dissociation and volatilization. Elevated -N concentration shifted the equilibrium, generating hydrogen ions and ammonia gas. The ammonia gas escaped the water, while the hydrogen ions increased water acidity, resulting in the decline of pH. In summer, temperature was significantly correlated with -N (p 0.001, r = −0.80) and -P (p 0.001, r = 0.80) and a negative correlation was found between -N and -P (p 0.05, r = −0.61) in the surface seawater (Figure 10c). In the bottom seawater, correlations between Chl a, DO, pH, and temperature were significantly positive (Figure 10d). Specifically, the significantly positive correlation between Chl a and temperature (p 0.001, r = 0.69) demonstrated that temperature was the key factor for phytoplankton growth in summer. Furthermore, the significantly positive correlation between Chl a and pH (p 0.001, r = 0.85) indicated that the rapid depletion of due to the photosynthesis of phytoplankton promoted the decomposition of bicarbonate radical, increasing the concentration of hydroxide and resulting in the increase of pH (Suiliang et al., 2011). A significantly positive correlation found between pH and temperature (p 0.05, r = 0.67) implied that the photosynthesis of phytoplankton was mainly affected by the temperature in the bottom seawater. The reason for DO having a significantly positive correlation (p 0.001, r = 0.76) with pH was the redox property of seawater and the decrease of pH; i.e., the increase of the hydrion concentration promoted the combination of hydrogen ions and oxygen, depleting DO in the bottom seawater.
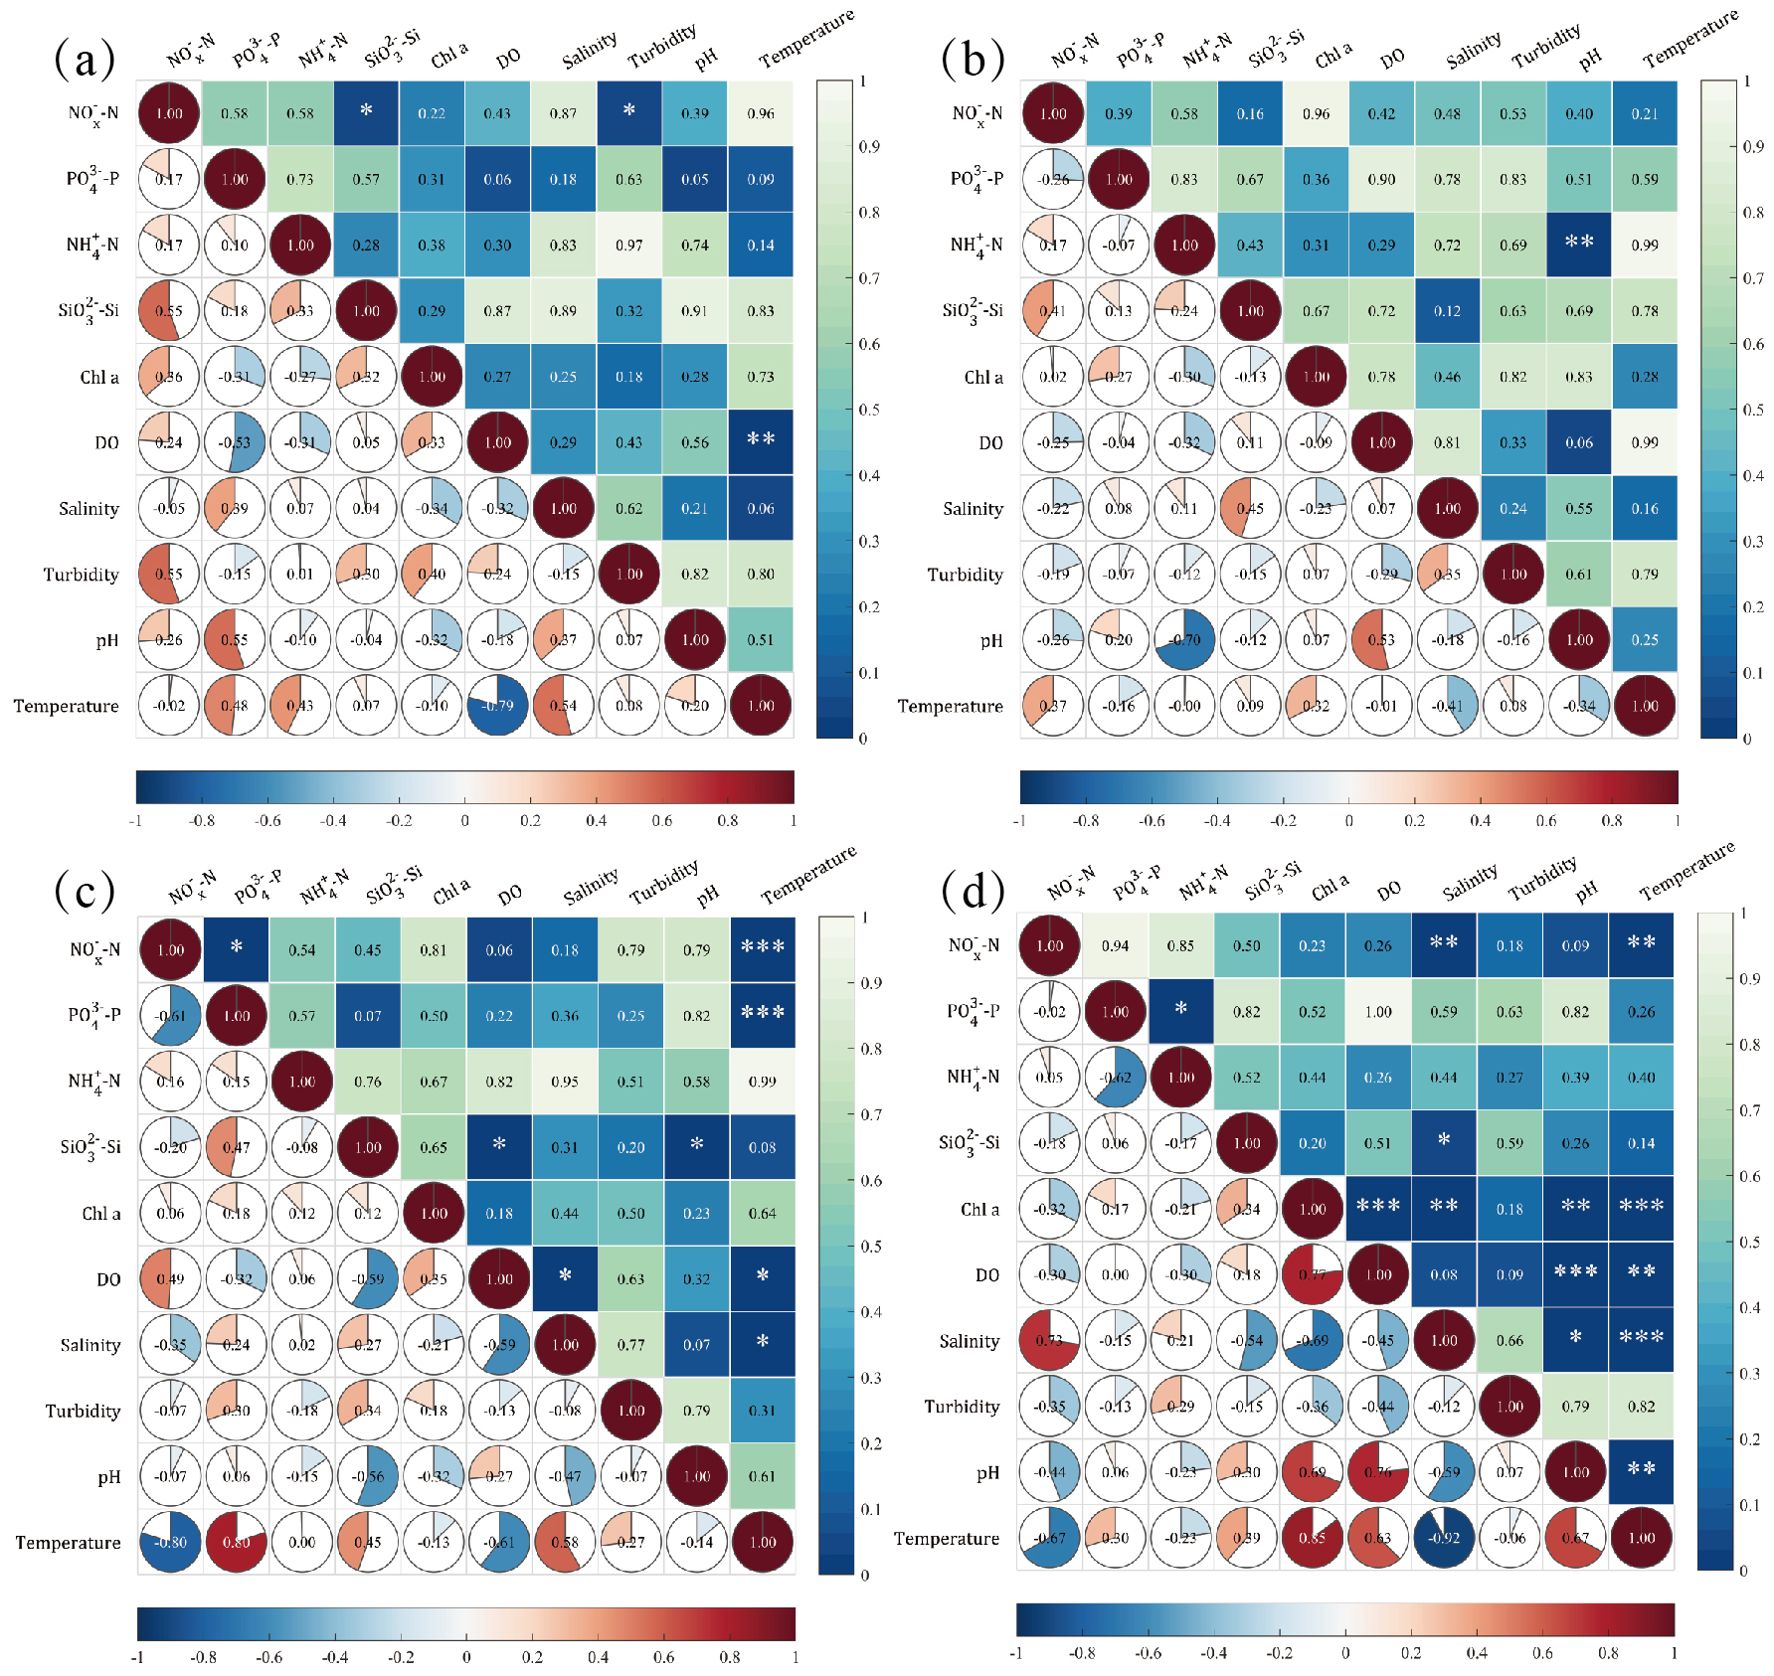
Figure 10. Correlation among ecological indicators during the surface (a) and bottom (b) seawater in spring and the surface (c) and bottom (d) seawater in summer. The numbers in the lower-left triangle area of the heat map indicate the correlation coefficients, and that in the upper-right triangle area indicate significance levels. (Correlation coefficient r ≥ 0.8 is strong correlation; 0.5 ≤ r ≤ 0.8 is moderate correlation; r < 0.5 indicates weak correlation. The symbols *, **, and *** indicate significance levels of <0.05, ≤0.01, and ≤0.001, respectively).
5 Conclusion
In order to provide timely information related to the recent shift in ecological indicators, the seasonal and spatial variations of nutrients, and the relationship between nutrients, Chl a, and other ecological indicators in Daya Bay were studied. In Daya Bay, nutrients varied spatiotemporally, and the main composition of DIN was transformed from the dominance of -N to that of -N, which may be attributed to the implementation of the policy of Clearance for Breeding and Fishing Platoon in Daya Bay Economic Development Zone. Based on the potentially limiting nutrient analysis, the proportions between DIN, DIP, and DSi were far from the Redfield ratio overall and a succession from N-limited to P-limited was observed during these surveys. According to PCA, the important components included temperature, salinity, DO, and pH in Daya Bay. Variation of DIN composition may stimulate the growth of certain species of phytoplankton, and a shift in dominant species of phytoplankton may occur in Daya Bay. To prevent the outbreak of dominant algae and maintain the sustainable development of marine resources, it is necessary to conduct timely detection and long-term monitoring of nutrient and other important water environment parameters. Additionally, it is crucial for government departments to promptly formulate marine resource development plans and adjust industrial structures based on the current situation.
Data availability statement
The raw data supporting the conclusions of this article will be made available by the authors, without undue reservation.
Author contributions
JZ: Data curation, Formal analysis, Investigation, Methodology, Validation, Visualization, Writing – original draft. JH: Data curation, Formal analysis, Investigation, Writing – review & editing. CaL: Conceptualization, Funding acquisition, Methodology, Project administration, Resources, Supervision, Validation, Writing – review & editing. ZY: Funding acquisition, Resources, Writing – review & editing. CoL: Data curation, Investigation, Visualization, Writing – review & editing. XZ: Data curation, Formal analysis, Visualization, Writing – review & editing. MQ: Investigation, Writing – review & editing. DT: Investigation, Writing – review & editing. WZ: Funding acquisition, Resources, Writing – review & editing. ZX: Formal analysis, Writing – review & editing. YC: Resources, Writing – review & editing.
Funding
The author(s) declare that financial support was received for the research and/or publication of this article. This work has received funding from the Guangdong Basic and Applied Basic Research Foundation (2023A1515240073 and 2021A1515110639), the Science and Technology Planning Project of Guangzhou Nansha District Guangzhou City China (20222D001), the Hainan Provincial Natural Science Foundation of China (422QN441), the 2021 Open Fund for the Key Laboratory of Marine Environmental Survey Technology and Application, Ministry of Natural Resources of China (MESTA-2021-B006), the Science and Technology Fundamental Resources Investigation Program (2022FY100601), and the Open Project Program (LTOZZ2003) of the State Key Laboratory of Tropical Oceanography (SOSIO, CAS).
Acknowledgments
We sincerely thank Prof. Gang Li and Dr. Yu Zhong for their generous assistance during the Daya Bay research cruise (Network Survey Cruise of Daya Bay Comprehensive Experimental Station of Marine Biology, Chinese Academy of Sciences).
Conflict of interest
The authors declare that the research was conducted in the absence of any commercial or financial relationships that could be construed as a potential conflict of interest.
Generative AI statement
The author(s) declare that no Generative AI was used in the creation of this manuscript.
Publisher’s note
All claims expressed in this article are solely those of the authors and do not necessarily represent those of their affiliated organizations, or those of the publisher, the editors and the reviewers. Any product that may be evaluated in this article, or claim that may be made by its manufacturer, is not guaranteed or endorsed by the publisher.
Supplementary material
The Supplementary Material for this article can be found online at: https://www.frontiersin.org/articles/10.3389/fmars.2025.1560930/full#supplementary-material
References
Chen C.-C., Shiah F.-K., Chung S.-W., and Liu K.-K. (2006). Winter phytoplankton blooms in the shallow mixed layer of the south China sea enhanced by upwelling. J. Mar. Syst. 59, 97–110. doi: 10.1016/j.jmarsys.2005.09.002
Fuwu X., Huaxue L., Honghui H., and Xingyu S. (2018). Effects of thermal discharge and nutrients input on size structure of phytoplankton in daya bay (in chinese). J. Trop. Oceanography 37, 55–64.
GB17378.4 (2007). “The specification for marine monitoring-part 4: Seawater analysis,” in General Administration of Quality Supervision. Inspection and Quarantine of the People’ s Republic of China; Standardization Administration. (China: Inspection and Quarantine of the People’ s Republic of China; Standardization Administration).
Greening H., Janicki A., Sherwood E. T., Pribble R., and Johansson J. O. R. (2014). Ecosystem responses to long-term nutrient management in an urban estuary: Tampa bay, florida, usa. Estuarine Coast. Shelf Sci. 151, A1–A16. doi: 10.1016/j.ecss.2014.10.003
Guo Z., Xiao Y., Liu Y., Wu P., and Li C. (2023). Long-term variations of biogenic elements and nutritional status in daya bay, northern south China sea. J. Mar. Sci. Eng. 11, 904. doi: 10.3390/jmse11050904
Guo W., Zhang X., Yang Y., and Hu M. (1998). Potential eutrophication assessment for chinese coastal waters (in chinese). J. Oceanography Taiwan Strait/Taiwan Haixia 17, 64–70.
Hao Y., Tang D., Boicenco L., and Wang S. (2016). Environmental ecological response to increasing water temperature in the daya bay, southern China in 1982-2012. Natural Resour. 7, 184–192. doi: 10.4236/nr.2016.74017
HJ442.3 (2020). Technical specification for offshore environmental monitoring. Ministry Ecol. Environ. People’ s Republic China. 1.
HJ730 (2014). Specifications on spot location of monitoring sites related to coastal area environment. Ministry Ecol. Environ. People’ s Republic China. 3–7.
Huang X., Guo F., and Huang D. (2008a). Nutrients diffusion fluxes in sediment-water interface in marine culture area of daya bay and its environmental significance (in chinese). Mar. Environ. Sci. 27, 6–12.
Huang X., Guo F., and Huang L. (2008b). Researches on surface sediment environment in marine culture area of daya bay (in chinese). J. Trop. Oceanogr. 27, 37–42.
Jordan T. E., Correll D. L., and Weller D. E. (1997). Effects of agriculture on discharges of nutrients from coastal plain watersheds of Chesapeake Bay (Madison, Wisconsin: Tech. rep., Wiley Online Library).
Li Y. (2020). Temporal and spatial distribution of phytoplankton community structure in Daya Bay and its adjacent waters from November 2017 to July 2018. Master’s thesis. , Xiamen University.
Li D., Liu J., Zhang R., Chen M., Yang W., Li J., et al. (2019). N2 fixation impacted by carbon fixation via dissolved organic carbon in the changing daya bay, south China sea. Sci. Total Environ. 674, 592–602. doi: 10.1016/j.scitotenv.2019.04.176
Liu S. M., Li R. H., Zhang G. L., Wang D. R., Du J. Z., Herbeck L. S., et al. (2011). The impact of anthropogenic activities on nutrient dynamics in the tropical wenchanghe and wenjiaohe estuary and lagoon system in east hainan, China. Mar. Chem. 125, 49–68. doi: 10.1016/j.marchem.2011.02.003
Ma Y., Wang X., Xu X., Liu W., Wang Z., Shi H., et al. (2023). Distributions characteristics of nutrients in sea water and its ecological environment effects in daya bay (in chinese). Environ. Monit. China 39, 110–122.
Möllmann C., Diekmann R., MÜLLER-KARULIS B., Kornilovs G., Plikshs M., and Axe P. (2009). Reorganization of a large marine ecosystem due to atmospheric and anthropogenic pressure: a discontinuous regime shift in the central baltic sea. Global Change Biol. 15, 1377–1393. doi: 10.1111/j.1365-2486.2008.01814.x
Qingyang L., Zhanhui Q., Xiuyu G., Tingting H., Rongjun S., Wenbo Z., et al. (2017). Impact of deep-water net cage fish farming in daya bay, southern China on environment (in chinese). South China Fish. Sci. 13, 25–32.
Qu K., Chen B., Yuan Y., and Xin F. (2000). A preliminary study on influence of n and p on population constituent of planktonic diatoms in seawater (in chinese). J. Appl. Ecol. 11, 445–448.
Rao Y., Cai L., Chen X., Zhou X., Fu S., and Huang H. (2021). Responses of functional traits of macrobenthic communities to human activities in daya bay (a subtropical semi-enclosed bay), China. Front. Environ. Sci. 9, 766580. doi: 10.3389/fenvs.2021.766580
Redfield A. C., Ketchum B. H., and Richards F. A. (1963). The influence of organisms on the composition of seawater. Sea 2, 26–77.
Rocha C., Galvão H., and Barbosa A. (2002). Role of transient silicon limitation in the development of cyanobacteria blooms in the guadiana estuary, south-western iberia. Mar. Ecol. Prog. Ser. 228, 35–45. doi: 10.3354/meps228035
Su L., Huang Z., and Luo Y. (2019). The characteristics of phytoplankton community structure and the relationship with environmental factors of daya bay in summer and winter (in chinese). Adv. Mar. Sci. 37, 284–293.
Suiliang H., Changjuan Z., Shenglan D., Min W., Feng G., Chao L., et al. (2011). Study on the relationships among ph, dissolved oxygen and chlorophyll a: Aquaculture water (in chinese). Chin. J. Environ. Eng. 5, 1201–1208.
Sun C., Wang Y., Sun S., and Zhang F. (2006). Analysis dynamics of phytoplankton community characteristics in daya bay (in chinese). Acta Ecol. Sin. 26, 3948–3958.
Sun C.-C., Wang Y.-S., Wu M.-L., Dong J.-D., Wang Y.-T., Sun F.-L., et al. (2011). Seasonal variation of water quality and phytoplankton response patterns in daya bay, China. Int. J. Environ. Res. Public Health 8, 2951–2966. doi: 10.3390/ijerph8072951
Tsujimoto A., Nomura R., Yasuhara M., Yamazaki H., and Yoshikawa S. (2006). Impact of eutrophication on shallow marine benthic foraminifers over the last 150 years in osaka bay, Japan. Mar. Micropaleontol. 60, 258–268. doi: 10.1016/j.marmicro.2006.06.001
Wu R., Cai S., Wang S., and Zhang W. (2007). Three-dimensional numerical simulation of tidal current and residual current at daya bay. J. Trop. Oceanography 26, 18–23.
Wu M.-L., Wang Y.-S., Dong J.-D., Sun C.-C., Wang Y.-T., Sun F.-L., et al. (2011). Investigation of spatial and temporal trends in water quality in daya bay, south China sea. Int. J. Environ. Res. Public Health 8, 2352–2365. doi: 10.3390/ijerph8062352
Wu M.-L., Wang Y.-S., Wang Y.-T., Yin J.-P., Dong J.-D., Jiang Z.-Y., et al. (2017). Scenarios of nutrient alterations and responses of phytoplankton in a changing daya bay, south China sea. J. Mar. Syst. 165, 1–12. doi: 10.1016/j.jmarsys.2016.09.004
Yang Z., Zhang J., Zhao J., Zhou W., Cheng Y., Xu Z., et al. (2024). A high-sensitivity lab-on-a-chip analyzer for online monitoring of nitrite and nitrate in seawater based on liquid waveguide capillary cells. Lab. Chip 24, 3528–3535. doi: 10.1039/D4LC00248B
Yu J., Tang D., Yao L., Chen P., Jia X., Li C., et al. (2010). Long-term water temperature variations in daya bay, China using satellite and in situ observations. Terrestrial Atmospheric Oceanic Sci. 21, 393–399. doi: 10.3319/TAO.2009.05.26.01(Oc)
Zhan B., Zeng G., and Li L. (1990). Temperature and salinity of daya bay. Collections Papers Mar. Ecol. Daya Bay (II) 67–74.
Zhang P., Chen Y., Peng C., Dai P., Lai J., Zhao L., et al. (2020). Spatiotemporal variation, composition of din and its contribution to eutrophication in coastal waters adjacent to hainan island, China. Regional Stud. Mar. Sci. 37, 101332. doi: 10.1016/j.rsma.2020.101332
Keywords: nutrients, total oxidized nitrogen, ammonia, anthropogenic activities, Daya Bay, South China Sea
Citation: Zhao J, He J, Li C, Yang Z, Liu C, Zhang X, Qin M, Tang D, Zhou W, Xu Z and Cheng Y (2025) Seasonal and spatial variations of nutrients and environmental effects under anthropogenic influence in Daya Bay, China. Front. Mar. Sci. 12:1560930. doi: 10.3389/fmars.2025.1560930
Received: 15 January 2025; Accepted: 21 April 2025;
Published: 20 May 2025.
Edited by:
Ram Kumar, Central University of South Bihar, IndiaReviewed by:
Solomon Dan, Beibu Gulf University, ChinaJibiao Zhang, Guangdong Ocean University, China
Copyright © 2025 Zhao, He, Li, Yang, Liu, Zhang, Qin, Tang, Zhou, Xu and Cheng. This is an open-access article distributed under the terms of the Creative Commons Attribution License (CC BY). The use, distribution or reproduction in other forums is permitted, provided the original author(s) and the copyright owner(s) are credited and that the original publication in this journal is cited, in accordance with accepted academic practice. No use, distribution or reproduction is permitted which does not comply with these terms.
*Correspondence: Cai Li, bGljbGFpcmVAc2NzaW8uYWMuY24=