 Phillip A. Morin1*
 Bernhard Bein2,3
 Chiara Bortoluzzi4†Yury V. Bukhman5Taylor Hains6,7
 Dorothea Heimeier8
 Marcela Uliano-Silva4,9Dominic E. Absolon4Linelle Abueg10Jessica Antosiewicz-Bourget5Jennifer R. Balacco10
 Robert K. Bonde11Nadolina Brajuka10
 Andrew C. Brownlow12
 Emma L. Carroll8
 Molly Carter4Joanna Collins4
 Nicholas J. Davison12Amy Denton4Olivier Fedrigo10
 Andrew D. Foote13
 Giulio Formenti10
 Guido R. Gallo14
 Carola Greve2Marlys L. Houck15Caroline Howard4
 Jeff K. Jacobsen16
 Nivesh Jain10Ksenia Krasheninnikova4
 Brigid M. Maloney10Bethan F. Manley4Thomas C. Mathers4Shane A. Mccarthy4
 Michael R. Mcgowen17Susanne Meyer18
 Jacquelyn Mountcastle10
 Benjamin A. Neely19Brian O’toole10
 Sarah Pelan4
 Patricia E. Rosel20Teri K. Rowles21
 Oliver A. Ryder15
 Tilman Schell2Ying Sims4
 Judy St Leger22
 Ron Stewart5Kerstin Ternes23Tatiana Tilley10
 Conor Whelan10
 Jonathan M. D. Wood4
 Michael Hiller2,3*‡
 Mark Blaxter4*‡
 Erich D. Jarvis10,24*‡
- 1Southwest Fisheries Science Center, National Marine Fisheries Service, National Oceanic and Atmospheric Administration, La Jolla, CA, United States
- 2LOEWE Center for Translational Biodiversity Genomics & Senckenberg Research Institute, Frankfurt, Germany
- 3Institute of Cell Biology & Neuroscience, Faculty of Biological Sciences, Goethe University, Frankfurt, Germany
- 4Tree of Life, Wellcome Sanger Institute, Cambridge, United Kingdom
- 5Regenerative Biology, Morgridge Institute for Research, Madison, WI, United States
- 6Committee on Evolutionary Biology, The University of Chicago, Chicago, IL, United States
- 7Negaunee Integrative Research Center, Field Museum of Natural History, Chicago, IL, United States
- 8School of Biological Sciences, The University of Auckland–Waipapa Taumata Rau, Auckland, Aotearoa, New Zealand
- 9Faculty of Life Sciences and Aquaculture, Nord University, Bodø, Norway
- 10Vertebrate Genome Laboratory, The Rockefeller University, New York, NY, United States
- 11Wetland and Aquatic Research Center, U.S. Geological Survey (USGS), Gainesville, FL, United States
- 12School of Biodiversity, One Health and Veterinary Medicine, College of Medical, Veterinary and Life Sciences, University of Glasgow, Glasgow, United Kingdom
- 13Center for Ecological and Evolutionary Synthesis, Department of Biosciences, University of Oslo, Oslo, Norway
- 14Department of Biosciences, University of Milan, Milan, Italy
- 15Conservation Science Wildlife Health, San Diego Zoo Wildlife Alliance, Escondido, CA, United States
- 16V.E. Enterprises, Arcada, CA, United States
- 17Department of Vertebrate Zoology, National Museum of Natural History, Smithsonian Institution, Washington, DC, United States
- 18Neuroscience Research Institute, University of California, Santa Barbara, Santa Barbara, CA, United States
- 19National Institute of Standards and Technology, Charleston, NC, United States
- 20Marine Mammal and Turtle Division, Southeast Fisheries Science Center, National Marine Fisheries Service, National Oceanic and Atmospheric Administration, Lafayette, LA, United States
- 21Office of Protected Resources, National Marine Fisheries Service, National Oceanic and Atmospheric Administration, Silver Spring, MD, United States
- 22New York State College of Veterinary Medicine, Cornell University, Ithaca, NY, United States
- 23Zoo Duisburg AG, Duisburg, Germany
- 24Howard Hughes Medical Institute (HHMI), Chevy Chase, MD, United States
Reference genomes from representative species across families provide the critical infrastructure for research and conservation. The Cetacean Genomes Project (CGP) began in early 2020 to facilitate the generation of near error-free, chromosome-resolved reference genomes for all cetacean species. Towards that goal, and using the methods, goals and genome assembly quality standards of the Vertebrate Genomes Project (VGP), we generated 13 new reference genomes across eight of the 14 cetacean families. Additionally, we summarize the genome assembly characteristics for 18 species, including these newly-generated and five published genome assemblies that meet the completeness and quality standards. We infer ancestral linkage groups (ALG) for cetaceans, showing that the ancestral karyotype of 22 ALGs is largely conserved in extant species, except for Ziphiidae, and for Balaenidae and Kogiidae, which exhibit similar independent fusions. Gene annotation, characterization of historical demography, heterozygosity and runs of homozygosity (ROH) reveal important information for conservation applications. By comparing the new reference genomes to previous draft assemblies, we show that the reference genomes have enhanced characteristics that will support and promote scientific research. Specifically, the genomes improve resolution and characterization of repetitive elements, provide validation (or exclusion) of genes linked to complex traits, and allow more complete characterization of gene regions such as the highly complex Major Histocompatibility Complex (MHC) Class I and II gene clusters that are important for population health.
1 Introduction
Cetaceans (whales, dolphins, and porpoises) represent the largest group of fully aquatic mammal species, comprised of 94 currently recognized species in 14 families of the infraorder Cetacea (Committee on Taxonomy, S.f.M.M, 2024). Despite their typically large body size and long history of human exploitation (Ivashchenko et al., 2013; Ivashchenko and Clapham, 2015), cetaceans remain poorly understood, largely due to the difficulty of studying highly mobile species at sea, obtaining fresh tissue samples, and the relatively low representation of adequately preserved specimens in museums. The number of recognized species and subspecies of cetaceans has continued to increase, especially as genetic and genomic methods have provided a proxy (Taylor et al., 2017; Morin et al., 2023) for morphologically-based taxonomy in recent years (e.g., Archer et al., 2019; Braulik et al., 2021; Costa et al., 2022; Morin et al., 2024). The unique adaptations of cetaceans are also of interest for ecological, evolutionary, and biomedical research (e.g., Foote et al., 2015; Keane et al., 2015; Springer et al., 2016a, 2016; Hecker et al., 2017; Grummer et al., 2019; Huelsmann et al., 2019; McGowen et al., 2020b; Springer et al., 2021; Silva et al., 2023; Bukhman et al., 2024).
As DNA sequencing technologies and genome assembly methods advance, genetic studies of cetaceans and other non-model species are rapidly evolving, involving large numbers of variable markers (e.g., single nucleotide polymorphisms; SNPs) within species (Leslie and Morin, 2018; Van Cise et al., 2019) or across species (Yim et al., 2014; Foote et al., 2015; Arnason et al., 2018; Autenrieth et al., 2018; Morin et al., 2021a; Wolf et al., 2023). At the population level, SNP genotyping methods can provide a wealth of information about genome-wide heterozygosity (Foote et al., 2021b; Robinson et al., 2022; Foote et al., 2023), genomic structure (Christmas et al., 2023), adaptive diversity (Foote et al., 2015; Andrews et al., 2021; Louis et al., 2023), phylogenetics, historical demography, mutational load (Zhou et al., 2018; Foote et al., 2019, 2021; de Greef et al., 2022; Robinson et al., 2022; Westbury et al., 2023), population structure (Foote and Morin, 2016; Lah et al., 2016; Leslie and Morin, 2016; Barceló et al., 2021; Morin et al., 2021b; de Greef et al., 2022; Onoufriou et al., 2022; Reeves et al., 2022; Garroway et al., 2024), and social structure and inbreeding (Van Cise et al., 2017; Foote et al., 2021b, 2023; Kardos et al., 2023).
Increasingly, genomic studies are being recognized as important for conservation research and management (Hohenlohe et al., 2021; Formenti et al., 2022; Paez et al., 2022; Cook et al., 2023; Nigenda-Morales et al., 2023; Theissinger et al., 2023; Zamudio, 2023; Hogg, 2024). Across diverse species, reference genomes are being used as the basis for studies that directly and indirectly inform conservation management, including taxonomic revisions (Zhou et al., 2018; Braulik et al., 2021; Carroll et al., 2021; Morin et al., 2024), historical demography (Dussex et al., 2021; Morin et al., 2021a), life history and population dynamics (Hernandez et al., 2023; Parsons et al., 2023; Eichenberger et al., 2024), population structure (de Greef et al., 2022), population management (Murchison et al., 2012; Foster et al., 2021; Hasselgren et al., 2021; Guhlin et al., 2023), and estimating the potential impacts of inbreeding depression (Robinson et al., 2022; Kardos et al., 2023).
A major limitation for genetic and genomic research of cetaceans has been the relative paucity of high-quality reference genomes (Morin et al., 2020). For many of the projects listed above, the first step has been the long, labor intensive, and often expensive process of generating a reference genome. Alternatively, researchers make do with poor quality genome assemblies or genomes from distantly related species (e.g., Yim et al., 2014; Autenrieth et al., 2018; Zhou et al., 2018; Morin et al., 2021a; Kardos et al., 2023), both of which can limit or bias results (Korlach et al., 2017; Anderson-Trocme et al., 2019; Prasad et al., 2022; Thorburn et al., 2023). To address this issue, the Cetacean Genomes Project (CGP) was started in early 2020 to organize and coordinate resources (samples, data, funding, sequencing efforts) for cetacean genomes, with a primary goal of enabling the generation of high-quality, nearly-complete, chromosome-level reference genomes (hereafter referred to as just reference genomes) for all cetacean species (Morin et al., 2020). Recognizing the logistical and financial difficulties in generating reference quality genomes from all 94 recognized species, the initial goals included identification of high-quality tissue samples or cell lines, and targeting of at least one species representing as many of the 14 families as possible.
Multiple large collaborative genome projects (e.g., The Vertebrate Genomes Project (VGP, Rhie et al., 2021), Darwin Tree of Life UK (DToL; Blaxter et al., 2022); collectively under the umbrella of the Earth Biogenome Project (EBP, Lewin et al., 2018)) focused on generating high-quality reference genomes have agreed on achieving a set of quality metrics (see methods) for benchmarking reference genomes (often referred to as platinum or chromosome-level assemblies). These benchmarks include high contiguity (contig and scaffold N50, that is, the size of the contig/scaffold which, along with the larger contigs/scaffolds, contains half of the sequence of a genome assembly) and completeness (percent complete genes), base-level accuracy (QV), structural accuracy (e.g., removal of false duplications), and haplotype phasing (Rhie et al., 2021). Manual curation of structural errors (Howe et al., 2021) results in more complete and accurate genome assemblies, with improved structural resolution and gene annotation (Kim et al., 2022). Whenever possible, genomes are annotated based on RNA sequences of the same species and the NCBI eukaryotic (Thibaud-Nissen et al., 2013) and/or ENSEMBL vertebrate pipelines (ensembl.org/info/genome/genebuild/).
Here, we evaluate and compare reference genomes of 18 species that meet the VGP assembly standards, of which five were previously published and 13 are new (Table 1). These 18 genomes represent eight of the 14 cetacean families (Figure 1), providing the genomic infrastructure for research and conservation across the cetacean phylogeny. We conduct synteny analysis to investigate chromosomal conservation across the infraorder. For each species, we characterize the genomes for levels and patterns of genome-wide heterozygosity and repetitive element content. As many cetacean species have been heavily depleted by industrial whaling, habitat destruction and/or fisheries bycatch, and remain vulnerable to anthropogenic impacts, we infer historical demography and runs of homozygosity (ROH) to provide context for genomic variation that is important for conservation (e.g., mutational load related to inbreeding depression; Robinson et al., 2022; Kardos et al., 2023; Kyriazis et al., 2023).
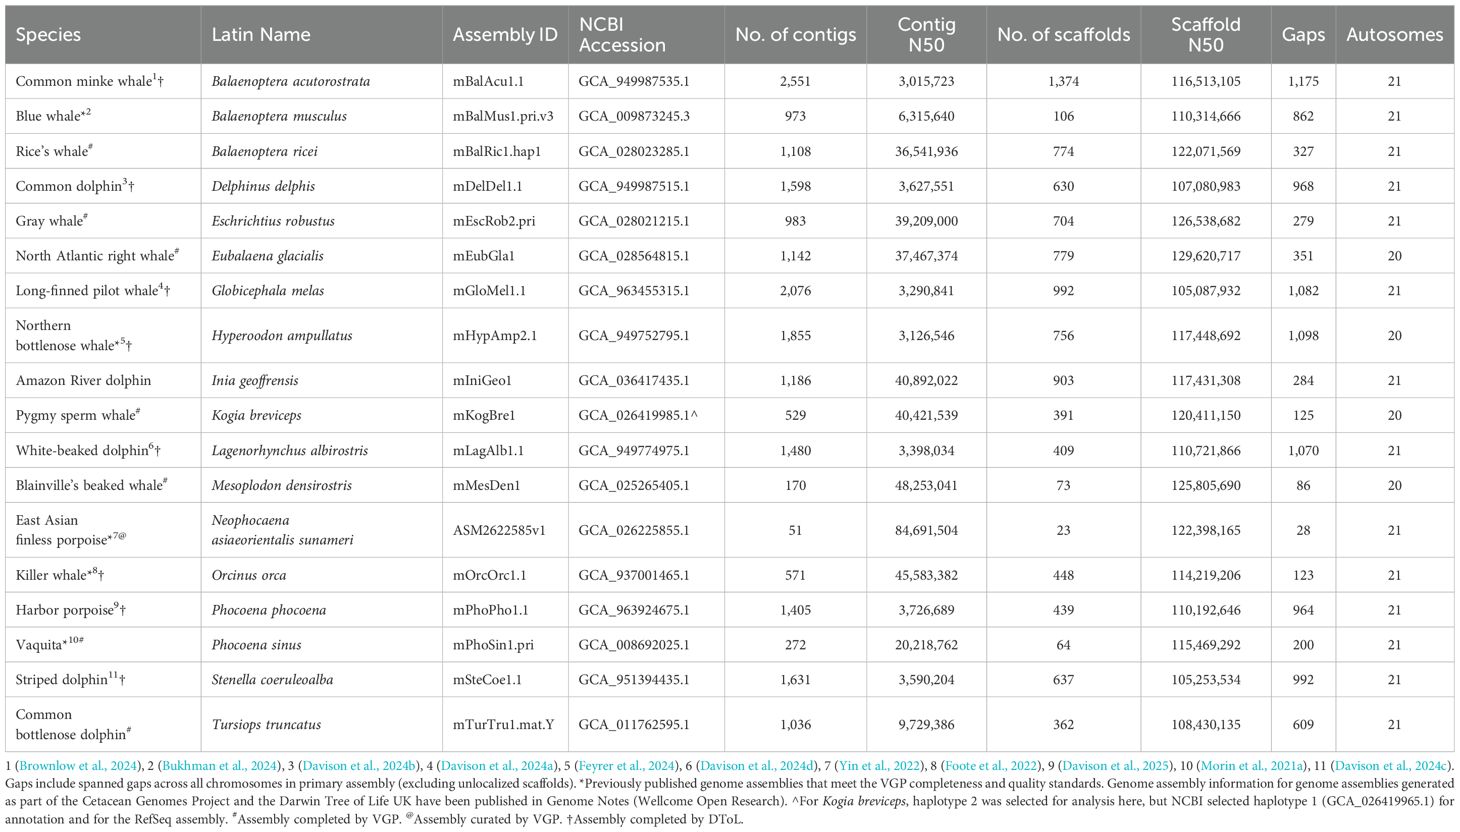
Table 1. Reference genome information for the primary haplotype of 18 cetacean species.
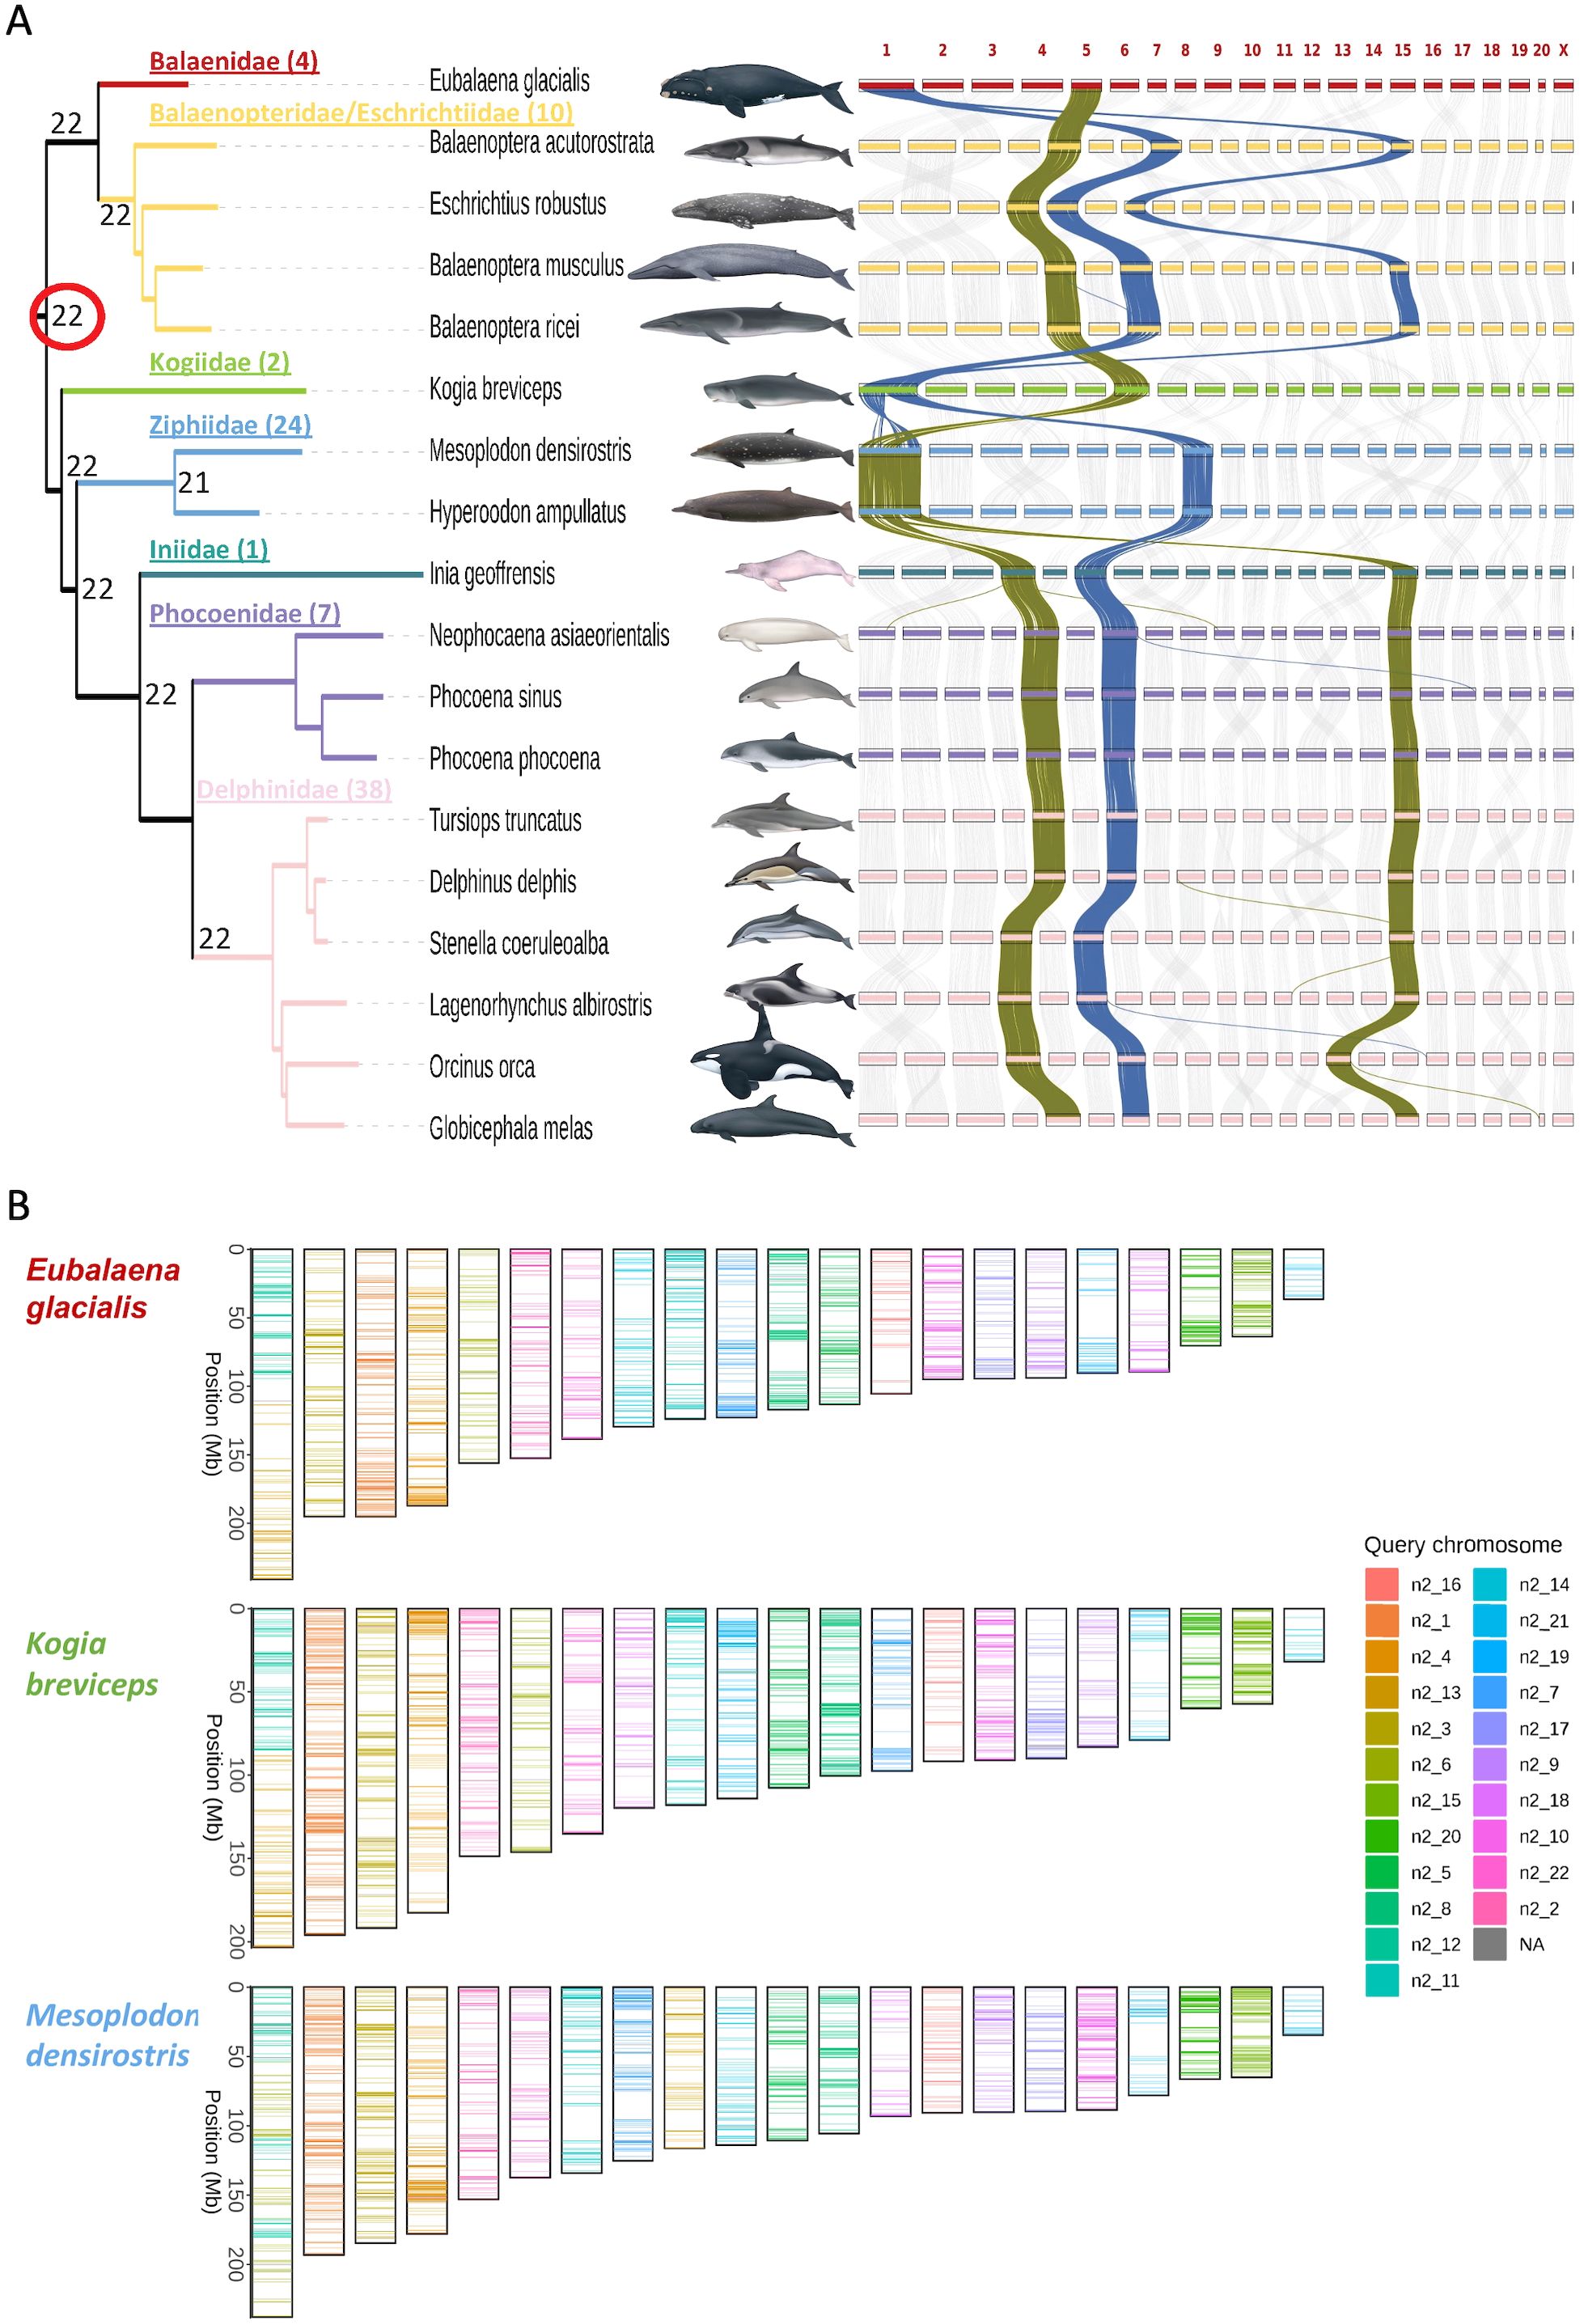
Figure 1. (A) Maximum likelihood phylogeny (left) based on mitochondrial genome sequences coding for proteins and tRNA loci, rooted with hippopotamus (NC_000889), with multiple genome alignment synteny plot (right). Families (number of species) are color coded, with Balaenopteridae and Eschrichtiidae combined. Numbers at ancestral nodes indicate the haploid chromosome number (autosomes plus sex chromosome) based on ALGs. Synteny plots represent size and positions of orthologous loci mapped to the chromosome assemblies, arranged by the chromosome number assigned for each reference genome based on size within each genome assembly, and do not reflect the actual chromosome sizes. The rearranged order of some of the chromosomes from one species to another is due the VGP and EBP convention of naming chromosomes by assembly size within a species rather than naming chromosomes according to synteny (except for the X chromosome). The darker connecting lines in the synteny plot highlight several changes in chromosome organization among species and across families. Families (number of species) that are not represented in this phylogeny are: Lipotidae (1), Monodontidae (2), Neobalaenidae (1), Plantanistidae (2), Physeteridae (1), and Pontoporiidae (1) (Society for Marine Mammalogy list of marine mammal species and subspecies, consulted 01 Sept., 2023). Species images by Uko Gorter (not to scale). (B) The predicted karyotypes for three species with apparent fusion events, and extant chromosome paintings based on the ALGs.
Cetacean genomes are also of evolutionary and biomedical interest, providing insight into unique adaptations. Traits of interest have included genes involved in vision (Springer et al., 2016a; McGowen et al., 2020b), tooth development (Springer et al., 2016c), hypoxic response (Yuan et al., 2021), body mass (Yuan et al., 2021; Bukhman et al., 2024), and aging (Keane et al., 2015), to name a few. To demonstrate the value of these high-quality reference genomes, we investigate the improvement in completeness and structural variation of complex gene and repetitive regions. High-quality genome assemblies provide a more complete representation of genomic loci that contain high gene copy numbers and are highly polymorphic (Rhie et al., 2021; Jarvis et al., 2022; Liao et al., 2023). This is because determining gene content and organization of such highly complex loci has been difficult from draft genomes based on short-read data. Similar to repetitive elements, repeated or duplicated gene elements are often longer than standard short-reads and can cause a collapse in the assembly. This can lead to a misrepresentation or complete loss of repeat genes in the draft genome. One such complex region is the MHC gene region, containing immunogenetic loci at the front line for pathogen detection and immune response in all jawed vertebrates investigated (Kelley et al., 2005). The MHC is organized into three regions: class I, III, and II, with its overall structure conserved in placental mammals (Kumanovics et al., 2003; Kelley et al., 2005; Kaufman, 2018). Class I and class II regions contain the classical genes that bind antigens and initiate an immune response by presenting those to T lymphocytes (Thorsby, 2009). MHC class I genes comprise blocks (α, ĸ, and ß blocks) between so-called “framework genes”. Typically, the MHC gene regions expand through block and/or gene duplication within the confines of the framework genes (Abduriyim et al., 2019).
A previous study characterized the MHC class I and class IIa regions in 21 cetacean genome assemblies and corroborated the assembly with PCR amplification and sequencing of exon 2 for both class I and IIa regions from a variety of species (Heimeier et al., 2024). This work found that the MHC region was most accurately and completely reconstructed in assemblies using long-read sequences (reference assemblies), three of which were available at the time. Here we build on that work to investigate how the high-quality reference genomes have improved the resolution and accuracy of cetacean MHC.
Finally, investigation of individual genes associated with traits relies on genome annotation. While it is not always possible to obtain and appropriately preserve fresh samples from cetacean species for RNA sequencing and genome annotation, the majority of reference genomes represented here have been annotated based on RNA sequencing from the same species. This increased library of RNA sequences from diverse species within the infraorder will facilitate annotation of genomes from species for which RNA sequence data are not available, and form the basis for gene-based studies. To illustrate the impact of the recent increase in annotated genomes for gene-based studies, we expand on a recent study of single nucleotide variants of the gene IGF1, associated with body size in several species, including cetaceans (Bukhman et al., 2024).
2 Materials and methods
2.1 Genome sequencing and assembly
Five previously published reference genomes for cetaceans (Table 1) were selected based on inclusion in the VGP or DToL, or meeting the genome assembly quality metrics used by the VGP, EBP, and other genome consortia, as described by Rhie et al. (2021) and summarized in the EBP report on assembly standards (v. 4.0 - March 2021; Earth Biogenome Project, 2021). Briefly, these quality metrics require high continuity (Contig N50 >1Mb, Scaffold N50 >10Mb), assignment of ≥90% of the sequence to chromosomes with <200 gaps per Gb, <5% false duplications, base-level accuracy (QV) >40, k-mer completeness >90%, detection of >90% of core genes (based on BUSCO analysis), and manual curation of the scaffolded assembly.
Samples for de novo genome sequencing must contain substantial quantities of ultra-high molecular weight DNA for long-read sequencing, and preferably RNA for genome annotation (Dahn et al., 2022). Fresh tissues or cultured cells for DNA and RNA extraction and sequencing, maintained at -80°C, were shipped on dry ice to either the Vertebrate Genomes Laboratory at the Rockefeller University in New York (n=6), or the Darwin Tree of Life laboratories at The Wellcome Sanger Institute in Cambridge (n=6), for laboratory processing and genome assembly. The sample for Inia geoffrensis was obtained from a captive individual in the Duisburg Zoo in Germany and sequenced, assembled, and curated at the Senckenberg Research Institute, Frankfurt, Germany (see Supplementary Methods for details) and further processed for submission to NCBI at the Vertebrate Genome Lab.
One previously published reference genome (Neophocaena asiaeorientalis) was manually curated (Howe et al., 2021) at the Vertebrate Genome Lab as part of the VGP standard curation process, also verifying that it met the EBP minimum quality metrics. The curation process is documented at https://gitlab.com/wtsi-grit/rapid-curation. All previous and new cetacean genomes that met the metrics were included in the CGP BioProject (PRJNA1020146). Genome assemblies generated by the VGP and DToL for this study followed the standard VGP pipelines 1.6 (Rhie et al., 2021) to 2.0 (Lariviere et al., 2024), including PacBio continuous long-reads (CLR) or high fidelity reads (HiFi, Pacific Biosciences, Menlo Park, CA, USA), Hi-C chromatin-linkage scaffolding, and optional Bionano Genomics (Bionano Genomics, Inc., San Diego, CA, USA) optical mapping for scaffolding. Phasing of haplotypes was done either with FALCON unzip software (Chin et al., 2016) or with parental sequence data when available, or Hi-C data, using appropriate algorithms (e.g. TrioBinning (Koren et al., 2018) or HiFiasm (Cheng et al., 2022), respectively). Short-read Illumina RNAseq or long-read PacBio IsoSeq mRNA sequencing of one or more tissues was generated for gene annotation. For a more detailed description, see Morin et al. (2021a); Rhie et al. (2021), and Lariviere et al. (2024); in addition, for DToL assemblies, see individual Genome Notes publications (Table 1). See Supplementary Methods for details on sequencing, assembly and curation of the Inia geoffrensis genome.
2.2 Genome alignment and synteny
The genomes of nine species (Orcinus orca, Stenella coeruleoalba, Tursiops truncatus, Phocoena sinus, Inia geoffrensis, Mesoplodon densirostris, Balaenoptera ricei, Eschrichtius robustus, and Eubalaena glacialis) were selected as references to be aligned to 1–2 other assemblies based on their phylogenetic placement (Supplementary Table S1). Assemblies were indexed using lastdb parameters ‘-uRY4 -cR11’, pairwise alignments were performed using the LAST software (Kielbasa et al., 2011), and these alignments were formatted to be visualized by MCScanX (Wang et al., 2012) from the JCVI utility package (Tang et al., 2024) using custom Python scripts. MCScanX identifies intergenomic syntenic blocks from LAST hits. Unlocalized and unplaced scaffolds were excluded from the alignments. All commands were run using custom shell scripts (see https://osf.io/6dqcr/, “Genome alignment and synteny”). Inverted chromosomes were reoriented through a custom python script (Mudd et al., 2020). Pairwise alignments were filtered for alignment blocks ≥1kb for calculation of alignment block statistics using MafFilter (v1.3.1; Dutheil et al., 2014).
Ancestral linkage groups (ALGs) were predicted with Syngraph (Mackintosh et al., 2023) using the phylogenies built from mitochondrial coding regions (see methods above) and BUSCO gene markers. Species chromosome paintings were plotted with lep_busco_painter (https://github.com/charlottewright/lep_busco_painter).
2.3 Phylogenetics
Mitochondrial genomes (Supplementary Table S2) were aligned using Muscle (v3.8.425, Edgar, 2004; implemented in Geneious Prime). Ribosomal RNA (12s and 16s rRNA) and the control region were removed and a maximum likelihood (ML) phylogenetic tree based on only the coding sequences (CDS) and tRNA sequences was produced using W-IQ-TREE (Trifinopoulos et al., 2016). The best model for the ML tree (GTR+F+I+G4) was identified based on BIC using ModelFinder (Kalyaanamoorthy et al., 2017) and bootstrapped using UFboot (Hoang et al., 2018) with 1000 replicates for bootstrapping (all implemented through IQ-TREE). The resulting consensus tree was visualized with Interactive Tree of Life (ITOL v6.9; Letunic and Bork, 2024).
The most parsimonious consensus phylogeny based on 12,126 individual nuclear locus phylogenies was generated for comparison. The BUSCO single copy orthologues were selected with busco2fasta.py (https://github.com/lstevens17/busco2fasta) where loci were present in at least 80% of the species. Alignments were generated with MAFFT (v7.525; Katoh and Standley, 2013) and trimmed with trimAl (v1.5; Capella-Gutierrez et al., 2009). Supermatrix and gene partition trees were built with IQ-TREE (v2.3.6; Minh et al., 2020), selecting the best-fit model based on the BIC default criterion for each locus. For the gene trees, a summary gene tree was built with ASTRAL (v5.7.8; Mirarab et al., 2014) (see Supplementary Figure S1).
2.4 Genome annotation
When transcriptomic data were generated de novo or previously available in the NCBI short-read archive (SRA), genome annotation was completed by the NCBI Eukaryotic Genome Annotation Pipeline (Goldfarb et al., 2024) and assemblies submitted to NCBI RefSeq. Assemblies submitted by DToL to the European Nucleotide Archive (ENL) were also annotated independently by ENSEMBL vertebrate pipeline (ensembl.org/info/genome/genebuild/).
2.5 Gene content and repeat masking
Genome assemblies created from short-read sequencing data notoriously struggle to accurately represent repetitive sequences such as transposable elements or satellite repeats in centromeres and telomeres, as read lengths <300 nucleotides are often not able to span whole repeats, and highly-similar repeats either lead to contig breaks (repeats would then fall into assembly gaps) or are collapsed in the assembly (Cechova, 2020; Mascher et al., 2021; Peona et al., 2021). Contig gaps and scaffolding errors can also result in lower or incomplete gene detection.
To test whether long-read based assemblies differ in content and resolution of repetitive elements, indicating missed and/or collapsed repetitive sequences in earlier short-read based assemblies of the same organisms, and to provide a first glance on the distribution and divergence of repetitive element classes in the new assemblies, we compared three pairs of reference and draft assemblies. Repeats were detected using RepeatMasker (v.4.1.6; Smit et al., 2013-1015) with species “cetacea” within the repeat database Dfam v3.8 (accessed July 07, 2024; Storer et al., 2021, www.dfam.org), resulting in 9,721 repeat models in the output library. We masked repetitive sequences in all reference assemblies and in three representatives of earlier draft genome assemblies for comparative analysis (Orcinus orca, Delphinus delphis, Eubalaena glacialis, obtained from DNAzoo.org (Dudchenko et al., 2017), accessed July 22, 2024). We then created repeat landscape tables with the RepeatMasker script calcDivergenceFromAlign.pl. For all draft and reference assemblies, gene completeness was determined using BUSCO v5.3.2 (cetartiodactyla_odb10 lineage dataset) and default parameter settings (Manni et al., 2021).
2.6 Genomic variation and historical demography
Paired-end Illumina short-read sequence data (Supplementary Table S3) from one individual of each species were aligned to their respective reference genomes to assess heterozygosity and historical demography following methods described previously (Morin et al., 2021a). Short-read archive (SRA) datasets were selected for ≥20x average depth of coverage. When a high-coverage WGS dataset was not available, Hi-C short-read data from the genome assembly datasets were mapped to the reference genomes. Briefly, for both WGS and Hi-C data, paired-end reads were quality filtered and trimmed using the BBduk function of BBTools (sourceforge.net/projects/bbmap/), and aligned to a reference mitochondrial genome (Supplementary Table S2) from the species to remove mtDNA reads. The remaining nuclear DNA reads were aligned to the respective species reference assemblies using BWA mem (Li and Durbin, 2009) or BWA-mem2 (Vasimuddin et al., 2019). After duplicate reads were removed using Picard-Tools (http://broadinstitute.github.io/picard/), depth of coverage was assessed using ANGSD (v. 0.933; Korneliussen et al., 2014). The resulting diploid nuclear genome pileup was repeat masked using BEDtools (v. 2.29.2; Quinlan and Hall, 2010). The distribution of heterozygosity across the repeat-masked genome was determined using ANGSD to detect heterozygotes across 1MB non-overlapping windows, filtering out sites with <1/3X or >2X the average depth of coverage.
For analysis of runs of homozygosity (ROH), variants were called using DeepVariant v1.6.0 (Poplin et al., 2018) and the model best suited for Illumina whole-genome sequencing data. Variants were subsequently filtered to remove genotypes with quality <15, quality score <20, or genotype depth <1/3x or >2x the average depth of coverage, as calculated in samtools v1.2 (Danecek et al., 2021). On average, 3,309,742 bi-allelic SNPs were used in the downstream analyses. Runs of homozygosity were identified using the approach of Bortoluzzi et al. (2020), which uses a corrected measure of heterozygosity estimated in consecutive, non-overlapping 10 kb windows to account for species having substantial variation in heterozygosity and population history, and to adjust for mutations that might accumulate and mask autozygosity over time (Bosse et al., 2012). To minimize the impact of local assembly or alignment errors, we relaxed the heterozygosity threshold allowed within a candidate ROH by including a peak of heterozygosity only if its inclusion did not inflate the average heterozygosity within the final ROH. This overall heterozygosity had to be below 0.25 of the average heterozygosity (See Bosse et al., 2012 for methods justification and analysis). The same thresholds were applied consistently to all analyzed genomes. Very short ROHs (<100 kb) were discarded from downstream analyses.
Historical demography was inferred using the Pairwise Sequential Markovian Coalescent (PSMC; Li and Durbin, 2011). The diploid consensus genome was extracted from the repeat-masked genome pileup using Samtools (v. 1.15.1; Danecek et al., 2021), filtering sites with <1/3X or >2X mean coverage, and used as input for PSMC with species specific generation times (Supplementary Table S4; Taylor et al., 2007) and an autosomal mutation rate of 4.90E-10 substitutions/site/year (Robinson et al., 2022). The PSMC time windows contained 64 atomic intervals combined in the pattern ‘1+1+1+1+25*2+4+6’ to avoid over-clumping artifacts (Hilgers et al., 2025). Remaining parameters were left as default values used for humans (Li and Durbin, 2011), and 100 bootstrap resamplings were performed to assess variance of the model.
2.7 MHC content and organization
Chromosomes containing the MHC region for all 18 cetacean reference genomes were identified by comparison with the known MHC coordinates of framework genes on chromosome 10 of the bottlenose dolphin (GCA_011762595.1) in the NCBI comparative genome viewer (https://www.ncbi.nlm.nih.gov/cgv), and whole MHC regions extracted from each genome for comparative analysis. Within the extracted MHC regions, we used the existing gene annotations in 13 cetacean genomes to identify framework and MHC genes. For the five genomes for which annotations were not yet available, we aligned the MHC region to that of its closest relative using MAFFT (Katoh et al., 2005) implemented in Geneious 10.0.0 (Biomatters Ltd., NZ) and transferred annotations with >92% similarity. MHC genes were assumed to be functional if a coding sequence (CDS) was annotated with no stop codon present in the reading frame; all others were labeled as pseudogenes. Gene designations (as in the official annotations) were confirmed by extracting full-length class I and class IIa genes from each genome assembly and aligned with MAFFT for each gene. Whole MHC region alignments were conducted with Mauve (Darling et al., 2004) using the progressive aligner algorithm and default settings to identify large-scale region rearrangements and inversions within the MHC region.
Of the fifteen species with reference genomes not previously evaluated in Heimeier et al. (2024), eight were previously evaluated for the MHC region in draft short-read assemblies. These eight pairs of differing quality genomes provided the opportunity to assess whether the higher quality assemblies improve the resolution of this region; and if so, what characteristics of the MHC region’s architecture and contents have improved in the reference genomes. We also used all the available reference genomes to assess how closely those assemblies represent the ‘correct’ versions by a comparative analysis covering all major families of the cetacean clade.
2.8 IGF1 single nucleotide variant associations with body mass
Single nucleotide variants in the insulin-like growth factor 1 (IGF1) locus have been previously associated with body mass in 11 cetaceans and 18 terrestrial mammals, but previous associations in cetaceans were limited by availability of annotated reference genomes (Ostrander et al., 2017; Plassais et al., 2022; Bukhman et al., 2024). Analysis of previously described IGF1 SNV sites was conducted on the expanded set of 20 annotated cetacean genomes as previously described (Bukhman et al., 2024), with additional body mass values from Groot et al. (2023).
3 Results
3.1 CGP genome quality and completeness
The 18 reference genomes that met the VGP and EBP quality metrics and analyzed here represent family-level diversity within the infraorder Cetacea (eight families, which include 86 of the 94 species). The genome assemblies are the result of several different combinations of technologies (e.g., both higher-error-rate (CLR) and lower-error-rate (HiFi) longreads, shotgun short-reads, Hi-C short-reads, optical mapping) as well as assembly and curation methods. All share the use of long-read sequencing and scaffolding methods to link and order contigs, resulting in nearly gapless full chromosome assemblies (Table 1). For all 18 genome assemblies, the scaffold N50 exceeded the minimum standard of 10 Mb (Figure 2A) set by the VGP (Rhie et al., 2021) and adopted by other large genome consortia including the EBP (Blaxter et al., in press1). The scaffolds assigned to chromosomes had ≥95% complete BUSCO genes detected (Figure 2C).
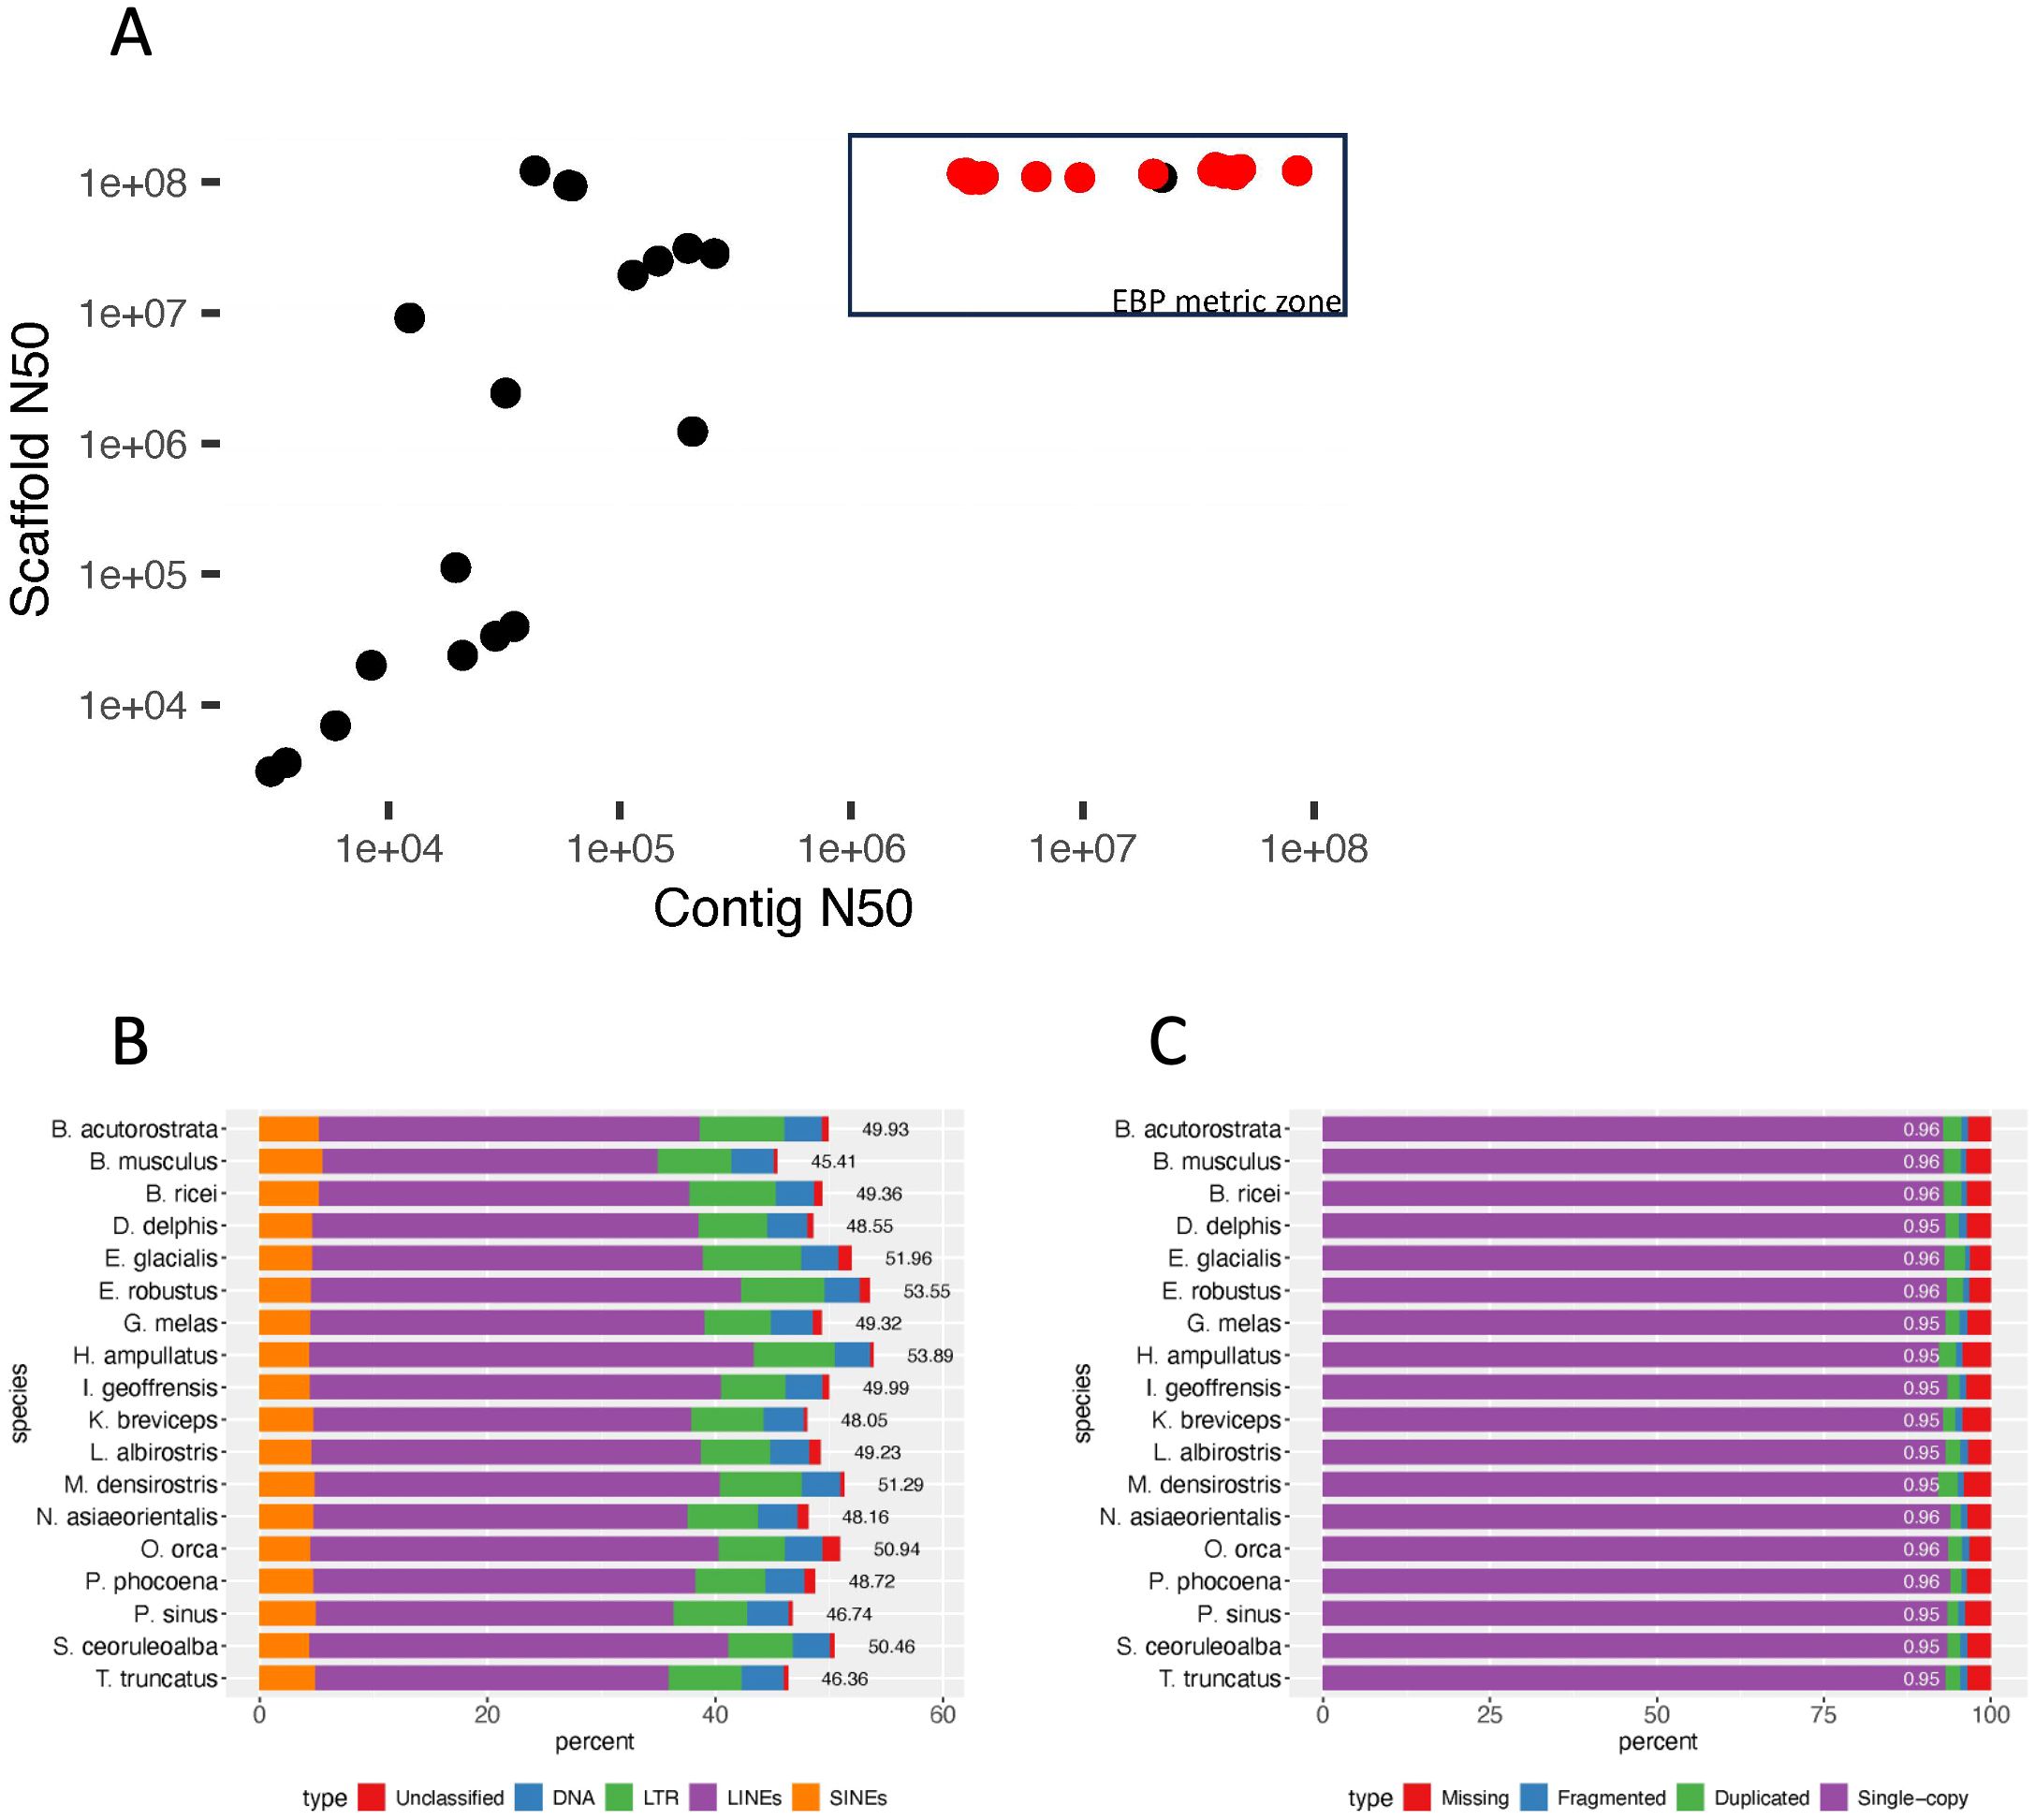
Figure 2. (A) Scaffold N50 vs. contig N50 for representative and reference cetacean genome assemblies. The 18 EBP-quality reference genomes are indicated by red points. One genome (Monodon monoceros (Narwhal), GCA_005190385) meets the EBP scaffold and contig thresholds, but has not been curated. (B) Reference genome repeat content. Repeat types were identified based on the dFAM repeat library (v.3.8) for cetacea, plotted by percent of genome assembly, with overall percentage next to the bar for each species. (C) The percent of genes identified by BUSCO (v.5.3.2) for each species is shown with percent of complete (single-copy + duplicated) BUSCO loci indicated (out of 13335 BUSCO groups searched).
3.2 Synteny and major structural variation.
Family-level relationships in the mitogenome phylogenetic topology (Figure 1) are consistent with the nuclear locus phylogeny (Supplementary Figure S1) and with those presented in previous phylogenetic studies based on mitochondrial and nuclear genomic analyses of a large portion of extant cetacean species (McGowen et al., 2020a; Guo et al., 2022). The mitochondrial genome is a single locus, representing only one supergene tree, and the phylogeny exhibits minor differences in branch topology within families compared to the consensus nuclear genome tree (McGowen et al., 2020a). Taking advantage of the chromosome-level genomes, we have predicted 22 ALGs for the last common ancestor of all cetaceans including the sex chromosome (Figure 1). The predicted karyotypes that are presented as numbers at nodes in the phylogenetic tree (Figure 1A) and extant chromosome paintings based on the ancestral ALGs (Supplementary Figure S2) show that most species conserved the ALGs intact to their present karyotypes. Balaenidae and Kogiidae, however, appear to have independently evolved a fusion of the same two ALGs, forming their largest chromosome (Figure 1B). Ziphiidae also fused two ALGs to form the present species’ karyotype, one of which is also involved in the fusions in Balaenidae and Kogiidae. Alignment characteristics for 17 pairwise alignments used to generate the multiple alignment are provided in Supplementary Table S1.
3.3 Genome annotation
Gene annotation was available for thirteen of the eighteen genomes as of August, 2024. For some species, only a single tissue was used to generate transcriptome data, but for others, transcriptomes from multiple tissues from the same species, and/or from related species were used to complete the annotation, resulting in higher numbers of genes being identified (Supplementary Figure S3; see individual NCBI Genome accessions (Table 1) for details).
For one assembly, Kogia breviceps, the genome was annotated twice. The first time was based on available transcriptome data from another species in a different family (Physeteridae), and these two species are estimated to have diverged approximately 22 M years ago (McGowen et al., 2020a), potentially limiting identification of genes and other transcribed regions due to differences in gene content and organization, and sequence divergence. We subsequently provided K. breviceps RNAseq (short-read) and IsoSeq (long-read) transcriptome data from four tissues, and the genome was re-annotated by NCBI. Comparison of the annotations indicated they were significantly changed and improved with the same-species data, with 23.6% of annotations marked as “major changes”, and 62.9% marked as “minor changes”, plus both gain and loss of identified genes in the NCBI annotation report (Supplementary Table S5).
3.4 Repetitive elements
In the comparison of three pairs of draft and reference assemblies, the newly created long-read assemblies contained an average of 7.5% more sequences identified by RepeatMasker than earlier short-read based genomes, for a mean of 50.12% of the long-read genome (range 44.83 – 54.47). (Figures 2B, 3). This increase is due to both an increase in the assembly length (the short-read assembly is only longer than the long-read assembly in one species, Delphinus delphis), and to an increase in sequences identified as repeats. Strikingly, the repeat landscape distributions in both the Orcinus orca and Delphinus delphis assemblies show peaks of LINE/L1 elements of little (5-6%) divergence from the consensus sequence covering ~25% of the genome (Figure 4). These peaks hint at a recent burst of LINE/L1 activity in these species. In Eubalaena glacialis, L1 peaks were less pronounced but still discernible at 11-13% divergence, signaling a slightly older burst in L1 insertion activity (Figure 4). Importantly, in the respective short-read assemblies, many of these recent, highly similar transposon copies were absent or with barely visible peaks, demonstrating that long-read based assemblies are required to reveal a complete picture of the transposon landscape and history. In general, L1 elements were the most abundant repeat class in all assemblies (Supplementary Figure S4), including the short-read assemblies.
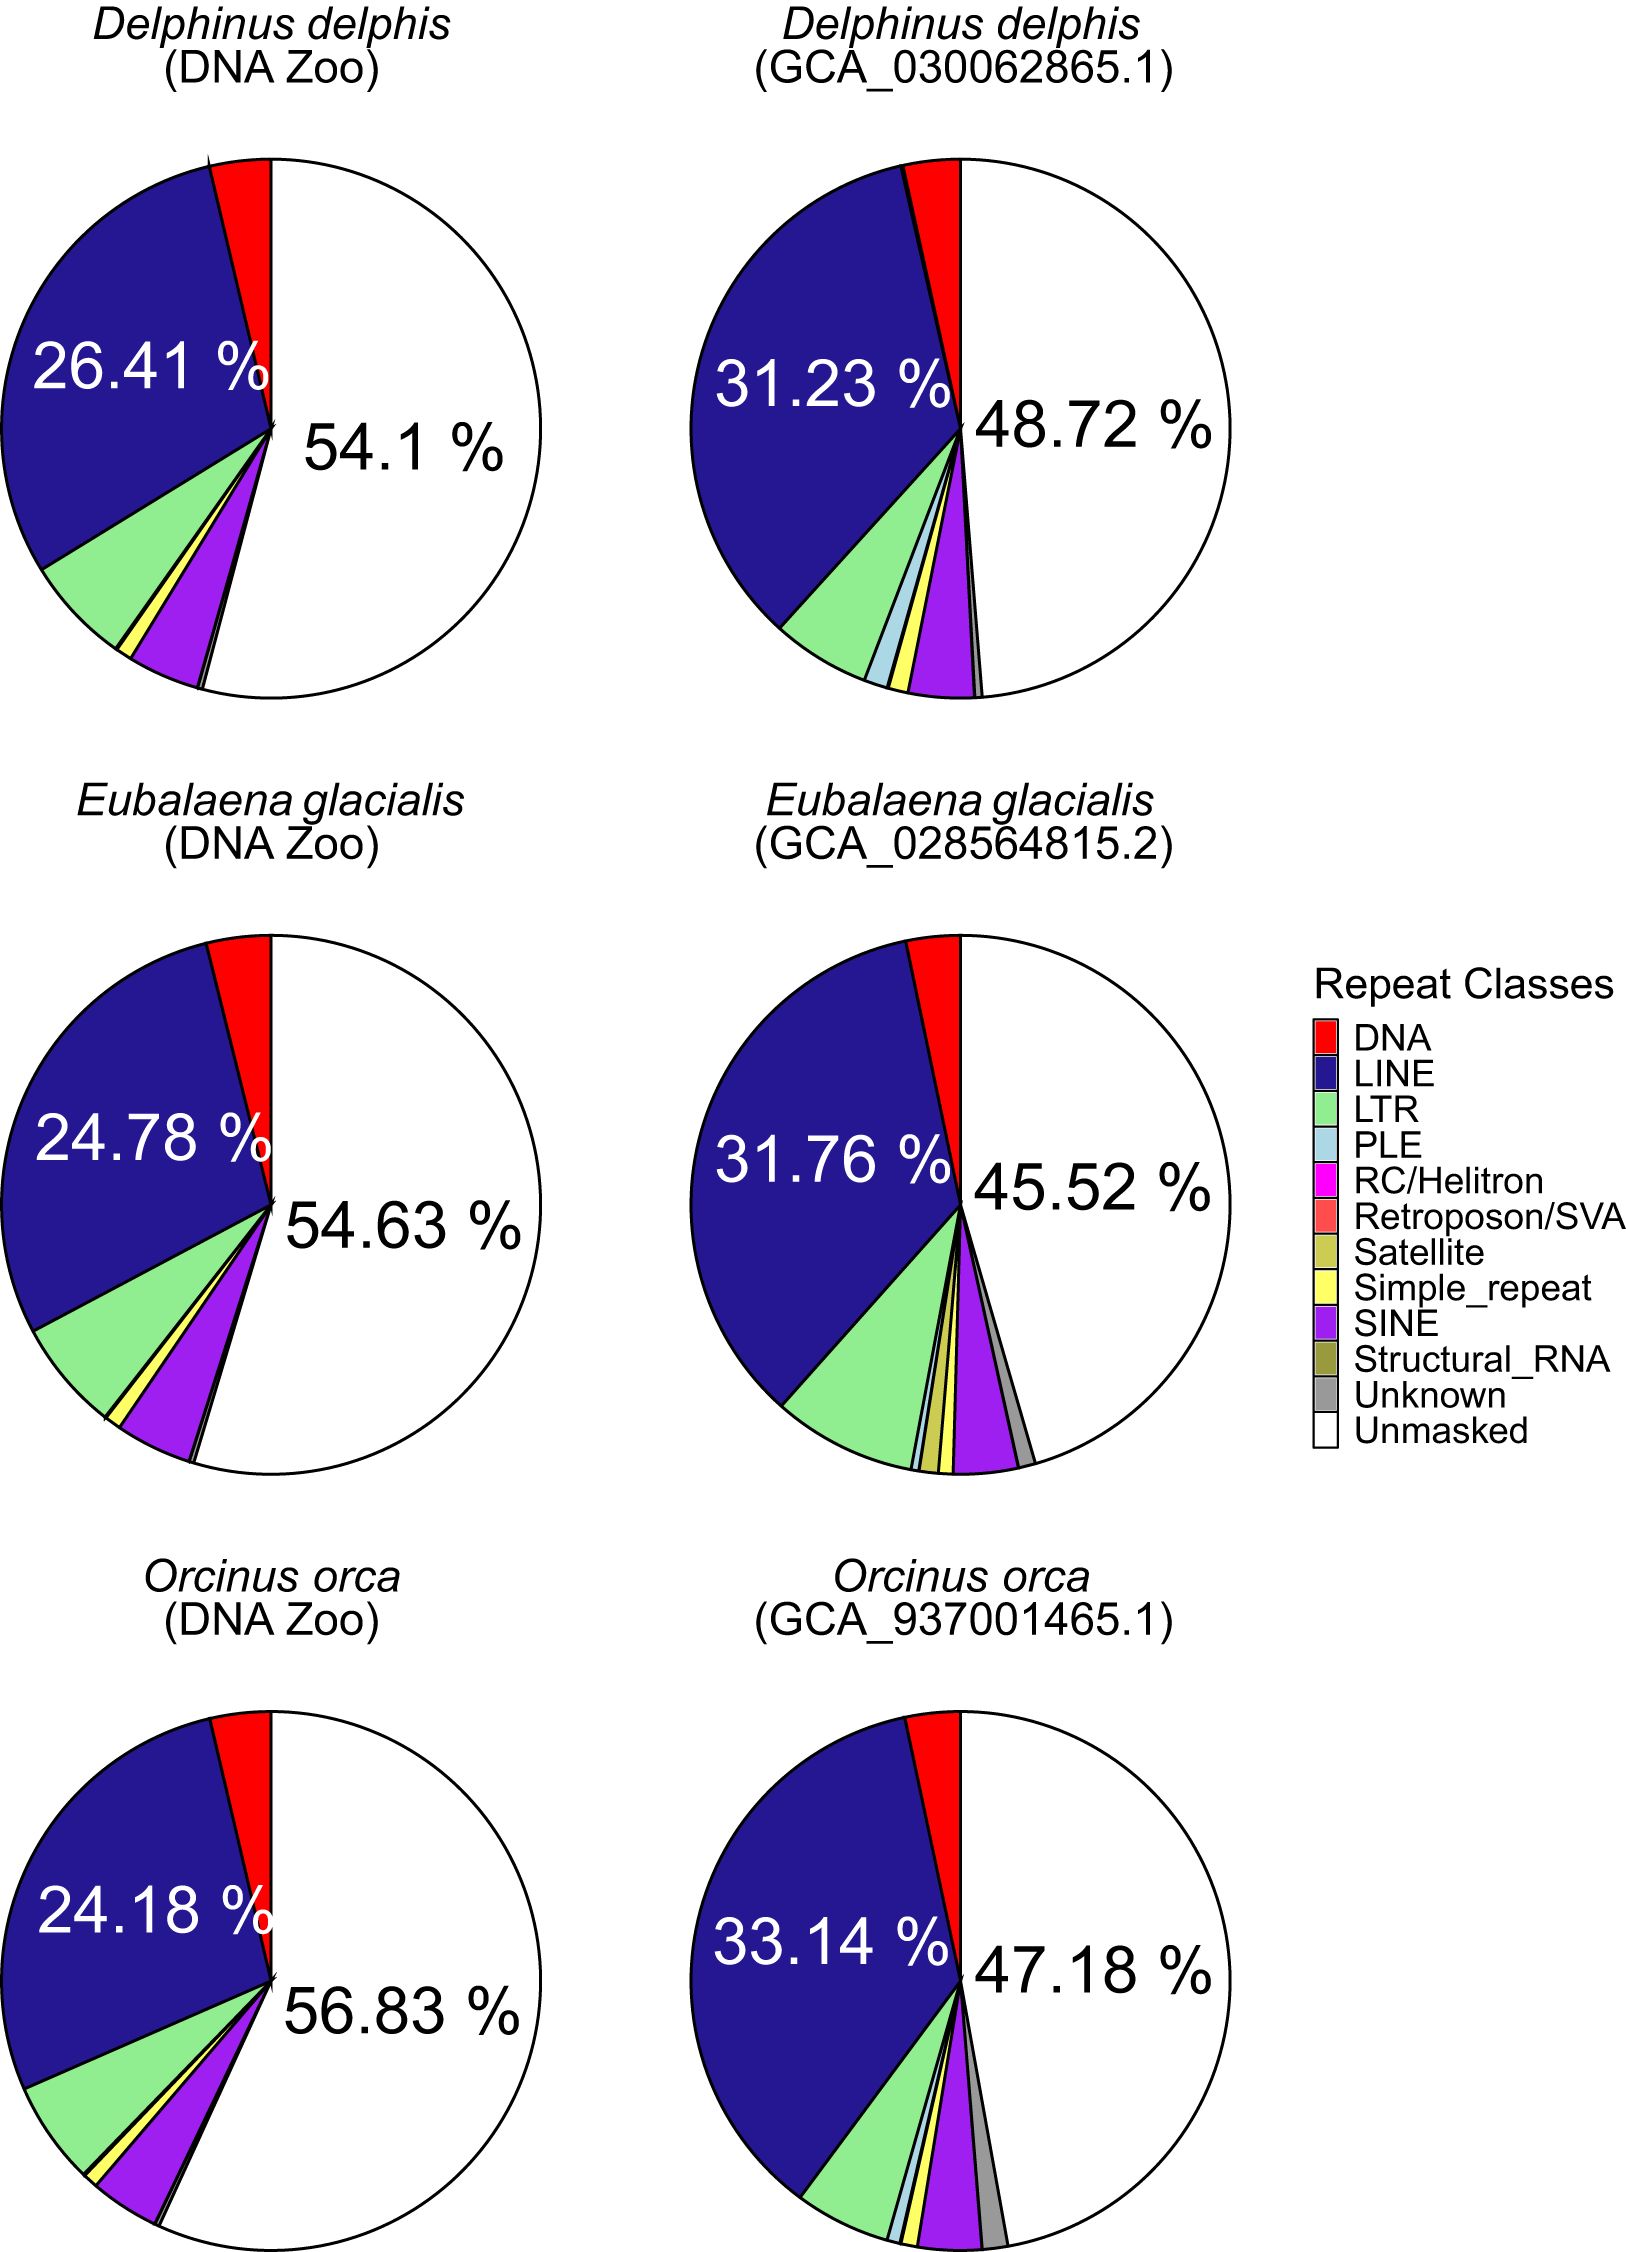
Figure 3. Pie charts showing masked percentage of genome assemblies for draft assemblies from DNAzoo (left) and reference assemblies (right) of Delphinus delphis, Eubalaena glacialis and Orcinus orca. For unmasked sequence and LINE/L1 elements, the percentage is shown on the respective section.
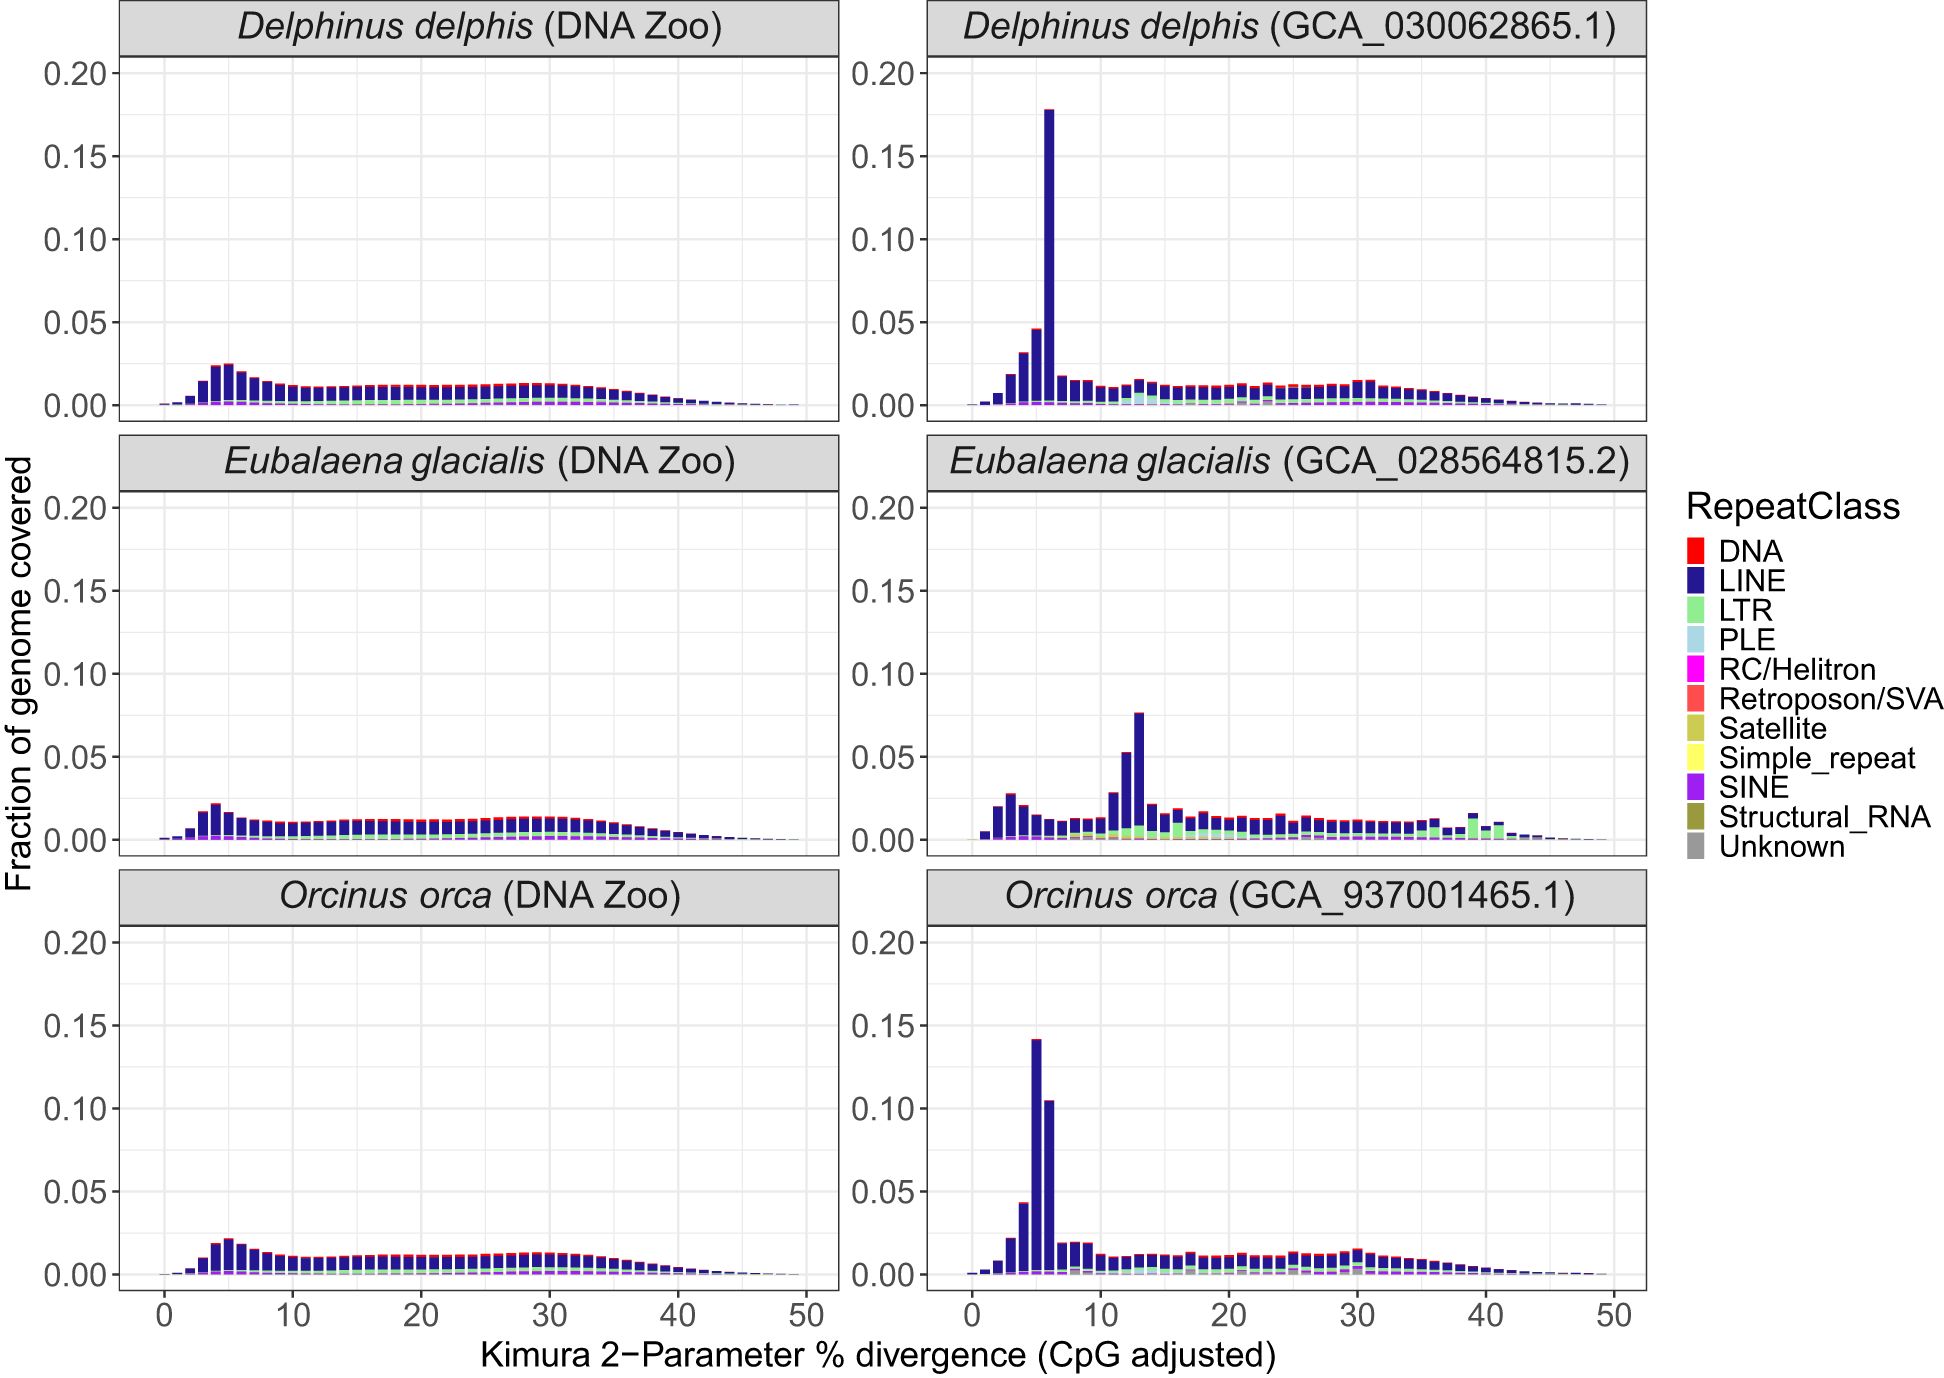
Figure 4. Repeat landscape of draft and reference assemblies. (A) Repeat Landscape plots for draft DNAzoo assemblies for Delphinus delphis, Eubalaena glacialis and Orcinus orca, and for (B) Reference-quality assemblies of the same species. The X-axis depicts Kimura-2-Parameter % divergence compared to the model’s consensus sequence (CpG adjusted). The Y-axis shows percentage of the respective genome assembly covered by repeats belonging to a divergence class. Repeat classes are shown as different colors in stacked barplots.
3.5 Genomic variation and historical demography
Average heterozygosity per 1 Mb window ranged from 0.11 sites/kb (vaquita, Phocoena sinus) to 5.06 sites/kb (pygmy sperm whale, Kogia breviceps) (Figure 5, Supplementary Figure S5), for an average 1.12 sites/kb. The distribution of heterozygosity across the genome was homogenous for all species except the Rice’s whale (Balaenoptera ricei), for which we observed regions of high heterozygosity interspersed with regions of low or no heterozygosity (Supplementary Figure S5). The alignment file for Rice’s whale was not indicated to be problematic based on genome coverage and number of mapped reads, and the distribution of heterozygosity remained highly variable when reads were aligned to the blue whale reference genome, indicating that the variation in heterozygosity was not due to variation in the Rice’s whale reference genome assembly quality. We further compared the genome-wide depth of coverage with other species with an even heterozygosity. The genome coverage for the Rice’s whale was consistently high along the genome and at times was more homogenous than that of other species, such as that of the Amazon River dolphin (Inia geoffrensis) (Supplementary Figure S6). This indicates that the uneven heterozygosity distribution in the Rice’s whale genome likely reflects its unique, and as yet largely unknown, demographic history rather than issues caused by poor mapping or uneven genome coverage. Since the use of Hi-C data for read mapping of some genomes could bias depth of coverage towards regions of the chromosome that link to other parts of the chromosome (Wang et al., 2020), we also checked for uneven coverage across chromosome one for all species. Although some species exhibited more unevenness in coverage than others, it did not appear to be linked to data type (HiC vs. WGS; Supplementary Figure S6).
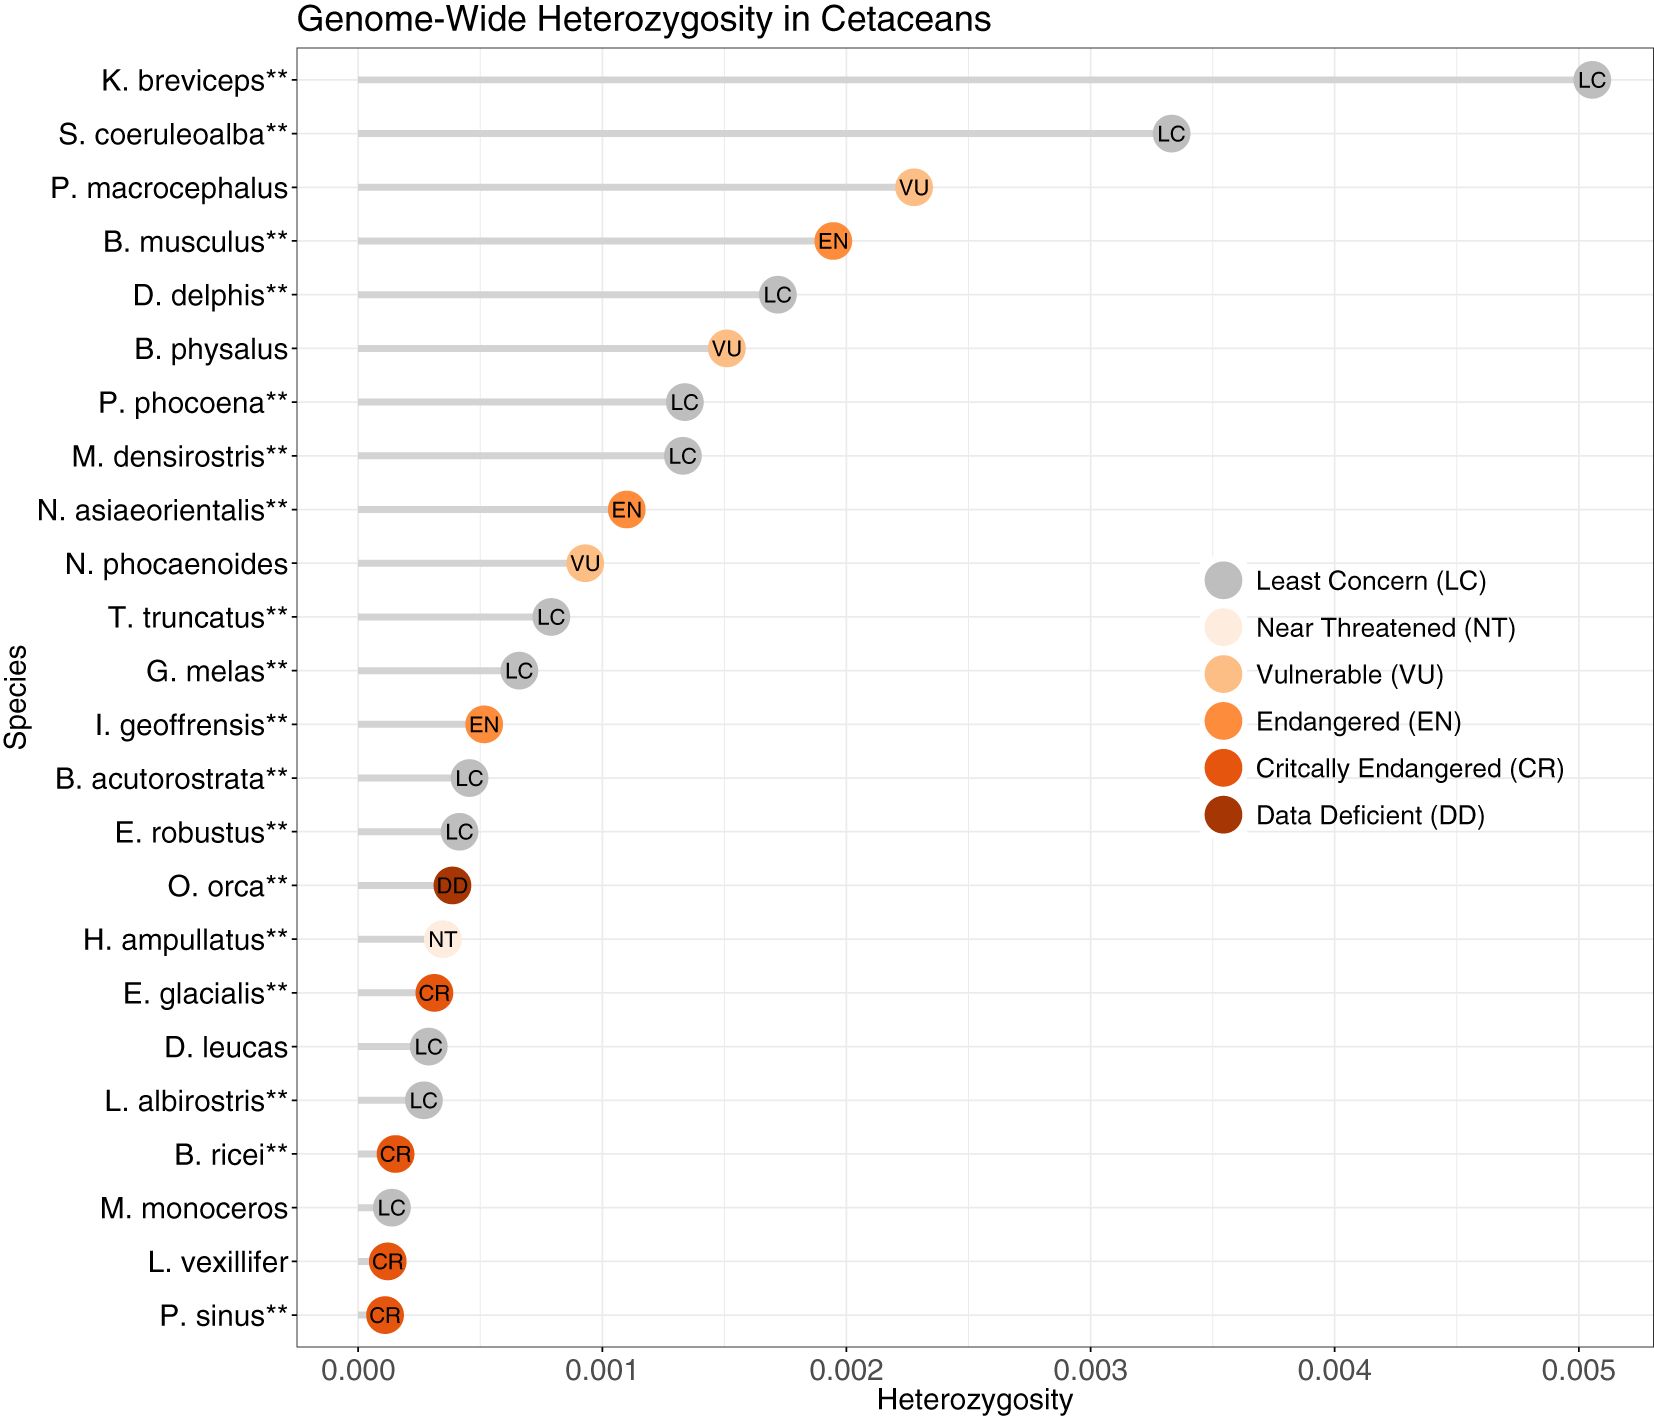
Figure 5. Genome-wide heterozygosity (variants/bp) in cetaceans based on non-overlapping 1Mb windows, from reads mapped to the reference genome followed by removal of repeats. **Reference genome species. IUCN Red List status as of April 2023 (www.iucnredlist.org).
We defined runs of homozygosity (ROH) as stretches in the genome displaying lower-than-expected heterozygosity. We calculated the genome-wide heterozygosity inside and outside our set of ROH and observed that, as expected, ROH were more depleted for heterozygous sites (mean: 1.00 sites/10 kb (range 0.00 – 6.28)) than the surrounding regions (mean: 10.53 sites/10 kb (range 0.75-56)) (Supplementary Table S6). Despite this trend, we did not observe a significant correlation between the genome-wide heterozygosity and the fraction of the genome covered by ROH (r = -0.37, p = 0.13) (Figure 6A).
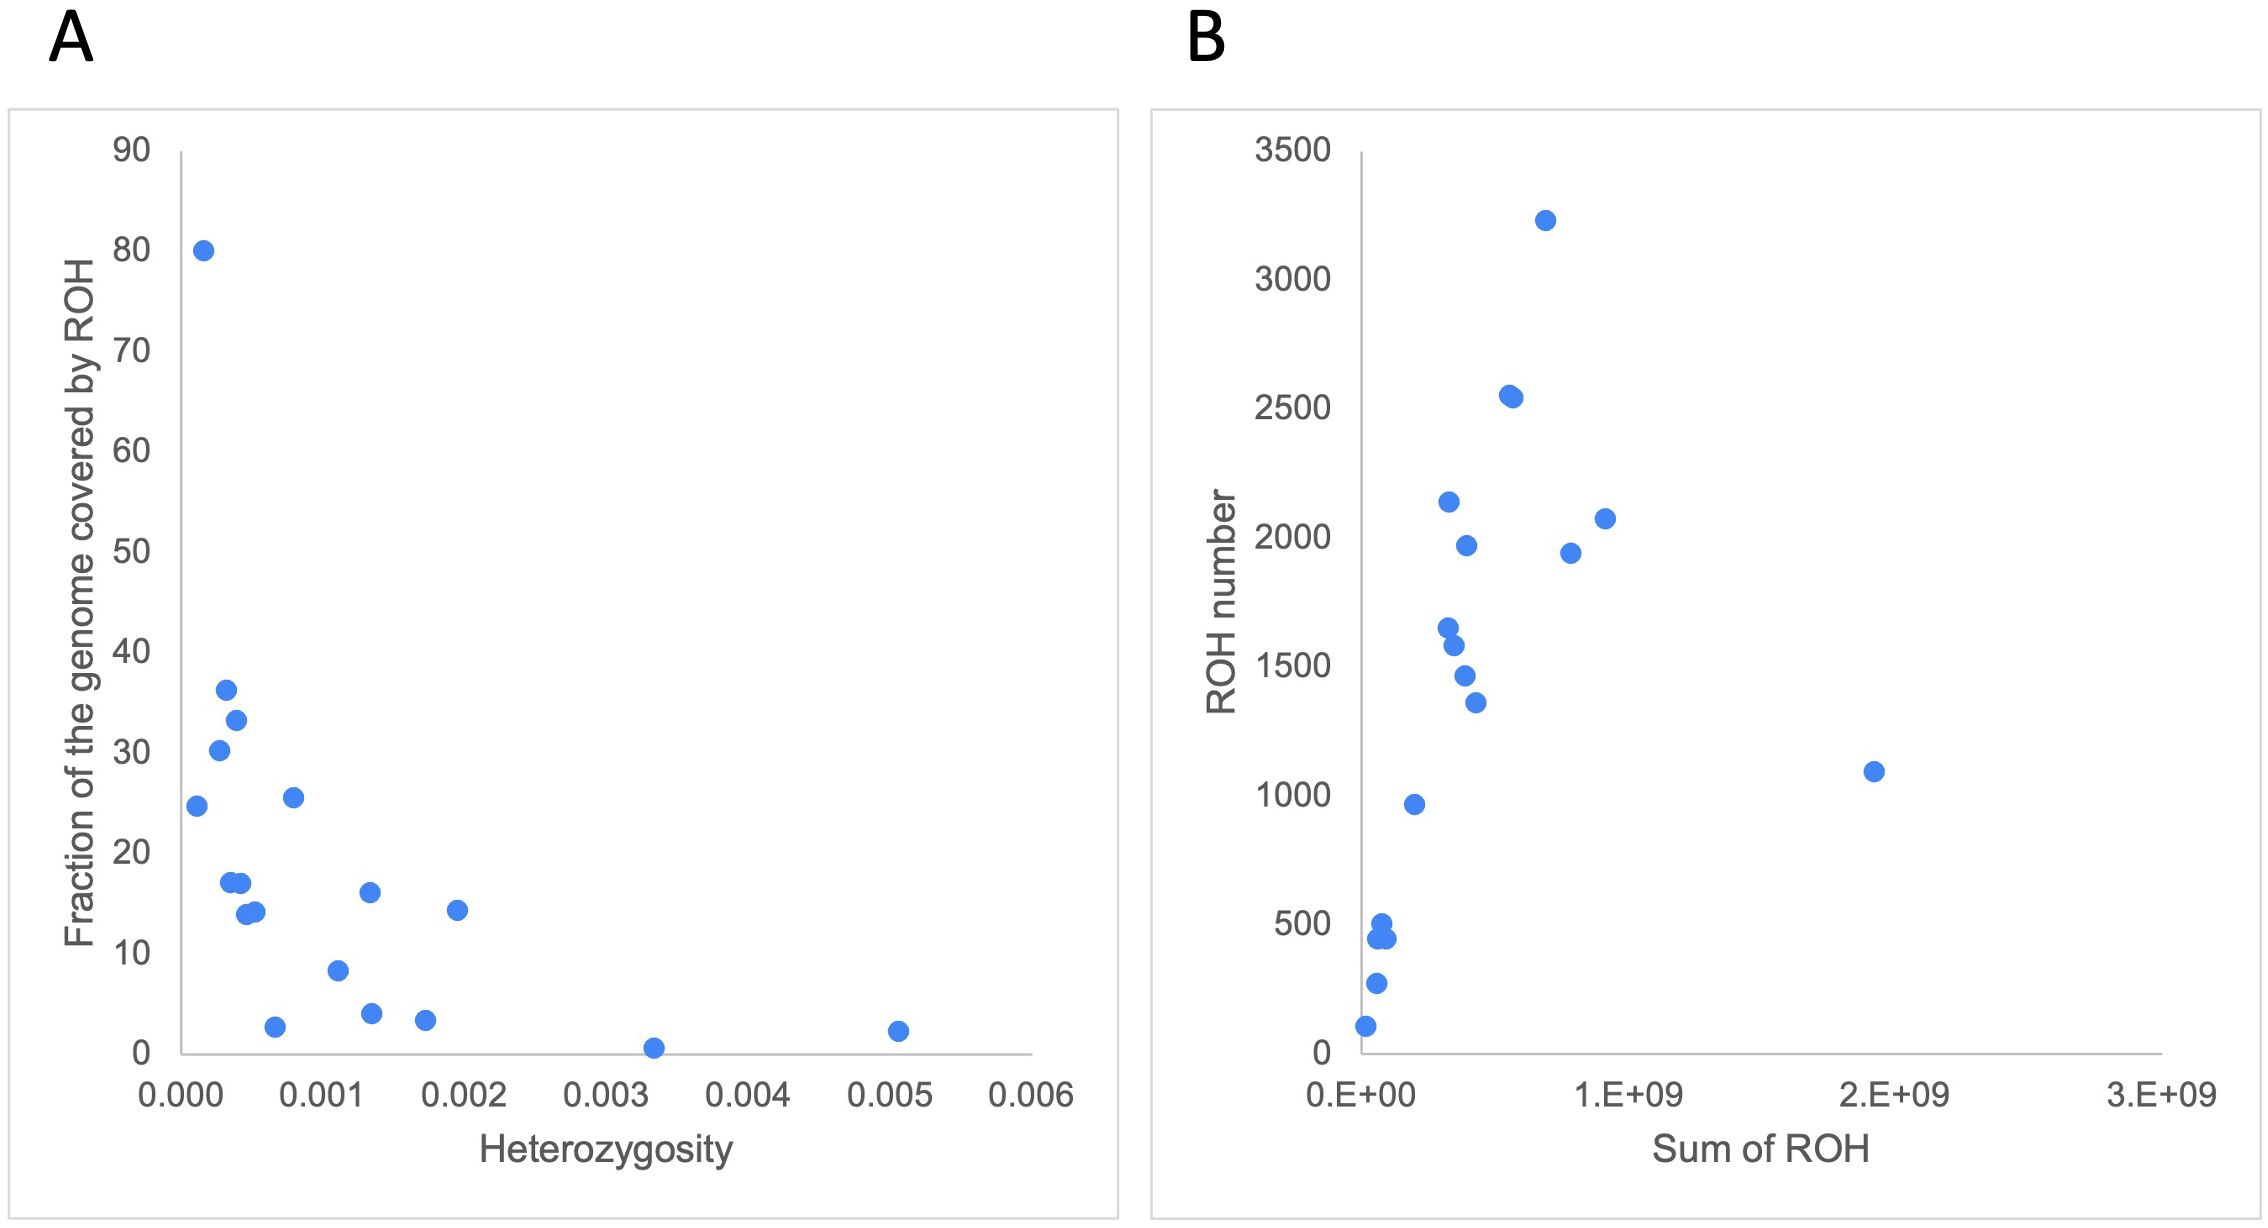
Figure 6. (A) Correlation between genome-wide heterozygosity (variants/bp, from 100Mb non-overlapping windows) and fraction of the genome covered by ROH (in %). (B) correlation between the sum of ROH lengths (in bp) and ROH number.
The mean number of ROH larger than 100 kb was 1,465 (range 109 – 3,230) and these covered, on average, 19.16% of the cetacean genomes (range 0.63% - 80.08%) (Supplementary Table S6). The white-beaked dolphin (Lagenorhychus albirostris) had the highest number of ROH (n = 3,230), which covered 30.29% of its genome, followed by the vaquita (Phocoena sinus) (n = 2,554; 24.78% of its genome). The species with the highest fraction of the genome covered by ROH was the Rice’s whale (80.08%), though its total number was below the average (n = 1,095), as might be expected when the mean length of ROH gets very large. When Rice’s whale is removed as an outlier species, the number of ROH highly correlated with the sum of ROH lengths (r = 0.84, p = 2.87x10⁻⁵, Figure 6B). This correlation reflects the population demography in most cetacean species included in this study (Ceballos et al., 2018). Both the vaquita and Rice’s whale are critically endangered.
The distribution of the number and sizes of ROH differed among species (Figure 7, Supplementary Table S7). Overall, ROH <1 Mb were the most abundant class. In most species, ROH >1 Mb were also present, as represented by larger contiguous blocks (Figure 7). For six species we were also able to identify ROH >5 Mb, with the largest number reported for the Rice’s whale (n = 109), followed by the North Atlantic right whale (n = 30) (Supplementary Table S7).
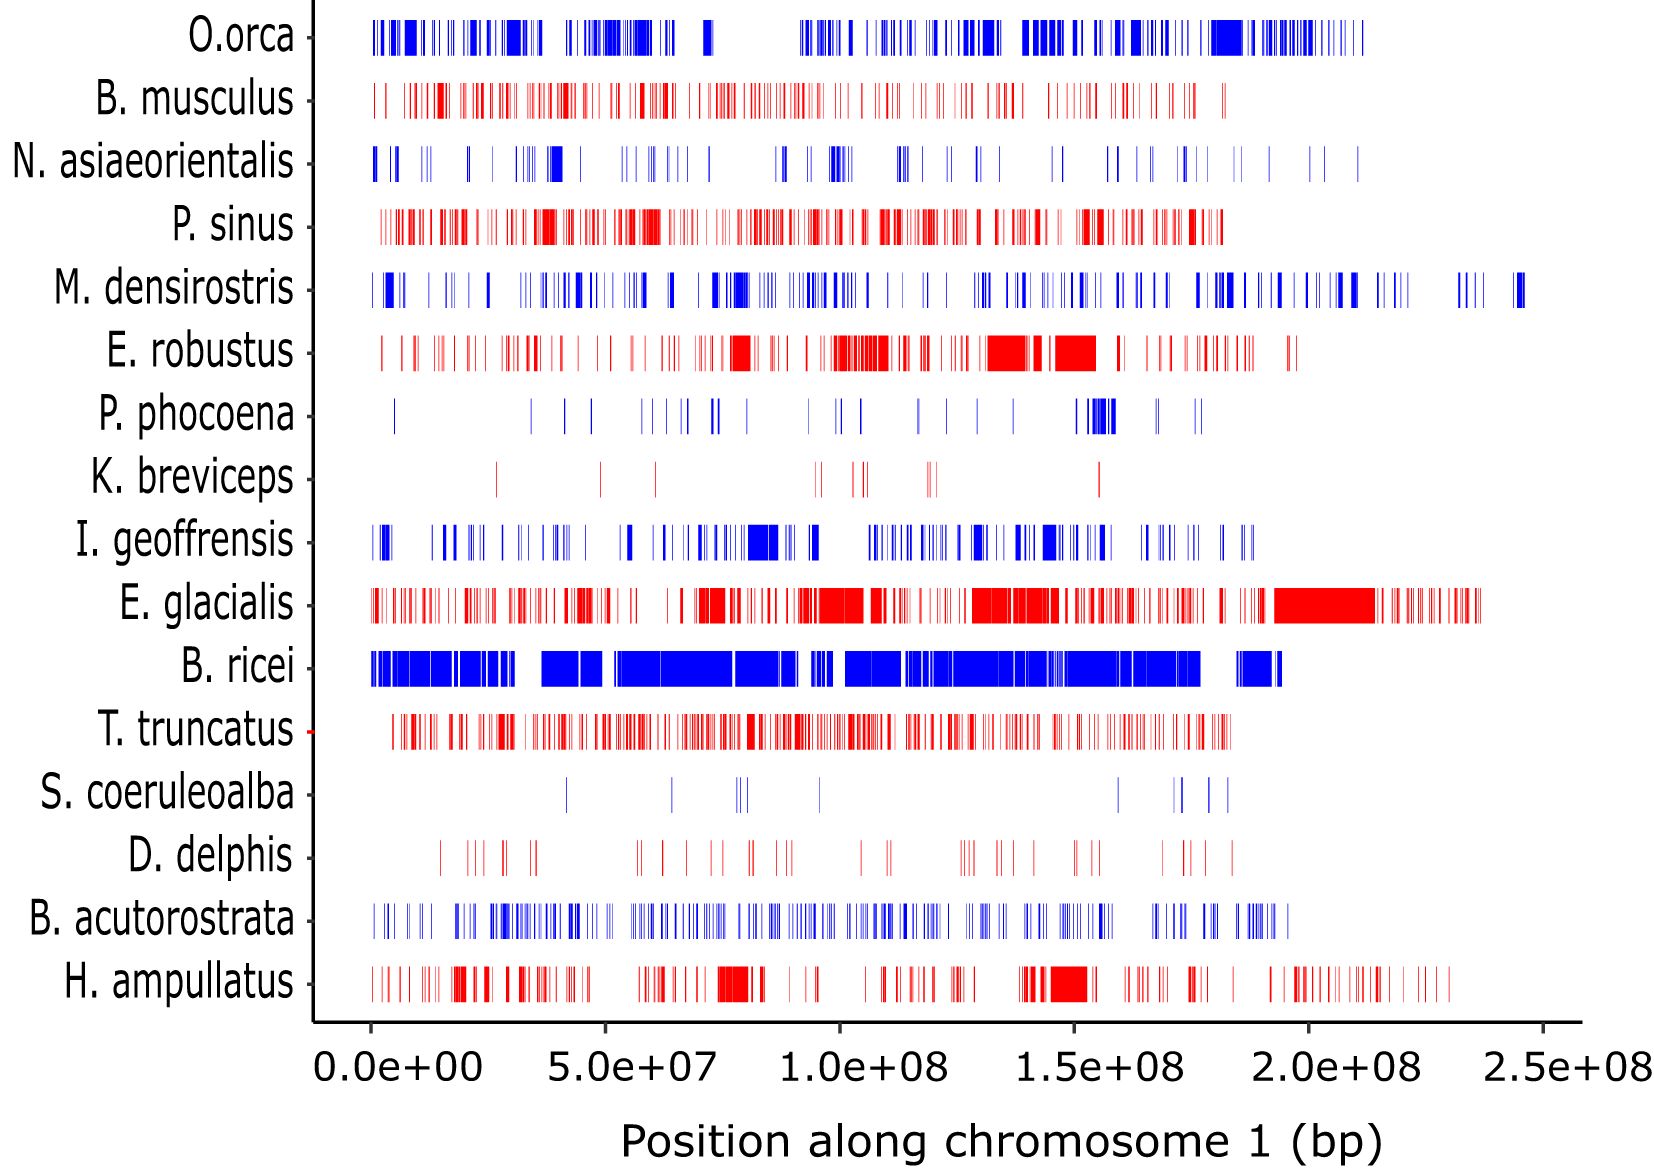
Figure 7. Distribution of ROH longer than 100 kb along chromosome 1 in the 18 cetacean species. Species are ordered by phylogenetic relationship according to the mitochondrial based tree in Figure 1.
Among the cetacean species and families represented here, historical demographic patterns (Supplementary Figure S7) fell into two general patterns (Figure 8). A diverse group of small odontocetes (Figure 8A) had very large inferred historical population sizes (Ne>10,000), while the remaining odontocetes (Figure 8B) and mysticetes (Figure 8C) were inferred to have had consistently smaller population sizes (Ne <10,000), especially leading up to the last glacial maximum (LGM). The only exception to the pattern for mysticetes is the critically endangered Rice’s whale (B. ricei), which presented a large inferred effective population size estimate from approximately 1 Myr to 300 kyr ago, prior to a rapid decline and small Ne leading into the LGM.
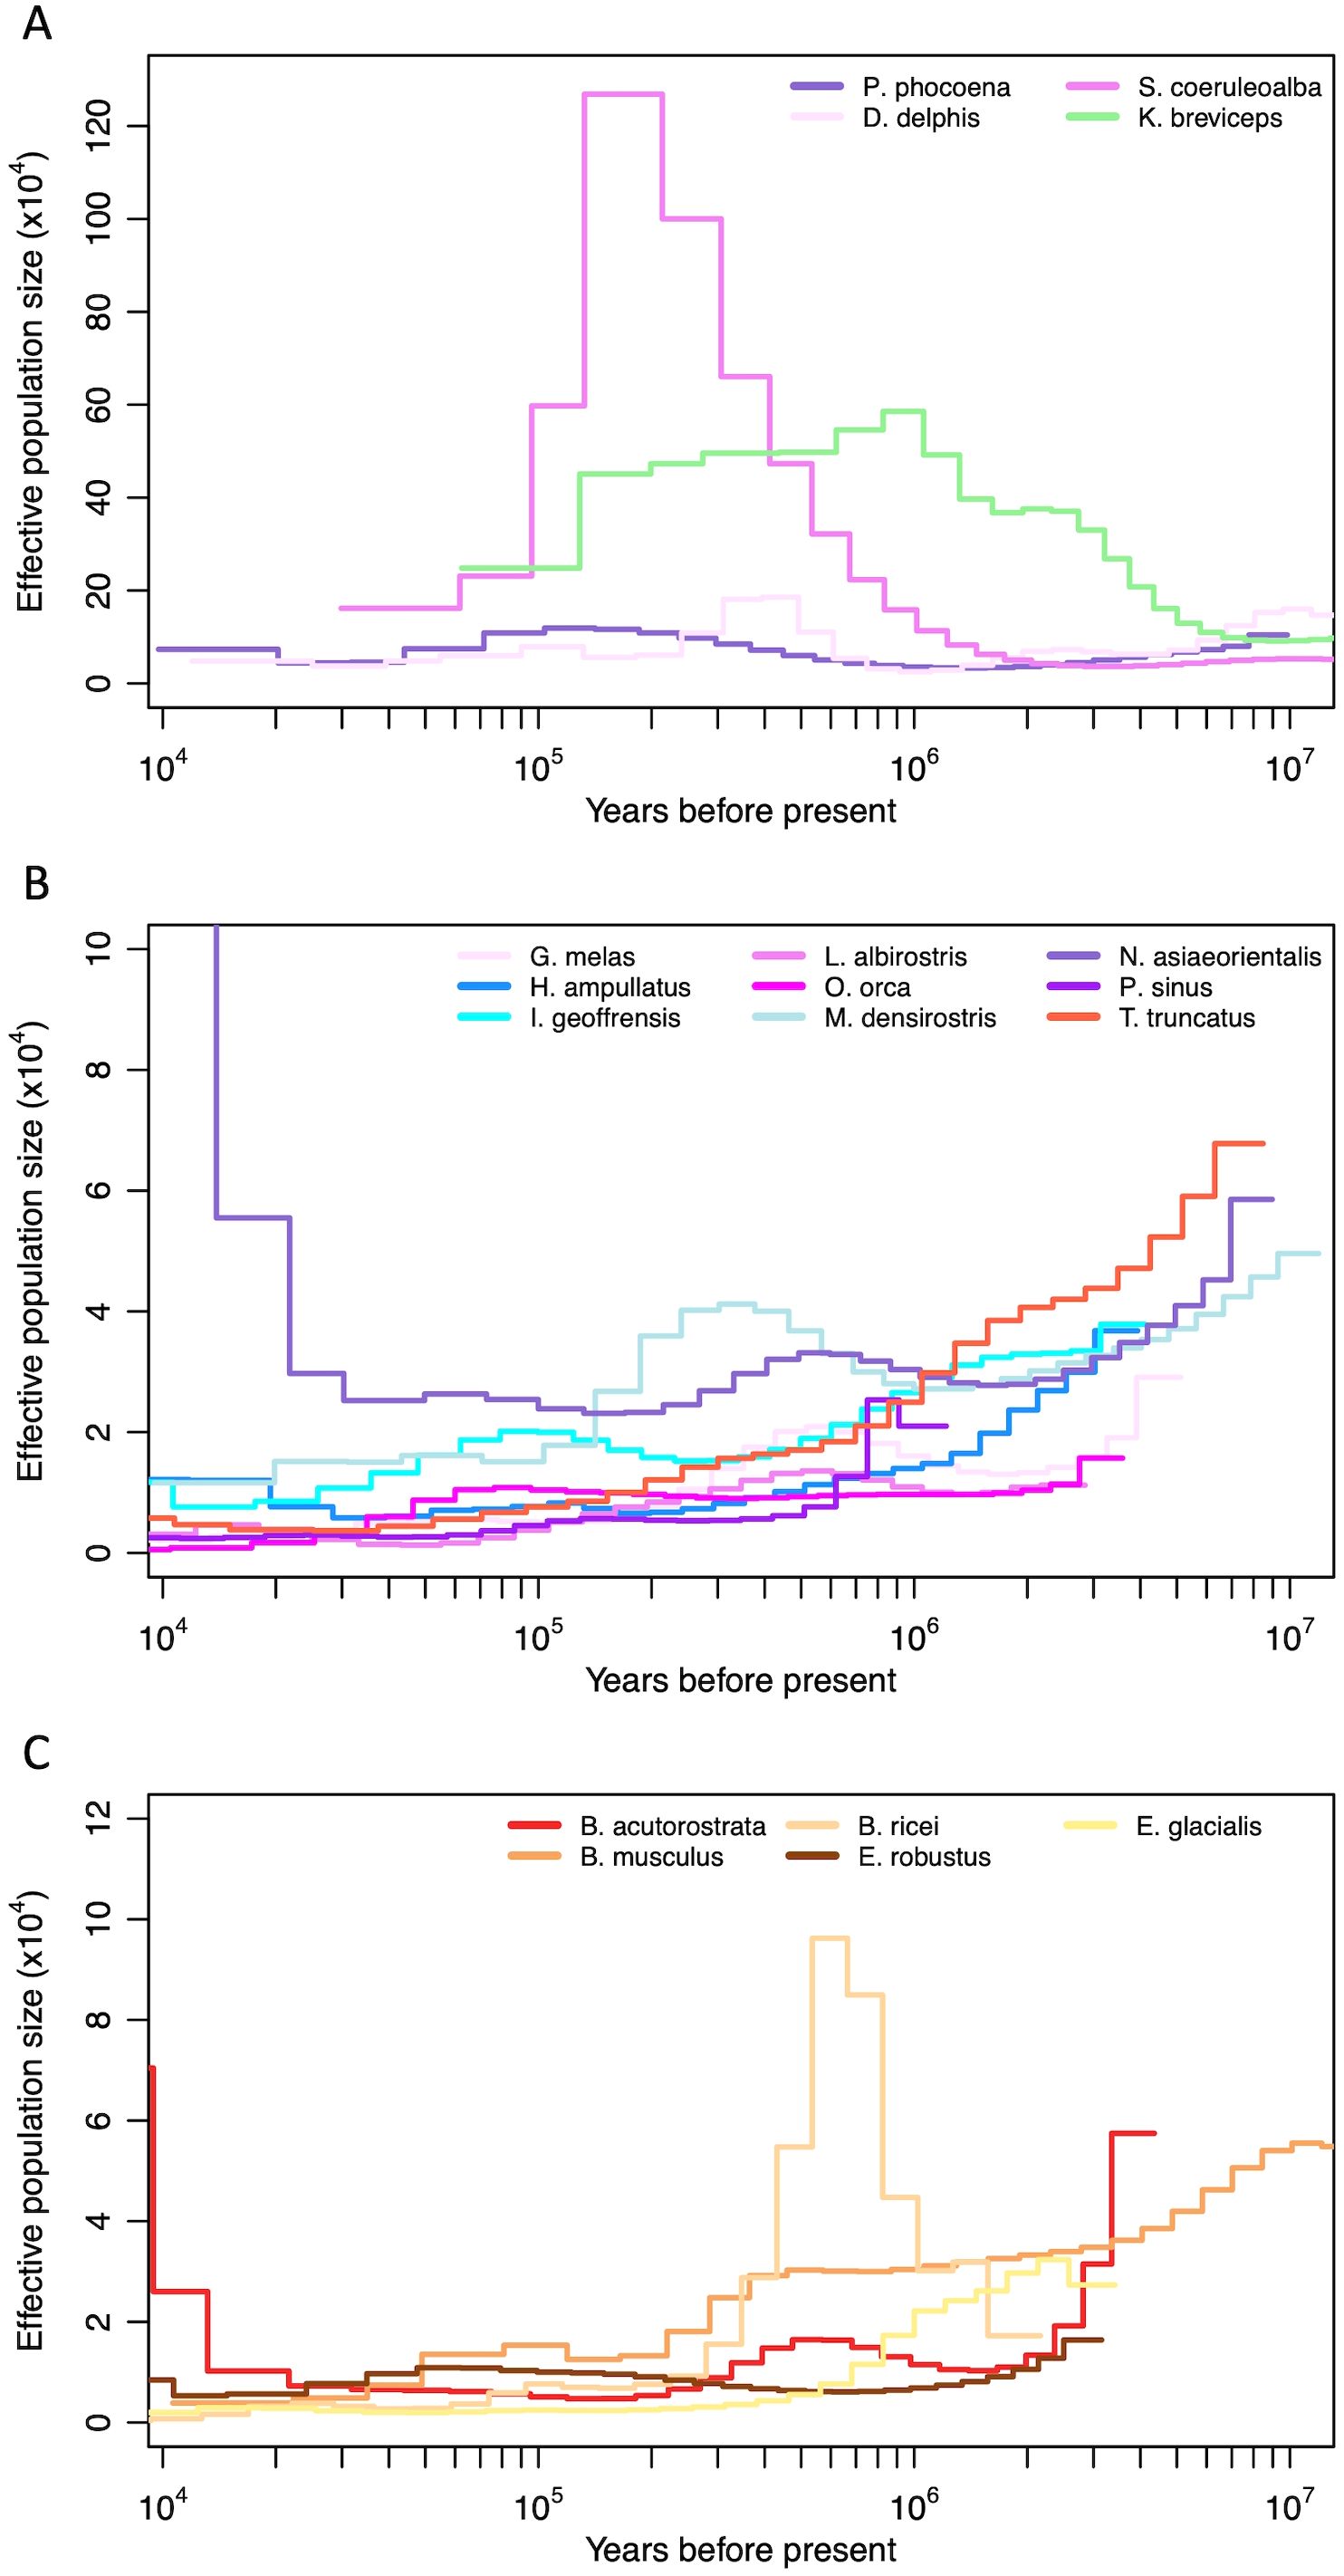
Figure 8. Historical effective population size estimates (Ne) of odontocetes with (A) large (>10k) and (B) small (<10k) historical population sizes, and (C) mysticetes, based on the pairwise sequential Markovian coalescent (PSMC), with a mutation rate of 4.9E-10 substitutions/site/year (adjusted for individual generation times) (see methods). The x axis (years) is on a logarithmic scale.
3.6 Major histocompatibility complex content and organization
Comparison of eight cetacean species with MHC regions sourced from both draft and reference genomes showed improved gene region characteristics in the latter assemblies. Specifically, framework genes were more likely to be present, the MHC region was longer and we were more likely to identify genes and gene copy number variation in the reference genomes relative to the draft assemblies (Supplementary Table S8). These factors are related; increase in length is mainly due to the identification of a higher number of MHC class I and IIa (DRB-like) genes. For example, in the draft assemblies the MHC class I ĸ block contained none or at a maximum one class I gene, whereas the reference assemblies have between one and three class I genes (Figure 9). Importantly, these changes were identified in different quality assemblies derived from the same individuals for two species (Balaenoptera ricei and Eubalaena glacialis; Supplementary Figure S8). In the case of the E. glacialis, specific improvements in the reference genome included the presence of the framework gene ABCF1, a structural re-arrangement that reversed the direction of one class I gene in the ĸ block, and the addition of two class I genes in the ĸ block, one in the β block and an additional DRB-like gene in the class IIa region.
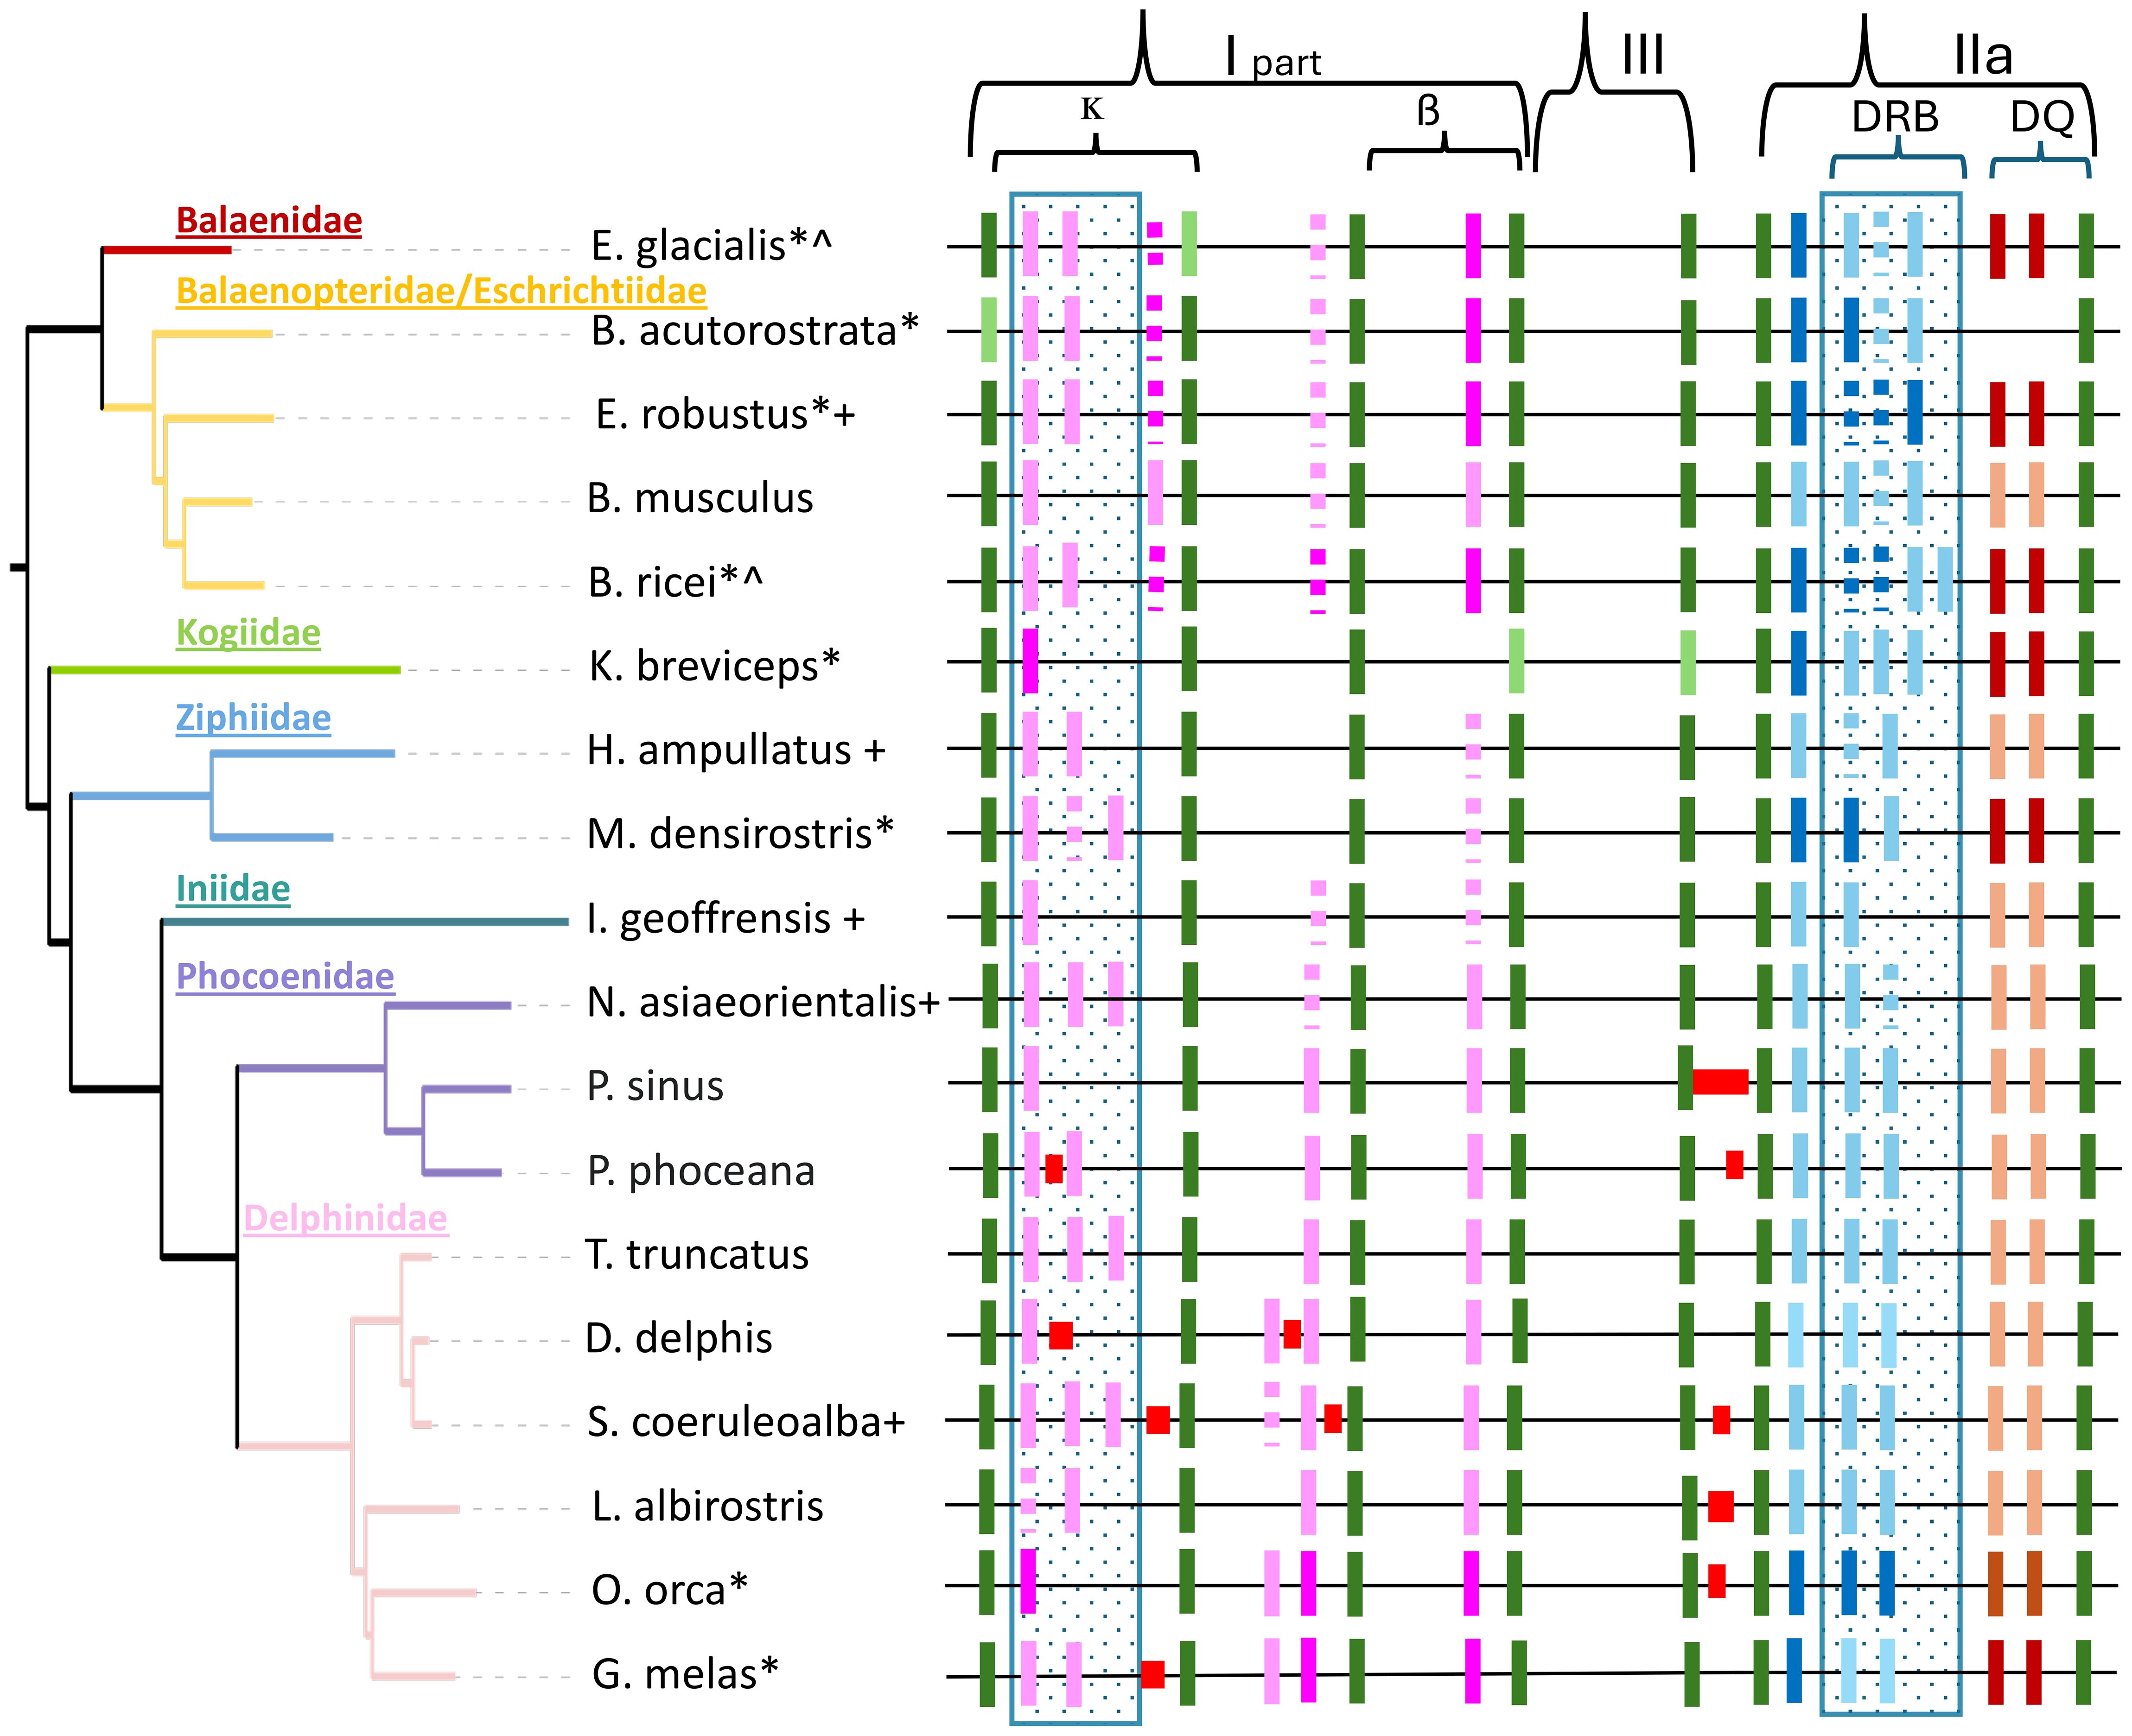
Figure 9. A cetacean phylogenetic tree (identical to that in Figure 1A) alongside the orthologous MHC region. The MHC class I is depicted without the α block. From left to right, the κ block is positioned between the framework genes (green) TRIM26 (tripartite motif containing 26) and ABCF1 (ATP‐binding cassette subfamily F member 1). The β block is found between TCF19 (transcription factor 19) and DXX39B (DExD-box helicase 39B), while class III lies between DXX39B and NOTCH4 (Notch receptor 4). The class IIa region encompasses BTNL2 (butyrophilin like 2) and ELOVL5 (ELOVL fatty acid elongase 5). Annotated MHC genes included in genome assemblies are indicated by pink (class I: BoLA-like), blue (DR), and brown (DQ) rectangles. Assembly gaps are represented by red rectangles, and presumed pseudogenes are marked as dotted lines. An asterisk (*) highlights the species for which short-read draft assemblies were utilized to characterize the MHC region in Heimeier et al. (2024), where only the darker colored genes were identified. Draft and reference assemblies derived from the same animal are denoted with a caret (^). A plus (+) signifies a non-annotated genome, with gene annotations transferred from a closely related species after aligning MHC regions. A blue dotted box indicates areas that are likely to exhibit variable gene numbers within species. The MHC regions are idealized for clarity and do not maintain uniform length. They do not reflect an alignment and are not drawn to scale.
The similarity of the MHC region across all 18 reference assemblies is apparent (Figure 9). Representative framework genes are found in the expected order defining class I (ĸ and β block), class III, and class IIa regions of all assemblies. The κ block is the most variable in length and gene content across all species (Figure 9; Supplementary Table S8) and within families. The largest size differences between assemblies are found within the class III region between NOTCH4 and BTNL2 genes (66 to 2,041bp), whereas the rest of class III is remarkably conserved across all cetaceans. The class IIa region is also conserved across all species (Figure 9), but significant differences were observed between odontocetes and mysticetes. Odontocetes have a smaller class IIa region (296-327kb) with two presumed functional DRB genes for 9 out of 13 species, while in mysticetes the class IIa region is larger (353-397kb). This size increase is directly linked to an additional DRB-like gene in all species, although not all are assumed to be functional, and B. ricei has a fourth DRB-like gene. B. acutorostrata is similar in size of the class IIa region to other baleen whales despite missing DQA and DQB genes (the only cetacean species so far missing these genes), as previously identified by earlier genome and amplicon-based studies (Sá et al., 2019; Heimeier et al., 2024).
3.7 IGF1 single nucleotide variants associated with body size
The nearly doubling of annotated cetacean genomes since the initial study by Bukhman et al. (2024), from eleven to 20, has resulted in all but two of the Type 1 sites being invalidated, with some of the newly sequenced species having different nucleotides than would be expected from the previously reported trend (Supplementary Tables S9, S10, Supplementary Figure S9). In contrast, most of the Type 2 sites were corroborated by the expanded genome data, where baleen, sperm, beaked, and killer whales have the ancestral variant, while the other dolphins and porpoises, as well as the beluga and the narwhal, have the alternative variant (Supplementary Tables S9, S10, Supplementary Figure S10). Interestingly, one medium-sized species, the pygmy sperm whale (Kogia breviceps), is phylogenetically most closely related to the largest odontocete, the sperm whale (Physeter macrocephalus), and retains the ancestral alleles associated with the larger sized species.
4 Discussion
We analyze and compare a set of reference genome assemblies for 18 cetacean species from eight families that include 91% of the 94 recognized species of cetaceans. These reference genomes represent a milestone in creating a cetacean genomic infrastructure for research and conservation, accomplishing four primary goals. First, by focusing on obtaining representative genomes from diverse families and genera across the cetacean phylogeny, we have attempted to maximize representation of genomic diversity, including species from the smallest (vaquita) to the largest (blue whale), deep diving (beaked whales), fresh water (Amazon River dolphin), coastal (harbor porpoise, east Asian finless porpoise) and pelagic (several, e.g., minke, blue, and pilot whales, striped dolphin), isolated (vaquita) and globally distributed (killer whale), critically endangered (vaquita, Rice’s whale, North Atlantic right whale) and abundant (several, e.g., white-beaked, striped and bottlenose dolphins). Second, by targeting “platinum” quality reference assemblies based on long-read sequences and chromatin structure mapping with (when possible) transcriptome-based genome annotation, we ensure the best-available genome quality, with chromosome-resolved, nearly gapless assemblies that have become the standard for large genome consortia such as the VGP and DToL project. Third, we illustrate the specific benefits of reference-quality genomes compared to previously available draft assemblies, including significant improvements in gene annotation, resolution of repetitive elements, and characterization of complex gene regions such as the MHC. We also reconstruct ancestral linkage groups to investigate chromosome evolution. Finally, we use individual genomes to evaluate population and evolutionary history that are relevant to conservation.
The ancestral linkage group reconstruction together with extant chromosome painting shows that the overall genomic organization of the Cetacea is remarkably conserved, consistent with karyotype analysis (Arnason et al., 1977; Pause et al., 2006). The independent fusion of the same two ancestral ALGs in two independent families (Figure 1) is remarkable, and warrants further studies to identify if the sequence composition and structure of these ancient ALGs might make them more prone to fuse.
Apart from the fusions in Balaenidae, Kogiidae, and Ziphiidae, the highly conserved karyotypes of cetaceans are in contrast to some other well-characterized mammalian species lineages exhibiting extensive karyotypic rearrangements, such as rodents (Romanenko et al., 2012), gibbons (Carbone et al., 2014), macropod marsupials (Deakin, 2018), and muntjac deer species (Yin et al., 2021). Detailed analysis of chromosomal organization and gene structure among species is facilitated by pairwise analysis in the NBCI Comparative Genome Viewer (https://www.ncbi.nlm.nih.gov/cgv/), in which many of the pairwise alignments have been stored and can be interactively searched.
Some regions of the genome are, however, highly variable, and have been historically difficult to resolve. Repetitive elements, which have been implicated in rapid evolution and adaptive divergence (Serrato-CapuChina and Matute, 2018; Schrader and Schmitz, 2019) were particularly difficult to resolve prior to application of long-read sequencing and assembly methods (Vollger et al., 2019). The cetacean genomes typically contain ~50% repetitive DNA, with L1 being the most abundant repeat class, as is common for placental mammals (Boissinot and Sookdeo, 2016). Comparison of draft and reference assemblies demonstrates that not only are many repeat regions dramatically expanded in the new cetacean assemblies, but the element types and timing of expansion varies among lineages.
As a specific example of how repetitive and highly polymorphic regions in these assemblies are significantly improved, we show that these new reference assemblies generated from long-reads improve the completeness and accuracy of the MHC gene region. The improvements are defined by a higher genomic synteny, identification of representative framework genes that were not found in three of the previously available short-read assemblies, and higher numbers of MHC genes and gene copy number variation (specifically class I and DRB-like). Our analyses also identified erroneous large translocations in the initially released reference genome assemblies of two species, D. delphis and G. melas, that split the MHC region between the class III and class IIa regions, placing them at opposite ends of the chromosome. The assemblies were subsequently revised, resulting in improved synteny and consistent organization of the MHC region across the Cetacea.
Additional support that reference assemblies have improved the MHC region comes from amplicon data (Heimeier et al., 2024). In the long-finned pilot whale (G. melas), for example, a complete DRB-like gene was missing in the draft assembly, but DRB exon2 was PCR amplified from genomic DNA (Heimeier et al., 2024), suggesting DRB is present in long-finned pilot whale. This has now been confirmed in the reference assembly, demonstrating not only improvement in recovering framework genes, but also more accurately resolving the presence and copy number variation of genes at these immune system loci.
The MHC organization across cetacean species appears more conserved compared to human and non-human primate species, which share their most distant common ancestor approximately 37–52 million years ago (Heijmans et al., 2020), similar to odontocetes and mysticetes. The results suggest that in cetaceans, haplotypes with variable number of class I genes (between one and three) in the ĸ block might exist across most if not all cetacean species and likely serve as the peptide-presenting or classical class I genes. In contrast, non-human primates show more variability: Old World monkeys have an expanded MHC class I region, great apes typically have three class I genes similar to humans, and New World monkeys like the common marmoset either lack these genes or have non-functional versions. In this species, genes orthologous to human non-classical genes have expanded and assumed the classical peptide-presenting function (Heijmans et al., 2020). However, further characterization of the MHC region from more than one individual of a species is needed to confirm these results.
We were able to highlight a few assemblies that likely need further improvements. In five assemblies of Delphinidae and Phocoenidae species the length of class III is either greatly expanded or inflated. Specifically, these increases in sequence length are located between two genes that are at the end of class III (NOTCH4) and beginning of class IIa (BTNL2). These two genes that are located in close physical proximity to each other in the human MHC region (HLA) and all other cetacean MHC (~200kb). Interestingly, the five expanded regions each contain an assembly gap, no annotations and a “flatlined” average GC content (Supplementary Figure S11), potentially representing low complexity satellite sequence. Future research on MHC structure and function will be enabled by the expanded availability of cetacean reference genomes. The close similarity and variability of MHC loci, especially class I, makes it challenging to identify locus-specific alleles. A targeted-amplicon approach, however, needs reference genomes to be effective. Furthermore, analyzing MHC gene expansion and copy number variation with associated RNA data can be used to validate functional loci and variants and can help to understand functional diversification within the MHC.
Some cetaceans are notable for their giant body sizes, with the blue whale being the world’s largest animal species. Additionally, cetaceans have a wide range of body sizes, with approximately three-thousand-fold difference in body mass between the blue whale and the smallest cetacean, the vaquita. Giant animals tend to be long-lived and resistant to cancer (Caulin and Maley, 2011; Tollis et al., 2017). Studies of such species as elephants and whales promise to shed light on important mechanisms of mammalian development and tumor suppression (Keane et al., 2015; Sulak et al., 2016; Tollis et al., 2019). We have expanded on previous analysis of a single gene, IGF1, whose role in regulating growth and body size had been established in humans, mice, and canines (OMIM.org, Ostrander et al., 2017; Plassais et al., 2022). For gene-based studies, annotated genomes are critical. Previous analysis of the IGF1 locus in cetaceans classified single nucleotide variants (SNVs) associated with body size into two types (Bukhman et al., 2024). Type 1 SNV sites had a different allele in large whales (blue, minke, and sperm whales) from small cetaceans and all other artiodactyls. Type 2 SNV sites were identified based on a different allele in large whales (blue, minke, sperm, and killer whales) compared to small cetaceans, but the alleles in the large whales are shared by all terrestrial artiodactyls. We previously hypothesized that the large whales had the ancestral variant, most of the toothed whales evolved a different variant, while the killer whale, having evolved to a giant size, reverted to the ancestral variant again (Bukhman et al., 2024). Nearly doubling the number of annotated genomes has resulted in rejection of one association (type 1), and stronger support for another (type 2). The sequence changes that correlate with body size in canines and, potentially, cetaceans appear in non-coding regions of the gene, possibly affecting its expression in various tissues and developmental stages, rather than the properties of its protein product. Annotated platinum-quality, long-read-based genome assemblies facilitate such research by providing more complete gene models compared to short-read-based genomes (Rhie et al., 2021).
Rigorous validation and functional characterization of genetic variants in cetaceans is challenging. These large, free living marine species are generally impossible to breed or genetically engineer, while GWAS studies on adequate scales are impractical both due to the lack of resources and access to sufficiently large sample sizes. Some gene expression (in tissues other than skin or blood), epigenomic, and pedigree genetics studies may be possible on a very limited scale using the few individuals that are maintained in captivity. However, cross-species genome comparisons are still feasible and can provide valuable insights, as has been demonstrated in primates and other groups (Smith et al., 2020; Shao et al., 2023; Rivas-González and Tung, 2024; Yoo et al., 2025). Additionally, non-coding variants can be cross-referenced to databases of regulatory elements identified in humans and model organisms (Andrews et al., 2023). The efforts to ultimately sequence all cetacean species, as well as multiple individuals of the same species (Morin et al., 2020; Jossey et al., 2024), will further increase the statistical power of such analyses, as illustrated by our follow-up investigation of the previously hypothesized associations of the IGF1 locus with body size. Although direct validation of functional significance of genomic variants in cetaceans may not be possible, their location in loci conserved across artiodactyls and beyond will undoubtedly contribute to our understanding of mammalian development in general and may one day prompt follow up experimentation in more accessible species.
Historical demography is increasingly recognized for its role in evolutionary and demographic resilience. We used the PSMC to infer historical demographic patterns from single genomes, which can be important for understanding present day levels of heterozygosity and mutational load (Robinson et al., 2018; Morin et al., 2021a; Robinson et al., 2022). The pattern of inferred effective population size (Ne) through time is subject to assumptions that may be violated to different degrees in different species, but comparison among species has been used to infer broad differences in response to climate change and ecological divergence (Arnason et al., 2018; Morin et al., 2018; Foote et al., 2021b). Higher levels of genomic diversity and heterozygosity are recognized as important for evolutionary resilience, but they come along with higher mutational load that can be deleterious to declining populations as they undergo increasing inbreeding (Robinson et al., 2018, 2019, 2022). Additionally, the limited correlation between heterozygosity and the inbreeding coefficient suggests that in cetacean species, heterozygosity alone is an insufficient indicator to prioritize species for conservation (Robinson et al., 2018, 2022; Wolf et al., 2022). Whole genome sequence data allow assessment of extinction risk and recovery potential through combined analyses of genomic, demographic, and environmental threats (Robinson et al., 2022; van Oosterhout et al., 2022; Kardos et al., 2023). While inferring demographic patterns from single genomes for these species is a useful first step, it should be noted that, especially for widely distributed species, the inferred demographic history may only represent a population, ecotype or subspecies, not the species as a whole (Foote et al., 2021b). The anomalously large Ne estimate for Rice’s whale prior to decline to very small Ne in the late Pleistocene, combined with genome-wide patterns of interspersed high- and low-heterozygosity regions (Supplementary Figure S5) is possibly due to a period (or periods) of introgression in the past. Additional analyses at the population and interspecific levels are required to infer when or from which population or species introgression occurred.
Our analysis of the new cetacean reference genomes illustrates some of the uses and applications for cetacean research and conservation. Reference genomes form the basis for population and taxonomic studies (e.g., SNP discovery, resequencing). The reference genomes also represent resources for research in genome assemblies, genome alignments, raw sequence data, transcriptomic data, and genome annotations (NCBI GenBank, the European Nucleotide Archive (ENA)). For this set of cetacean reference genomes, we have provided biallelic single nucleotide polymorphisms (SNPs in variant call format (VCF) files (Supplementary Table S11), and pairwise alignments of a subset of genomes used to generate the multiple genome alignment (Supplementary Table S1). While the SNP sets represent the genetic variation from only one individual, they can be used to design SNP assays for population studies, and the reference genomes are important for population studies based on resequencing. New reference genomes continue to be generated and made available through a variety of public databases, including NCBI, ENA, and the Chinese Science Data Bank (SCIDB). Ongoing progress in data production for the species of interest to the Cetacean Genomes Project is available on the CGP Genomes on a Tree web page (GoaT; Challis et al., 2023. https://goat.genomehubs.org/projects/CGP).
Data availability statement
The datasets presented in this study can be found in online repositories. The names of the repository/repositories and accession number(s) can be found in the article/Supplementary Material.
Ethics statement
Ethical approval was not required for the study involving animals in accordance with the local legislation and institutional requirements because samples were obtained from existing collections and/or under collection permits held by the sampling organizations.
Author contributions
PM: Conceptualization, Data curation, Formal analysis, Funding acquisition, Investigation, Methodology, Project administration, Writing – original draft, Writing – review & editing. BB: Writing – review & editing, Formal analysis, Writing – original draft. CB: Writing – review & editing, Writing – original draft, Formal analysis. YB: Writing – review & editing, Writing – original draft, Formal analysis. TH: Writing – original draft, Writing – review & editing, Formal analysis. DH: Writing – original draft, Writing – review & editing, Formal analysis. MU-S: Writing – original draft, Writing – review & editing, Formal analysis. DA: Writing – review & editing, Formal analysis. LA: Writing – review & editing, Formal analysis. JA: Writing – review & editing, Formal analysis. JB: Writing – review & editing, Project administration. RB: Writing – review & editing, Resources. NB: Writing – review & editing, Formal analysis. AB: Writing – review & editing, Resources. EC: Writing – review & editing, Conceptualization, Supervision. MC: Writing – review & editing, Formal analysis, Project administration. JC: Writing – review & editing, Formal analysis. ND: Writing – review & editing, Resources. AD: Writing – review & editing, Formal analysis. OF: Writing – review & editing, Project administration, Supervision. GF: Supervision, Writing – review & editing, Methodology. AF: Writing – review & editing, Conceptualization. GG: Writing – review & editing, Formal analysis. CG: Formal analysis, Writing – review & editing. MLH: Writing – review & editing, Resources. CH: Writing – review & editing, Formal analysis. JJ: Writing – review & editing, Resources. NJ: Writing – review & editing, Formal analysis. KK: Formal analysis, Writing – review & editing. BMM: Formal analysis, Writing – review & editing, Investigation. BFM: Formal analysis, Writing – review & editing. TM: Formal analysis, Writing – review & editing. SAM: Formal analysis, Writing – review & editing. MM: Writing – review & editing, Conceptualization. SM: Writing – review & editing, Resources. JM: Writing – review & editing, Project administration. BN: Writing – review & editing, Conceptualization, Resources. BO: Writing – review & editing, Formal analysis. SP: Formal analysis, Writing – review & editing. PR: Writing – review & editing, Funding acquisition, Resources. TR: Resources, Writing – review & editing. OR: Writing – review & editing, Conceptualization, Funding acquisition. TS: Writing – review & editing, Formal analysis, Investigation. YS: Formal analysis, Writing – review & editing. JS: Writing – review & editing, Resources. RS: Writing – review & editing, Supervision. KT: Writing – review & editing, Resources. TT: Writing – review & editing, Formal analysis. CW: Writing – review & editing, Formal analysis. JW: Formal analysis, Writing – review & editing. MH: Writing – review & editing, Conceptualization, Funding acquisition, Project administration, Resources, Supervision. MB: Project administration, Resources, Writing – review & editing. EJ: Project administration, Resources, Writing – review & editing, Conceptualization, Data curation, Funding acquisition.
Funding
The author(s) declare that financial support was received for the research and/or publication of this article. This work was supported by grants from the NOAA National Oceanographic Partnership Program Committee and NOAA SWFSC Marine Mammal and Turtle Division, and from the Revive & Restore Catalyst Fund (to PM, OR, EJ); the Howard Hughes Medical Institute (to EJ); The Vertebrate Genomes Project; Darwin Tree of Life; Leibniz Association’s Competition Procedure (K419/2021); The LOEWE-Centre for Translational Biodiversity Genomics (TBG) funded by the Hessen State Ministry of Higher Education, Research and the Arts (LOEWE/1/10/519/03/03.001(0014)/52); the NOAA Marine Mammal and Turtle Division, Southeast Fisheries Science Center and NOAA NMFS Office of Protected Resources (to PR) funded sequencing of the Rice’s whale genome, in collaboration with the VGP; The Morgridge Institute for Research; The MHC characterization of the genomes was supported by the 2024 SBS DRDF Research Fund (University of Auckland) awarded to DH and EC.
Acknowledgments
We thank Keith Hernanadez and two reviewers for their helpful suggestions on earlier drafts of the manuscript. We are grateful to the many people and institutions involved in sample collection, preservation, cell culture, storage and metadata management that made it possible to sequence and assemble reference genomes for these species. For access to valuable samples, we are grateful to Alexandria Mena (Sea World); The San Diego Zoo Wildlife Alliance Frozen Zoo; The Southwest Fisheries Science Center Marine Mammal and Sea Turtle Research (MMASTR) Collection; Jill Arnold, Leigh Ann Clayton, Nora Hilger, Winston Timp and The New England Aquarium. The Rice’s Whale and North Atlantic Right Whale samples used in this study were collected by the Emerald Coast Wildlife Refuge and the National Oceanic and Atmospheric Administration/National Marine Fisheries Service (NOAA Fisheries), respectively, and provided by the National Marine Mammal Tissue Bank, which is maintained by the National Institute of Standards and Technology (NIST) at the NIST Biorepository, Hollings Marine Laboratory, Charleston, SC. The NMMTB is operated under the direction of the NOAA Fisheries with the collaboration of the U.S. Geological Survey, U.S. Fish and Wildlife Service, the (former) Minerals Management Service, and NIST, through the Marine Mammal Health and Stranding Response Program. We are grateful to Damian Baranski and Alexander Ben Hamadou for their support with Inia geoffrensis DNA/RNA extractions and library preparations, and to Cene Bryant for field biopsy sampling assistance and data processing. We thank the Genome Technology Center (RGTC) at Radboudumc for the use of the Sequencing Core Facility (Nijmegen, The Netherlands), which provided the PacBio SMRT sequencing service for I. geoffrensis on the Sequel II platform. Jonas Astrin provided the I. geoffrensis tissue samples for the RNA extraction from the biobank of the Leibniz Institute for the Analysis of Biodiversity Change in Bonn, Germany. Unpublished genome assemblies and sequencing data for B. ricei, D. delphis, E. robustus, E. glacialis, G. melas, K. breviceps, M. densirostris and O. orca were used with permission from the DNA Zoo Consortium (dnazoo.org). Identification of certain commercial equipment, instruments, software, or materials does not imply recommendation or endorsement by the National Institute of Standards and Technology or author-affiliated organizations, nor does it imply that the products identified are necessarily the best available for the purpose.
Conflict of interest
JJ was employed by V.E. Enterprises.
The remaining authors declare that the research was conducted in the absence of any commercial or financial relationships that could be construed as a potential conflict of interest.
The reviewer MW declared a past co-authorship with the authors PM and YB to the handling editor.
Generative AI statement
The author(s) declare that no Generative AI was used in the creation of this manuscript.
Publisher’s note
All claims expressed in this article are solely those of the authors and do not necessarily represent those of their affiliated organizations, or those of the publisher, the editors and the reviewers. Any product that may be evaluated in this article, or claim that may be made by its manufacturer, is not guaranteed or endorsed by the publisher.
Supplementary material
The Supplementary Material for this article can be found online at: https://www.frontiersin.org/articles/10.3389/fmars.2025.1562045/full#supplementary-material
Footnotes
- ^ Blaxter, M., Lewin, H.A., DiPalma, F., Challis, R., da Silva, M., Durbin, R., et al.. The Earth BioGenome Project Phase II: Illuminating the eukaryotic tree of life. Front. Sci. Rev. doi: 10.3389/fsci.2025.1514835 in press.
References
Abduriyim S., Zou D. H., and Zhao H. (2019). Origin and evolution of the major histocompatibility complex class I region in eutherian mammals. Ecol. Evol. 9, 7861–7874. doi: 10.1002/ece3.5373
Anderson-Trocme L., Farouni R., Bourgey M., Kamatani Y., Higasa K., Seo J. S., et al. (2019). Legacy data confounds genomics studies. Mol. Biol. Evol. 37, 2–10. doi: 10.1093/molbev/msz201
Andrews G., Fan K., Pratt H. E., Phalke N., Consortium§, Z, Karlsson E. K., et al. (2023). Mammalian evolution of human cis-regulatory elements and transcription factor binding sites. Science 380, eabn7930. doi: 10.1126/science.abn7930
Andrews K. R., Epstein B., Leslie M., Fiedler P., Morin P. A., and Hoelzel A. R. (2021). Genomic signatures of divergent selection are associated with social behavior for spinner dolphin ecotypes. Mol. Ecol. 30, 1993–2008. doi: 10.1111/mec.15865
Archer F. I., Brownell R. L. Jr., Hancock-Hanser B. L., Morin P. A., Robertson K. M., Sherman K. K., et al. (2019). Revision of fin whale Balaenoptera physalus (Linnaeus 1758) subspecies using genetics. J. Mammal 100, 1653–1670. doi: 10.1093/jmammal/gyz121
Arnason U., Benirschke K., Mead J. G., and Nichols W. W. (1977). Banded Karyotypes of 3 Whales - Mesoplodon europaeus, Mesoplodon carlhubbsi and Balaenoptera acutorostrata. Hereditas 87, 189–200.
Arnason U., Lammers F., Kumar V., Nilsson M. A., and Janke A. (2018). Whole-genome sequencing of the blue whale and other rorquals finds signatures for introgressive gene flow. Sci. Adv. 4, eaap9873. doi: 10.1126/sciadv.aap9873
Autenrieth M., Hartmann S., Lah L., Roos A., Dennis A. B., and Tiedemann R. (2018). High-quality whole-genome sequence of an abundant Holarctic odontocete, the harbour porpoise (Phocoena phocoena). Mol. Ecol. Resour 18, 1469–1481. doi: 10.1111/1755-0998.12932
Barceló A., Sandoval-Castillo J., Stockin K. A., Bilgmann K., Attard C. R. M., Zanardo N., et al. (2021). A matter of scale: Population genomic structure and connectivity of fisheries at-risk common dolphins (Delphinus delphis) from Australasia. Front. Mar. Sci. 8. doi: 10.3389/fmars.2021.616673
Blaxter M., Mieszkowska N., Di Palma F., Holland P., Durbin R., Richards T., et al. (2022). Sequence locally, think globally: The Darwin Tree of Life Project. Proc. Natl. Acad. Sci. U.S.A. 119, e2115642118. doi: 10.1073/pnas.2115642118
Boissinot S. and Sookdeo A. (2016). The evolution of LINE-1 in vertebrates. Genome Biol. Evol. 8, 3485–3507. doi: 10.1093/gbe/evw247
Bortoluzzi C., Bosse M., Derks M. F. L., Crooijmans R., Groenen M. A. M., and Megens H. J. (2020). The type of bottleneck matters: Insights into the deleterious variation landscape of small managed populations. Evol. Appl. 13, 330–341. doi: 10.1111/eva.12872
Bosse M., Megens H. J., Madsen O., Paudel Y., Frantz L. A., Schook L. B., et al. (2012). Regions of homozygosity in the porcine genome: consequence of demography and the recombination landscape. PloS Genet. 8, e1003100. doi: 10.1371/journal.pgen.1003100
Braulik G. T., Archer F. I., Khan U., Imran M., Sinha R. K., Jefferson T. A., et al. (2021). Taxonomic revision of the South Asian River dolphins (Platanista): Indus and Ganges River dolphins are separate species. Mar. Mammal Sci. 37, 1022–1059. doi: 10.1111/mms.12801
Brownlow A., Davison N. J., Morin P. A., Wellcome Sanger Institute Tree of Life Management Samples and Laboratory Team, Wellcome Sanger Institute Scientific Operations: Sequencing Operations, Wellcome Sanger Institute Tree of Life Core Informatics Team, et al. (2024). The genome sequence of the minke whale, Balaenoptera acutorostrata Lacépèd. Wellcome Open Res. 9, 706. doi: 10.12688/wellcomeopenres
Bukhman Y. V., Morin P. A., Meyer S., Chu L.-F., Jacobsen J. K., Antosiewicz-Bourget J., et al. (2024). A high-quality blue whale genome, segmental duplications, and historical demography. Mol. Biol. Evol. 41, msae036. doi: 10.1093/molbev/msae036
Capella-Gutierrez S., Silla-Martinez J. M., and Gabaldon T. (2009). trimAl: a tool for automated alignment trimming in large-scale phylogenetic analyses. Bioinform 25, 1972–1973. doi: 10.1093/bioinformatics/btp348
Carbone L., Harris R. A., Gnerre S., Veeramah K. R., Lorente-Galdos B., Huddleston J., et al. (2014). Gibbon genome and the fast karyotype evolution of small apes. Nature 513, 195–201. doi: 10.1038/nature13679
Carroll E. L., McGowen M. R., McCarthy M. L., Marx F. G., Aguilar N., Dalebout M. L., et al. (2021). Speciation in the deep: genomics and morphology reveal a new species of beaked whale Mesoplodon eueu. Proc. R Soc. London B 288, 20211213. doi: 10.1098/rspb.2021.1213
Caulin A. F. and Maley C. C. (2011). Peto's Paradox: evolution's prescription for cancer prevention. Trends Ecol. Evol. 26, 175–182. doi: 10.1016/j.tree.2011.01.002
Ceballos F. C., Joshi P. K., Clark D. W., Ramsay M., and Wilson J. F. (2018). Runs of homozygosity: windows into population history and trait architecture. Nat. Rev. Genet. 19, 220–234. doi: 10.1038/nrg.2017.109
Cechova M. (2020). Probably correct: Rescuing repeats with short and long reads. Genes 12, 48. doi: 10.3390/genes12010048
Challis R., Kumar S., Sotero-Caio C., Brown M., and Blaxter M. (2023). Genomes on a Tree (GoaT): A versatile, scalable search engine for genomic and sequencing project metadata across the eukaryotic tree of life. Wellcome Open Res. 8, 24. doi: 10.12688/wellcomeopenres.18658.1
Cheng H., Jarvis E. D., Fedrigo O., Koepfli K. P., Urban L., Gemmell N. J., et al. (2022). Haplotype-resolved assembly of diploid genomes without parental data. Nat. Biotechnol. 40, 1332–1335. doi: 10.1038/s41587-022-01261-x
Chin C. S., Peluso P., Sedlazeck F. J., Nattestad M., Concepcion G. T., Clum A., et al. (2016). Phased diploid genome assembly with single-molecule real-time sequencing. Nat. Methods 13, 1050–1054. doi: 10.1038/nmeth.4035
Christmas M. J., Kaplow I. M., Genereux D. P., Dong M. X., Hughes G. M., Li X., et al. (2023). Evolutionary constraint and innovation across hundreds of placental mammals. Science 380, eabn3943. doi: 10.1126/science.abn3943
Committee on Taxonomy, S.f.M.M (2024). List of marine mammal species and subspecies. Available online at: https://marinemammalscience.org/science-and-publications/list-marine-mammal-species-subspecies/ (Accessed August 15 2024).
Cook C. N., Redford K. H., and Schwartz M. W. (2023). Species conservation in the era of genomic science. Biosci 73, 885–890. doi: 10.1093/biosci/biad098
Costa A. P. B., Mcfee W., Wilcox L. A., Archer F. I., and Rosel P. E. (2022). The common bottlenose dolphin (Tursiops truncatus) ecotypes of the western North Atlantic revisited: an integrative taxonomic investigation supports the presence of distinct species. Zool J. Linn Soc. 196, 1608–1636. doi: 10.1093/zoolinnean/zlac025
Dahn H. A., Mountcastle J., Balacco J., Winkler S., Bista I., Schmitt A., et al. (2022). Benchmarking ultra-high molecular weight DNA preservation methods for long-read and long-range sequencing. GigaScience 11, 1–13. doi: 10.1093/gigascience/giac068
Danecek P., Bonfield J. K., Liddle J., Marshall J., Ohan V., Pollard M. O., et al. (2021). Twelve years of SAMtools and BCFtools. Gigascience 10, giab008. doi: 10.1093/gigascience/giab008
Darling A. C., Mau B., Blattner F. R., and Perna N. T. (2004). Mauve: multiple alignment of conserved genomic sequence with rearrangements. Genome Res. 14, 1394–1403. doi: 10.1101/gr.2289704
Davison N. J., Morin P. A., Wellcome Sanger Institute Tree of Life Management Samples and Laboratory Team, Wellcome Sanger Institute Scientific Operations: Sequencing Operations, Wellcome Sanger Institute Tree of Life Core Informatics Team, Tree of Life Core Informatics collective, et al. (2024a). The genome sequence of the long-finned pilot whale, Globicephala melas (Trail1 1809). Wellcome Open Res. 10, 180. doi: 10.12688/wellcomeopenres
Davison N. J., Morin P. A., Wellcome Sanger Institute Tree of Life Management Samples and Laboratory Team, Wellcome Sanger Institute Scientific Operations: Sequencing Operations, Wellcome Sanger Institute Tree of Life Core Informatics Team, Tree of Life Core Informatics collective, et al. (2024b). The genome sequence of the short-beaked common dolphin, Delphinus delphis Linnaeu. Wellcome Open Res. 10, 178. doi: 10.12688/wellcomeopenres
Davison N. J., Morin P. A., Wellcome Sanger Institute Tree of Life Management Samples and Laboratory Team, Wellcome Sanger Institute Scientific Operations: Sequencing Operations, Wellcome Sanger Institute Tree of Life Core Informatics Team, Tree of Life Core Informatics collective, et al. (2024c). The genome sequence of the striped dolphin, Stenella coeruleoalba (Meyen 1833). Wellcome Open Res. 9, 727. doi: 10.12688/wellcomeopenres
Davison N. J., Morin P. A., Wellcome Sanger Institute Tree of Life Management Samples and Laboratory Team, Wellcome Sanger Institute Scientific Operations: Sequencing Operations, Wellcome Sanger Institute Tree of Life Core Informatics Team, Tree of Life Core Informatics collective, et al. (2024d). The genome sequence of the white-beaked dolphin, Lagenorhynchus albirostris (Gray 1846). Wellcome Open Res. 9, 687. doi: 10.12688/wellcomeopenres.23369.1
Davison N. J., Morin P. A., Wellcome Sanger Institute Tree of Life Management Samples and Laboratory Team, Wellcome Sanger Institute Scientific Operations: Sequencing Operations, Wellcome Sanger Institute Tree of Life Core Informatics Team, Tree of Life Core Informatics collective, et al. (2025). The genome sequence of the harbor porpoise (Phocoena phocoena). Wellcome Open Res. 10, 181. doi: 10.12688/wellcomeopenres.24011.1
de Greef E., Einfeldt A. L., Miller P. J. O., Ferguson S. H., Garroway C. J., Lefort K. J., et al. (2022). Genomics reveal population structure, evolutionary history, and signatures of selection in the northern bottlenose whale, Hyperoodon ampullatus. Mol. Ecol. 31, 4919–4931. doi: 10.1111/mec.16643
Dudchenko O., Batra S. S., Omer A. D., Nyquist S. K., Hoeger M., Durand N. C., et al. (2017). De novo assembly of the Aedes aEgypti genome using Hi-C yields chromosome-length scaffolds. Science 356, 92–95. doi: 10.1126/science.aal3327
Dussex N., van der Valk T., Morales H. E., Wheat C. W., Diez-Del-Molino D., von Seth J., et al. (2021). Population genomics of the critically endangered kakapo. Cell Genom 1, 100002. doi: 10.1016/j.xgen.2021.100002
Dutheil J. Y., Gaillard S., and Stukenbrock E. H. (2014). MafFilter: a highly flexible and extensible multiple genome alignment files processor. BMC Genomics 15, 53. doi: 10.1186/1471-2164-15-53
Earth Biogenome Project (2021).Report on Assembly Standards, V. 4.0 March 2021. Available online at: https://www.earthbiogenome.org/assembly-standards (Accessed November 8, 2021).
Edgar R. C. (2004). MUSCLE: multiple sequence alignment with high accuracy and high throughput. Nucleic Acids Res. 32, 1792–1797. doi: 10.1093/nar/gkh340
Eichenberger F., Carroll E. L., Garrigue C., Steel D., Bonneville C. D., Rendell L., et al. (2024). Patterns of paternity: insights into mating competition and gene flow in a recovering population of humpback whales. R Soc. Open Sci. 12, 241424. doi: 10.1098/RSOS.241424/v2/response1
Feyrer L. J., de Greef E., Wellcome Sanger Institute Tree of Life Management Samples and Laboratory Team, Wellcome Sanger Institute Scientific Operations: Sequencing Operations, Wellcome Sanger Institute Tree of Life Core Informatics Team, Tree of Life Core Informatics collective, et al. (2024). The genome sequence of the Northern Bottlenose Whale, Hyperoodon ampullatus (Forster 1770). Wellcome Open Res. 9, 490. doi: 10.12688/wellcomeopenres.22743.1
Foote A. D., Alexander A., Ballance L. T., Constantine R., Galletti Vernazzani Muñoz B., Guinet C., et al. (2023). ‘Type D’ killer whale genomes reveal long-term small population size and low genetic diversity. J. Hered 114, 94–109. doi: 10.1093/jhered/esac070/
Foote A. D., Bunskoek P., Wellcome Sanger Institute Tree of Life programme, Wellcome Sanger Institute Scientific Operations: DNA Pipelines collective, and Tree of Life Core Informatics collective, and Darwin Tree of Life Consortium (2022). The genome sequence of the killer whale, Orcinus orca (Linnaeus 1758). Wellcome Open Res. 7, 250. doi: 10.12688/wellcomeopenres.18278.1
Foote A. D., Gilbert M. T. P., Gopalakrishnan S., Louis M., Martin M. D., Morin P. A., et al. (2021a). Evidence of long-term purging of mutation load in killer whale genomes. BioRxiv. doi: 10.1101/2021.08.21.457186
Foote A. D., Hooper R., Alexander A., Baird R. W., Baker C. S., Ballance L., et al. (2021b). Runs of homozygosity in killer whale genomes provide a global record of demographic histories. Mol. Ecol. 30, 6162–6177. doi: 10.1111/mec.16137
Foote A. D., Liu Y., Thomas G. W., Vinar T., Alfoldi J., Deng J., et al. (2015). Convergent evolution of the genomes of marine mammals. Nat. Genet. 47, 272–275. doi: 10.1038/ng.3198
Foote A. D., Martin M. D., Louis M., Pacheco G., Robertson K. M., Sinding M.-H. S., et al. (2019). Killer whale genomes reveal a complex history of recurrent admixture and vicariance. Mol. Ecol. 28, 3427–3444. doi: 10.1111/mec.15099
Foote A. D. and Morin P. A. (2016). Genome-wide SNP data suggests complex ancestry of sympatric North Pacific killer whale ecotypes. Heredity 117, 316–325. doi: 10.1038/hdy.2016.54
Formenti G., Theissinger K., Fernandes C., Bista I., Bombarely A., Bleidorn C., et al. (2022). The era of reference genomes in conservation genomics. Trends Ecol. Evol. 37, 197–202. doi: 10.1016/j.tree.2021.11.008
Foster Y., Dutoit L., Grosser S., Dussex N., Foster B. J., Dodds K. G., et al. (2021). Genomic signatures of inbreeding in a critically endangered parrot, the kakapo. G3 11, jkab307. doi: 10.1093/g3journal/jkab307
Garroway C. J., de Greef E., Lefort K. J., Thorstensen M. J., Foote A. D., Matthews C. J. D., et al. (2024). Climate change introduces threatened killer whale populations and conservation challenges to the Arctic. Glob Chang Biol. 30, e17352. doi: 10.1111/gcb.17352
Goldfarb T., Kodali V. K., Pujar S., Brover V., Robbertse B., Farrell C. M., et al. (2024). NCBI RefSeq: reference sequence standards through 25 years of curation and annotation. Nucleic Acids Res. 53, D243–D257. doi: 10.1093/nar/gkae1038
Groot N. E., Constantine R., Garland E. C., and Carroll E. L. (2023). Phylogenetically controlled life history trait meta-analysis in cetaceans reveals unexpected negative brain size and longevity correlation. Evolution 77, 534–549. doi: 10.1093/evolut/qpac050
Grummer J. A., Beheregaray L. B., Bernatchez L., Hand B. K., Luikart G., Narum S. R., et al. (2019). Aquatic lanscape genomics and environmental effects on genetic variation. Trends Ecol. Evol. 34, 641–654. doi: 10.1016/j.tree.2019.02.013
Guhlin J., Le Lec M. F., Wold J., Koot E., Winter D., Biggs P. J., et al. (2023). Species-wide genomics of kakapo provides tools to accelerate recovery. Nat. Ecol. Evol. 7, 1693–1705. doi: 10.1038/s41559-023-02165-y
Guo W., Sun D., Cao Y., Xiao L., Huang X., Ren W., et al. (2022). Extensive interspecific gene flow shaped complex evolutionary history and underestimated species diversity in rapidly radiated dolphins. J. Mamm Evol. 29, 353–367. doi: 10.1007/s10914-021-09581-6
Hasselgren M., Dussex N., von Seth J., Angerbjorn A., Olsen R. A., Dalen L., et al. (2021). Genomic and fitness consequences of inbreeding in an endangered carnivore. Mol. Ecol. 30, 2790–2799. doi: 10.1111/mec.15943
Hecker N., Sharma V., and Hiller M. (2017). Transition to an aquatic habitat permitted the repeated loss of the pleiotropic KLK8 gene in mammals. Genome Biol. Evol. 9, 3179–3188. doi: 10.1093/gbe/evx239
Heijmans C. M. C., de Groot N. G., and Bontrop R. E. (2020). Comparative genetics of the major histocompatibility complex in humans and nonhuman primates. Int. J. Immunogenet 47, 243–260. doi: 10.1111/iji.12490
Heimeier D., Garland E. C., Eichenberger F., Garrigue C., Vella A., Baker C. S., et al. (2024). A pan-cetacean MHC amplicon sequencing panel developed and evaluated in combination with genome assemblies. Mol. Ecol. Resour 24, e13955. doi: 10.1111/1755-0998.13955
Hernandez K. M., O'Neill K. B., Bors E. K., Steel D., Zoller J. A., Constantine R., et al. (2023). Using epigenetic clocks to investigate changes in the age structure of critically endangered Maui dolphins. Ecol. Evol. 13, e10562. doi: 10.1002/ece3.10562
Hilgers L., Liu S., Jensen A., Brown T., Cousins T., Schweiger R., et al. (2025). Avoidable false PSMC population size peaks occur across numerous studies. Curr. Biol. 35, 927–930. doi: 10.1016/j.cub.2024.09.028
Hoang D. T., Chernomor O., von Haeseler A., Minh B. Q., and Vinh L. S. (2018). UFBoot2: Improving the ultrafast bootstrap approximation. Mol. Biol. Evol. 35, 518–522. doi: 10.1093/molbev/msx281
Hogg C. J. (2024). Translating genomic advances into biodiversity conservation. Nat. Rev. Genet. 25, 362–373. doi: 10.1038/s41576-023-00671-0
Hohenlohe P. A., Funk W. C., and Rajora O. P. (2021). Population genomics for wildlife conservation and management. Mol. Ecol. 30, 62–82. doi: 10.1111/mec.15720
Howe K., Chow W., Collins J., Pelan S., Pointon D. L., Sims Y., et al. (2021). Significantly improving the quality of genome assemblies through curation. Gigascience 10, giaa153. doi: 10.1093/gigascience/giaa153
Huelsmann M., Hecker N., Springer M. S., Gatesy J., Sharma V., and Hiller M. (2019). Genes lost during the transition from land to water in cetaceans highlight genomic changes associated with aquatic adaptations. Sci. Adv. 5, eaaw6671. doi: 10.1126/sciadv.aaw6671
Ivashchenko Y. V., Brownell R. L. Jr., and Clapham P. J. (2013). Soviet whaling in the North Pacific: Revised catch totals. J. Cetacean Res. Manag 13, 59–71. doi: 10.47536/jcrm.v13i1.556
Ivashchenko Y. V. and Clapham P. J. (2015). What's the catch? Validity of whaling data for Japanese catches of sperm whales in the North Pacific. R Soc. Open Sci. 2, 150177. doi: 10.1098/rsos.150177
Jarvis E. D., Formenti G., Rhie A., Guarracino A., Yang C., Wood J., et al. (2022). Semi-automated assembly of high-quality diploid human reference genomes. Nature 611, 519–531. doi: 10.1038/s41586-022-05325-5
Jossey S., Haddrath O., Loureiro L., Weir J. T., Lim B. K., Miller J., et al. (2024). Population structure and history of North Atlantic blue whales (Balaenoptera musculus musculus) inferred from whole genome sequence analysis. Conserv. Genet. 25, 357–371. doi: 10.1007/s10592-023-01584-5
Kalyaanamoorthy S., Minh B. Q., Wong T. K. F., von Haeseler A., and Jermiin L. S. (2017). ModelFinder: fast model selection for accurate phylogenetic estimates. Nat. Methods 14, 587–589. doi: 10.1038/nmeth.4285
Kardos M., Zhang Y., Parsons K. M., A Y., Kang H., Xu X., et al. (2023). Inbreeding depression explains killer whale population dynamics. Nat. Ecol. Evol. 7, 675–686. doi: 10.1038/s41559-023-01995-0
Katoh K., Kuma K., Toh H., and Miyata T. (2005). MAFFT version 5: improvement in accuracy of multiple sequence alignment. Nucleic Acids Res. 33, 511–518. doi: 10.1093/nar/gki198
Katoh K. and Standley D. M. (2013). MAFFT multiple sequence alignment software version 7: improvements in performance and usability. Mol. Biol. Evol. 30, 772–780. doi: 10.1093/molbev/mst010
Kaufman J. (2018). Unfinished business: Evolution of the MHC and the adaptive immune system of jawed vertebrates. Annu. Rev. Immunol. 36, 383–409. doi: 10.1146/annurev-immunol-051116-052450
Keane M., Semeiks J., Webb A. E., Li Y. I., Quesada V., Craig T., et al. (2015). Insights into the evolution of longevity from the bowhead whale genome. Cell Rep. 10, 112–122. doi: 10.1016/j.celrep.2014.12.008
Kelley J., Walter L., and Trowsdale J. (2005). Comparative genomics of major histocompatibility complexes. Immunogenet 56, 683–695. doi: 10.1007/s00251-004-0717-7
Kielbasa S. M., Wan R., Sato K., Horton P., and Frith M. C. (2011). Adaptive seeds tame genomic sequence comparison. Genome Res. 21, 487–493. doi: 10.1101/gr.113985.110
Kim J., Lee C., Ko B. J., Yoo D. A., Won S., Phillippy A. M., et al. (2022). False gene and chromosome losses in genome assemblies caused by GC content variation and repeats. Genome Biol. 23, 204. doi: 10.1186/s13059-022-02765-0
Koren S., Rhie A., Walenz B. P., Dilthey A. T., Bickhart D. M., Kingan S. B., et al. (2018). De novo assembly of haplotype-resolved genomes with trio binning. Nat. Biotechnol. 36, 1174–1182. doi: 10.1038/nbt.4277
Korlach J., Gedman G., Kingan S. B., Chin C. S., Howard J. T., Audet J. N., et al. (2017). De novo PacBio long-read and phased avian genome assemblies correct and add to reference genes generated with intermediate and short reads. Gigascience 6, 1–16. doi: 10.1093/gigascience/gix085
Korneliussen T. S., Albrechtsen A., and Nielsen R. (2014). ANGSD: Analysis of next generation sequencing data. BMC Bioinform. 15, 356. doi: 10.1186/s12859-014-0356-4
Kumanovics A., Takada T., and Lindahl K. F. (2003). Genomic organization of the mammalian MHC. Annu. Rev. Immunol. 21, 629–657. doi: 10.1146/annurev.immunol.21.090501.080116
Kyriazis C. C., Robinson J. A., Nigenda-Morales S. F., Beichman A. C., Rojas-Bracho L., Robertson K. M., et al. (2023). Models based on best-available information support a low inbreeding load and potential for recovery in the vaquita. Heredity 130, 183–187. doi: 10.1038/s41437-023-00608-7
Lah L., Trense D., Benke H., Berggren P., Gunnlaugsson P., Lockyer C., et al. (2016). Spatially explicit analysis of genome-wide SNPs detects subtle population structure in a mobile marine mammal, the harbor porpoise. PloS One 11, e0162792. doi: 10.1371/journal.pone.0162792
Lariviere D., Abueg L., Brajuka N., Gallardo-Alba C., Gruning B., Ko B. J., et al. (2024). Scalable, accessible and reproducible reference genome assembly and evaluation in Galaxy. Nat. Biotechnol. 42, 367–370. doi: 10.1038/s41587-023-02100-3
Leslie M. S. and Morin P. A. (2016). Using genome-wide snps to detect structure in high-diversity and low-divergence populations of severely impacted eastern tropical Pacific spinner (Stenella longirostris) and pantropical spotted dolphins (S. attenuata). Front. Mar. Sci. 3. doi: 10.3389/fmars.2016.00253
Leslie M. S. and Morin P. A. (2018). Structure and phylogeography of two tropical predators, spinner (Stenella longirostris) and pantropical spotted (S. attenuata) dolphins, from SNP data. R Soc. Open Sci. 5, 171615. doi: 10.1098/rsos.171615
Letunic I. and Bork P. (2024). Interactive Tree of Life (iTOL) v6: recent updates to the phylogenetic tree display and annotation tool. Nucleic Acids Res. 52, W78–W82. doi: 10.1093/nar/gkae268
Lewin H. A., Robinson G. E., Kress W. J., Baker W. J., Coddington J., Crandall K. A., et al. (2018). Earth BioGenome Project: Sequencing life for the future of life. Proc. Natl. Acad. Sci. U.S.A. 115, 4325–4333. doi: 10.1073/pnas.1720115115
Li H. and Durbin R. (2009). Fast and accurate short read alignment with Burrows-Wheeler transform. Bioinform 25, 1754–1760. doi: 10.1093/bioinformatics/btp324
Li H. and Durbin R. (2011). Inference of human population history from individual whole-genome sequences. Nature 475, 493–496. doi: 10.1038/nature10231
Liao W. W., Asri M., Ebler J., Doerr D., Haukness M., Hickey G., et al. (2023). A draft human pangenome reference. Nature 617, 312–324. doi: 10.1038/s41586-023-05896-x
Louis M., Korlevic P., Nykanen M., Archer F., Berrow S., Brownlow A., et al. (2023). Ancient dolphin genomes reveal rapid repeated adaptation to coastal waters. Nat. Commun. 14, 4020. doi: 10.1038/s41467-023-39532-z
Mackintosh A., de la Rosa P. M. G., Martin S. H., Lohse K., and Laetsch D. R. (2023). Inferring inter-chromosomal rearrangements and ancestral linkage groups from synteny. bioRxiv 2023.2009.2017.558111. doi: 10.1101/2023.09.17.558111
Manni M., Berkeley M. R., Seppey M., Simao F. A., and Zdobnov E. M. (2021). BUSCO update: Novel and streamlined workflows along with broader and deeper phylogenetic coverage for scoring of eukaryotic, prokaryotic, and viral genomes. Mol. Biol. Evol. 38, 4647–4654. doi: 10.1093/molbev/msab199
Mascher M., Wicker T., Jenkins J., Plott C., Lux T., Koh C. S., et al. (2021). Long-read sequence assembly: a technical evaluation in barley. Plant Cell 33, 1888–1906. doi: 10.1093/plcell/koab077
McGowen M. R., Tsagkogeorga G., Álvarez-Carretero S., dos Reis M., Struebig M., Deaville R., et al. (2020a). Phylogenomic resolution of the cetacean tree of life using target sequence capture. Syst. Biol. 69, 479–501. doi: 10.1093/sysbio/syz068
McGowen M. R., Tsagkogeorga G., Morin P. A., and Rossiter S. J. (2020b). Positive selection and inactivation in vision and hearing genes mirrors diversification of cetaceans. Mol. Biol. Evol. 37, 2069–2083. doi: 10.1093/molbev/msaa070
Minh B. Q., Schmidt H. A., Chernomor O., Schrempf D., Woodhams M. D., von Haeseler A., et al. (2020). IQ-TREE 2: new models and efficient methods for phylogenetic inference in the genomic era. Mol. Biol. Evol. 37, 1530–1534. doi: 10.1093/molbev/msaa015
Mirarab S., Reaz R., Bayzid M. S., Zimmermann T., Swenson M. S., and Warnow T. (2014). ASTRAL: genome-scale coalescent-based species tree estimation. Bioinform 30, i541–i548. doi: 10.1093/bioinformatics/btu462
Morin P. A., Alexander A., Blaxter M., Caballero S., Fedrigo O., Fontaine M. C., et al. (2020). Building genomic infrastructure: Sequencing platinum-standard reference-quality genomes of all cetacean species. Mar. Mammal Sci. 36, 1356–1366. doi: 10.1111/mms.12721
Morin P. A., Archer F. I., Avila C. D., Balacco J. R., Bukham Y. V., Chow W., et al. (2021a). Reference genome and demographic history of the most endangered marine mammal, the vaquita. Mol. Ecol. Resour 21, 1008–1020. doi: 10.1111/1755-0998.13284
Morin P. A., Foote A. D., Baker C. S., Hancock-Hanser B. L., Kaschner K., Mate B. R., et al. (2018). Demography or selection on linked cultural traits or genes? Investigating the driver of low mtDNA diversity in the sperm whale using complementary mitochondrial and nuclear genome analyses. Mol. Ecol. 27, 2604–2619. doi: 10.1111/mec.14698
Morin P. A., Forester B. R., Forney K. A., Crossman C. A., Hancock-Hanser B., Robertson K. M., et al. (2021b). Population structure in a continuously distributed coastal marine species, the harbor porpoise, based on microhaplotypes derived from poor quality samples. Mol. Ecol. 30, 1457–1476. doi: 10.1111/mec.15827
Morin P. A., Martien K., Lang A. R., Hancock-Hanser B., Pease V. L., Roberston K. M., et al. (2023). Guidelines and quantitative standards for improved cetacean taxonomy using full mitochondrial genomes. J. Hered 114, 612–624. doi: 10.1093/jhered/esad049
Morin P. A., McCarthy M. L., Fung C. W., Durban J. W., Parsons K. M., Perrin W. F., et al. (2024). Revised taxonomy of eastern North Pacific killer whales (Orcinus orca): Bigg’s and resident ecotypes deserve species status. R Soc. Open Sci. 11, 231368. doi: 10.1098/rsos.231368
Mudd A. B., Bredeson J. V., Baum R., Hockemeyer D., and Rokhsar D. S. (2020). Analysis of muntjac deer genome and chromatin architecture reveals rapid karyotype evolution. Commun. Biol. 3, 480. doi: 10.1038/s42003-020-1096-9
Murchison E. P., Schulz-Trieglaff O. B., Ning Z., Alexandrov L. B., Bauer M. J., Fu B., et al. (2012). Genome sequencing and analysis of the Tasmanian devil and its transmissible cancer. Cell 148, 780–791. doi: 10.1016/j.cell.2011.11.065
Nigenda-Morales S. F., Lin M., Nunez-Valencia P. G., Kyriazis C. C., Beichman A. C., Robinson J. A., et al. (2023). The genomic footprint of whaling and isolation in fin whale populations. Nat. Commun. 14, 5465. doi: 10.1038/s41467-023-40052-z
Onoufriou A. B., Gaggiotti O. E., Aguilar de Soto N., McCarthy M. L., Morin P. A., Rosso M., et al. (2022). Biogeography in the deep: Hierarchical population genomic structure of two beaked whale species. Glob Ecol. Conserv. 40, e02308. doi: 10.1016/j.gecco.2022.e02308
Ostrander E. A., Wayne R. K., Freedman A. H., and Davis B. W. (2017). Demographic history, selection and functional diversity of the canine genome. Nat. Rev. Genet. 18, 705–720. doi: 10.1038/nrg.2017.67
Paez S., Kraus R. H. S., Shapiro B., Gilbert M. T. P., Jarvis E. D., Al-Ajli F. O., et al. (2022). Reference genomes for conservation. Science 377, 364–366. doi: 10.1126/science.abm8127
Parsons K. M., Haghani A., Zoller J. A., Lu A. T., Fei Z., Ferguson S. H., et al. (2023). DNA methylation-based biomarkers for ageing long-lived cetaceans. Mol. Ecol. Resour 23, 1241–1256. doi: 10.1111/1755-0998.13791
Pause K. C., Bonde R. K., McGuire P. M., Zori R. T., and Gray B. A. (2006). G-banded karyotype and ideogram for the North Atlantic right whale (Eubalaena glacialis). J. Hered 97, 303–306. doi: 10.1093/jhered/esj033
Peona V., Blom M. P. K., Xu L., Burri R., Sullivan S., Bunikis I., et al. (2021). Identifying the causes and consequences of assembly gaps using a multiplatform genome assembly of a bird-of-paradise. Mol. Ecol. Resour 21, 263–286. doi: 10.1111/1755-0998.13252
Plassais J., vonHoldt B. M., Parker H. G., Carmagnini A., Dubos N., Papa I., et al. (2022). Natural and human-driven selection of a single non-coding body size variant in ancient and modern canids. Curr. Biol. 32, 889–897 e889. doi: 10.1016/j.cub.2021.12.036
Poplin R., Chang P. C., Alexander D., Schwartz S., Colthurst T., Ku A., et al. (2018). A universal SNP and small-indel variant caller using deep neural networks. Nat. Biotechnol. 36, 983–987. doi: 10.1038/nbt.4235
Prasad A., Lorenzen E. D., and Westbury M. V. (2022). Evaluating the role of reference-genome phylogenetic distance on evolutionary inference. Mol. Ecol. Resour 22, 45–55. doi: 10.1111/1755-0998.13457
Quinlan A. R. and Hall I. M. (2010). BEDTools: a flexible suite of utilities for comparing genomic features. Bioinform 26, 841–842. doi: 10.1093/bioinformatics/btq033
Reeves I. M., Totterdell J. A., Barceló A., Sandoval-Castillo J., Batley K. C., Stockin K. A., et al. (2022). Population genomic structure of killer whales (Orcinus orca) in Australian and New Zealand waters. Mar. Mammal Sci. 38, 151–174. doi: 10.1111/mms.12851
Rhie A., McCarthy S. A., Fedrigo O., Damas J., Formenti G., Koren S., et al. (2021). Towards complete and error-free genome assemblies of all vertebrate species. Nature 592, 737–746. doi: 10.1038/s41586-021-03451-0
Rivas-González I. and Tung J. (2024). A multi-million-year natural experiment: Comparative genomics on a massive scale and its implications for human health. Evolution Medicine Public Health 12, 67–70. doi: 10.1093/emph/eoae006
Robinson J. A., Brown C., Kim B. Y., Lohmueller K. E., and Wayne R. K. (2018). Purging of strongly deleterious mutations explains long-term persistence and absence of inbreeding depression in island foxes. Curr. Biol. 28, 3487–3494 e3484. doi: 10.1016/j.cub.2018.08.066
Robinson J. A., Kyriazis C. C., Nigenda-Morales S. F., Beichman A. C., Rojas-Bracho L., Robertson K. M., et al. (2022). The critically endangered vaquita is not doomed to extinction by inbreeding depression. Science 376, 635–639. doi: 10.1126/science.abm1742
Robinson J. A., Raikkonen J., Vucetich L. M., Vucetich J. A., Peterson R. O., Lohmueller K. E., et al. (2019). Genomic signatures of extensive inbreeding in Isle Royale wolves, a population on the threshold of extinction. Sci. Adv. 5, eaau0757. doi: 10.1126/sciadv.aau0757
Romanenko S. A., Perelman P. L., Trifonov V. A., and Graphodatsky A. S. (2012). Chromosomal evolution in rodentia. Hered 108, 4–16. doi: 10.1038/hdy.2011.110
Sá A., Breaux B., Burlamaqui T. C. T., Deiss T. C., Sena L., Criscitiello M. F., et al. (2019). The marine mammal class II major histocompatibility complex organization. Front. Immunol. 10. doi: 10.3389/fimmu.2019.00696
Schrader L. and Schmitz J. (2019). The impact of transposable elements in adaptive evolution. Mol. Ecol. 28, 1537–1549. doi: 10.1111/mec.14794
Serrato-CapuChina A. and Matute D. R. (2018). The role of transposable elements in speciation. Genes (Basel) 9, 254. doi: 10.3390/genes9050254
Shao Y., Zhou L., Li F., Zhao L., Zhang B.-L., Shao F., et al. (2023). Phylogenomic analyses provide insights into primate evolution. Science 380, 913–924. doi: 10.1126/science.abn6919
Silva F. A., Souza E. M. S., Ramos E., Freitas L., and Nery M. F. (2023). The molecular evolution of genes previously associated with large sizes reveals possible pathways to cetacean gigantism. Sci. Rep. 13, 67. doi: 10.1038/s41598-022-24529-3
Smit A. F. A., Hubley R., and Green P. (2013-1015). RepeatMasker Open-4.0. Available online at: http://www.repeatmasker.org.
Smith S. D., Pennell M. W., Dunn C. W., and Edwards S. V. (2020). Phylogenetics is the new genetics (for most of biodiversity). Trends Ecol. Evol. 35, 415–425. doi: 10.1016/j.tree.2020.01.005
Springer M. S., Emerling C. A., Fugate N., Patel R., Starrett J., Morin P. A., et al. (2016a). Inactivation of cone-specific phototransduction genes in rod monochromatic cetaceans. Front. Ecol. Evol. 4. doi: 10.3389/fevo.2016.00061
Springer M. S., Guerrero-Juarez C. F., Huelsmann M., Collin M. A., Danil K., McGowen M. R., et al. (2021). Genomic and anatomical comparisons of skin support independent adaptation to life in water by cetaceans and hippos. Curr. Biol. 31, 2124–2139 e2123. doi: 10.1016/j.cub.2021.02.057
Springer M. S., Starrett J., Morin P. A., Hayashi C., and Gatesy J. (2016c). Inactivation of C4orf26 in toothless placental mammals. Mol. Phylogenet Evol. 95, 34–45. doi: 10.1016/j.ympev.2015.11.002
Storer J., Hubley R., Rosen J., Wheeler T. J., and Smit A. F. (2021). The Dfam community resource of transposable element families, sequence models, and genome annotations. Mob DNA 12, 2. doi: 10.1186/s13100-020-00230-y
Sulak M., Fong L., Mika K., Chigurupati S., Yon L., Mongan N. P., et al. (2016). TP53 copy number expansion is associated with the evolution of increased body size and an enhanced DNA damage response in elephants. Elife 5, e11994. doi: 10.7554/eLife.11994
Tang H., Krishnakumar V., Zeng X., Xu Z., Taranto A., Lomas J. S., et al. (2024). JCVI: A versatile toolkit for comparative genomics analysis. iMeta 3, e211. doi: 10.1002/imt2.211
Taylor B. L., Archer F. I., Martien K. K., Rosel P. E., Hancock-Hanser B. L., Lang A. R., et al. (2017). Guidelines and quantitative standards to improve consistency in cetacean subspecies and species delimitation relying on molecular genetic data. Mar. Mammal Sci. 33, 132–155. doi: 10.1111/mms.12411
Taylor B. L., Chivers S. J., Larese J., and Perrin W. F. (2007). Generation length and percent mature estimates for IUCN assessments of cetaceans (8604 La Jolla Shores Blvd., La Jolla, CA 92038, USA: Southwest Fisheries Science Center).
Theissinger K., Fernandes C., Formenti G., Bista I., Berg P. R., Bleidorn C., et al. (2023). How genomics can help biodiversity conservation. Trends Genet. 39, 545–559. doi: 10.1016/j.tig.2023.01.005
Thibaud-Nissen F., Souvorov A., Murphy T., DiCuccio M., and Kitts P. (2013). “Eukaryotic Genome Annotation Pipeline,” in The NCBI Handbook, 2nd edition. Bethesda (MD): National Center for Biotechnology Information (US). Available at: https://www.ncbi.nlm.nih.gov/books/NBK169439/.
Thorburn D. J., Sagonas K., Binzer-Panchal M., Chain F. J. J., Feulner P. G. D., Bornberg-Bauer E., et al. (2023). Origin matters: Using a local reference genome improves measures in population genomics. Mol. Ecol. Resour 25, 1706–1723. doi: 10.1111/1755-0998.13838
Thorsby E. (2009). A short history of HLA. Tissue Antigens 74, 101–116. doi: 10.1111/j.1399-0039.2009.01291.x
Tollis M., Boddy A. M., and Maley C. C. (2017). Peto's Paradox: how has evolution solved the problem of cancer prevention? BMC Biol. 15, 60. doi: 10.1186/s12915-017-0401-7
Tollis M., Robbins J., Webb A. E., Kuderna L. F. K., Caulin A. F., Garcia J. D., et al. (2019). Return to the sea, get huge, beat cancer: An analysis of cetacean genomes including an assembly for the humpback whale (Megaptera novaeangliae). Mol. Biol. Evol. 36, 1746–1763. doi: 10.1093/molbev/msz099
Trifinopoulos J., Nguyen L. T., von Haeseler A., and Minh B. Q. (2016). W-IQ-TREE: a fast online phylogenetic tool for maximum likelihood analysis. Nucleic Acids Res. 44, W232–W235. doi: 10.1093/nar/gkw256
Van Cise A. M., Baird R. W., Baker C. S., Cerchio S., Claridge D., Fielding R., et al. (2019). Oceanographic barriers, divergence, and admixture: Phylogeography and taxonomy of two putative subspecies of short-finned pilot whale. Mol. Ecol. 28, 2886–2902. doi: 10.1111/mec.15107
Van Cise A. M., Martien K. K., Mahaffy S. D., Baird R. W., Webster D. L., Fowler J., et al. (2017). Familial social structure and socially-driven genetic differentiation in Hawaiian short-finned pilot whales. Mol. Ecol. 26, 6730–6741. doi: 10.1111/mec.14397
van Oosterhout C., Speak S. A., Birley T., Bortoluzzi C., Percival-Alwyn L., Urban L. H., et al. (2022). Genomic erosion in the assessment of species extinction risk and recovery potential. bioRxiv, 2022.2009.2013.507768. doi: 10.1101/2022.09.13.507768
Vasimuddin M., Misra S., Li H., and Aluru S. (2019). Efficient architecture-aware acceleration of BWA-MEM for multicore systems. 2019 IEEE 33rd Int. Parallel Distributed Process. Symposium (Ipdps 2019), 314–324. doi: 10.1109/Ipdps.2019.00041
Vollger M. R., Dishuck P. C., Sorensen M., Welch A. E., Dang V., Dougherty M. L., et al. (2019). Long-read sequence and assembly of segmental duplications. Nat. Methods 16, 88–94. doi: 10.1038/s41592-018-0236-3
Wang S., Lee S., Chu C., Jain D., Kerpedjiev P., Nelson G. M., et al. (2020). HiNT: a computational method for detecting copy number variations and translocations from Hi-C data. Genome Biol. 21, 73. doi: 10.1186/s13059-020-01986-5
Wang Y., Tang H., Debarry J. D., Tan X., Li J., Wang X., et al. (2012). MCScanX: a toolkit for detection and evolutionary analysis of gene synteny and collinearity. Nucleic Acids Res. 40, e49. doi: 10.1093/nar/gkr1293
Westbury M. V., Cabrera A. A., Rey-Iglesia A., De Cahsan B., Duchene D. A., Hartmann S., et al. (2023). A genomic assessment of the marine-speciation paradox within the toothed whale superfamily Delphinoidea. Mol. Ecol. 32, 4829–4843. doi: 10.1111/mec.17069
Wolf M., de Jong M., Halldórsson S. D., Arnason U., and Janke A. (2022). Genomic impact of whaling in North Atlantic fin whales. Mol. Biol. Evol. 39, msac094. doi: 10.1093/molbev/msac094
Wolf M., Zapf K., Gupta D. K., Hiller M., Arnason U., and Janke A. (2023). The genome of the pygmy right whale illuminates the evolution of rorquals. BMC Biol. 21, 79. doi: 10.1186/s12915-023-01579-1
Yim H.-S., Cho Y. S., Guang X., Kang S. G., Jeong J.-Y., Cha S.-S., et al. (2014). Minke whale genome and aquatic adaptation in cetaceans. Nat. Genet. 46, 88–92. doi: 10.1038/ng.2835
Yin D., Chen C., Lin D., Zhang J., Ying C., Liu Y., et al. (2022). Gapless genome assembly of East Asian finless porpoise. Sci. Data 9, 765. doi: 10.1038/s41597-022-01868-4
Yin Y., Fan H., Zhou B., Hu Y., Fan G., Wang J., et al. (2021). Molecular mechanisms and topological consequences of drastic chromosomal rearrangements of muntjac deer. Nat. Commun. 12, 6858. doi: 10.1038/s41467-021-27091-0
Yoo D., Rhie A., Hebbar P., Antonacci F., Logsdon G. A., Solar S. J., et al. (2025). Complete sequencing of ape genomes. Nature 641, 401–418. doi: 10.1038/s41586-025-08816-3
Yuan Y., Zhang Y. L., Zhang P. J., Liu C., Wang J. H., Gao H. Y., et al. (2021). Comparative genomics provides insights into the aquatic adaptations of mammals. Proc. Natl. Acad. Sci. U.S.A. United States America 118, e2106080118. doi: 10.1073/pnas.2106080118
Zamudio K. R. (2023). Conservation genomics: Current applications and future directions. J. Hered 114, 297–299. doi: 10.1093/jhered/esad019
Keywords: reference genome, comparative genomics, conservation genomics, whale, dolphin, porpoise, Cetacea
Citation: Morin PA, Bein B, Bortoluzzi C, Bukhman YV, Hains T, Heimeier D, Uliano-Silva M, Absolon DE, Abueg L, Antosiewicz-Bourget J, Balacco JR, Bonde RK, Brajuka N, Brownlow AC, Carroll EL, Carter M, Collins J, Davison NJ, Denton A, Fedrigo O, Foote AD, Formenti G, Gallo GR, Greve C, Houck ML, Howard C, Jacobsen JK, Jain N, Krasheninnikova K, Maloney BM, Manley BF, Mathers TC, Mccarthy SA, Mcgowen MR, Meyer S, Mountcastle J, Neely BA, O’toole B, Pelan S, Rosel PE, Rowles TK, Ryder OA, Schell T, Sims Y, St Leger J, Stewart R, Ternes K, Tilley T, Whelan C, Wood JMD, Hiller M, Blaxter M and Jarvis ED (2025) Genomic infrastructure for cetacean research and conservation: reference genomes for eight families spanning the cetacean tree of life. Front. Mar. Sci. 12:1562045. doi: 10.3389/fmars.2025.1562045
Received: 16 January 2025; Accepted: 30 May 2025;
Published: 03 July 2025.
Edited by:
Paula F. Campos, University of Porto, PortugalReviewed by:
Mariana Freitas Nery, State University of Campinas, BrazilMagnus Wolf, University of Münster, Germany
Copyright © 2025 Morin, Bein, Bortoluzzi, Bukhman, Hains, Heimeier, Uliano-Silva, Absolon, Abueg, Antosiewicz-Bourget, Balacco, Bonde, Brajuka, Brownlow, Carroll, Carter, Collins, Davison, Denton, Fedrigo, Foote, Formenti, Gallo, Greve, Houck, Howard, Jacobsen, Jain, Krasheninnikova, Maloney, Manley, Mathers, Mccarthy, Mcgowen, Meyer, Mountcastle, Neely, O’toole, Pelan, Rosel, Rowles, Ryder, Schell, Sims, St Leger, Stewart, Ternes, Tilley, Whelan, Wood, Hiller, Blaxter and Jarvis. This is an open-access article distributed under the terms of the Creative Commons Attribution License (CC BY). The use, distribution or reproduction in other forums is permitted, provided the original author(s) and the copyright owner(s) are credited and that the original publication in this journal is cited, in accordance with accepted academic practice. No use, distribution or reproduction is permitted which does not comply with these terms.
*Correspondence: Phillip A. Morin, cGhpbGxpcC5tb3JpbkBub2FhLmdvdg==; Michael Hiller, bWljaGFlbC5oaWxsZXJAc2VuY2tlbmJlcmcuZGU=; Mark Blaxter, bWIzNUBzYW5nZXIuYWMudWs=; Erich D. Jarvis, ZWphcnZpc0BtYWlsLnJvY2tlZmVsbGVyLmVkdQ==
†Present address: Chiara Bortoluzzi, SIB Swiss Institute of Bioinformatics, Lausanne, Switzerland
‡These authors share last authorship