Abstract
The northern hard clam, Mercenaria mercenaria (Linnaeus, 1758), is an important ecological and economic resource along the U.S. Eastern Seaboard and is primarily limited to salinities above 25 ppt. Areas below 25 ppt or experiencing extended drops in salinity do not support growth or survival rates necessary for productive aquaculture. The purpose of this study was to better understand the molecular response of the hard clam to low salinity stress. In the spring of 2019 and 2021, the VIMS Eastern Shore Laboratory secured unique hard clam lines representative of the genetic diversity across the natural range along the US east coast. Salinity treatments of 35 ppt and 15 ppt were conducted for 26 hours in the summer of 2021 with two different age groups from eight clam lines. RNA sequencing data from either gill tissue (adults) or pooled whole-body tissue (juveniles) were used to assess the transcriptomic response of clams to short-term low salinity stress. This study found 545 genes in adult gills and 465 genes in juvenile whole-bodies that were significantly differentially expressed when clams were exposed to a salinity of 15 ppt versus 35 ppt. Heat shock, apoptosis, and cellular polarity genes were among the significantly differentially expressed genes, based on a log2 fold change > 1 and a false discovery rate < 0.05, and were both up and down regulated in response to 15 ppt versus 35 ppt. Pathways, including protein processing in the endoplasmic reticulum and fluid shear stress, were significantly enriched in response to 15 ppt versus 35 ppt. These results improve the understanding of how hard clams respond to low salinity stress and provide a foundation for further exploration of low salinity tolerance in hard clams to benefit the aquaculture industry.
Introduction
The northern hard clam, Mercenaria mercenaria (Linnaeus 1758, hereafter hard clam), is an infaunal species that plays key ecological roles as a filter feeder and prey item. It has been an important human food and economic resource along the U.S. Eastern Seaboard for millennia. Its life history has allowed Mercenaria to persist in the mid-Atlantic through multiple major climate change events and sea level fluctuations since the Upper Miocene (~5–20 MYA) (Palmer, 1927; Ward and Powars, 1989). In addition to historical and current wild harvests, the species supports a large aquaculture industry along its native range from the Gulf of Mexico to the Gulf of St. Lawrence and has been introduced to other regions of the world for aquaculture (Heppell, 1961; Hanna, 1966; Harte, 2001; Chew, 2001). Virginia is the largest producer of northern hard clams in the U.S., with farm gate sales estimated at $38.8 million in 2018 and $57.8 million in 2021 (Hudson and Virginia Sea Grant Marine Advisory Program, 2019; Snyder, 2021). Hard clam aquaculture is primarily limited to higher salinity areas (> 25 parts per thousand (ppt)) where clams grow at economically viable rates. Even in optimal salinity areas, hard clams are vulnerable to extreme precipitation events, which can cause extended hyposaline stress that exceeds their ability to close and wait for external conditions to improve, threatening natural and aquacultured hard clams. Climate change is predicted to impact the El Niño-Southern Oscillation (ENSO) and the North Atlantic Oscillation (NAO) variability, as well as tropical cyclones, increasing heavy rainfall events along the U.S. East Coast, which may cause rapid decreases in salinity, destabilizing coastal ecosystems (Karl and Trenberth, 2003; Durack et al., 2012).
The hard clam is considered a stenohaline species and inhabits high salinity estuarine and coastal marine environments, exhibiting an ability to survive in a range of habitats that are subject to fluctuating conditions (Palmer, 1927; Roegner and Mann, 1990; Harte, 2001). Hard clams are restricted to salinities above 12 ppt and are not abundant in waters below 18 ppt (Roegner and Mann, 1990). A true physiological lower salinity limit may be higher than the salinity averages for the reported natural distribution, given a behavioral response that allows the hard clam to temporarily escape adverse conditions by “clamming up.” The scope of hard clam salinity tolerance increases with age and tissue mass. Salinity tolerance for planktonic larvae has been reported to be between 20 and 35 ppt (Castagna and Chanley, 1973; Roegner and Mann, 1990), while juvenile clams can survive salinities as low as 15 ppt (Roegner and Mann, 1990; Baker et al., 2005). Adult hard clams can tolerate a salinity range from 12 to 45 ppt, but reproduction is inhibited below 15 ppt, and the optimal salinity for adult survival and growth is around 26–27 ppt (Davis, 1958; Loosanoff and Davis, 1963; Davis and Calabrese, 1964; Castagna and Chanley, 1973; Roegner and Mann, 1990).
Survival at acute or chronic low salinities has negative consequences for the overall health, growth rate, and reproductive success of marine bivalves. Although adult hard clams have been known to survive at 12 ppt, they do not grow (Carregosa et al., 2014; Roegner and Mann, 1990) and may remain “stunted” after recovery. As an osmoconformer, the internal medium of the hard clam fluctuates according to the osmolality of the environment and these shifts in salinity affect physiological responses (Deaton, 2008). Salinity affects the pumping rate of the gills of hard clams, and rates can fall from 8 L h-1 at optimal salinities down to < 1 L h-1 at 15 ppt (Hamwi, 1969). The gills of marine bivalves regulate oxygen consumption and food collection simultaneously. Water pumping is driven by cilia on the surface of the gills, thin membrane-bound structures with high surface-to-volume ratios that are immediately exposed to changing external conditions when the shellfish valves are open (Grizzle et al., 2001; Deaton, 2008). While studies have illuminated some of the physiological responses of the hard clam to shifts in salinity, the molecular mechanisms, including which genes are expressed under low salinity stress, are not well understood. Transcriptomics has been used in conjunction with breeding programs in other organisms to enhance tolerance to environmental conditions (Niu et al., 2013; Zhang et al., 2019; Cleveland et al., 2020). The identification of key genes that respond to low salinity stress is a first step in exploring the potential for breeding hard clams robust to low salinity. The availability of lower salinity lines would allow for the expansion of the hard clam aquaculture industry into lower salinity waters and provide an understanding of how the species may acclimate to predicted increases in short-term low salinity stress events induced by climate change.
Previous studies have identified genes and gene families expressed within the hard clam genome under other environmental stressors (i.e., heat and hypoxia) (Song et al., 2021; Hu et al., 2022; Song et al., 2022) and long-term salinity challenges (Zhou et al., 2022; Zeng et al., 2024). Our work used shorter exposure times (26 hours) to focus on the initial response to low salinity stress. The objective of this current study was to identify key genes expressed in the gills of adults and whole bodies of juvenile hard clams and identify cellular pathways involved in the response to short-term low salinity stress.
Materials and methods
Salinity experiments
The clam lines used in salinity challenge experiments were reared at the VIMS Eastern Shore Laboratory (ESL) in the Castagna Shellfish Research Hatchery from wild broodstock groups collected from six geographic locations representing the north-south distribution of the species along the Atlantic coast and two low salinity populations from Chesapeake Bay: 1) Cape Cod, Massachusetts (CC), 2) Wachapreague Virginia (WC), 3) Great Bay, New Jersey (NJ), 4) Pocomoke Sound, Virginia (PS), 5) Mobjack Bay, Virginia (MB), and 6) Bogue Sound, North Carolina (NC). The genetic characterization of these populations can be found in Ropp et al. (2023). The MB and PS populations represented the lowest salinity stocks growing on the eastern and western sides of Chesapeake Bay and were not found to be genetically distinct from one another in Ropp et al. (2023). Likewise, WC and NJ coastal populations were not found to be significantly genetically different, and their genetic composition reflected the mixing of alleles from northern (CC) and southern (NC) M. mercenaria populations. In April 2019, spawns of WC, PS, MB, NJ, and CC were separately made, and the resulting progeny were considered adults at the time of these experiments as their age and size indicated they were at or near sexual maturity (Supplementary Table 1). In April of 2021, crosses between lines were made as WC x WC, WC x PS, and NC x CC, and the resulting F1 individuals will be referred to as juveniles (Supplementary Figure 1). These crosses were created to study how the genetic combination of populations from high and low salinity environments (WC x PS), and warm and cold-water environments (NC x CC) respond to different stressors as part of a NOAA Sea Grant award to R. Snyder et al., VIMS (NA17OAR4170228).
In June of 2021, individuals from each of the five clam lines produced in 2019 (adults) were taken from ESL clam beds off Wachapreague, Virginia, placed in labeled line-specific bags of ~50 animals/bag, and housed in a Taylor Float off the ESL dock until salinity experiments began. Salinities ranged from 25–35 ppt in Wachapreague Channel. Experimental salinity conditions included 35 ppt and 15 ppt and were chosen based on the salinity tolerance range of adult (12–45 ppt) and juvenile (15–35 ppt) clams (Roegner and Mann, 1990). The control salinity of 35 ppt was selected based on the salinity (25–35 ppt) experienced by hard clams in the waters around Wachapreague, Virginia. Experimental waters were 1.0 μm filtered, UV-treated seawater diluted with DI water as appropriate to attain the desired salinity. For each salinity condition, four clams (8 in total/bag) were randomly selected from each of the five line-specific bags and held in five beakers containing 900 ml of 35 ppt UV treated, filtered seawater with an air stone for 1 to 6 hours before experiments began. All clams used in experiments were held for the same amount of time before the experiments were initiated. Ammonia levels in the beakers were monitored before each experiment to keep concentrations below 0.25 ppm. At the beginning of the experiment, the four adult clams from each line were put into beakers containing 900 ml of water at the experimental salinity condition (10 beakers total). Each beaker was placed in a water table of 25°C circulating, shallow fresh water. Each beaker included an air stone and the water was changed every 12 hrs. After 26 hrs. of exposure to the designated salinity condition, three clams were randomly selected from each beaker for sampling. A total of 30 mg of gill tissue was quickly harvested from each clam and preserved in a separate microfuge tube containing 300 μl of RNAprotect Reagent (QIAGEN, Valencia, CA) to create three technical replicates for each clam line by salinity condition. The shell height of each sampled clam was measured using a caliper and recorded in millimeters to the second decimal place. No mortality was observed among the clams used in the experiments. All tissue samples were stored at -20°C at the VIMS ESL, transported in a cooler back to the VIMS Gloucester Point campus, and stored at -80°C until RNA was isolated.
In June 2021, ~70-day old juvenile clams were taken from upwellers (~32 ppt), placed in 35 ppt UV treated, filtered seawater, and cleaned. For each salinity treatment, three replicates of ten clams were made for each of the three clam lines (18 sets in total). Experimental salinity conditions included 35 and 15 ppt. Each clam in each replicate was imaged and measured using ImageJ software (Schneider et al., 2012). All 18 replicates (3 clam lines x 3 replicates x 2 salinity treatments) were placed into separate PVC pipe sieves and a replicate from each clam line was placed in a tank containing 6400 ml of seawater at the experimental salinity condition with an air stone (6 tanks with 3 PVC sieves). Treatment tanks were placed in a water table of circulating shallow fresh water that regulated temperature at 25°C. After 26 hrs. of exposure, four of the ten clams for each line by treatment and replicate were randomly selected. No mortality was observed among the clams used in the experiments. Due to their small size, gill tissue alone could not be harvested, so all soft tissue from the four juvenile clams was pooled to reach the minimum amount of tissue needed for each sample (30mg). Pooled tissue (30mg) was preserved, stored, and transferred in the same manner as the adult tissues.
Sample preparation and sequencing
A total of 48 samples were selected for RNA-Seq and included technical replicates (n=3) for each salinity (n=2) and each adult line (n=5) and juvenile line (n=3) (Supplementary Tables 2 and 3). Tissue samples were placed in 2 ml RNase Free PowerBead Tubes with 1.4 mm ceramic beads and 350 μl of Buffer RTL (QIAGEN, Valencia, CA). Tissue samples were lysed and homogenized using the FastPrep-24 (MP Biomedicals, Irvine, CA) set to 4.0 m/s for 2 rounds of 20 seconds. Total RNA was extracted from the homogenate using the RNeasy extraction kit following the recommended protocol (QIAGEN, Valencia, CA). RNase-free DNase I (Thermo Fisher Scientific, Waltham, MA), was used to degrade genomic DNA in the total RNA samples. RNA purity was checked by assessing A260/280 and A260/230 ratios using a NanoDropTM 2000 spectrophotometer (Thermo Fisher Scientific), and total RNA concentration was measured with the QubitTM 4.0 Fluorometer (Invitrogen). Approximately 30 μl of total RNA (see results for RNA concentration range) from each sample was sent to Novogene Corporation Inc. (Sacramento, CA) for library preparation and sequencing on an Illumina NovaSeq PE150 (6 G raw data per sample).
Filtering and alignment of sequences
The raw RNA-Seq data received from Novogene were transferred to a William & Mary high performance computing (HPC) account and uploaded to the National Center for Biotechnology Information (PRJNA854038) Sequence Read Archive (SRA). The quality of the sequences in each sample was checked using FastQC v0.11.9 (Andrews, 2010) and summarized using MultiQC v1.4 (Ewels et al., 2016). Adapters and poly-A tails were trimmed using Trimmomatic v0.36 with specifications to use truseq3-pe-2.fa adapter sequences, remove the first 10 nucleotides of each read, remove the first and last nucleotides of a read if they fell below a quality of 3, remove reads less than 36 base pairs long, and scan the read with a 4-base wide sliding window, cutting when the average quality per base dropped below 25 (illuminaclip = truseq3-pe-2.fa:2:30:10:2:true, headcrop = 10, leading = 3, trailing = 3, minlen = 36, slidingwindow = 4:25) (Bolger et al., 2014). After trimming, the quality was rechecked using FastQC (Andrews, 2010) and summarized using MultiQC (Ewels et al., 2016). The hard clam reference genome and gene annotation files from Song et al. (2021) were downloaded from NCBI (https://www.ncbi.nlm.nih.gov/bioproject/783326). The genome and annotation files were indexed using the faidx command in Samtools v1.3.1 (Li et al., 2009). The genome was indexed, and sequenced reads (FASTQ files) were mapped to the indexed reference genome using HISAT2 v2.2.1 (Kim et al., 2019). Alignment quality was assessed using Qualimap v2.2.1 (García-Alcalde et al., 2012) and the stats command in Samtools v1.15.1 (Danecek et al., 2021) and summarized using MultiQC (Ewels et al., 2016). HTSeq (Putri et al., 2022) was implemented using Anaconda v2021.11 (Anaconda Software Distribution, 2021) to count the number of reads mapped to each feature or gene using the sequenced read alignments from HISAT2 v2.2.1 and the gene annotation GFF file from NCBI. Read fragments were assigned to the exons of a gene, and because whole mRNA/genes were of interest for this study, exons with the same gene accession or locus tag were combined, and the counts were summed.
Principal component analysis
Count data from HTSeq was imported using the R package: DESeq2 v1.36.0 (Love et al., 2014) as implemented in Bioconductor v3.15. After importing read count data, adult and juvenile data were analyzed separately. The R package tidyverse v1.3.2 was used (Wickham et al., 2019) to ensure that analyses were reproducible. Features/genes that had less than 10 counts across samples were excluded. For both adult and juvenile clam samples, separate variance stabilizing transformation (VST) (Anders and Huber, 2010), regularized-logarithm transformation (RLT) (Love et al., 2014), and generalized linear model principal component analysis (PCA) (GLMPCA) (Townes et al., 2019) were conducted using the following programs implemented in R: DESeq2 v1.36.0 (Love et al., 2014), glmpca v0.2.0 (Townes et al., 2019) and ggplot2 v3.3.6 (Slowikowski, 2021). All three data transformations were used to assess if any transformations altered PCA outputs and to identify outliers. One sample, 15_WC_G_3 (the third replicate for the 15 ppt WC experiment), was an outlier within FastQC, Qualimap, Samtools, and GLMPCA outputs (but not VST or RLT) and was removed from all subsequent analyses.
Gene expression analysis
Deseq2 was used to identify genes differentially expressed between 15 ppt and 35 ppt in the gill tissues of adult clams and the whole bodies of juvenile clams. DESeq2 uses a shrinkage estimator and a negative binomial distribution to calculate dispersion and fold change. The shrinkage estimator apeglm v1.18.0 (Zhu et al., 2018) in R was used for all analyses. Apeglm takes genes with high dispersion or low counts and shrinks the log2 fold change closer to 0. Differentially expressed genes (DEGs) were defined as those transcripts with an absolute log2 fold change (LFC) > 1 and a false discovery rate (FDR) < 0.05 (Benjamini and Hochberg, 1995). For both adults and juveniles, all retained clam lines and samples were included, but clam line as a variable was not included in the two models (design = ~ salinity). To visualize genes with an absolute LFC > 1 and FDR < 0.05, volcano plots were created using EnhancedVolcano v1.14.0 (Blighe et al., 2022) in R. A Venn diagram was created to examine overlap in DEGs among the adults and juveniles using VennDiagram v1.7.3 (Chen, 2022) in R.
KEGG enrichment analysis
To identify possible pathways that the products of DEGs could be involved in, protein sequences translated from each gene, which were features that started with “XM_” and had an absolute LFC > 1 and FDR < 0.05, were obtained in FASTA format from NCBI using gene accession numbers and rentrez v1.2.3 (Winter, 2017) in R. This included both up and down-regulated genes. Protein sequences were then uploaded to BlastKOALA and Kyoto Encyclopedia of Genes and Genomes (KEGG) Orthology (KO) identifiers (K numbers) were assigned to genes encoding those proteins (Kanehisa et al., 2016, 2021). K numbers were then used with clusterProfiler v4.2.1 (Wu et al., 2021) in R to conduct KEGG pathway over-representation analysis and KEGG module over-representation analysis. The Benjamini-Hochberg method was used to adjust p-values. Different pathways and LFC visualizations were created using pathview v1.36.0 (Luo and Brouwer, 2013) in R.
The gene and protein name terminology will be used in accordance with the following criteria: italics will be used for genes (e.g., HSP70, Hsp72). Non-italics will be used for proteins (e.g., HSP70, Hsp72). Capital letters will refer to the whole protein or gene family (e.g., HSP70, HSP70). Lowercase letters will refer to a specific protein or gene from a family (e.g., Hsp72, Hsp72).
Results
Sample quality and quantity
Quality and quantity assessments were performed on RNA samples before being sent to Novogene for sequencing. Samples had a mean A260/280 of 2.08 with a range from 2.00 to 2.22 and a mean A260/230 of 1.24 with a range from 0.43 to 2.23 based on NanoDrop measurements. The mean RNA concentration was 88.33 ng/μl (57.7 to 118.5 ng/μl) based on Qubit measurements and all were above the RNA concentration value required by Novogene. Although some 260/230 values were low, they all were within the limits set by Novogene for sequencing. Novogene performed quality and quantity assessment and reported a mean RNA concentration of 112.9 ng/μl (74.13 to 173.89 ng/μl). The mean RNA integrity number (RIN) was 7.48 and ranged from 3.4 to 9.1, with only one sample below the desired threshold value of 4 (Supplementary Tables 2 and 3). All samples were of sufficient quality and quantity for library preparation and sequencing. After sequencing, Novogene reported the mean number and standard deviation of raw reads to be 4.76E+07 ± 5.69E+06, the mean size and standard deviation of raw data to be 7.15 ± 0.85 Gb, the total size of raw data to be 340 Gb, the mean effective percent to be 97.95 ± 0.44, the mean error percent to be 0.0290 ± 0.0031, the mean Q20 and Q30 percent to be 97.90 ± 0.12 and 93.89 ± 0.31 respectively, and the mean GC content to be 38.26 ± 1.42. Sequencing and alignment quality metrics for each sample can be found in Supplementary Tables 4 and 5.
After sequences were filtered and trimmed to remove adaptors and retain only high-quality sequence fragments, reads were aligned to the hard clam genome, and the resulting alignment quality metrics were summarized. One sample, Wachapreague replicate 3 from the 15 ppt experiment (Wach_3_G_15 or A_3_15), was a consistent outlier in all quality checks. This sample had the highest GC content (46%), the second highest duplication of reads (77-79.2%), the lowest overrepresented sequences (0%), the highest 5’-3’ bias (7.18), the highest mapping percent (85.3%), and the highest percent of reads mapped to exonic regions (88.2%) and was removed from all subsequent analysis. After this sample was removed, the average GC content was 37% (36% to 39%), the average read duplication was 60.79% (53% to 90%), the average of overrepresented sequences was 0.38% (0.14% to 1.36%), and the average number of sequences per sample was 23.6 million (19.40 to 30.60 million). From the alignment summaries, the average 5’-3’ bias was 1.40 (1.24 to 1.60), the average percent of reads mapped to exonic regions was 74.16% (66.38% to 78.93%), and the average reads aligned per sample was 38.08 million (30.80 to 51.20 million). The average error rate was 0.60% (0.53% to 0.67%), and the average mapped percentage was 80.76% (77.60% to 85.30%).
PCA
The PCA identified the main axis of variance patterns and outliers among samples. In the VST PCA based on the adult clam samples, 12% of the variance was explained by PC1 and 10% by PC2. (Figure 1). Similarly, in the RLT PCA for the adults, 12% of the variance was explained by PC1 and 11% by PC2. In the VST PCA for the juvenile clam samples, 28% of the variance was explained by PC1 and 18% by PC2 (Figure 2), while in the RLT PCA for the juveniles, 28% of the variance was explained by PC1 and 18% by PC2 (Supplementary Figure 2). The VST and RLT PCAs clustered the WC x WC and WC x PS juvenile samples differently. For the VST PCA, samples are grouped by salinity treatment first, then by clam line, whereas in the RLT PCA, samples grouped by clam line first, then by salinity treatment. The GLMPCA had a similar pattern to the RLT PCA.
Figure 1

Variance stabilizing transformation PCA of PC1 & PC2 for adult clam samples lines totaling 22% of the variance explained. Sample 15_Wach_G_3 was removed as an outlier and is not included in this PCA.
Figure 2
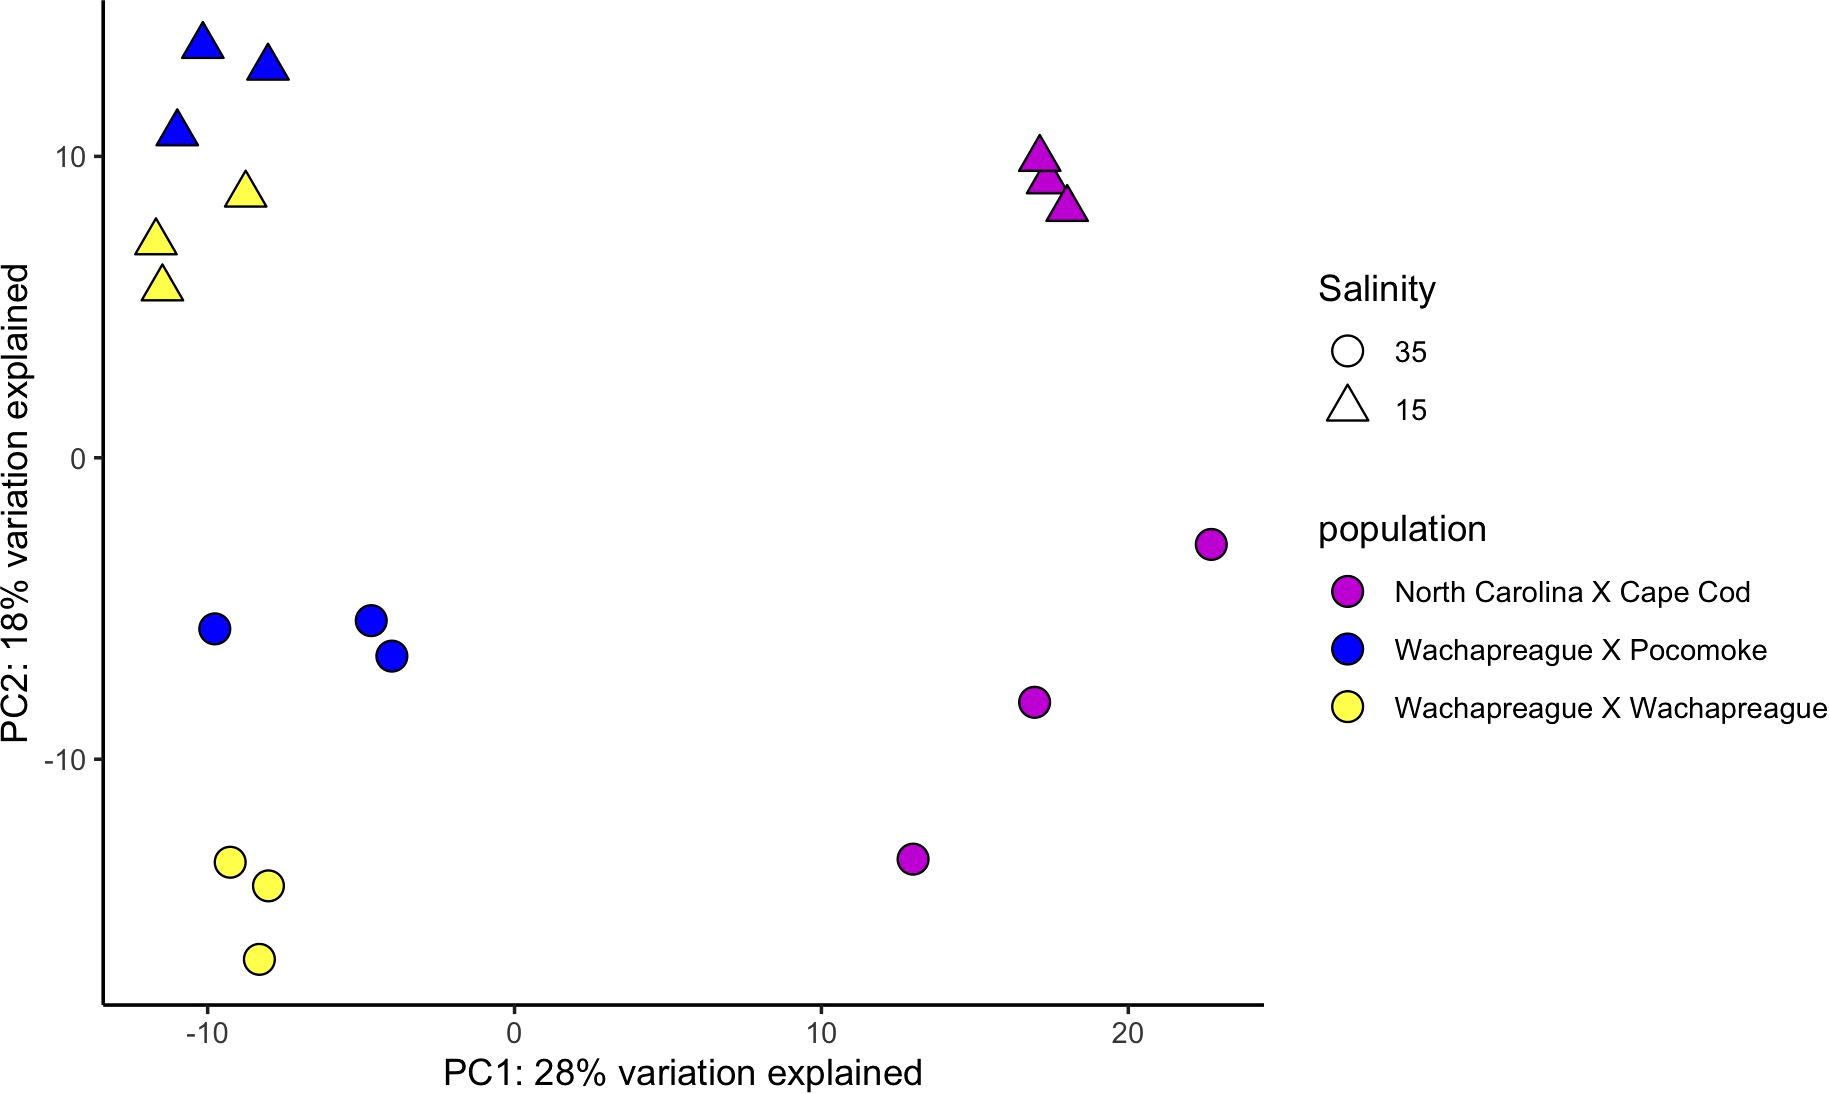
Variance stabilizing transformation PCA of PC1 & PC2 for juvenile clam samples lines totaling 46% of the variance explained.
Response to low salinity in adult gills
In total, 545 genes were significantly differentially expressed (DEG) between the 15 and 35 ppt treatments within the adults. Of the 545 DEGs, 408 (74.9%) were up-regulated, and 137 (25.1%) were down-regulated in the 15 ppt treatment (Figure 3) relative to the 35 ppt treatment. Genes of interest that were significantly differentially expressed included heat shock protein genes, all of which were up-regulated in response to 15 ppt compared to 35 ppt, along with inhibitors of apoptosis genes and a sodium/potassium/calcium exchanger gene, which were also up-regulated at 15 ppt. Specific genes identified and discussed as potentially important for stress response in adults can be found in Table 1. All significantly differentially expressed genes can be found in Supplementary Table 6.
Figure 3
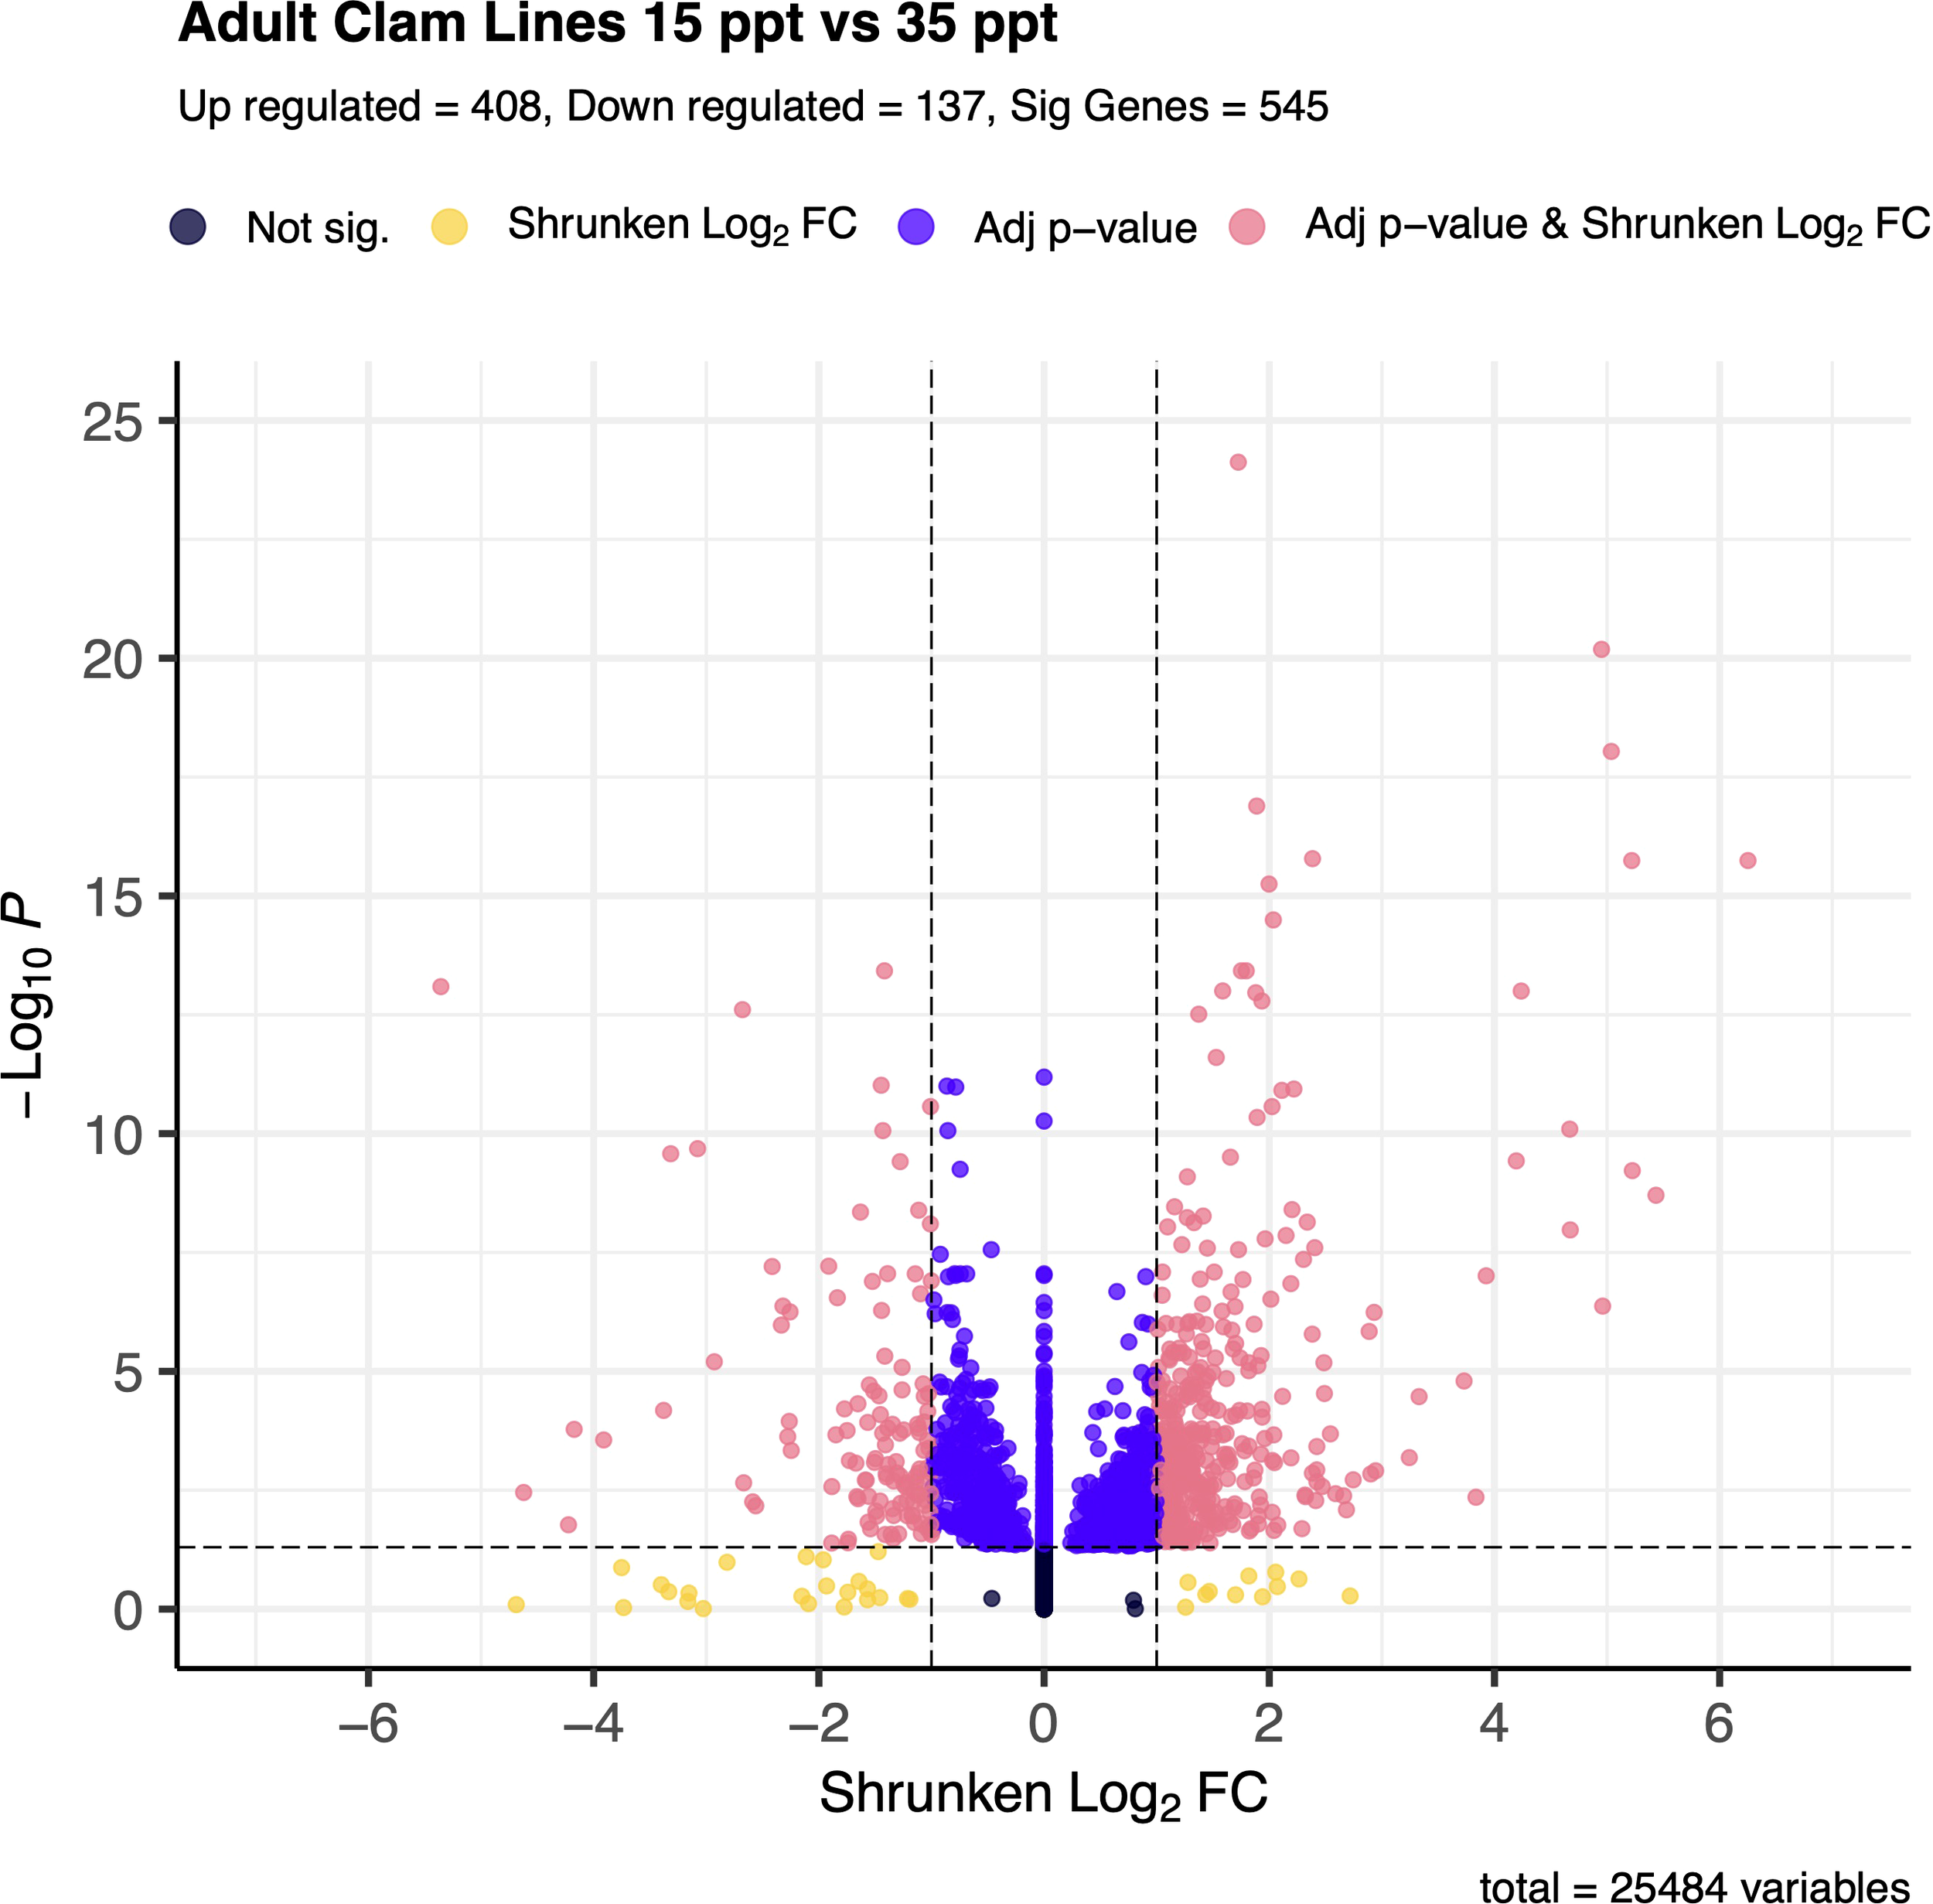
Volcano plot of gene expression between 15 ppt and 35 ppt in adult clams. The -log(base 10) of the adjusted p-value is on the y-axis and the Shrunken LFC is on the x-axis. Dots in black represent genes that fall outside the FDR and LFC thresholds. Dots in yellow represent genes that have an absolute LFC >1 but have an FDR > 0.05. Dots in indigo represent genes that have an FDR < 0.05 but have an absolute LFC < 1. Dots in coral represent genes that are significantly differentially expressed between 15 and 35 ppt and make up a total of 545 genes. Of those, 408 are up-regulated in 15 ppt, and 137 are down-regulated in 15 ppt.
Table 1
| Category | Gene | Name | Base Mean | LFC | LFC SE | pvalue | padj |
|---|---|---|---|---|---|---|---|
| Heat Shock Protein | XM_045306916.1 | alpha-crystallin A chain-like (LOC123527454) | 967.5722 | 2.3841 | 0.2702 | 5.79E-20 | 1.65E-16 |
| XM_045360456.1 | heat shock protein beta-1-like (LOC123566409) | 313.6829 | 1.9976 | 0.2315 | 2.97E-19 | 5.63E-16 | |
| XM_045329467.1 | heat shock protein HSP 90-beta-like (LOC123543395) | 7009.5196 | 1.7524 | 0.2156 | 2.47E-17 | 3.76E-14 | |
| XM_045309476.1 | heat shock protein 70 B2-like LOC123529238 | 74.0467 | 5.4345 | 0.8427 | 4.98E-12 | 1.97E-09 | |
| XM_045309466.1 | heat shock protein 70 B2-like LOC123529228 | 77.6202 | 5.2242 | 0.7878 | 1.44E-12 | 6.00E-10 | |
| XM_045309457.1 | heat shock protein 70 B2-like (LOC123529220) | 53.3039 | 4.9606 | 0.9129 | 2.34E-09 | 4.24E-07 | |
| XM_045309308.1 | heat shock protein 70 B2-like (LOC123529101) | 41.1542 | 4.6686 | 0.6699 | 1.51E-13 | 8.03E-11 | |
| XM_045349252.1 | heat shock 70 kDa protein-like (LOC123557647) | 1432.4367 | 1.4876 | 0.3471 | 7.78E-07 | 5.89E-05 | |
| XM_045320928.1 | endoplasmic reticulum chaperone BiP-like (LOC123537239) | 4075.9109 | 2.2186 | 0.3046 | 1.76E-14 | 1.15E-11 | |
| Inhibitors of Apoptosis | XM_045346781.1 | baculoviral IAP repeat-containing protein 7-A-like (LOC123556206) | 1361.1375 | 4.6732 | 0.7584 | 3.35E-11 | 1.06E-08 |
| XM_045346799.1 | putative inhibitor of apoptosis (LOC123556214) | 1624.4682 | 3.9261 | 0.6845 | 4.36E-10 | 9.77E-08 | |
| Solute Carrier | XM_045332571.1 | probable sodium/potassium/calcium exchanger CG1090 (LOC123546367) | 2.5555 | 3.7298 | 0.8998 | 1.61E-07 | 1.60E-05 |
Adult hard clam characterized genes of interest with significantly different expression levels between 35 and 15 ppt exposure.
Category refers to gene family. Gene is the NCBI Accession number. Name is the name given for each feature on NCBI. Base mean is the average of the normalized count values, divided by the size factor, taken over all the samples. LFC is the log2 fold change. LFC SE is the LFC standard error. The pvalue is the Wald test p-value, where the null hypothesis is that there is no effect of treatment on the gene. The padj is the adjusted p-value based on the Benjamini-Hochberg method, or false discovery rate (FDR).
Response to low salinity in whole-body of juveniles
Overall, 465 genes were significantly differentially expressed between the 15 and 35 ppt treatments within the juveniles. Of those, 303 (65.2%) were up-regulated and 162 (34.8%) were down-regulated in the 15 ppt treatment (Figure 4) relative to the 35 ppt treatment. Many genes in the inhibitor of apoptosis family were differentially expressed and were both down and up-regulated at 15 ppt versus 35 ppt. Many solute carrier genes were also significantly differentially expressed, and those mentioned in the discussion were all up-regulated. Specific genes identified and discussed as potentially important for stress response in juveniles can be found in Table 2. All significantly differentially expressed genes can be found in Supplementary Table 7.
Figure 4
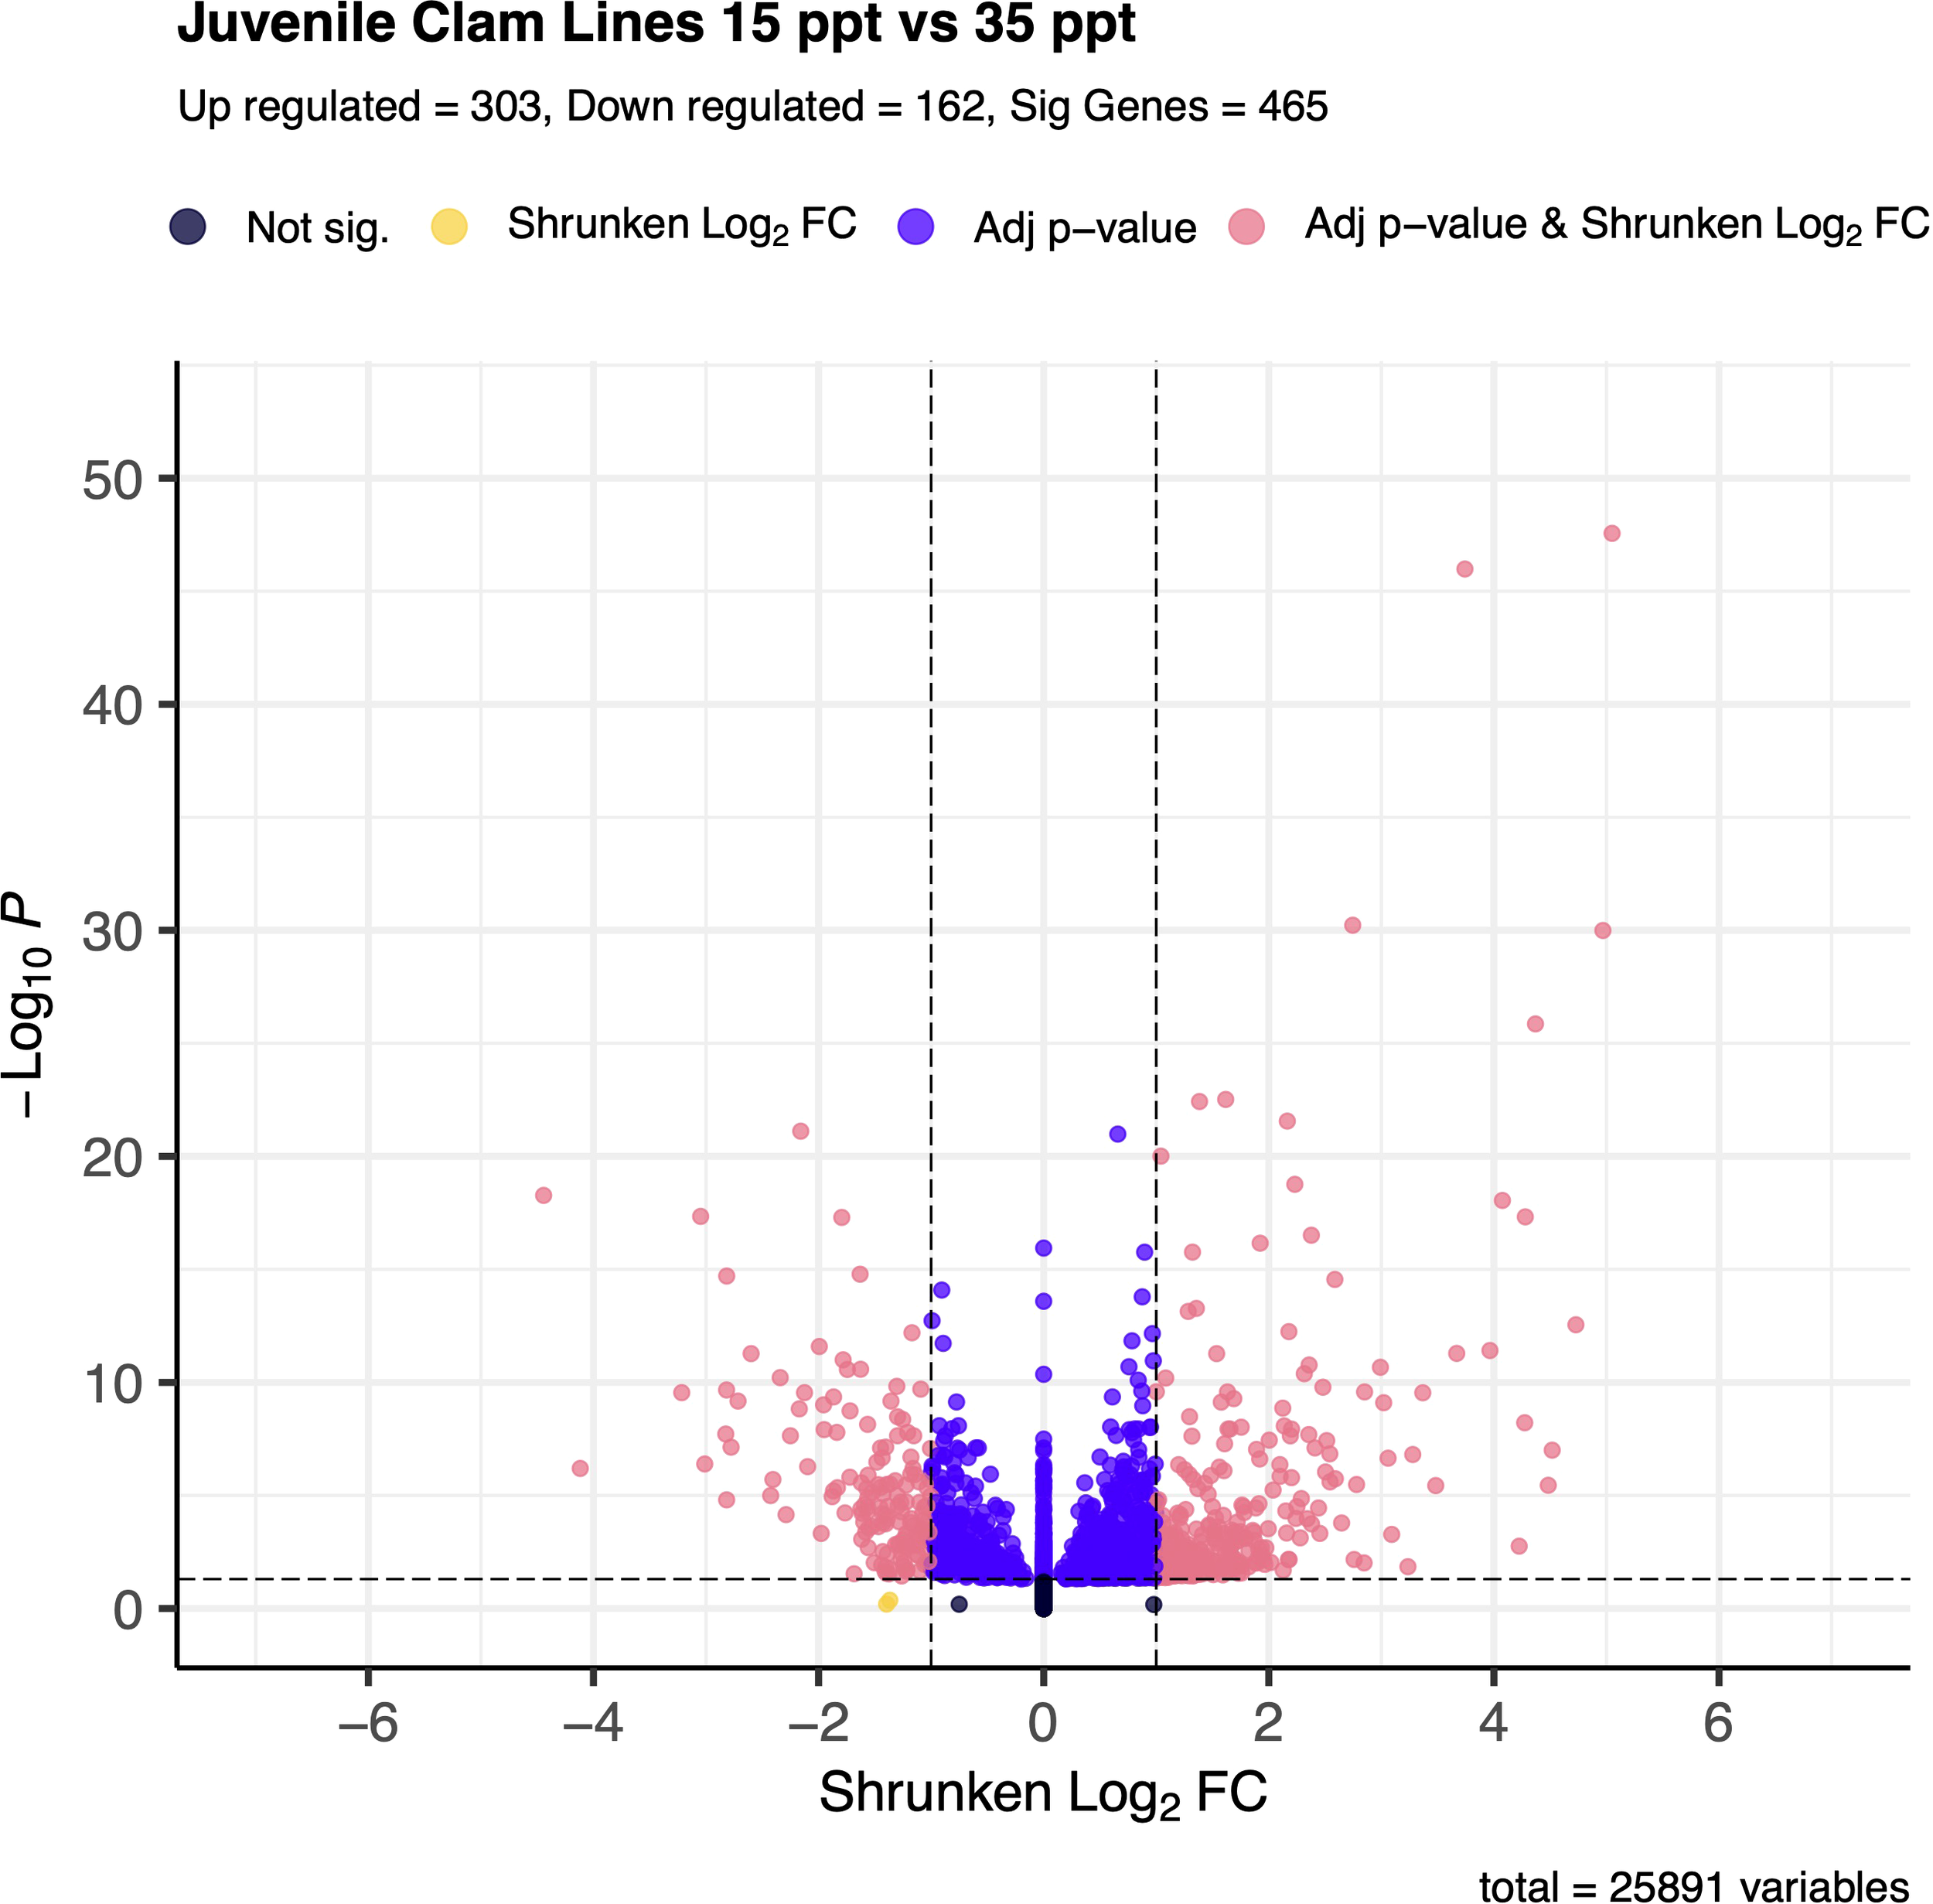
Volcano plot of gene expression between 15 ppt and 35 ppt in juvenile clams. The -log(base 10) of the adjusted p-value is on the y-axis and the Shrunken LFC is on the x-axis. Dots in black represent genes that fall outside the FDR and LFC thresholds. Dots in yellow represent genes that have an absolute LFC >1 but have an FDR > 0.05. Those dots in indigo represent genes that have an FDR < 0.05 but have an absolute LFC < 1. Dots in coral represent genes that are significantly differentially expressed between 15 and 35 ppt and make up a total of 465 genes. Of those, 303 are up-regulated in 15 ppt, and 162 are down-regulated in 15 ppt.
Table 2
| Category | Gene | Name | Base Mean | LFC | LFC SE | pvalue | padj |
|---|---|---|---|---|---|---|---|
| Solute Carrier | XM_045351851.1 | Sodium-dependent phosphate transport protein 2B-like (LOC123559775) | 618.4400 | 3.7424 | 0.2534 | 1.20E-50 | 1.04E-46 |
| XM_045360561.1 | solute carrier family 12 member 3-like (LOC123566450) | 242.2278 | 2.7458 | 0.2280 | 1.03E-34 | 5.95E-31 | |
| XM_045308299.1 | sodium- and chloride-dependent GABA transporter 2-like (LOC123528532) | 38.4478 | 1.0593 | 0.2578 | 1.53E-06 | 7.83E-05 | |
| XM_045305991.1 | sodium- and chloride-dependent glycine transporter 1-like (LOC123526743) | 138.1374 | 1.1652 | 0.3239 | 1.20E-05 | 4.51E-04 | |
| XM_045338374.1 | sodium- and chloride-dependent glycine transporter 2-like (LOC123549924) | 4.5533 | 1.6512 | 0.7976 | 0.0010 | 0.0155 | |
| XM_045344695.1 | monocarboxylate transporter 13-like (LOC123554495) | 50.0973 | 1.7188 | 0.4391 | 3.34E-06 | 1.53E-04 | |
| XM_045332154.1 | sodium-coupled monocarboxylate transporter 1-like (LOC12354964) | 5.6023 | 1.6342 | 0.8882 | 0.0015 | 0.0209 | |
| XM_045315108.1 | sodium-coupled monocarboxylate transporter 2-like (LOCI123533465) | 4.8454 | 1.2529 | 0.7897 | 0.0024 | 0.0286 | |
| Inhibitors of Apoptosis | XM_045346781.1 | baculoviral IAP repeat-containing protein 7-A-like (LOC123556206) | 338.9549 | 4.0756 | 0.4384 | 7.20E-22 | 8.92E-19 |
| XM_045344029.1 | baculoviral IAP repeat-containing protein 2-like (LOC123554115) | 129.7698 | -1.9935 | 0.2690 | 5.64E-15 | 2.57E-12 | |
| XM_045346799.1 | putative inhibitor of apoptosis (LOC123556214) | 288.4672 | 3.6696 | 0.5025 | 1.20E-14 | 5.21E-12 | |
| XM_045346777.1 | baculoviral IAP repeat-containing protein 3-like (LOC123556203) | 244.5211 | -1.3569 | 0.2074 | 2.67E-12 | 6.70E-10 | |
| XM_045328576.1 | procathepsin L-like (LOC123542641) | 39.0956 | -1.5724 | 0.3275 | 6.61E-08 | 4.96E-06 | |
| XM_045339860.1 | baculoviral IAP repeat-containing protein 3-like (LOC1235511142) | 90.5763 | 1.21417 | 0.2929 | 1.36E-06 | 7.12E-05 | |
| XM_045340036.1 | baculoviral IAP repeat-containing protein 3-like (LOC123551253) | 95.8502 | 2.2407 | 0.5570 | 2.10E-06 | 1.04E-04 | |
| XM_045339865.1 | baculoviral IAP repeat-containing protein 3-Like (LOC123551145) | 22.4733 | 1.5154 | 0.4461 | 2.41E-05 | 8.06E-04 | |
| XM_045323272.1 | inhibitor of apoptosis protein-like (LOC123538866) | 9.3151 | -1.3985 | 0.9127 | 0.0022 | 0.0274 | |
| XM_045339994.1 | E3 ubiquitin-protein ligase XIAP-like (LOC123551228) | 19.2917 | -1.3754 | 0.9850 | 0.0025 | 0.0295 |
Juvenile hard clam characterized genes with significantly different expression levels between 35 and 15 ppt exposure.
Category refers to gene family. Gene is the NCBI Accession number. Name is the name given for each feature on NCBI. Base mean is the average of the normalized count values, divided by the size factor, taken over all the samples. LFC is the log2 fold change. LFC SE is the LFC standard error. The pvalue is the Wald test p-value, where the null hypothesis is that there is no effect of treatment on the gene. The padj is the adjusted p-value based on the Benjamini-Hochberg method, or false discovery rate (FDR).
The overlapping DEGS between adults and juveniles
When DEGs from the adults (n=545) and juveniles (n=465) were compared, 71 genes were commonly differentially expressed between the two life stages (Figure 5, Supplementary Table 8). These 71 genes made up 13.03% of adult genes and 15.27% of the juvenile genes. Of these 71 genes, 55 were up-regulated, and 15 were down-regulated in all clams exposed to 15 ppt versus 35 ppt. A single uncharacterized non-coding RNA gene was up-regulated in juveniles and down-regulated in adults when exposed to the 15 ppt treatment relative to the 35 ppt treatment. A wide variety of genes were identified among these 71 including heat shock protein, inhibitors of apoptosis, and solute carrier specific genes.
Figure 5
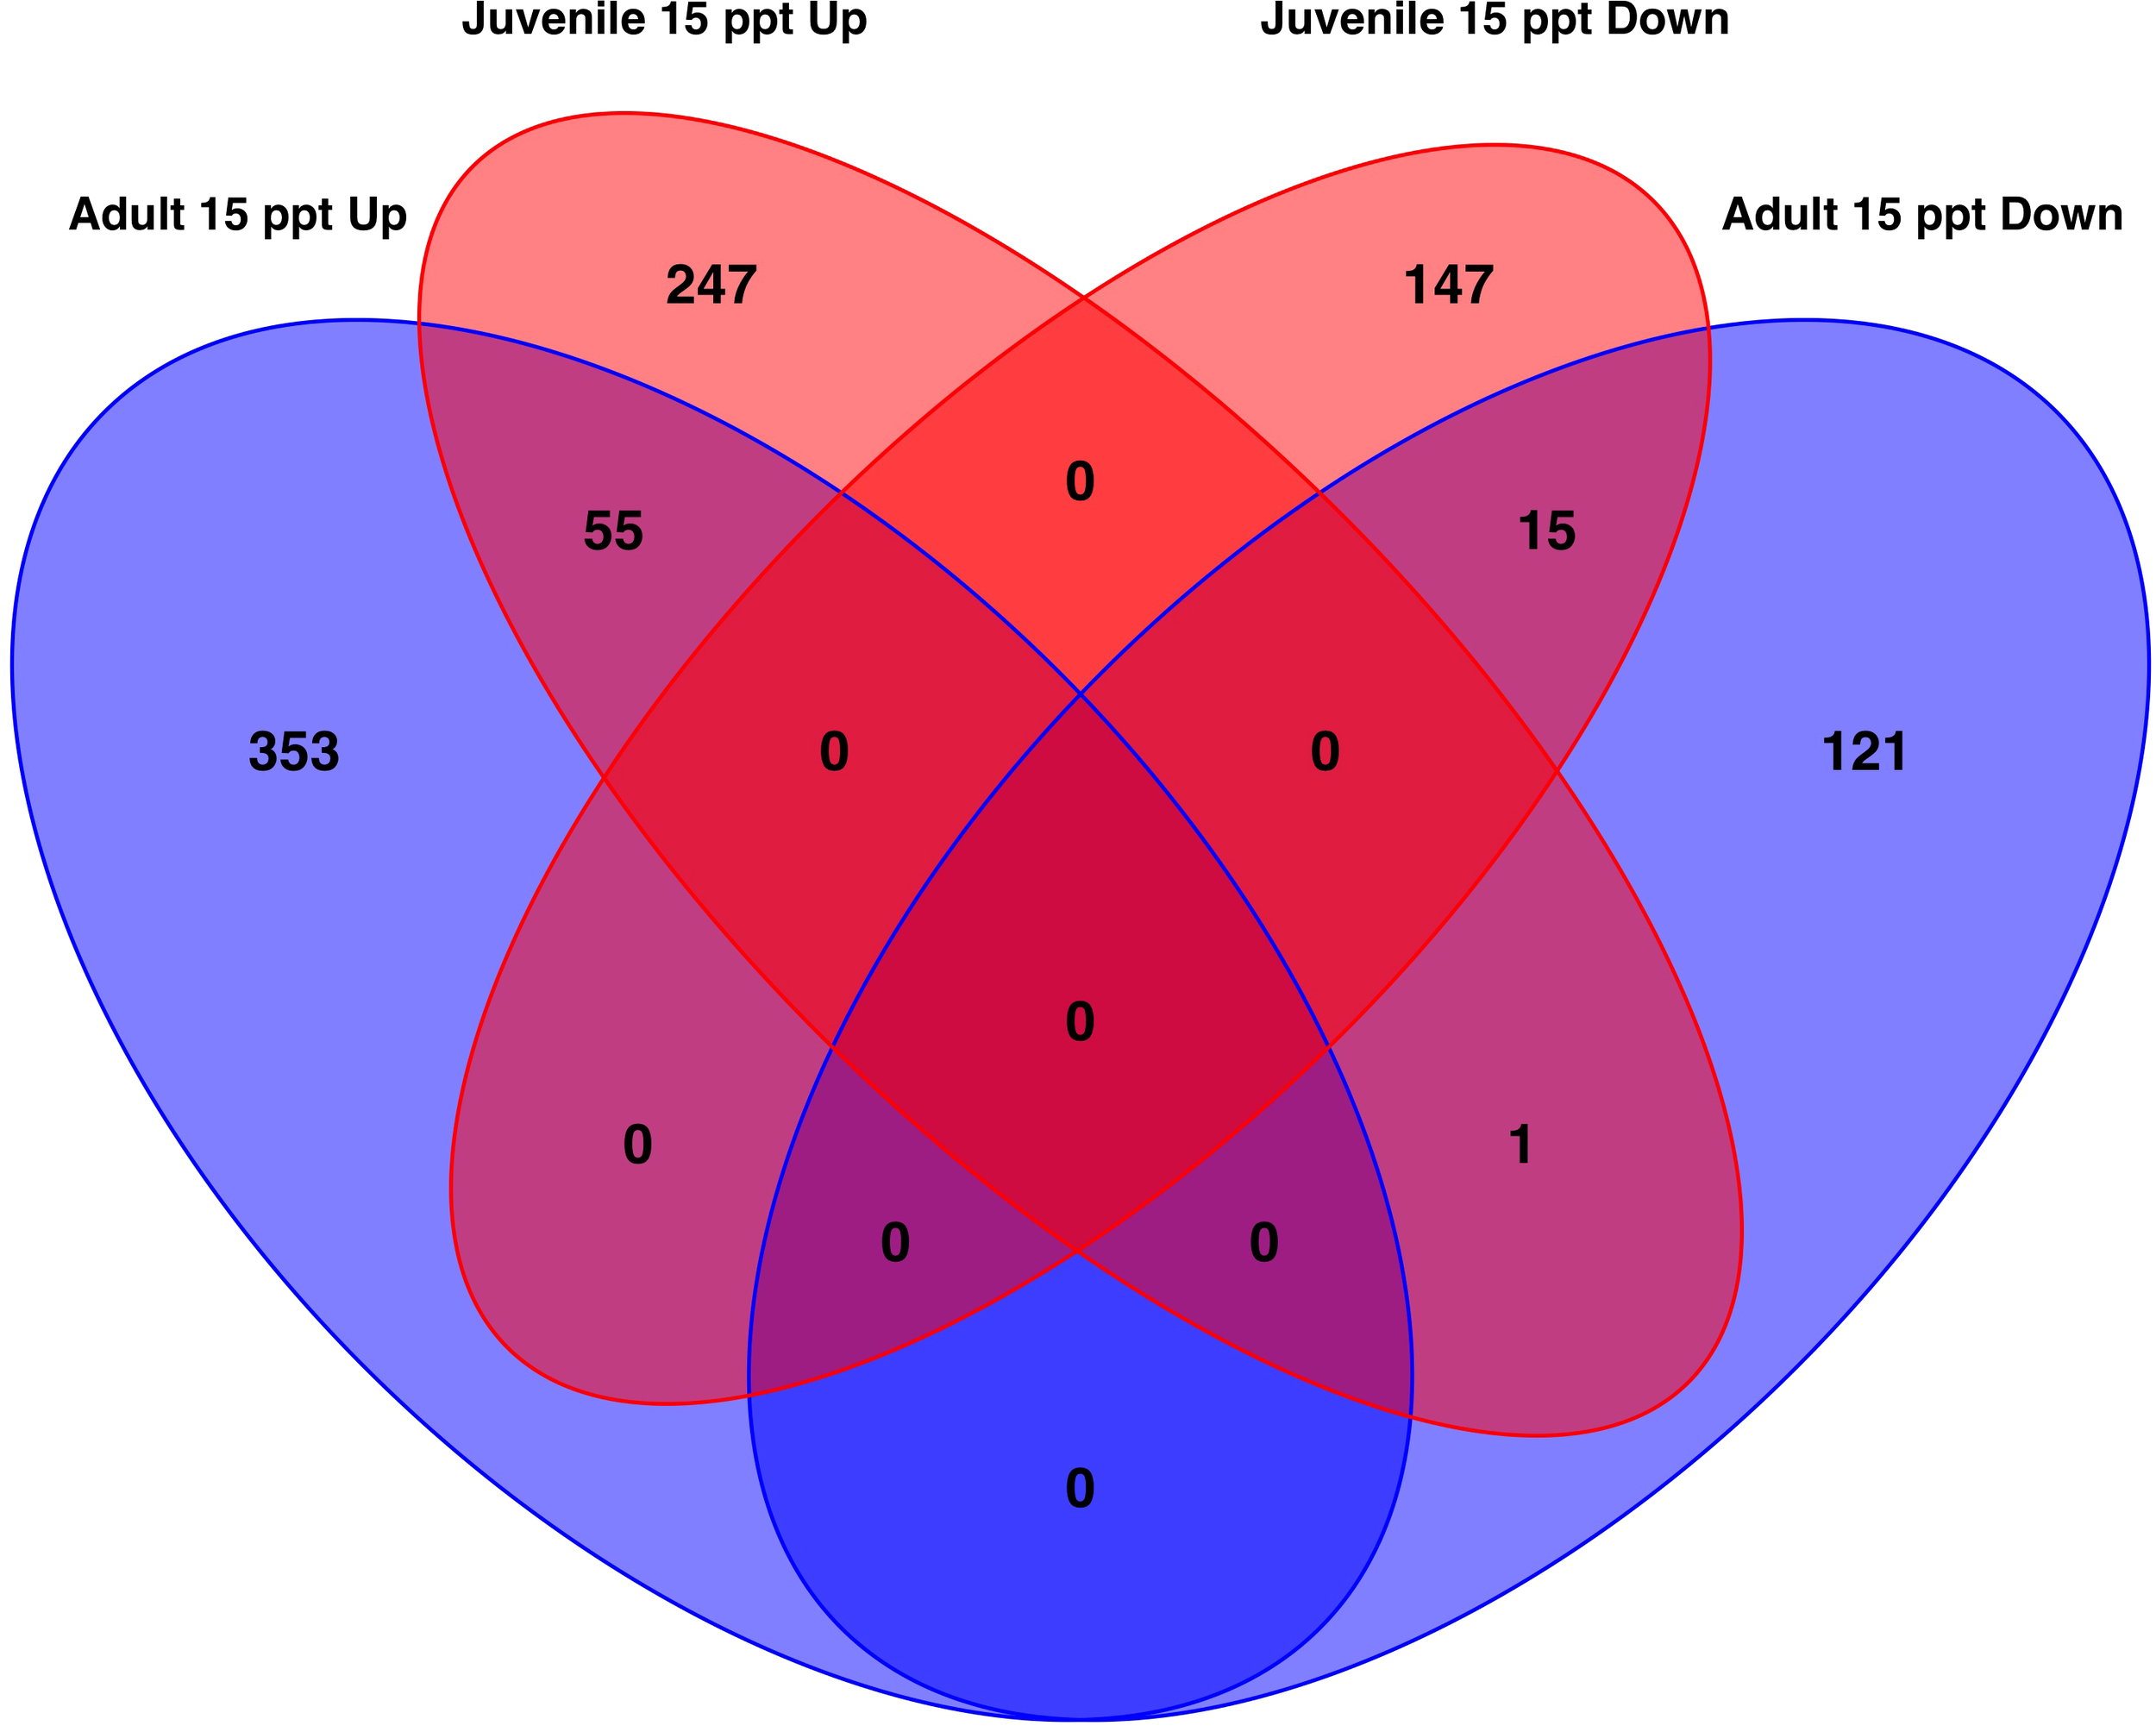
Venn diagram of the number of genes that are significantly differentially expressed (absolute LFC > 1 and FDR < 0.05 ) similarly or differently among the gills of adult clams and the whole body of juveniles. In total, 71 genes were significantly differentially expressed in both adults and juveniles. Of these 55 were up-regulated and 15 were down-regulated in response to 15 ppt versus 35 ppt. One gene was up-regulated in juveniles and down-regulated in adults.
KEGG pathways in adults
Out of the 545 genes identified as significantly differentially expressed between the 15 and 35 ppt treatments in the adult samples, 498 were recognized from amino acid sequences deposited in the NCBI database. Of the 498 amino acid sequences, 283 (56.8%) were assigned a K number by BlastKOALA and were used in enrichment analysis (Supplementary Table 9). Of these, 86 of the enriched pathways had an adjusted p-value < 0.05 (Figure 6, Supplementary Table 11). These pathways included those involved in axon regeneration, sphingolipid signaling, fluid shear stress and atherosclerosis, tight junction, AMPK signaling, axon guidance, Rap 1 signaling, cGMP-PKG signaling, cAMP signaling, and protein processing in the endoplasmic reticulum.
Figure 6
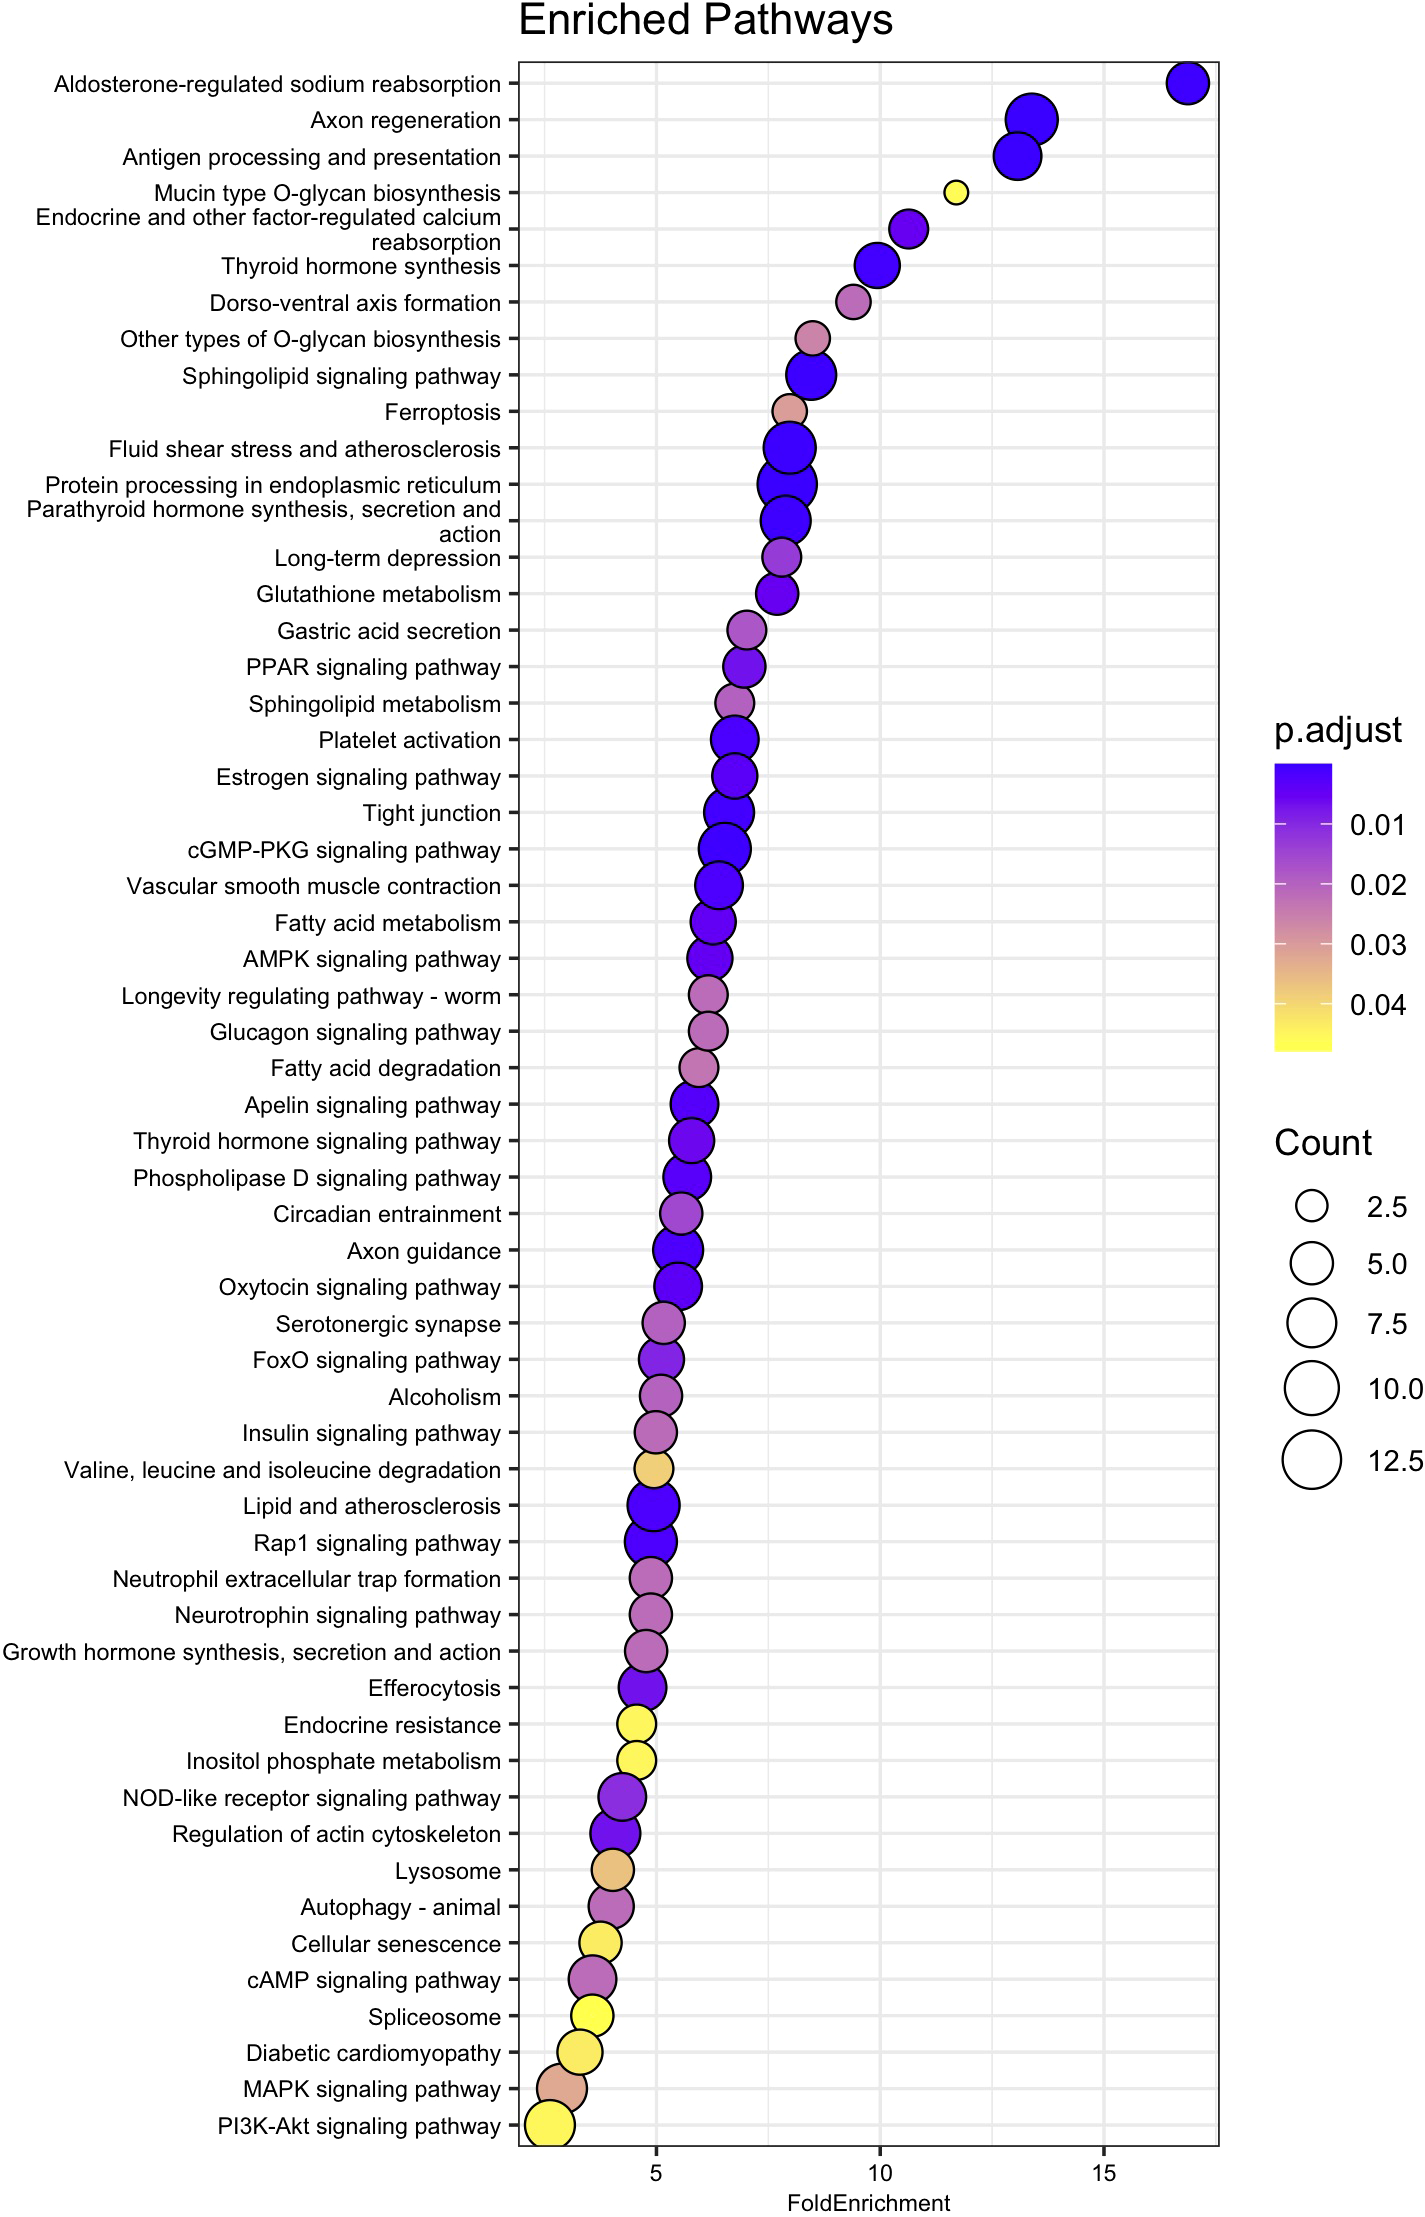
Dot plot of relevant KEGG pathway over representation or enrichment analysis for adult genes. Fold Enrichment on the x-axis was calculated by dividing the percentage of genes in the current dataset that were identified as encoding proteins in a specific pathway, by the percentage of genes in the background (KEGG Orthology-KO) dataset that are in the same pathway. Enriched pathway names are on the y-axis, sorted from highest to lowest fold enrichment. Circle size is scaled to indicate the number of genes that were significantly differentially expressed in that pathway. P.adjust represents adjusted p-value using the Benjamini-Hochberg method.
KEGG pathways in juveniles
Of the 465 genes identified as significantly differentially expressed between the 15 and 35 ppt treatments within the juvenile samples, 415 were recognized from amino acid sequences deposited in the NCBI database. Of the 415 amino acid sequences, 175 (42.2%) were assigned a K number by BlastKOALA and were used in enrichment analysis (Supplementary Table 10). Of these, 19 of the enriched pathways had an adjusted p-value < 0.05. (Figure 7, Supplementary Table 12). Pathways included those involved in axon regeneration, sphingolipid signaling, mineral absorption, fluid shear stress and atherosclerosis, adherens junction, AMPK signaling pathway and Rap1 signaling.
Figure 7
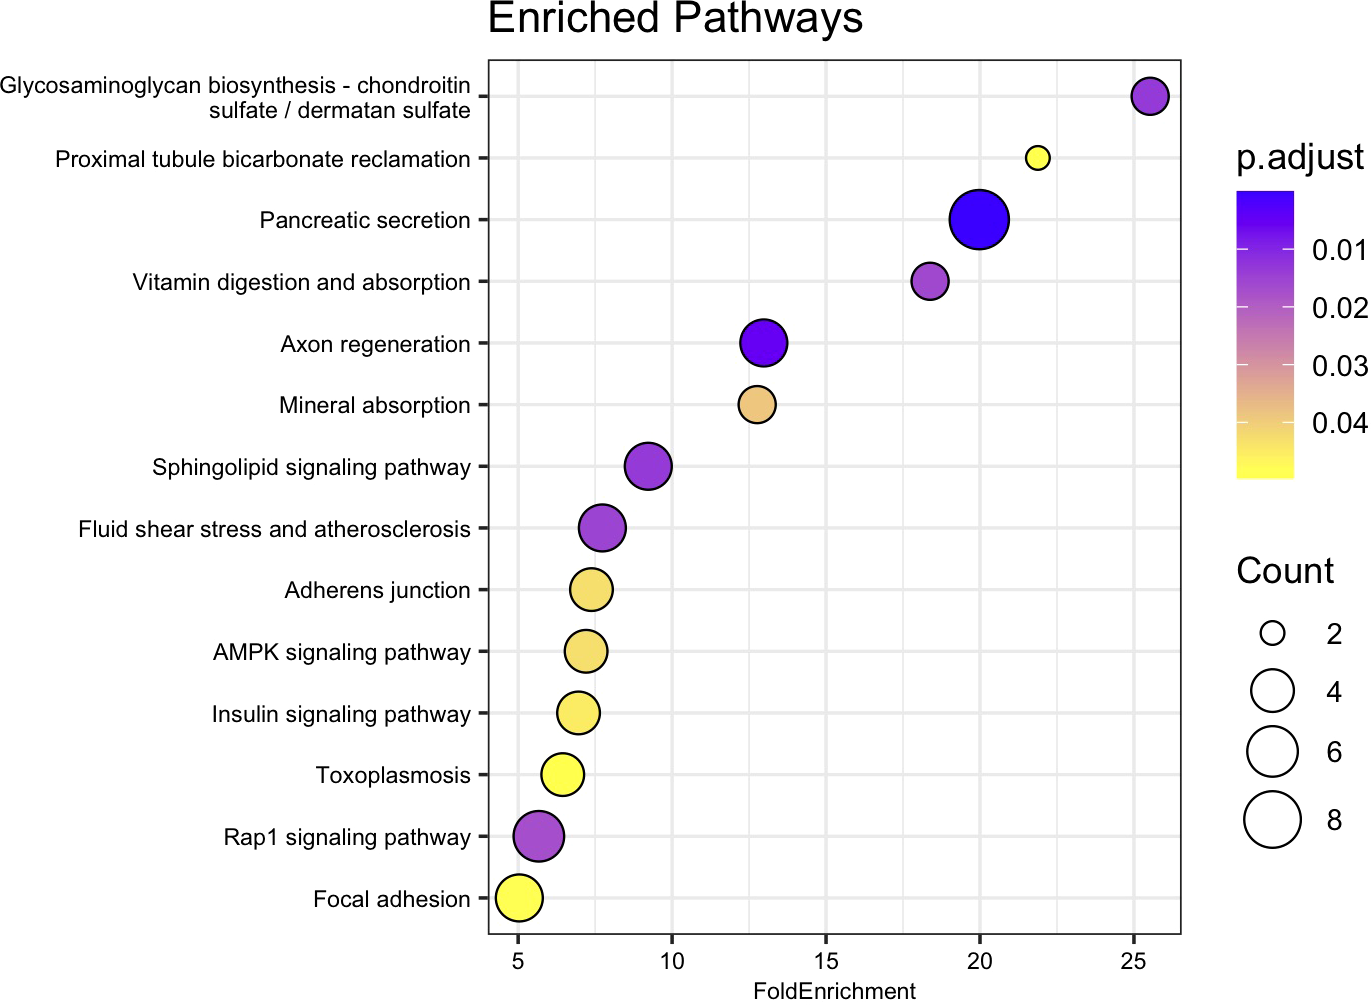
Dot plot of relevant KEGG pathway over representation or enrichment analysis for juvenile genes. Fold Enrichment on the x-axis was calculated by dividing the percentage of genes in the current dataset that were identified as encoding proteins in a specific pathway, by the percentage of genes in the background (KO) dataset that are in the same pathway. Enriched pathway names are on the y-axis, sorted from highest to lowest fold enrichment. Circle size is scaled to indicate the number of genes that were significantly differentially expressed in that pathway. P.adjust represents adjusted p-value using the Benjamini-Hochberg method.
Discussion
This is the first study to specifically focus on the transcriptomic response of adult and juvenile hard clams, Mercenaria mercenaria, to short-term low salinity stress. Key genes expressed under low salinity stress for metabolic and other cellular function pathways were identified. Some notable genes included heat shock proteins, inhibitors of apoptosis, and solute carrier proteins. Enriched pathways may inform how the hard clam responds to low salinity stress. Enriched pathways identified by this study included protein processing in the endoplasmic reticulum, fluid shear stress and atherosclerosis, Rap1 signaling, axon regeneration, sphingolipids signaling, adherens junction, AMPK signaling, cGMP-PKG signaling, cAMP signaling, tight junction, among others. The data generated by this study contributes to a better understanding of hard clam biology and key genes and pathways that can be a focus for future studies. Throughout this discussion, the focus is on mRNA or protein coding RNA levels because transcripts were measured. However, the functional roles of the proteins translated from these mRNAs will be discussed with the knowledge that this may not represent levels of protein expression. Studies in some systems have demonstrated a correlation between differentially expressed mRNA levels and relative levels of their corresponding proteins (Koussounadis et al., 2015; Cheng et al., 2016). Future studies in clams are needed to verify the levels of the specific proteins mentioned in this discussion.
Juveniles show more uniform response to low salinity than adults
The adult PCA predominantly clustered samples by line, reflecting the genetic structure of the populations used to establish the lines as described in Ropp et al. (2023). Some samples separated by salinity, but within some lines there was overlap between samples exposed to different salinities. There was some overlap between the adult Cape Cod and New Jersey samples. However, the results also suggest a lack of consistency among clam lines in response to low salinity (Figure 1). This could be interpreted in a couple of ways. Either each clam line responded slightly differently to low salinity stress or 26 hours of exposure to low salinity was not long enough for all individuals to fully respond. The juvenile PCA showed a different pattern than the adults. The WCxPS and WCxWC lines clustered together in PC1, separate from the NCxCC line, and in PC2, there was separation based on salinity exposure (Figure 2). Since WCxPS and WCxWC clams shared the same Wachapreague parental line (Supplementary Figure 1), it is reasonable that they grouped together and separated from NCxCC samples. These results indicate that juveniles had a more uniform response to low salinity stress across lines within the 26 hour period than the adults. This is consistent with the literature and the understanding that low salinity tolerance in hard clams increases with age.
Sodium/potassium/calcium exchanger gene expressed in hard clam gills
The genes differentially expressed in response to 15 ppt give insight into the molecular response of gills subjected to osmotic stress. The ciliary action on the gills of hard clams produces a water current that pumps water in and out of the mantle cavity and across the gills, allowing for gas exchange and food capture (Grizzle et al., 2001). Salinity may impact the pumping rate and feeding by disturbing the ionic balance needed for proper ciliary movement. At 15 ppt, pumping rates may fall from the 8 L h-1 observed at more optimal salinities to 0.5- 3.5 L h-1 (Hamwi, 1969), reducing the clam’s ability to support proper metabolic processes and energy demands and leading to physiological stress. The probable sodium/potassium/calcium exchanger CG1090 gene was up-regulated in response to exposure to 15 ppt in the gills of adult hard clams, suggesting the gills respond by producing proteins responsible for ion transport to compensate for the change in salinity (Table 1). A study by Zhou et al. (2022) found that the cAMP-PKA pathway plays an important osmoregulatory role in the gills of hard clams by transporting sodium, potassium, and calcium in and out of cells. Zhou et al. observed the temporary activation of the cAMP-PKA pathway (expression of key genes and ion concentration levels) after clams were exposed to low salinity conditions (10 psu) for one day and a dramatic downregulation of the pathway after 5 days of low salinity exposure. These findings are consistent with the current study that found the cAMP signaling pathway was enriched in the gills of hard clams after 26 hours of exposure to 15 ppt (Figure 6).
Heat shock protein genes expressed in hard clam gills
At the cellular-level, the ability to respond to environmental conditions requires the proper processing of the transcripts and proteins produced. In this study, several genes that were the most highly expressed at 15 ppt compared to 35 ppt as measured by significance and LFC within the adult gill tissues encoded proteins in the heat shock family. Heat shock proteins (HSPs) are conserved across eukaryotic lineages and have been shown to be involved in the physiological stress response in marine bivalves, contributing to their ability to adapt to changing environmental conditions (Fabbri et al., 2008). HSPs are best known for their role in stress response but include a wide range of functions (i.e., acting as molecular chaperones, folding newly synthesized polypeptides, refolding metastable proteins, assembling protein complexes, dissociating protein aggregate dissociations, and degrading misfolded proteins) (Hu et al., 2020). All HSP genes identified in this study were up-regulated in response to 15 ppt compared to 35 ppt.
The top characterized gene based on adjusted p-value in this study was alpha-crystallin A chain, a gene in the small heat-shock protein family (sHSP) that encodes proteins with chaperone-like properties to prevent the aggregation of denatured proteins, increasing cellular tolerance to stress (Augusteyn, 2004). The gene encoding heat shock protein beta-1-like (HspB1 or Hsp27), also a member of the sHSP family, was in the top fifteen characterized genes based on adjusted p-value (Table 1). HspB1 is best known for counteracting the accumulation of oxidized proteins and protecting cells against oxidative stress (Fabbri et al., 2008). sHSPs are thought to be ATP-independent chaperones that are important in refolding proteins in combination with other heat shock proteins (HSPs) (Narberhaus, 2002).
The HSP70 family defends against environmental stressors by helping to maintain protein homeostasis (Fabbri et al., 2008). Six genes in the HSP70 family were upregulated in response to 15 ppt (Table 1). Four heat shock protein 70 B2-like genes (Hsp70 B2) were up-regulated. Two other DEGs in the HSP70 family, but not in the B2 group, were also identified and up-regulated: heat shock 70 kDa protein-like (Hsp70) and heat shock 70 kDa protein 4-like (Hsp74) genes. Consistent with the findings of the current study, a study by Hu et al., 2022, identified a massive expansion of HSP70 genes in the genome of M. mercenaria compared to previously studied bivalves and found that most HSP70 tandemly duplicated gene pairs were up-regulated under heat and hypoxia stress in the gills of adult hard clams. Upon encountering stressful conditions, hard clams may shut their valves, which could lead to hypoxic conditions over time. Hard clams have been known to sustain valve closure for up to 18 days at -1° to 6°C (Loosanoff, 1939) and survive. It is possible that since HSP70 genes are expressed in response to heat and hypoxic conditions within the gills of adult hard clams, they are also expressed under hypoosmotic stress. Higher expression of HSP70 genes in response to low salinity stress has also been observed in studies of other bivalves. HSP70 genes were up-regulated in the gills of the blue mussel, Mytilus edulis, after six days of exposure to low salinity stress (5 ppt vs 23 ppt and 15 ppt) (Barrett et al., 2022). A study by Nie et al. (2017) exposed the manila clam, Ruditapes philippinarum to 32 ppt (control) and 15 ppt for 96 hours and collected tissue samples at 0, 3, 6, 12, 24, 48, 72, and 96 hour post-exposure; HSP70 genes were the most highly expressed in the gills as compared to other tissues and expression fluctuated throughout the 96 hours and among different clam lines, but HSP70 was up-regulated in all experiments at 15 ppt compared to 32 ppt (Nie et al., 2017).
Members of the 90 kDa heat-shock protein (HSP90) family play a vital role in protein regulation and cell signaling and act downstream of the HSP70 chaperone system (Fabbri et al., 2008). The gene for heat shock protein 90- beta-like (Hsp90B) was in the top fifteen genes by significance in adult clams exposed to low salinity compared to those at high salinity in this current study (Table 1). Like HSP70 genes, HSP90 genes were also found to be up-regulated in the blue mussel, Mytilus edulis, after exposure to low salinity stress (Barrett et al., 2022) and up-regulated in M. mercenaria after exposure to heat and hypoxic stress (Hu et al., 2022). Song et al. (2022) compared the transcriptomic response of M. mercenaria and its close relative, M. campechiensis, to chronic heat stress and found that the genes encoding Hsp70B2 and HspB1 were up-regulated in both species and the Hsp90 gene was up-regulated in M. campechiensis. Overall, these studies suggest that HSP90 in conjunction with HSP70 and sHSPs are important stress response genes for the hard clam and specific HSP genes may be expressed in response to low salinity stress. Homologs of these heat shock proteins are associated with tubulins and other proteins in cilia complexes, suggesting they may be involved in maintaining cilia function in clam gills under osmotic stress (Williams and Nelsen, 1997; Gherman et al., 2006)
Protein homeostasis is maintained by guiding and preserving the proper folding of proteins in the endoplasmic reticulum (ER), and heat shock proteins are the main regulators. The gene for the endoplasmic reticulum chaperone BiP-like (BiP), also known as heat shock protein family A, member 5 (HspA5), was identified in this current study (Table 1). BiP is the sole chaperone of HSP70 and one of the most abundant proteins in the ER, indicating that it is critical for protein folding (Adams et al., 2019). BiP, along with HSP90 and HSP70 amino acid sequences, were assigned to an enriched KEGG pathway, protein processing in the endoplasmic reticulum (Figure 6, Supplementary Figure 3). These results indicate that when subjected to low salinity stress (15 ppt), the gills of adult hard clams may employ quality control machinery like molecular chaperones and HSPs to ensure proper protein folding and to detect misfolding and perform degradation of proteins in the endoplasmic reticulum (ER) (Hartl et al., 2011).
Solute carrier genes expressed in juvenile clams
This is the first study to investigate the gene expression response in juvenile clams following low salinity stress. Juvenile clams are typically raised in upweller systems on ambient waters for multiple weeks between settlement at approximately 12 mm and out planting in grow-out beds. The reliance on ambient water carries a risk of sub-optimal water conditions, including low DO, high or low temperature, sedimentation, and low salinity, resulting in stress and mortality. Salinity depression from rain events can also affect the growth and survival rates of juvenile clams planted at grow-out sites. Juvenile clams can tolerate lower salinities for relatively short periods and have been known to survive 14 ppt for 6 days with limited mortality (Baker et al., 2005), but how their long-term growth is affected is unknown. In the event of external osmolarity change, osmoconformers must reallocate their energy towards regulating the solute concentrations including ions and small organic molecules via channels and transporters located throughout their cell membranes (Pierce, 1982). The top genes as determined based on FDR and LFC that were up-regulated under 15 ppt compared to 35 ppt in this study included sodium-dependent phosphate transport protein 2B (NPT2b), and solute carrier family 12 member 3 (SLC12A3) (Table 2) genes. NPT2b is a cotransporter of Na+ and HPO42- in the solute carrier family 34 (SLC34) (Virkki et al., 2007). Phosphorus (P) is an essential element for all living organisms, and in the form of inorganic phosphate (Pi), it can be used for ATP synthesis, phospholipids, genetic material, and intracellular signaling (Knowles, 1980; Olsen et al., 2006). SLC12A3 is a Na+ Cl- cotransporter (NCC), where both ions are transported into the cell, and constitute most of the solutes in the cells and body fluids of multi-cellular eukaryotic organisms (Dawson and Liu, 2008). Sodium and chloride distribution is critical for osmotic homeostasis and for maintaining ionic membrane potentials. A study by Zeng et al. (2024) looked at the molecular response of hard clams to long-term low salinity stress and found DEGs encoding amino acid transporters, ion channel proteins, and water channel proteins. Zeng et al. observed two monocarboxylate transporters that were significantly up-regulated in response to 15ppt compared to 35 ppt, consistent with the current study’s findings of upregulation of monocarboxylate transporters (Table 2). The current study also observed the up-regulation of sodium- and chloride-dependent glycine transporter 1 (SLC6A9), sodium- and chloride-dependent glycine transporter 2 (SLC6A5), and sodium- and chloride-dependent GABA transporter 2 (SLC6A13) (Table 2). SLC6A13 was also observed by Zeng et al. (2024) but was up-regulated in response to 35 ppt, an opposite response than the current study that observed an up-regulation in response to 15 ppt. This finding agrees with other studies that have concluded that gene expression changes with the length of exposure to stressful environmental conditions.
Inhibitors of apoptosis genes expressed in juvenile clams
Along with regulating cell volume and solute concentrations, controlling cell death or apoptosis under stressful conditions is crucial for the survival of an organism. Inhibitors of apoptosis (IAPs) primarily suppress caspases, the effector proteases in programmed cell death. IAPs have also been found to play a role in signaling cascades that are part of the innate immune response, cell migration, and cell-cycle regulation (Portt et al., 2011; Gyrd-Hansen and Meier, 2010; Fulda, 2014). In this current study, multiple IAPs and IAP-related genes were differentially expressed within juvenile clam tissues after the 15 ppt treatment (Table 2). Baculoviral IAP repeat-containing protein 7-A, a putative inhibitor of apoptosis, and three baculoviral IAP repeat-containing protein 3 genes were all up-regulated while baculoviral IAP repeat-containing protein 2, another baculoviral IAP repeat-containing protein 3, procathepsin L, two E3 ubiquitin-protein ligase XIAP, and inhibitor of apoptosis protein genes were down-regulated. Sequencing of the hard clam genome has revealed a massive expansion and diversification of IAPs, and after exposure to air for 8 and 16 days, IAPs were found to be both significantly up- and down-regulated with the highest expression observed in the hemolymph as compared to other organs (Song et al., 2021). Song et al., 2021 also concluded that the expression of IAPs was specific to certain stressors; 134 IAPs were expressed under at least one environmental stressor (high temperature, low oxygen, or low salinity), but only 3 IAPs were found to be expressed under all three stressors. The gene expression pattern of IAPs found within juvenile clams during this current study may be specific to low salinity stress and important for resilience against hypoosmotic conditions.
Overlap between adults and juveniles
When the 545 DEGs from the adult samples and 465 DEGs from the juvenile samples were compared, 71 genes were differently expressed in both the gills of adults and the whole bodies of juveniles. Of these 71 genes, 55 were up-regulated and 15 were down-regulated after 26 hours in 15 ppt versus 35 ppt in both adult and juvenile samples (Figure 5). The limited overlap in differentially expressed genes between the adults and juveniles suggests that gene expression may be specific to tissue type and age. The 71 genes that do overlap may be expressed in many tissue types and across age when low salinity stress is encountered and could be candidates for further studies. These overlapping genes included genes in the heat shock protein family, IAP-related genes, and genes that encode channels/transporters, and among many others (Supplementary Table 8). Results suggest that regulation of protein folding, apoptosis, and solute movement across cell membranes are important processes for the hard clam to combat low salinity, regardless of age or tissue type. While the regulation of single genes/proteins can give insight into the processes involved in low salinity stress response, groups of proteins can shed light on specific pathways that may be important. The enriched pathways with biological significance that overlapped between the adults and juveniles identified in this study include the fluid shear stress response and atherosclerosis (FSS) pathways (Figures 6, 7). The FSS pathway is known for its relationship to cardiovascular disease in humans, while shear stress is the frictional force that blood flow has on endothelial surfaces (McSweeney et al., 2016). A study by Boamah et al. (2022) found that DEGs were significantly enriched in the FSS pathways of abalone under low salinity stress. Like in abalone and other marine molluscs, the gills and other epithelial cells of the body cavity in hard clams are constantly exposed to hemolymph flow that could produce a shear-like stress under low salinity exposure, especially since gill pumping rates have been shown to decline with drops in salinity (Hamwi, 1969). This current study also identified several other interesting pathways that lack research within a clam system and could be the focus of future studies. These include Rap1 signaling, axon regeneration, sphingolipids signaling, adherens junction, AMPK signaling, vitamin digestion and absorption, mineral absorption, cGMP-PKG signaling, lipid and atherosclerosis, tight junction, aldosterone-regulated sodium reabsorption and more (Figures 6, 7). KEGG pathway enrichment analytical tools are useful but are built upon a limited number of species. Whether the pathways that were found to be significantly enriched in this study apply to a bivalve system needs confirmation. All significantly differently expressed genes were used in the analysis, so that the enriched pathways may include either up or down regulated genes, and some pathways may include both up and down regulated genes. While the genes/proteins belonging to these pathways may still be valuable in understanding low salinity stress response in hard clams, the specific functions of these pathways in the hard clam system still need to be explored.
Conclusion
As the largest producers of hard clams in the U.S., Virginia clam growers, along with producers from other states, are looking for ways to maintain and expand production including expanding operations into lower salinity areas. Potential threats to wild and aquacultured clams need to be assessed and understood so steps can be taken to devise mitigation strategies. One anticipated threat is the predicted increase in extreme precipitation events that lower salinities in coastal areas, potentially killing or stunting the growth of hard clams. Hatcheries and clam growers rely on ambient water to feed and support their clams throughout their lives, with limited options to accommodate drops in salinity. Genetics and selective breeding have been used as successful tools in many aquaculture settings to enhance favorable characteristics like growth, survival, and stress response in animals (Abdelrahman et al., 2017; Sae-Lim et al., 2017; Hollenbeck and Johnston, 2018; Houston et al., 2020). With advancements in transcriptomic analysis, we can better understand how animals respond to stress, which genes may be important in stress response, and if response differs among lines and populations. Therefore, breeding programs can use transcriptomics to identify genes and clam lines to target, enhancing selection methods. This approach has been used for other organisms, including the intertidal clam (Sinonovacula constricta), the Pacific oyster (Crassostrea gigas), and the rainbow trout (Oncorhynchus mykiss) (Niu et al., 2013; Zhang et al., 2019; Cleveland et al., 2020). The findings of the current study revealed the importance of heat shock proteins, inhibitors of apoptosis, and osmotic effector molecule regulators in the response to low salinity stress by adult and juvenile clams and provided insight into the processes that occur within adults and juveniles under low salinity stress by identifying key genes and pathways that could be the foundation for future studies. Future studies should examine whether genes identified in this study are differentially expressed in clams grown in different salinity environments. These data can be used to determine if there are links between expression levels and growth and survival metrics so that certain genes can be targeted for breeding more tolerant clam lines.
Statements
Data availability statement
The datasets presented in this study can be found in online repositories. The names of the repository/repositories and accession number(s) can be found in the article/Supplementary Material.
Ethics statement
Ethical approval was not required for the study involving animals in accordance with the local legislation and institutional requirements because organisms were not vertebrates. Only invertebrates (clams) were used in the study.
Author contributions
LY: Conceptualization, Data curation, Formal analysis, Investigation, Methodology, Project administration, Resources, Visualization, Writing – original draft, Writing – review & editing. JM: Conceptualization, Funding acquisition, Methodology, Project administration, Supervision, Validation, Writing – original draft, Writing – review & editing. KR: Conceptualization, Funding acquisition, Methodology, Project administration, Supervision, Writing – original draft, Writing – review & editing. RS: Conceptualization, Funding acquisition, Resources, Supervision, Writing – original draft, Writing – review & editing.
Funding
The author(s) declare that financial support was received for the research and/or publication of this article. Funding was received from the Virginia Institute of Marine Science (VIMS), the Virginia Agriculture Council (VAC), and the Virginia Sea Grant (VASG). VAC Project #768 VASG-Funding Agency: National Oceanic and Atmospheric Administration Agency Award Number: NA17OAR4170228. VIMS provided funding that covered tuition and stipend for the graduate student who worked on this project. VAC and VASG provided funds that helped secure and maintain the clam lines used in this project.
Acknowledgments
We thank the staff of the VIMS Eastern Shore Laboratory in Wachapreague, VA, who spawned and raised the clams used in these experiments, including Rebecca Smith, Darian Kelley, John Lewis, Edward Smith, and Sean Fate. We also thank Dr. Anthony Himes for his assistance in the experiments. We thank the Virginia Institute of Marine Science, the Virginia Agriculture Council, and the Virginia Sea Grant for funding this research.
Conflict of interest
The authors declare that the research was conducted in the absence of any commercial or financial relationships that could be construed as a potential conflict of interest.
Generative AI statement
The author(s) declare that no Generative AI was used in the creation of this manuscript.
Publisher’s note
All claims expressed in this article are solely those of the authors and do not necessarily represent those of their affiliated organizations, or those of the publisher, the editors and the reviewers. Any product that may be evaluated in this article, or claim that may be made by its manufacturer, is not guaranteed or endorsed by the publisher.
Supplementary material
The Supplementary Material for this article can be found online at: https://www.frontiersin.org/articles/10.3389/fmars.2025.1574486/full#supplementary-material
References
1
AbdelrahmanH.ElHadyM.Alcivar-WarrenA.AllenS.Al-TobaseiR.BaoL.et al. (2017). Aquaculture genomics, genetics and breeding in the United States: Current status, challenges, and priorities for future research. BMC Genom.18, 19. doi: 10.1186/s12864-017-3557-1
2
AdamsC. J.KoppM. C.LarburuN.NowakP. R.AliM. M. (2019). Structure and molecular mechanism of ER stress signaling by the unfolded protein response signal activator IRE1. Front. Mol. Biosci.6. doi: 10.3389/fmolb.2019.00011
3
Anaconda Software Distribution (2021). Anaconda documentation (Anaconda Inc). Available at: https://docs.anaconda.com/ (Accessed March 23, 2022).
4
AndersS.HuberW. (2010). Differential expression analysis for sequence count data. Nat. Prec. doi: 10.1038/npre.2010.4282.2
5
AndrewsS. (2010).FastQC: A quality control tool for high throughput sequence data. Available online at: http://www.bioinformatics.babraham.ac.uk/projects/fastqc/(Accessed March 23, 2022).
6
AugusteynR. C. (2004). A-Crystallin: A review of its structure and function. Clin. Exp. Optom.87 (6), 356–366. doi: 10.1111/j.1444-0938.2004.tb03095.x
7
BakerS. M.BakerP.HeubergerD.SturmerL. (2005). Short-term effects of rapid salinity reduction on seed clams (Mercenaria mercenaria). J. Shellfish Res.24 (1), 29–33. doi: 10.2983/0730-8000(2005)24[29:seorsr]2.0.co;2
8
BarrettN. J.ThyrringJ.HarperE. M.SejrM. K.SørensenJ. G.PeckL. S.et al. (2022). Molecular responses to thermal and osmotic stress in arctic intertidal mussels (Mytilus edulis): The limits of resilience. Genes.13 (1), 155. doi: 10.3390/genes13010155
9
BenjaminiY.HochbergY. (1995). Controlling the false discovery rate: A practical and powerful approach to multiple testing. J. R Stat. Soc. Ser. B Stat. Method.57 (1), 289–300. doi: 10.1111/j.2517-6161.1995.tb02031.x
10
BligheK.RanaS.LewisM. (2022). EnhancedVolcano: Publication-ready volcano plots with enhanced colouring and labeling. R package version 1.14.0. Available at: https://github.com/kevinblighe/EnhancedVolcano (Accessed July 2, 2022).
11
BoamahG. A.HuangZ.ShenY.LuY.WangZ.SuY.et al. (2022). Transcriptome analysis reveals Fluid Shear Stress (FSS) and atherosclerosis pathway as a candidate molecular mechanism of short-term low salinity stress tolerance in abalone. BMC Genom.23, 392. doi: 10.1186/s12864-022-08611-8
12
BolgerA. M.LohseM.UsadelB. (2014). Trimmomatic: A flexible trimmer for Illumina Sequence Data. Bioinformatic30 (15), 2114–2120. doi: 10.1093/bioinformatics/btu170
13
CarregosaV.VelezC.SoaresA. M. V. M.FigueiraE.FreitasR. (2014). Physiological and biochemical responses of three Veneridae clams exposed to salinity changes. Comp. Biochem. Physiol. B.177-178, 1–9. doi: 10.1016/j.cbpb.2014.08.001
14
CastagnaM.ChanleyP. (1973). Salinity tolerance of some marine bivalves from inshore and estuarine environments in Virginian waters on the western mid-Atlantic coast. Malacologia12, 47–96.
15
ChenH. (2022). VennDiagram: Generate High-Resolution Venn and Euler Plots. R package version1.7.3. Available at: https://CRAN.R-project.org/package=VennDiagram (Accessed August 1, 2022).
16
ChengZ.TeoG.KruegerS.RockT. M.KohH. W. L.ChoiH.et al. (2016). Differential Dynamics of the mammalianmrnaand protein expression response to misfolding stress. Mol. Syst. Biol.12, 855. doi: 10.15252/msb.20156423
17
ChewK. K. (2001). Chapter 16 introduction of the Hard Clam (Mercenaria Mercenaria) to the pacific coast of North America with notes on its introduction to Puerto Rico, England, and France. Dev. Aquacult. Fish. Sci.31, 701–709. doi: 10.1016/s0167-9309(01)80044-2
18
ClevelandB. M.GaoG.LeedsT. D. (2020). Transcriptomic response to selective breeding for fast growth in rainbow trout (Oncorhynchus mykiss). Mar. Biol.22, 539–550. doi: 10.1007/s10126-020-09974-3
19
DanecekP.BonfieldJ. K.LiddleJ.MarshallJ.OhanV.PollardM. O.et al. (2021). Twelve years of SAMtools and BCFtools. GigaScience10 (2). doi: 10.1093/gigascience/giab008
20
DavisH. C. (1958). Survival and growth of clam and oyster at different salinities. Biol. Bull.114, 296–307. doi: 10.2307/1538986
21
DavisH. C.CalabreseA. (1964). Combined effects of temperature and salinity on development of eggs and growth of larvae of M. mercenaria and Q. virginica. Fish. Bull.63, 643–655.
22
DawsonD.LiuX. (2008). “Osmoregulation: Some Principles of Water and Solute Transport,” in Osmotic and Ionic Regulation. Ed. DavidH. E. (Boca Raton, Florida: CRC Press), 1–30.
23
DeatonL. (2008). “Osmotic and Ionic Regulation in Molluscs,” in Osmotic and Ionic Regulation. Ed. DavidH. E. (CRC Press, Boca Raton, Florida), 107–125.
24
DurackP. J.WijffelsS. E.MatearR. J. (2012). Ocean salinities reveal strong global water cycle intensification during 1950 to 2000. J. Sci.336 (6080), 455–458. doi: 10.1126/science.1212222
25
EwelsP.MagnussonM.LundinS.KällerM. (2016). MultiQC: Summarize analysis results for multiple tools and samples in a single report. Bioinform.32 (19), 3047–3048. doi: 10.1093/bioinformatics/btw354
26
FabbriE.ValbonesiP.FranzellittiS. (2008). HSP expression in bivalves. Invert Surviv J.5, 135–161.
27
FuldaS. (2014). Regulation of cell migration, invasion and metastasis by IAP proteins and their antagonists. Oncogene33, 671–676. doi: 10.1038/onc.2013.63
28
García-AlcaldeF.OkonechnikovK.CarbonellJ.CruzL. M.GötzS.TarazonaS.et al. (2012). Qualimap: Evaluating next-generation sequencing alignment data. Bioinform.28 (20), 2678–2679. doi: 10.1093/bioinformatics/bts503
29
GhermanA.DavisE.KatsanisN. (2006). The ciliary proteome database: an integrated community resource for the genetic and functional dissection of cilia. Nat. Genet.38, 961–962. doi: 10.1038/ng0906-961
30
GrizzleR. E.BriceljV. M.ShumwayS. E. (2001). “Chapter 8: Physiological Ecology of Mercenaria Mercenaria,” in Biology of the Hard Clam. Eds. KraeuterJ. N.CastagnaM. (Amsterdam, Netherlands: Elsevier), 305–371.
31
Gyrd-HansenM.MeierP. (2010). IAPs: from caspase inhibitors to modulators of NF-kappaB, inflammation and cancer. Nat. Rev. Cancer10, 561–574. doi: 10.1038/nrc2889
32
HamwiA. (1969). Oxygen consumption and pumping rate of the hard clam Mercenaria mercenaria. Ph.D. Dissertation. (New Brunswick, NJ: Rutgers University).
33
HannaG. D. (1966). Introduced mollusks of western North America. Occas pap Calif Acad. Sci.48, 1–108.
34
HarteM. E. (2001). Chapter 1 systematics and taxonomy. Dev. Aquac Fish Sci.31, 3–51. doi: 10.1016/s0167-9309(01)80029-6
35
HartlF. U.BracherA.Hayer-HartlM. (2011). Molecular chaperones in protein folding and proteostasis. Nat475, 324–332. doi: 10.1038/nature10317
36
HeppellD. (1961). The naturalization in Europe of the quahog Mercenaria mercenaria. J. Conchol25, 21–34. doi: 10.5962/p.407370
37
HollenbeckC. M.JohnstonI. A. (2018). Genomic tools and selective breeding in molluscs. Front. Genet.9. doi: 10.3389/fgene.2018.00253
38
HoustonR. D.BeanT. P.MacqueenD. J.GundappaM. K.JinY. H.JenkinsT. L.et al. (2020). Harnessing genomics to fast-track genetic improvement in Aquaculture. Nat. Rev. Genet.21, 389–409. doi: 10.1038/s41576-020-0227-y
39
HuZ.SongH.FengJ.ZhouC.YangM. J.ShiP.et al. (2022). Massive heat shock protein 70 genes expansion and transcriptional signatures uncover hard clam adaptations to heat and hypoxia. Front. Mar Sci.9. doi: 10.3389/fmars.2022.898669
40
HuC.YangJ.QiZ.WuH.WangB.ZouF.et al. (2020). Heat shock proteins: Biological functions, pathological roles, and therapeutic opportunities. MedComm.3 (3). doi: 10.1002/mco2.161
41
HudsonK.Virginia Sea Grant Marine Advisory Program (2019). Virginia Shellfish Aquaculture Situation and Outlook Report: Results of the 2018 Virginia Shellfish Aquaculture Crop Reporting Survey. Marine Resource Report No. 2019-8; Virginia Sea Grant VSG-19-03. Virginia Institute of Marine Science, William & Mary. doi: 10.25773/jc19-y847
42
KanehisaM.SatoY.KawashimaM. (2021). KEGG mapping tools for uncovering hidden features in biological data. Prot Sci.31 (1), 47–53. doi: 10.1002/pro.4172
43
KanehisaM.SatoY.MorishimaK. (2016). Blastkoala and Ghostkoala: KEGG tools for functional characterization of genome and metagenome sequences. J. Mol. Biol.28 (22), 726–731. doi: 10.1016/j.jmb.2015.11.006
44
KarlT. R.TrenberthK. E. (2003). Modern global climate change. Sci302, 1719–1723. doi: 10.1126/science.1090228
45
KimD.PaggiJ. M.ParkC.BennettC.SalzbergS. L. (2019). Graph-based genome alignment and genotyping with Hisat2 and HISAT-genotype. Nat. Biotechnol.37, 907–915. doi: 10.1038/s41587-019-0201-4
46
KnowlesJ. R. (1980). Enzyme-catalyzed phosphoryl transfer reactions. Annu. Rev. Biochem.49, 877–919. doi: 10.1146/annurev.bi.49.070180.004305
47
KoussounadisA.LangdonS. P.UmI. H.HarrisonD. J.SmithV. A. (2015). Relationship between differentially expressed mrna and mrna-protein correlations in a xenograft model system. Sci. Rep.5, 10775. doi: 10.1038/srep10775
48
LiH.HandsakerB.WysokerA.FennellT.RuanJ.HomerN.et al. (2009). The sequence alignment/map format and SAMtools. Bioinform.25 (16), 2078–2079. doi: 10.1093/bioinformatics/btp352
49
LoosanoffV. L. (1939). Effect of temperature upon shell movements of Clams, Venus Mercenaria (L.). Biol. Bull.76 (2). doi: 10.2307/1537857
50
LoosanoffV. L.DavisH. C. (1963). Rearing of bivalve mollusks. Adv. Mar Biol.1, 1–136. doi: 10.1016/S0065-2881(08)60257-6
51
LoveM. I.HuberW.AndersS. (2014). Moderated estimation of fold change and dispersion for RNA-seq data with DESeq2. Genome Biol.15 (12), 550. doi: 10.1186/s13059-014-0550-8
52
LuoW.BrouwerC. (2013). Pathview: an R/Bioconductor package for pathway-based data integration and visualization. Bioinform.29 (14), 1830–1831. doi: 10.1093/bioinformatics/btt285
53
McSweeneyS. R.WarabiE.SiowR. C. M. (2016). Nrf2 as an endothelial mechanosensitive transcription factor. Hypertension67 (1), 20–29. doi: 10.1161/hypertensionaha.115.06146
54
NarberhausF. (2002). A-crystallin-type heat shock proteins: Socializing minichaperones in the context of a multichaperone network. Microbiol Mol. Biol. Rev.66. doi: 10.1128/mmbr.66.1.64-93.2002
55
NieH.LiuL.HuoZ.ChenP.DingJ.YangF.et al. (2017). The HSP70 gene expression responses to thermal and salinity stress in wild and cultivated manila clam Ruditapes philippinarum. Aquaculture470, 149–156. doi: 10.1016/j.aquaculture.2016.12.016
56
NiuD.WangL.SunF.LiuZ.LiJ. (2013). Development of molecular resources for an intertidal clam, Sinonovacula constricta, using 454 transcriptome sequencing. PloS One8 (7), e67456. doi: 10.1371/journal.pone.0067456
57
OlsenJ. V.BlagoevB.GnadF.MacekB.KumarC.MortensenP.et al. (2006). Global, in vivo, and site-specific phosphorylation dynamics in signaling networks. Cell127 (3), 635–648. doi: 10.1016/j.cell.2006.09.026
58
PalmerK. V. W. (1927). In the veneridae of eastern america; cenozoic and recent. Palaeontogr. Am.1, 209–522.
59
PierceS. K. (1982). Invertebrate cell volume control mechanisms: A coordinated use of intracellular amino acids and inorganic ions as osmotic solute. Biol. Bull.163, 3. doi: 10.2307/1541452
60
PorttL.NormanG.ClappC.GreenwoodM.GreenwoodM. T. (2011). Anti-apoptosis and cell survival: A Review. Biochim. Biophys. Acta Mol. Cell Res.1813 (1), 238–259. doi: 10.1016/j.bbamcr.2010.10.010
61
PutriG.AndersS.PylP. T.PimandaJ. E.ZaniniF. (2022). Analysing high-throughput sequencing data with HTSeq 2.0. Bioinformatics38 (10), 2943–2945. doi: 10.1093/bioinformatics/btac166
62
RoegnerG.MannR. L. (1990). “Habitat requirements for the hard clam, Mercenaria mercenaria, in Chesapeake Bay,” in Special scientific report No. 126 (Virginia Institute of Marine Science, College of William & Mary). doi: 10.21220/m2-1rar-wr63
63
RoppA. J.ReeceK. S.SnyderR. A.SongJ.BiesackE. E.McDowellJ. R. (2023). Fine-scale population structure of the northern hard clam (Mercenaria mercenaria) revealed by genome-wide SNP markers. Evol. Appl.16 (8), 1422–1437. doi: 10.1111/eva.13577
64
Sae-LimP.KauseA.MulderH. A.OlesenI. (2017). Breeding and genetics symposium: Climate change and selective breeding in aquaculture. J. Anim Sci.95 (4), 1801–1812. doi: 10.2527/jas2016.1066
65
SchneiderC. A.RasbandW. S.EliceiriK. W. (2012). NIH Image to ImageJ: 25 years of image analysis. Nat. Methods9, 671–675. doi: 10.1038/nmeth.2089
66
SlowikowskiK. (2021). ggrepel: Automatically Position Non-Overlapping Text Labels with ‘ggplot2’. R package version 0.9.1. Available at: https://CRAN.R-project.org/package=ggrepel (Accessed June 14, 2022).
67
SnyderR. A. (2021). “Fisheries Landings for the Eastern Shore of Virginia (ESVA) 2021,” in VIMS Eastern Shore Laboratory Technical Report No. 10 (Virginia Institute of Marine Science, William & Mary). doi: 10.25773/jxkh-b683
68
SongJ.AustinJ. D.YangH. (2022). Comparative transcriptomics of the northern quahog Mercenaria Mercenaria and southern Quahog Mercenaria campechiensis in response to chronic heat stress. Mar Biotechnol.24, 276–292. doi: 10.1007/s10126-022-10101-7
69
SongH.GuoX.SunL.WangQ.HanF.WangH.et al. (2021). The hard clam genome reveals massive expansion and diversification of inhibitors of apoptosis in Bivalvia. BMC Biol.19, 15. doi: 10.1186/s12915-020-00943-9
70
TownesF. W.HicksS. C.AryeeM. J.IrizarryR. A. (2019). Feature selection and dimension reduction for single cell RNA-Seq based on a multinomial model. Genome Biol.20, 295. doi: 10.1186/s13059-019-1861-6
71
VirkkiL. V.BiberJ.MurerH.ForsterI. C. (2007). Phosphate transporters: A tale of two solute carrier families. Am. J. Physiol. Renal Physiol.293 (3), 643–654. doi: 10.1152/ajprenal.00228.2007
72
WardL. W.PowarsD. S. (1989). Tertiary stratigraphy and paleontology, chesapeake bay region, virginia and maryland. American Geophysical Union.
73
WickhamH.AverickM.BryanJ.ChangW.McGowanL.FrançoisR.et al. (2019). Welcome to the tidyverse. J. Open Source Softw.4 (43), 1686. doi: 10.21105/joss.01686
74
WilliamsN. E.NelsenE. M. (1997). HSP70 and HSP90 homologs are associated with tubulin in hetero-oligomeric complexes, cilia and the cortex of Tetrahymena. J. Cell Sci.110 (14), 1665–1672. doi: 10.1242/jcs.110.14.1665
75
WinterD. J. (2017). rentrez: an R package for the NCBI eUtils API. R J.9, 520–526. doi: 10.32614/RJ-2017-058
76
WuT.HuE.XuS.ChenM.GuoP.DaiZ.et al. (2021). Clusterprofiler 4.0: A universal enrichment tool for interpreting OMICS data. Innov.2 (3), 100141. doi: 10.1016/j.xinn.2021.100141
77
ZengX.ZengY.YeeJ. C.YangH. (2024). Biochemical and molecular responses to long-term salinity challenges in northern quahogs Mercenaria Mercenaria. Fish Shellfish Immunol.154. doi: 10.1016/j.fsi.2024.109888
78
ZhangF.HuB.FuH.JiaoZ.LiQ.LiuS. (2019). Comparative transcriptome analysis reveals molecular basis underlying fast growth of the selectively bred Pacific oyster, Crassostrea gigas. Front. Genet.10. doi: 10.3389/fgene.2019.0061
79
ZhouC.SongH.FengJ.HuZ.YangM.ShiP.et al (2022). Metabolomics and biochemical assays reveal the metabolic responses to hypo-salinity stress and osmoregulatory role of cAMP-PKA pathway in Mercenaria Mercenaria. Comput. Struct. Biotechnol. J.20. doi: 10.1016/j.csbj.2022.08.004
80
ZhuA.IbrahimJ. G.LoveM. I. (2018). Heavy-tailed prior distributions for sequence count data: Removing the noise and preserving large differences. Bioinform.35 (12), 2084–2092. doi: 10.1093/bioinformatics/bty895
Summary
Keywords
hard clam, low salinity, transcriptomics, gene expression, short-term
Citation
Youtsey LS, Reece KS, Snyder RA and McDowell JR (2025) Transcriptomic profile of the northern hard clam (Mercenaria mercenaria) in response to short-term low salinity exposure. Front. Mar. Sci. 12:1574486. doi: 10.3389/fmars.2025.1574486
Received
10 February 2025
Accepted
09 April 2025
Published
08 May 2025
Volume
12 - 2025
Edited by
Carlos Saavedra, Spanish National Research Council (CSIC), Spain
Reviewed by
Liang Guo, Hunan Normal University, China
Lani Gleason, California State University, United States
Updates
Copyright
© 2025 Youtsey, Reece, Snyder and McDowell.
This is an open-access article distributed under the terms of the Creative Commons Attribution License (CC BY). The use, distribution or reproduction in other forums is permitted, provided the original author(s) and the copyright owner(s) are credited and that the original publication in this journal is cited, in accordance with accepted academic practice. No use, distribution or reproduction is permitted which does not comply with these terms.
*Correspondence: Leslie S. Youtsey, lgspeight@vims.edu
†ORCID: Leslie S. Youtsey, orcid.org/0009-0003-5010-8343; Kimberly S. Reece, orcid.org/0000-0002-1751-1566; Richard A. Snyder, orcid.org/0000-0002-3787-9376; Jan R. McDowell, orcid.org/0000-0002-4849-0649
Disclaimer
All claims expressed in this article are solely those of the authors and do not necessarily represent those of their affiliated organizations, or those of the publisher, the editors and the reviewers. Any product that may be evaluated in this article or claim that may be made by its manufacturer is not guaranteed or endorsed by the publisher.