 Jiale Yan1,2Yan Chen3Yingkun Cao1,2
 Jiamin Sun4
 Bin Wen4*Xiaowei Gao1,2
 Gang Wang5,6Lixin Gong5,6Huixin Liu5,6Qian Li5,6Xiujin Liu5,6Jiabo Zhang5,6Zepeng Li1,2Futang Ma1,2Haien Zhang7Weidong Li7*
 Zhe Pan1,2*
- 1Ocean College of Hebei Agricultural University, Hebei Agricultural University, Qinhuangdao, China
- 2Hebei Key Laboratory of Nutritional Regulation and Disease Control for Aquaculture, Hebei Agricultural University, Qinhuangdao, China
- 3Fisheries Science Institute, Beijing Academy of Agriculture and Forestry Sciences, Beijing, China
- 4Key Laboratory of Freshwater Aquatic Genetic Resources, Ministry of Agriculture and Rural Affairs, Shanghai Ocean University, Shanghai, China
- 5Marine Ecological Restoration and Smart Ocean Engineering Research Center of Hebei Province, Department of Science and Technology of Hebei Province, Qinhuangdao, China
- 6The Eighth Geological Brigade, Hebei Geological and Mineral Exploration Development Bureau, Qinhuangdao, China
- 7Tangshan Haidu Seafood Co., Ltd, Tangshan, China
Introduction: Marine ranching is an effective marine ecosystem protection measure that not only helps protect marine resources, but also has an important carbon sink function.
Methods: This study took the Haizhidu marine ranching in the Bohai sea of China as the research object, constructed 20 functional groups in the area, and used the ecosystem model Ecopath with Ecosim (EwE) and stable isotopes (δ13C and δ15N) to model the system, evaluate the biological structure, energy transfer efficiency, and ecological carrying capacity (ECC) of different functional groups in the system, and calculate the carbon sequestration potential when shellfish reach ECC and the impact of marine ranching construction on system stability and maturity.
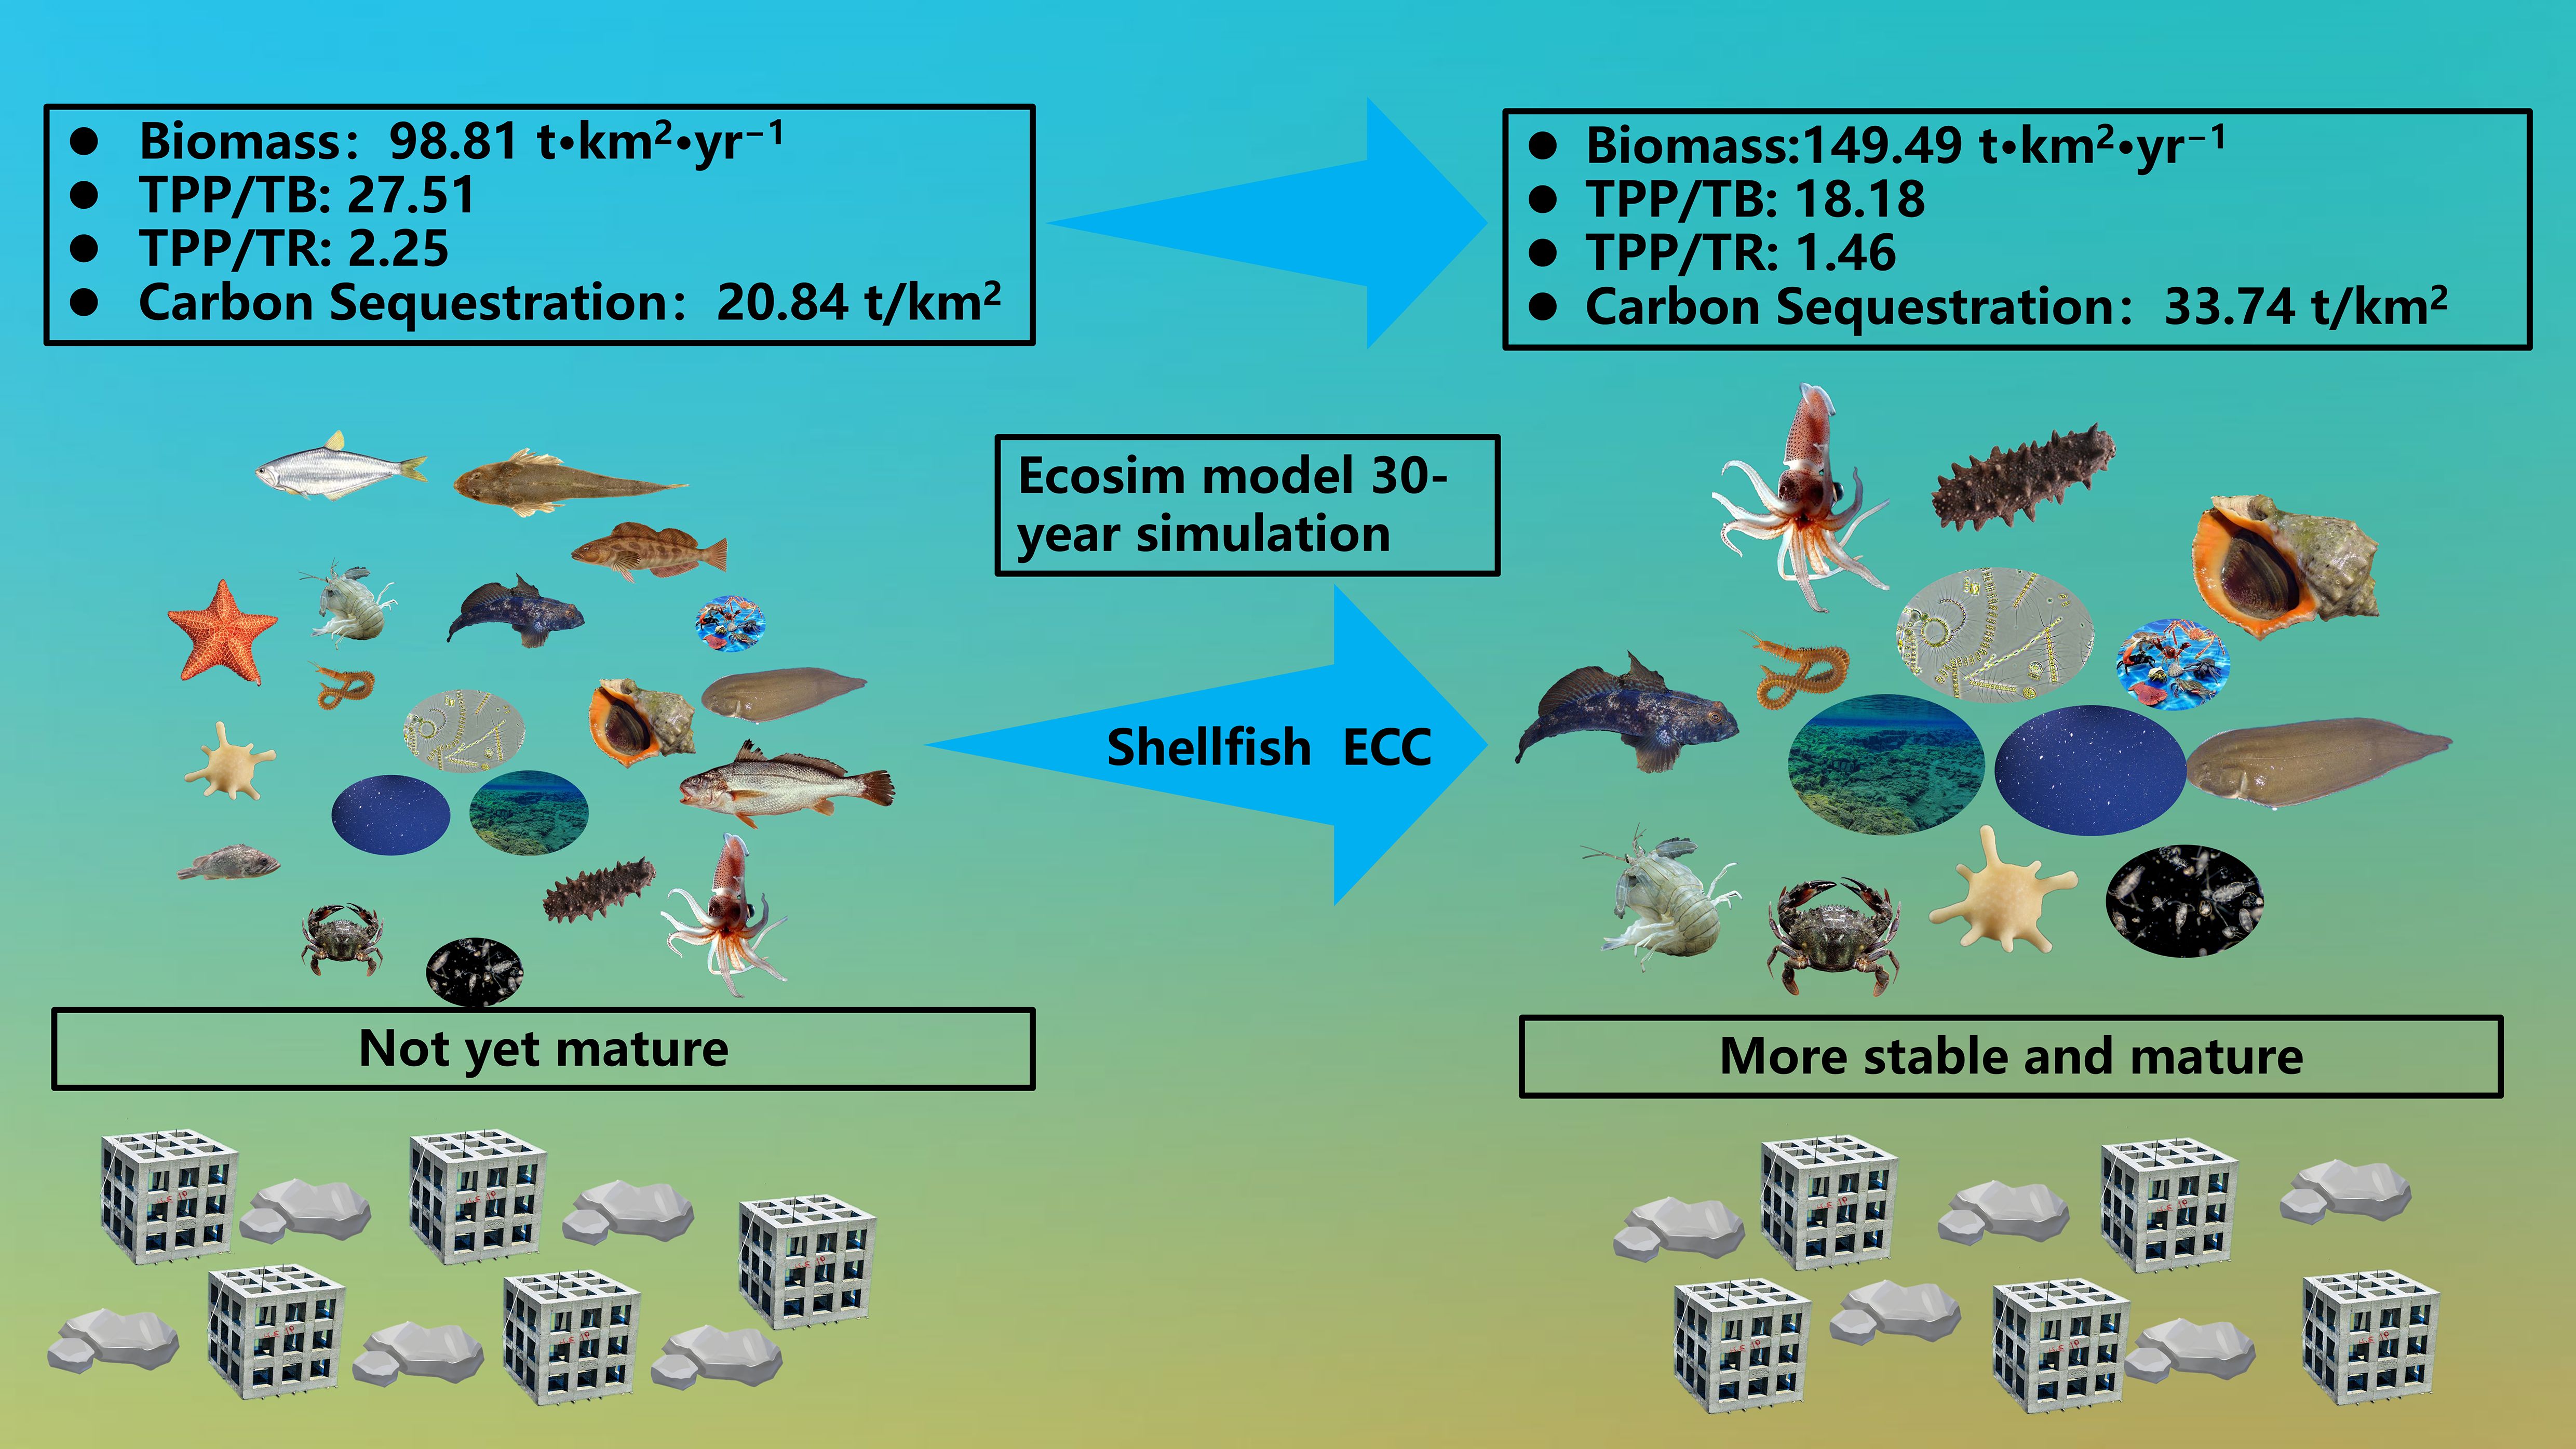
Results and Discussion: The results of the study on the characteristic parameters of the marine ranching system show that in the Haizhidu marine ranching ecosystem, the functional group with the highest biomass is the sediment detritus functional group (37.75 t/km2), followed by phytoplankton (21.40 t/km2), and the lowest is the other pelagic fishes (0.26 t/km2); the highest trophic level is the Platycephalus indicus (3.70), followed by the 3.43 of Sebastes schlegelii and cephalopods; the energy transfer efficiency is mainly concentrated in the trophic levels I and II. The simulation results of the shellfish ECC show that the ECC of shellfish in this system is 49.21 t/km2. When the system reaches this capacity, the carbon sequestration potential of shellfish is 12.44 t/km2, and the total carbon fixation of the system can increase by 12.90 t/km2. At the same time, the ecosystem showed a high degree of maturity and stability when the shellfish proliferated to the ECC.
Conclusion: In general, the results show that in the process of marine ranching management, reasonable control of the number of shellfish can improve the stability of the system and increase its carbon sequestration capacity. The research results can provide a scientific reference for the ecological service function of marine ranching in the future and increase the carbon sequestration service function of marine ranching ecosystems.
Graphical Abstract. Graphic abstract of the present study.
1 Introduction
As the largest active carbon reservoir on Earth, the ocean plays a pivotal role in mitigating the global greenhouse effect, including phenomena such as global warming, ocean acidification, and extreme weather events (Wang et al., 2024). Among marine ecosystems, offshore environments exhibit strong carbon sink capacities, significantly contributing to CO2 reduction and global climate change mitigation (Dutta et al., 2019). To enhance these functions, numerous offshore projects and studies have been implemented globally, with marine ranching emerging as a key focus (Wan et al., 2021). Research indicates that marine ranching can substantially contribute to ecological restoration and greenhouse gas mitigation (Wan et al., 2021). Notably, shellfish, a cornerstone species in marine ranching construction, exhibit exceptional carbon sink potential through mechanisms such as biological carbon fixation, shell carbon fixation, sediment carbon sequestration, and inert organic carbon storage (Pan et al., 2019a, b; Hurst et al., 2022). Compared to other marine organisms, shellfish possess the highest potential for permanent carbon fixation, making their ecosystem contributions a focal point of research (Feng et al., 2023).
By the end of 2020, shellfish carbon sequestration in China’s national marine ranching demonstration areas reached 2.5 million tons (Cao and Shen, 2022). However, high-density shellfish populations may negatively impact marine ecosystems, potentially altering ecosystem structures, reducing biodiversity, and causing functional group collapses (Han et al., 2018). Therefore, evaluating the ecological carrying capacity (ECC) of shellfish and the broader system is crucial for the sustainable development of marine ranching and optimizing their ecological restoration and carbon sink functions.
Carrying capacity is defined as the maximum biomass of a specific population that an ecosystem can sustain under given environmental conditions, such as food and habitat availability (Filgueira et al., 2021). Inglis et al. (2000) categorized shellfish carrying capacity into four dimensions: physical, production, ecological, and social. Among these, ECC refers to the maximum biomass of target species that can be supported without causing long-term adverse impacts on the species or ecosystem (McKindsey et al., 2006). Significant progress has been made in studying ecological capacity, encompassing ecosystem restoration (Xu et al., 2019), resource recovery (Oginah et al., 2020), structural improvement (Hurst et al., 2022), and sustainable aquaculture (Zhang et al., 2023).
Various methods exist for assessing ECC, including the food restriction index (Bacher et al., 2003), numerical models (Zhao et al., 2019), and feed budget models (Liu et al., 2015). However, these methods often focus on single limiting factors, overlooking system-level interactions, which can lead to inaccuracies. To accurately determine ECC, it is essential to incorporate predator-prey relationships and environmental dynamics (Shi et al., 2024). The Ecopath with Ecosim (EwE) model is widely employed for this purpose, as it evaluates ecosystem structure and energy flows based on nutrient dynamics (Papapanagiotou et al., 2020). Studies utilizing the EwE model have addressed various taxa, including crustaceans (Feng et al., 2022), fish (Xu et al., 2011), and shellfish (Li et al., 2023), across diverse ecosystems such as ponds (Xiao et al., 2023), rivers (Sreekanth et al., 2021) and oceans (Wang et al., 2022).
Estimating ECC using the EwE model requires comprehensive food web data, for which stable isotope technology is considered highly reliable (Newell et al., 2022). Stable isotopes in animal tissues record trophic level and food source information. Stable isotopes δ13C trace carbon flow pathways and food sources, while stable isotopes δ15N estimate trophic levels. This combination enhances the accuracy of EwE model outputs (Tadiso et al., 2011; Endo et al., 2012). Researchers have integrated stable isotope techniques with EwE models to study diverse aquatic ecosystems, including reservoirs (Moraes et al., 2020), fisheries (Gao et al., 2021), and marine ranching (Wang, 2023).
This study focuses on the Haizhidu marine ranching area in the Bohai Sea, a national demonstration area spanning 667 ha. Located in Tangshan Bay National Tourism Island, the site offers favorable environmental conditions, including minimal typhoons, stable sea states, and well-developed infrastructure (Wang, 2021). Using stable isotope technology (δ13C and δ15N) combined with the EwE model, we evaluated the effects of marine ranching construction on ECC, stability, and biological carbon sequestration potential. Additionally, we estimated the carbon sequestration potential of shellfish and the broader system under conditions of ECC. This study aims to provide a scientific basis for optimizing the ecological restoration and carbon sequestration functions of marine ranching.
2 Materials and methods
2.1 Study area
Haizhidu marine ranching is located near the Tangshan Bay International Tourism Island, in the center of the Bohai Bay (Figure 1). The sea area belongs to the northern temperate monsoon climate, with an average annual temperature of roughly 10°C and an average precipitation of 613.2 mm/a. According to historical meteorological data, there are rare records of disastrous weather and severe sea conditions in the sea area, and it is one of the fourth batch of national marine ranching demonstration places in China.
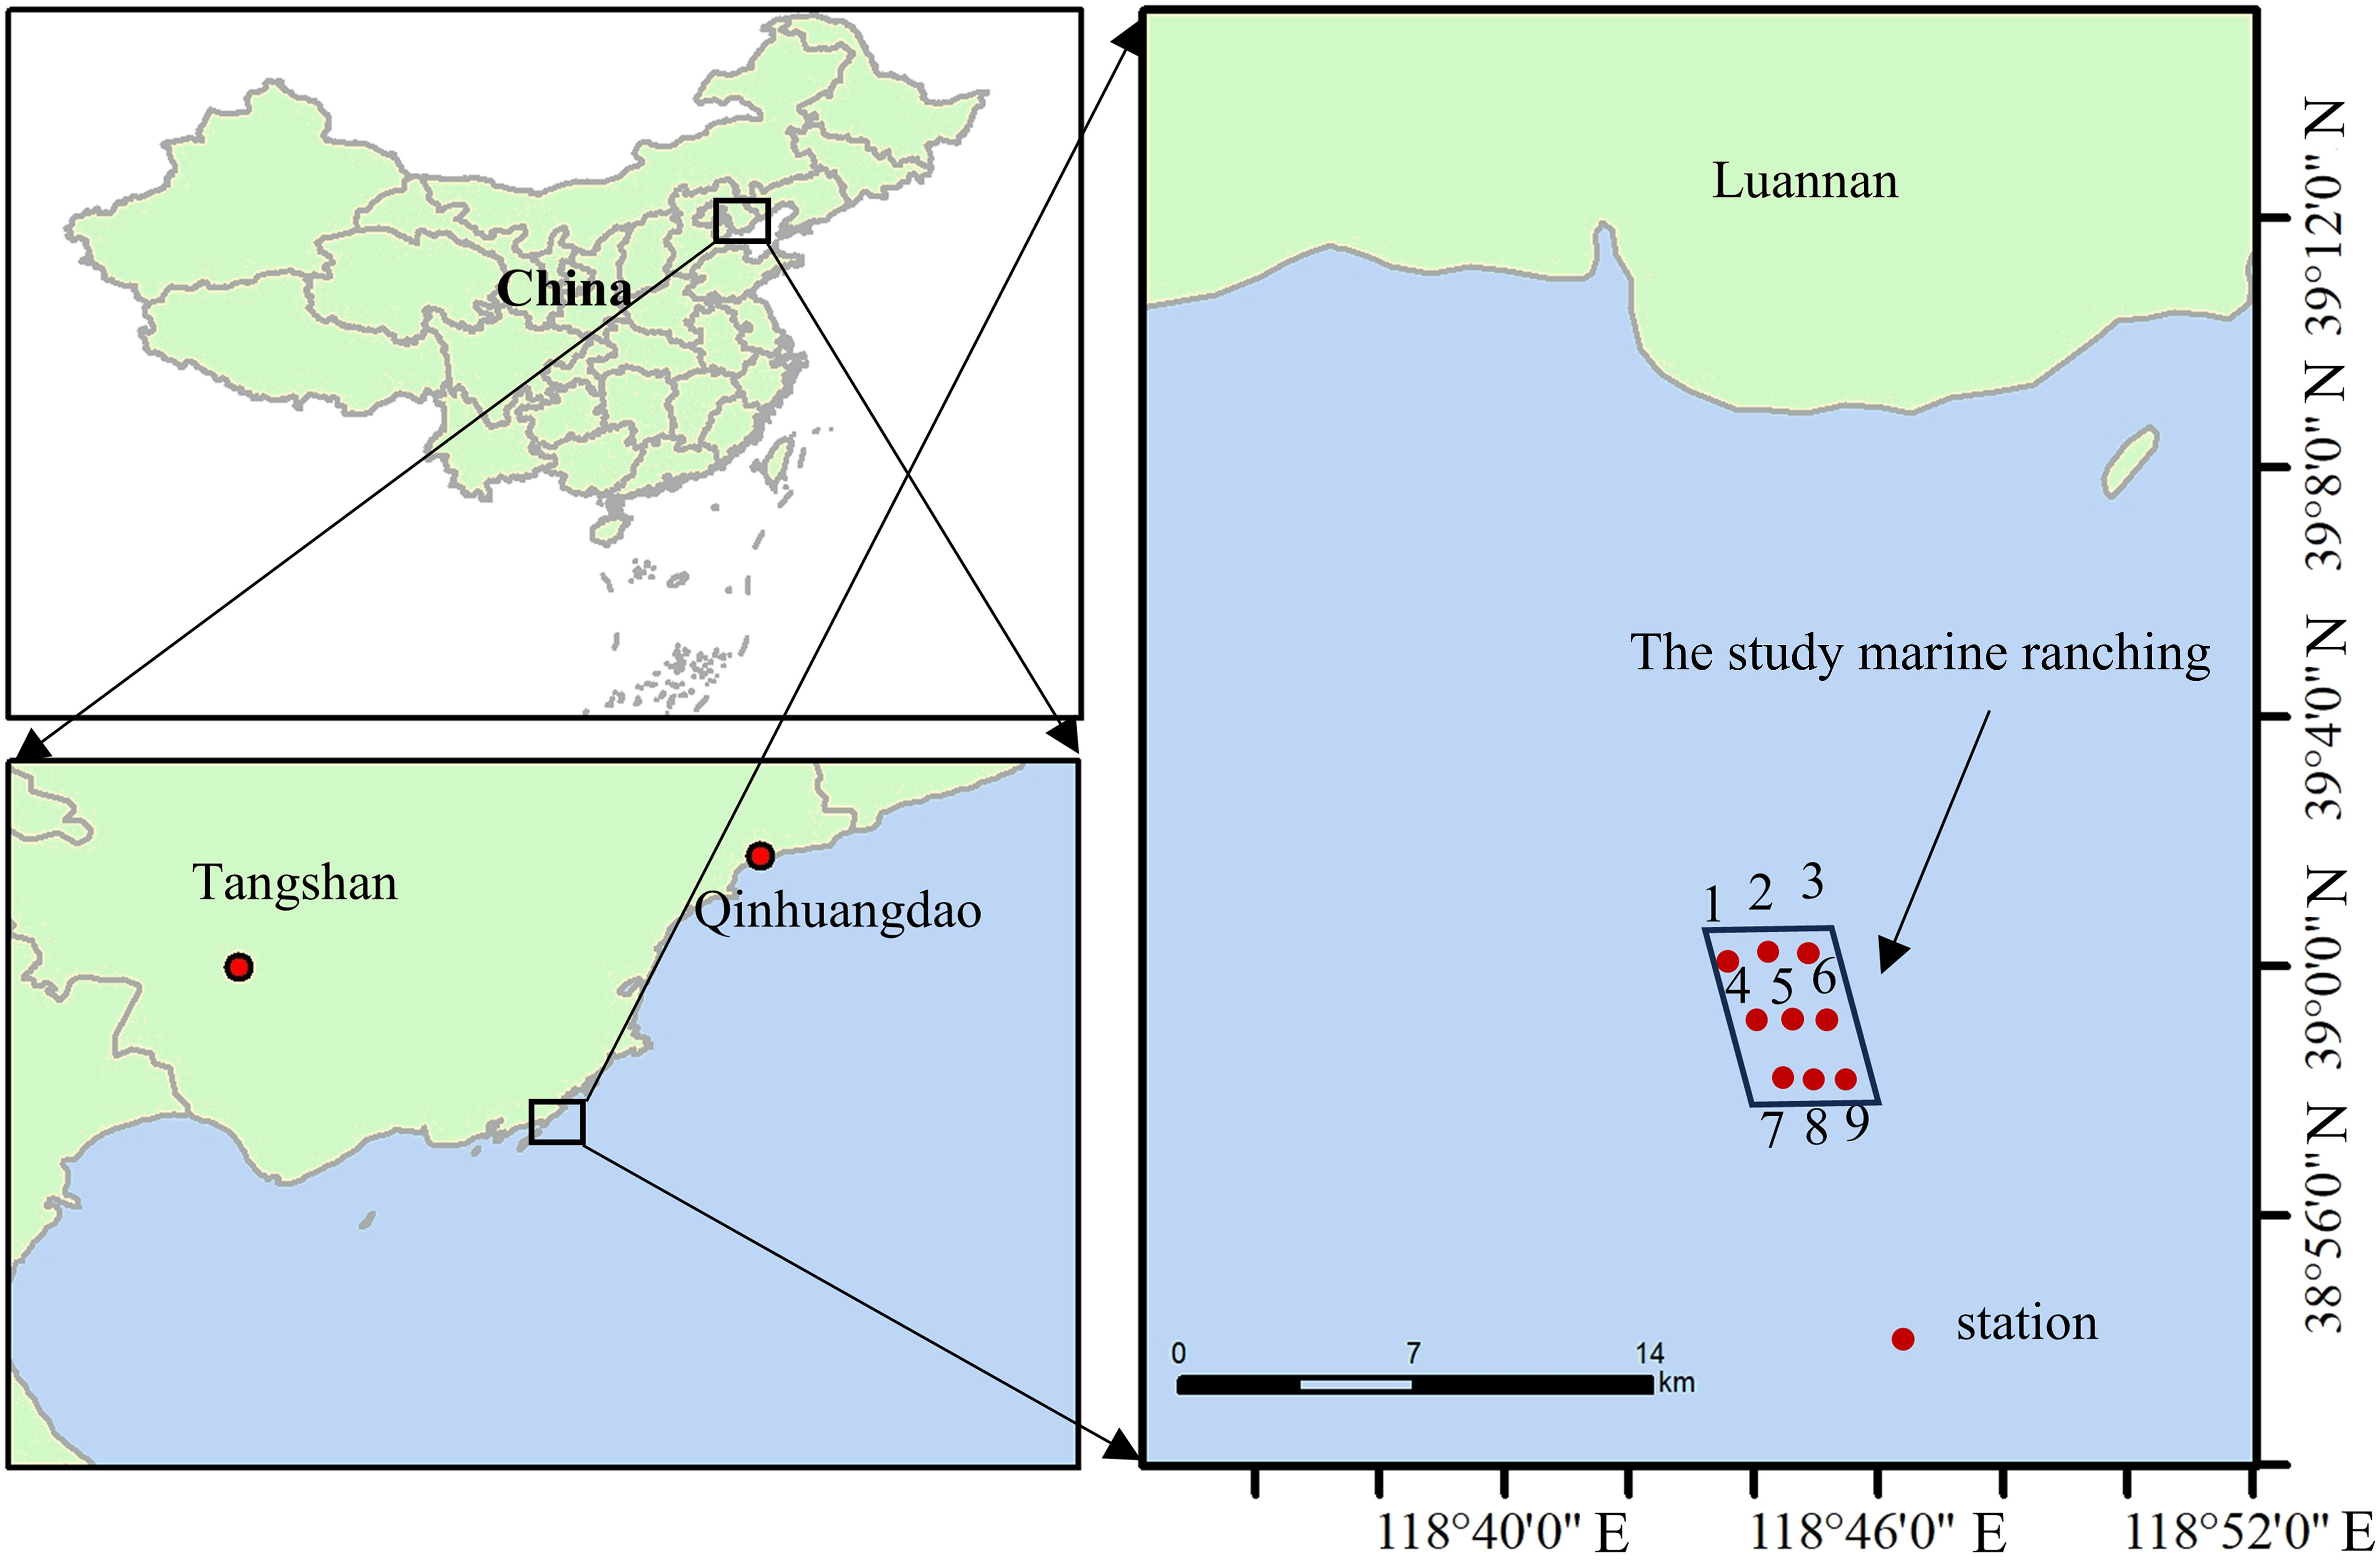
Figure 1. Schematic diagram of survey stations in the Haizhidu marine ranching.
Haizhidu marine ranching is intended to constructing a muddy seabed ecological restoration system in the Bohai Sea. Since 2017, it has deployed a total of 1.477×10⁵ m3 of diverse reefs, including 7.54×10⁴ m3 of rock reefs, covering 667 ha of sea area (Wang, 2021).
2.2 Sample collection
Sample collection was done in July 2023 (summer) on a diesel-powered big marine ranching resource assessment and conservation fishing vessel (Figure 2). The sampling methods specified in the specification for marine monitoring (GB 17378-2007) and the specifications for oceanographic survey (GB 12763-2007) were strictly followed to collect plankton, benthos and swimming organisms respectively.
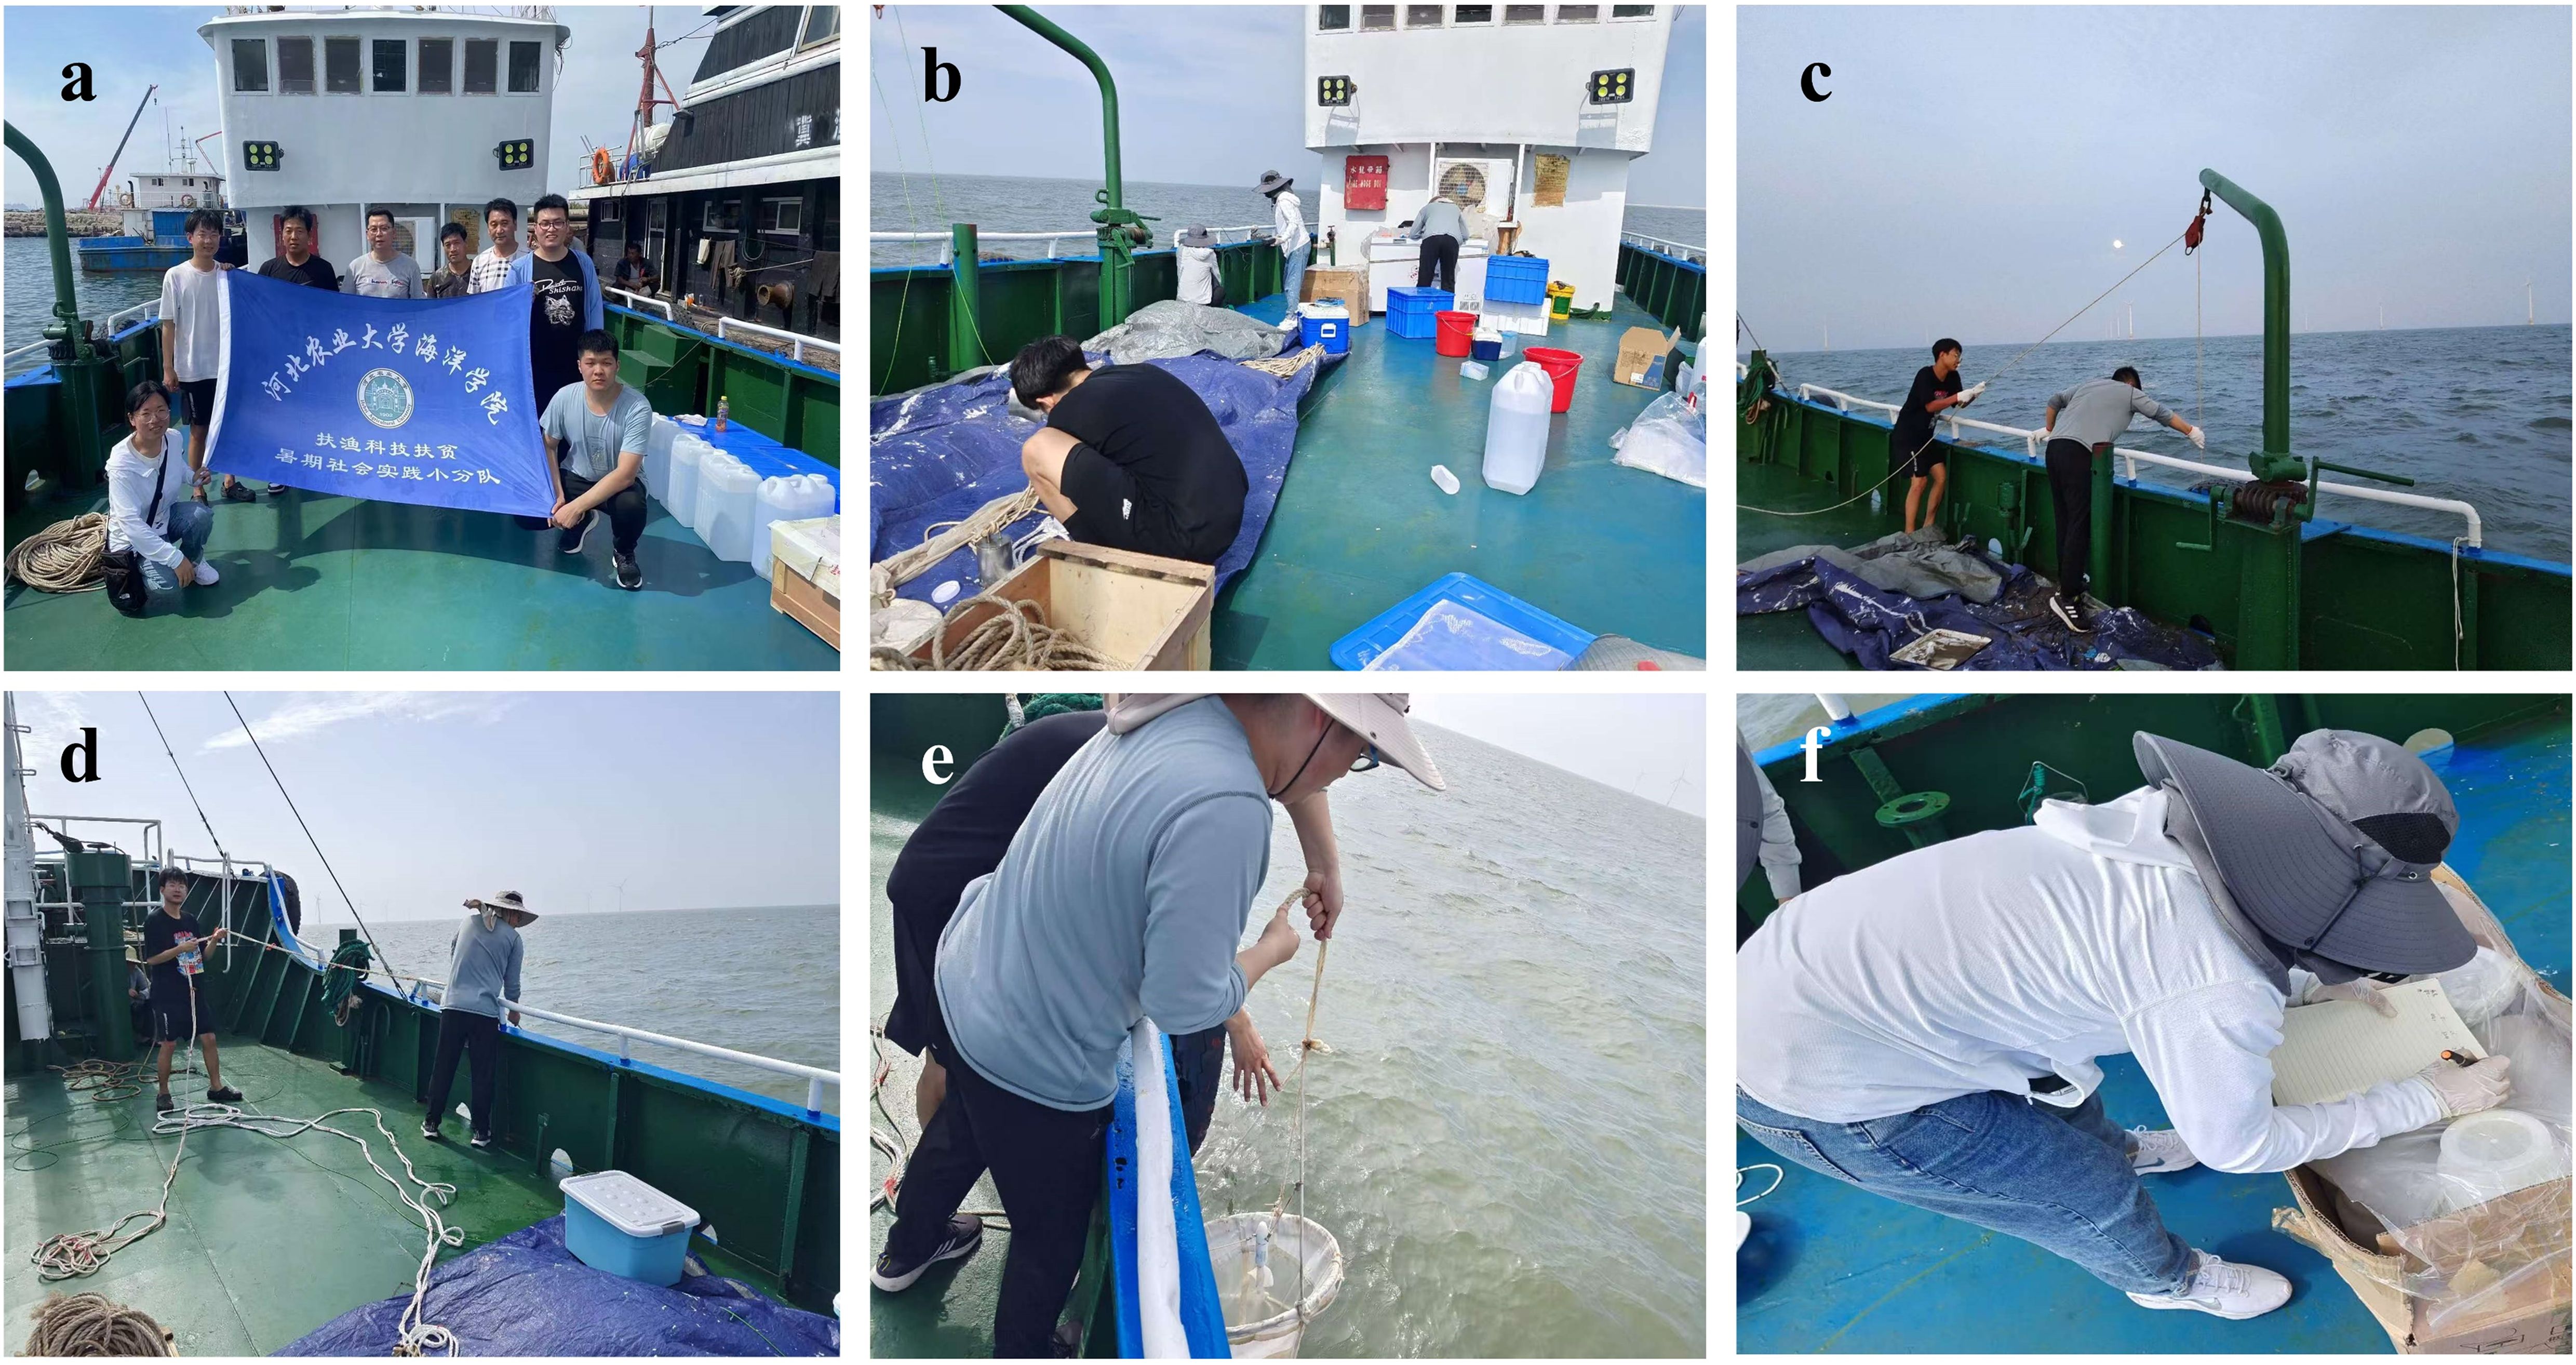
Figure 2. On-site sampling (a: group photo of the crew; b: preparation before sampling; c: collecting sediments; d: collecting phytoplankton; e: collecting zooplankton; f: recording data).
In this study, plankton were sampled using shallow water type I and III plankton nets. During sampling, vertical tows were conducted from the bottom to the surface layer at a constant speed of 0.5~1.0 m/s. The nets were rinsed with distilled water into 500 ml polyethylene bottles. For phytoplankton, 505 μm sieve silk was used to filter out zooplankton, while phytoplankton were preserved in 1% Lugol’s solution, and zooplankton in 4% formaldehyde solution.
For swimming organisms in the study area, dip nets (8.5 m long, 30 cm × 20 cm cross-section, 2.5 cm mesh size) and gillnets (50 m long, 1.4 m high, 2.5 cm mesh size) were used and collected after 3 days.
For benthos, a 0.1 m2 grab sampler was used. For macrofauna, four replicates per site were taken, washed through a 500 μm sieve, and preserved in 75% alcohol. For meiofauna, each site was sampled twice. An acrylic tube was used to collect undisturbed sediment from 5 cm depth, with three replicates. Samples were stored in 250 mL polyethylene bottles with 75% alcohol.
Particulate organic matter (POM) was collected in line with the specification for marine monitoring. Part3: Sample collection, storage and transportation (GB 17378.3-2007). Sedimentary organic matter (SOM) was collected on sites using a grab sampler, and each station was collected three times. Undisturbed sediments at 0~2 cm were obtained and deposited in acid-washed polyethylene bags after passing through a 42 μm standard filter (to eliminate macrofauna and meiofauna). All samples were held frozen at −20°C until further examination.
2.3 Total carbon and stable isotope analysis
Thoroughly combine all samples used for total carbon (TC) and stable isotope ratio (δ13C and δ15N) determinations, weighed and recorded the wet weight for calculating the carbon content. The samples were then freeze-dried, weighed for dry weight, ground, and passed through a 100-mesh sieve. The total carbon of all samples is determined using an Elementar Vario elemental analyzer (Vario TOC cube, Elementar company), with results directly produced as dry weight carbon content (%).
Before carbon and nitrogen stable isotope analysis, membrane samples were fumigated with 1N HCl to remove inorganic carbon, then dried at 60°C and stored frozen. Powder samples were acidified with 1N HCl (10 mL per 1 g sample), rinsed three times with deionized water, dried at 60°C, ground, and kept for analysis. The carbon and nitrogen stable isotope measurements of all samples were carried out in the Stable Isotope Laboratory of the School of Environment and Ecology of Xiamen University. The δ13C and δ15N of the samples were measured by isotope mass spectrometry (EA-IRMS, Thermo Fisher Delta V Advantage). Each sample was measured in triplicate to ensure the accuracy of the results. The results are expressed in the standard unit δ symbol (Equation 1), which is defined as follows:
Among them, X=13C or 15N, R=13C/12C or 15N/14N ratio. The standard species for carbon stable isotopes is Vienna Pee Dee Belemnite standard (VPDB), and the standard material for nitrogen stable isotopes is nitrogen (N2) in purified atmosphere (Planas, 2022).
All species are categorized into three classes according to their food composition: planktonic and detritus feeders, omnivore, and carnivores to determine the types of food they may receive. Then, the MixSIAR model of R 4.0.5 was used to assess the contribution rate of probable food sources in different functional groups.
2.4 Model construction principle
In the EwE model, an ecosystem is defined as consisting of ecologically connected biological functional categories. Functional groupings can include plankton, organic detritus, a type of fish, fish at a certain age stage, or species with comparable ecological traits (such as dietary composition). All biological functional groupings should encompass all material or energy flow activities in the ecosystem. According to the theory of thermodynamics, the intake and output of materials or energy of a biological functional group in an ecosystem should be balanced, that is, productivity is equal to the sum of predation deaths, biological accumulation, catch, migration and other deaths (Equation 2). This can be expressed by the mathematical equation:
where, Bi represents the biomass of functional group (i). (P/B)i represents the ratio of productivity to biomass of functional group (i), (Q/B)j represents the ratio of total food intake to biomass of functional group (i), and EEi is the ecotrophic efficiency of functional group (i). DCij represents the proportion of prey (j) in the food composition of predator (i). BAi is the bioaccumulation of functional group (i). Yi is the catch or harvest of functional group (i), and Ei is the net migration of functional group (i) (migration out minus immigration).
Another equation is used to check and determine the mass balance of the system (Equation 3). That is, the consumption of each biological functional group should be equal to the sum of the production, respiration and undigested food of the biological functional group, expressed as the following formula:
where, Ri represents the respiration of functional group (i), and Ui represents the proportion of undigested food absorbed by functional group (i).
Ecosim is a time dynamic model based on Ecopath. It simulates the response changes of the ecosystem in a time series by gradually changing the parameters of the Ecopath model over time. This method was originally proposed by Pauly (1980) (Equation 4). The equation used by the Ecosim model is as follows:
where, dBi/dt is the rate of change of biomass, is the net growth efficiency, Qji is the consumption rate of functional group j to functional group i, Ii is the migration rate, Fi is the fishing mortality rate, Moi is the non-predator natural mortality rate, Ei is the immigration rate, and Bi is the biomass of functional group i.
2.5 Functional group division and parameter sources
This study mainly differentiates functional groups based on factors such as species, individual number, and diet. The similar species and species diet, and habitat conditions are categorized into the same functional group, while species with considerable commercial value, proliferation potential, or ecological functions are classified into a separate functional group (Colléter et al., 2015). We developed 20 functional groups in the Haizhidu marine ranching region, which generally covers the complete process of the structure and energy flow of all biological communities in the Haizhidu marine ranching. The specific classification is presented in Table 1.
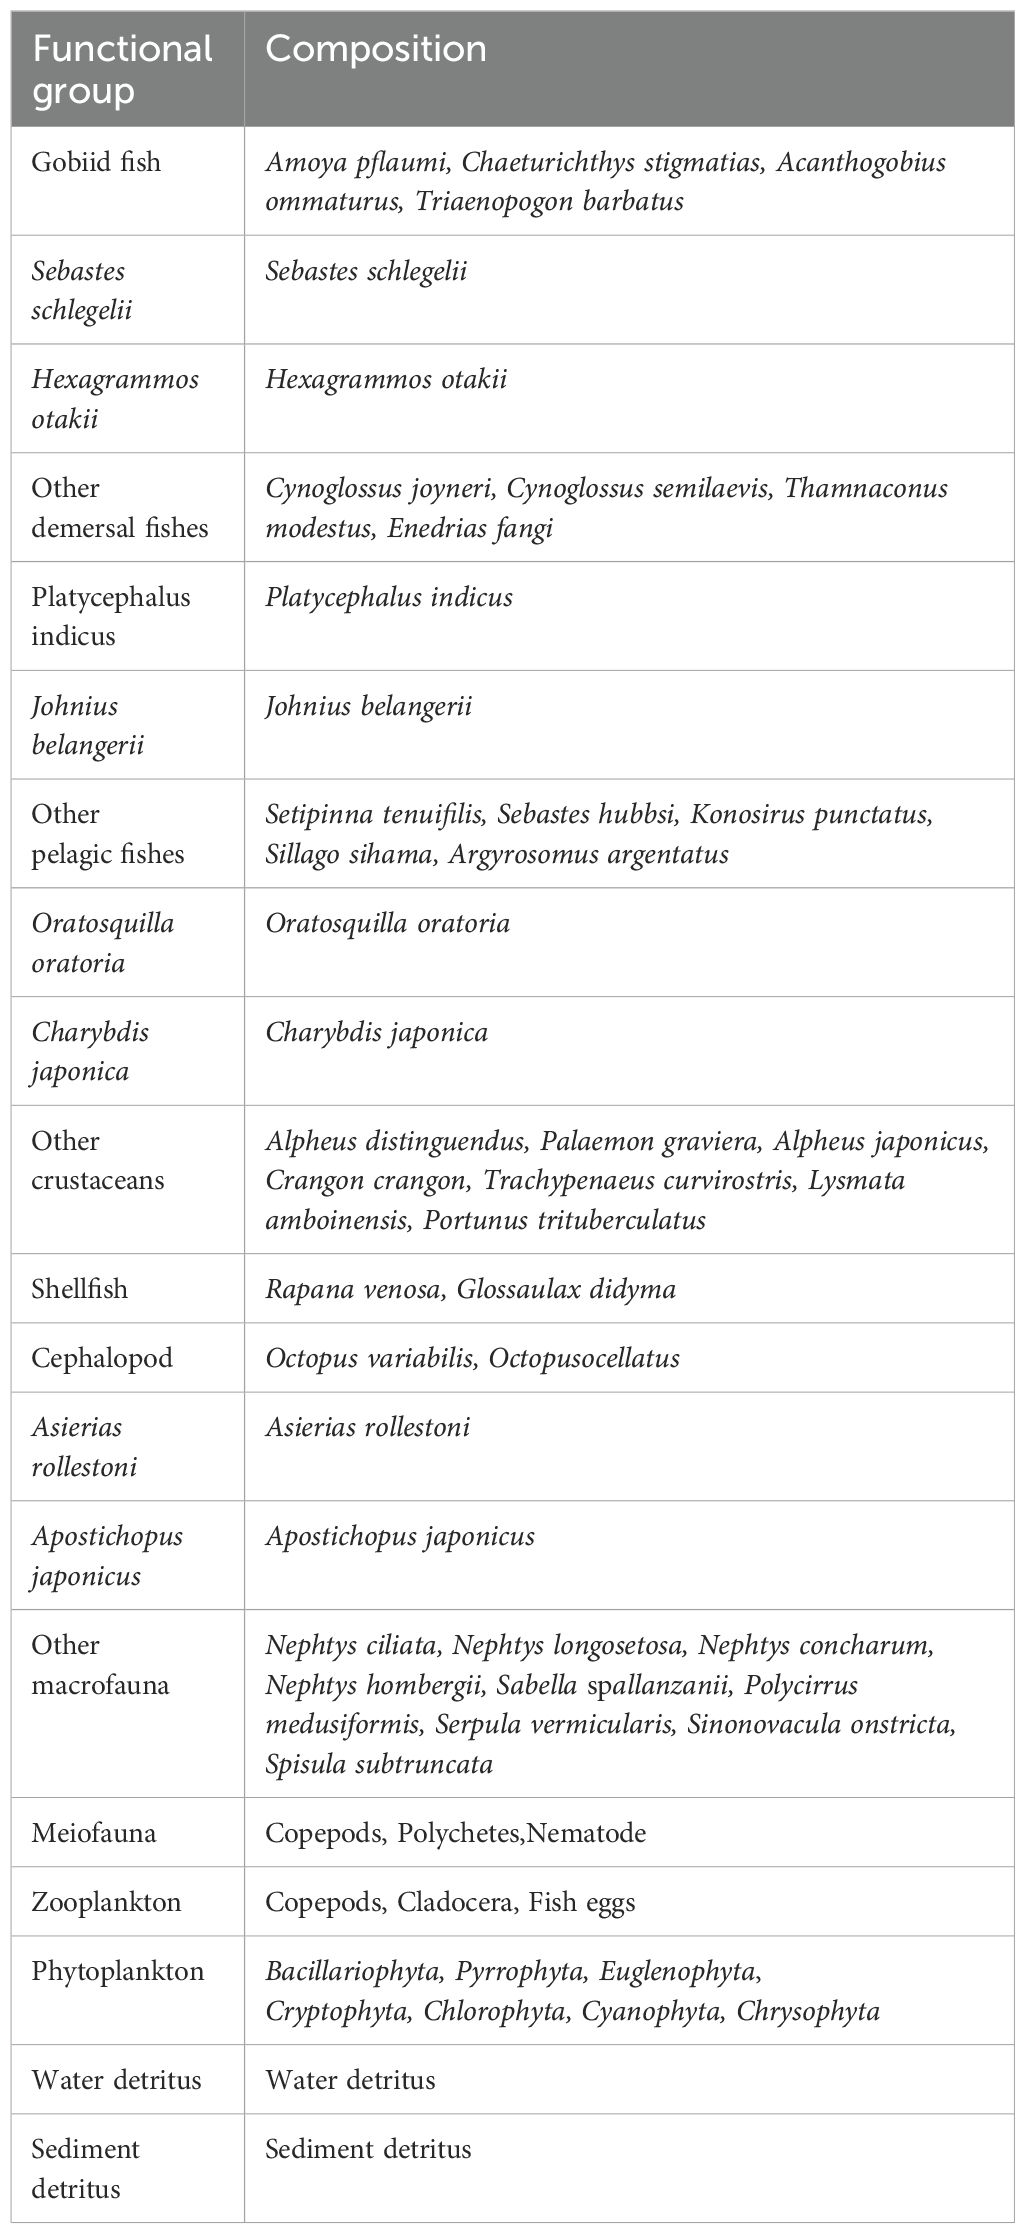
Table 1. Functional groups and species composition in Haizhidu marine ranching.
In the Ecopath model, the input data include biomass, productivity to biomass ratio (P/B), consumption rate to biomass ratio (Q/B) and ecological efficiency (EE). Three of these four parameters must be entered. Since the EE value data of biological functional groups are usually difficult to get, in general, the input parameters are the other three except the EE value. In order to ensure that the Ecopath model reaches a balanced state, the criterion that the EE values of all functional groups must be less than or equal to 1 must be met (Christensen et al., 2005). In addition, the Diet composition (DC) is also one of the characteristics required to create the Ecopath model. In this study, the parameters required to be input for the EwE model of the marine ranch area include biomass, P/B, Q/B and DC. During the experiment, these required parameters were measured and gathered as follows:
In this study, the biomass of the Haizhidu marine ranching environment is described in wet weight (t/km2) to characterize the flow of energy. The biomass of all functional groups, save sediment detritus, was assessed and quantified by field experiments. The biomass of sediment detritus was determined using the conversion formula published by Pauly and Christensen (1993) and then deducted from the amount of water detritus.
The P/B and Q/B values of some fish-related functional groups were calculated using the formulas proposed by Pauly (1980) and Palomares and Pauly (1998), while the P/B and Q/B values of other functional groups were estimated with reference to nearby sea areas or ecosystems with similar characteristics at the same latitude, and adjusted in combination with the actual situation of Haizhidu marine ranching (Tumbiolo and Downing, 1994; Xu et al., 2019; Zhang et al., 2020; Li et al., 2023).
The DC was constructed using the results of carbon and nitrogen stable isotope analysis, and with reference to relevant literature and the website www.fishbase.de, as well as food web models at the same latitude or with similar characteristics. The exact input characteristics of the Haizhidu marine ranching area are provided in Supplementary Table S1 & S2, Supplementary Table S3 for parameter sources.
2.6 Ecological carrying capacity assessment and dynamic simulation
In this study, to reflect the balance and stability of the ecosystem in the Ecopath model, we assessed the ECC of all functional groups excluding phytoplankton, water detritus, and sediment detritus. The specific strategy is to gradually increase the biomass of a functional group until the EE of any functional group reaches 1, at which time the functional group is judged to have attained the ECC.
Using the Ecosim dynamic simulation tool, we built and simulated three different situations. The first scenario is to maintain the existing population size; the second scenario is to make the population size reach the ECC; the third scenario is to make the population size surpass the ECC by 20%. Under the circumstances of varied biomass levels, we ran a 30-year simulation experiment on grazing expansion of target species. During the simulation, the grazing intensity rose linearly from the second year until it reached the predetermined level in the sixth year, and then remained stable for the following 24 years. Finally, we extracted the time series data of relative biomass changes under each simulation scenario for later study (Li et al., 2023).
2.7 Uncertainty analysis of Ecopath model
In order to assess whether the parameters after equilibrium correction comply to the basic rules of ecosystem ecology, this study used the PREBAL module to perform a pre-equilibrium test on P/B and Q/B between taxa and trophic levels (Peterson and Fry, 1987). The conditions that need to be met for the test include: (1) the biomass of the functional group should span 5 to 7 orders of magnitude; (2) the slope of the biomass of the functional group on the logarithmic scale should show a 5% to 10% downward trend in all taxa with increasing trophic level; (3) the P/B and Q/B of each functional group should decrease with increasing trophic level. In addition, for biomass, P/B, Q/B and DC values, the Pedigree index can be used to evaluate the overall quality of the ecosystem model. This index thoroughly evaluates the uncertainty of the data source and combines the uncertainty components of each functional group. We conducted 500 Monte Carlo simulations to assess the sensitivity of Ecosim results to the Ecopath input parameters (biomass, P/B, and Q/B), with each parameter varying by 10%.
2.8 Ecological network analysis
In this study, we used a collection of ecological indicators to completely describe the structure and function of the ecosystem using the ecological network analysis (ENA) module of the EwE software (Loneragan et al., 2013). For details, please refer to the work of Sreekanth et al. (2021). We quantified the overall characteristics of the ecosystem by evaluating key indicators such as total system throughput (TST), total primary productivity (TPP), total biomass (TB) and total respiration (TR), which are important for assessing the overall activity and size of the ecosystem (Xu et al., 2019; Ortiz et al., 2015). In addition, the TPP/TR and TPP/TB ratios were determined to measure the stability and maturity of the ecosystem (Odum, 1969).
To analyze the complexity of the food web, we employed metrics such as the Finn’s cycling index (FCI), connectivity index (CI), system omnivory index (SOI) and Finn’s mean path length (FMPL) (Finn, 1976; Libralato, 2013). At the same time, the ascendancy (A) and overhead (O) indicators were utilized to evaluate the development maturity and resilience of the ecosystem to disturbance (Ulanowicz, 2004). entropy (H) and average mutual information (AMI) metrics were employed to assess the intensity of energy interaction within the system and the deterministic connection between distinct biological groupings, respectively (Ulanowicz, 2004).
This study also calculated the trophic transfer efficiency (TTE), which is the ratio of the output to the throughput of adjacent trophic levels. For systems including more than two trophic levels, the average TTE value was employed. The shannon diversity index (SDI) was employed as an index to measure biodiversity. The changes in the ecological network index were intuitively displayed through radar plots to depict the dynamic changes of the environment. In addition, the Lindemann energy flow diagram was utilized to demonstrate the changes in energy transfer before and after the shellfish value-added, so as to better study the energy transfer efficiency within the ecosystem.
2.9 Biocarbon sequestration potential of the Haizhidu marine ranching
In this study, we used the biomass assessment method to calculate the current biomass carbon sequestration in the marine ranch ecosystem based on the relationship between carbon content, production and carbon sink, combined with previously measured carbon content data and field biomass survey data (Liu et al., 2024). In addition, together with the ECC predicted by the Ecopath model, we further assessed the biomass carbon sequestration potential of the marine ranching.
3 Results
3.1 Isotopic composition and food contribution ratio
As shown in Figure 3, the δ13C values of samples in the study area ranged from (-24.41 ± 0.32)‰ to (-15.58 ± 0.30)‰, with a total span of 8.83‰ and an average of (-18.89 ± 0.20)‰. Phytoplankton had the lowest δ13C value, followed by POM and zooplankton, at (-24.31 ± 0.26)‰ and (-24.02 ± 0.28)‰, respectively. The highest δ13C values were found in macrofauna. Additionally, Apostichopus japonicus, Setipinna tenuifilis, and Charybdis japonica showed relatively high δ13C values of (-16.14 ± 0.18)‰, (-16.71 ± 0.28)‰, and (-16.76 ± 0.21)‰, respectively. The δ15N values in the study area ranged from (2.40 ± 0.48)‰ to (13.39 ± 0.31)‰, with a total span of 10.99‰ and an average of (10.97 ± 0.31)‰. Sediments had the lowest δ15N value, while POM had the second-lowest at (2.67 ± 0.83)‰. The highest δ15N values were found in Chaeturichthys stigmatias, followed by Amoya pflaumi and Triaenopogon barbatus, with values of (13.04 ± 0.44)‰ and (13.00 ± 0.3)‰, respectively.
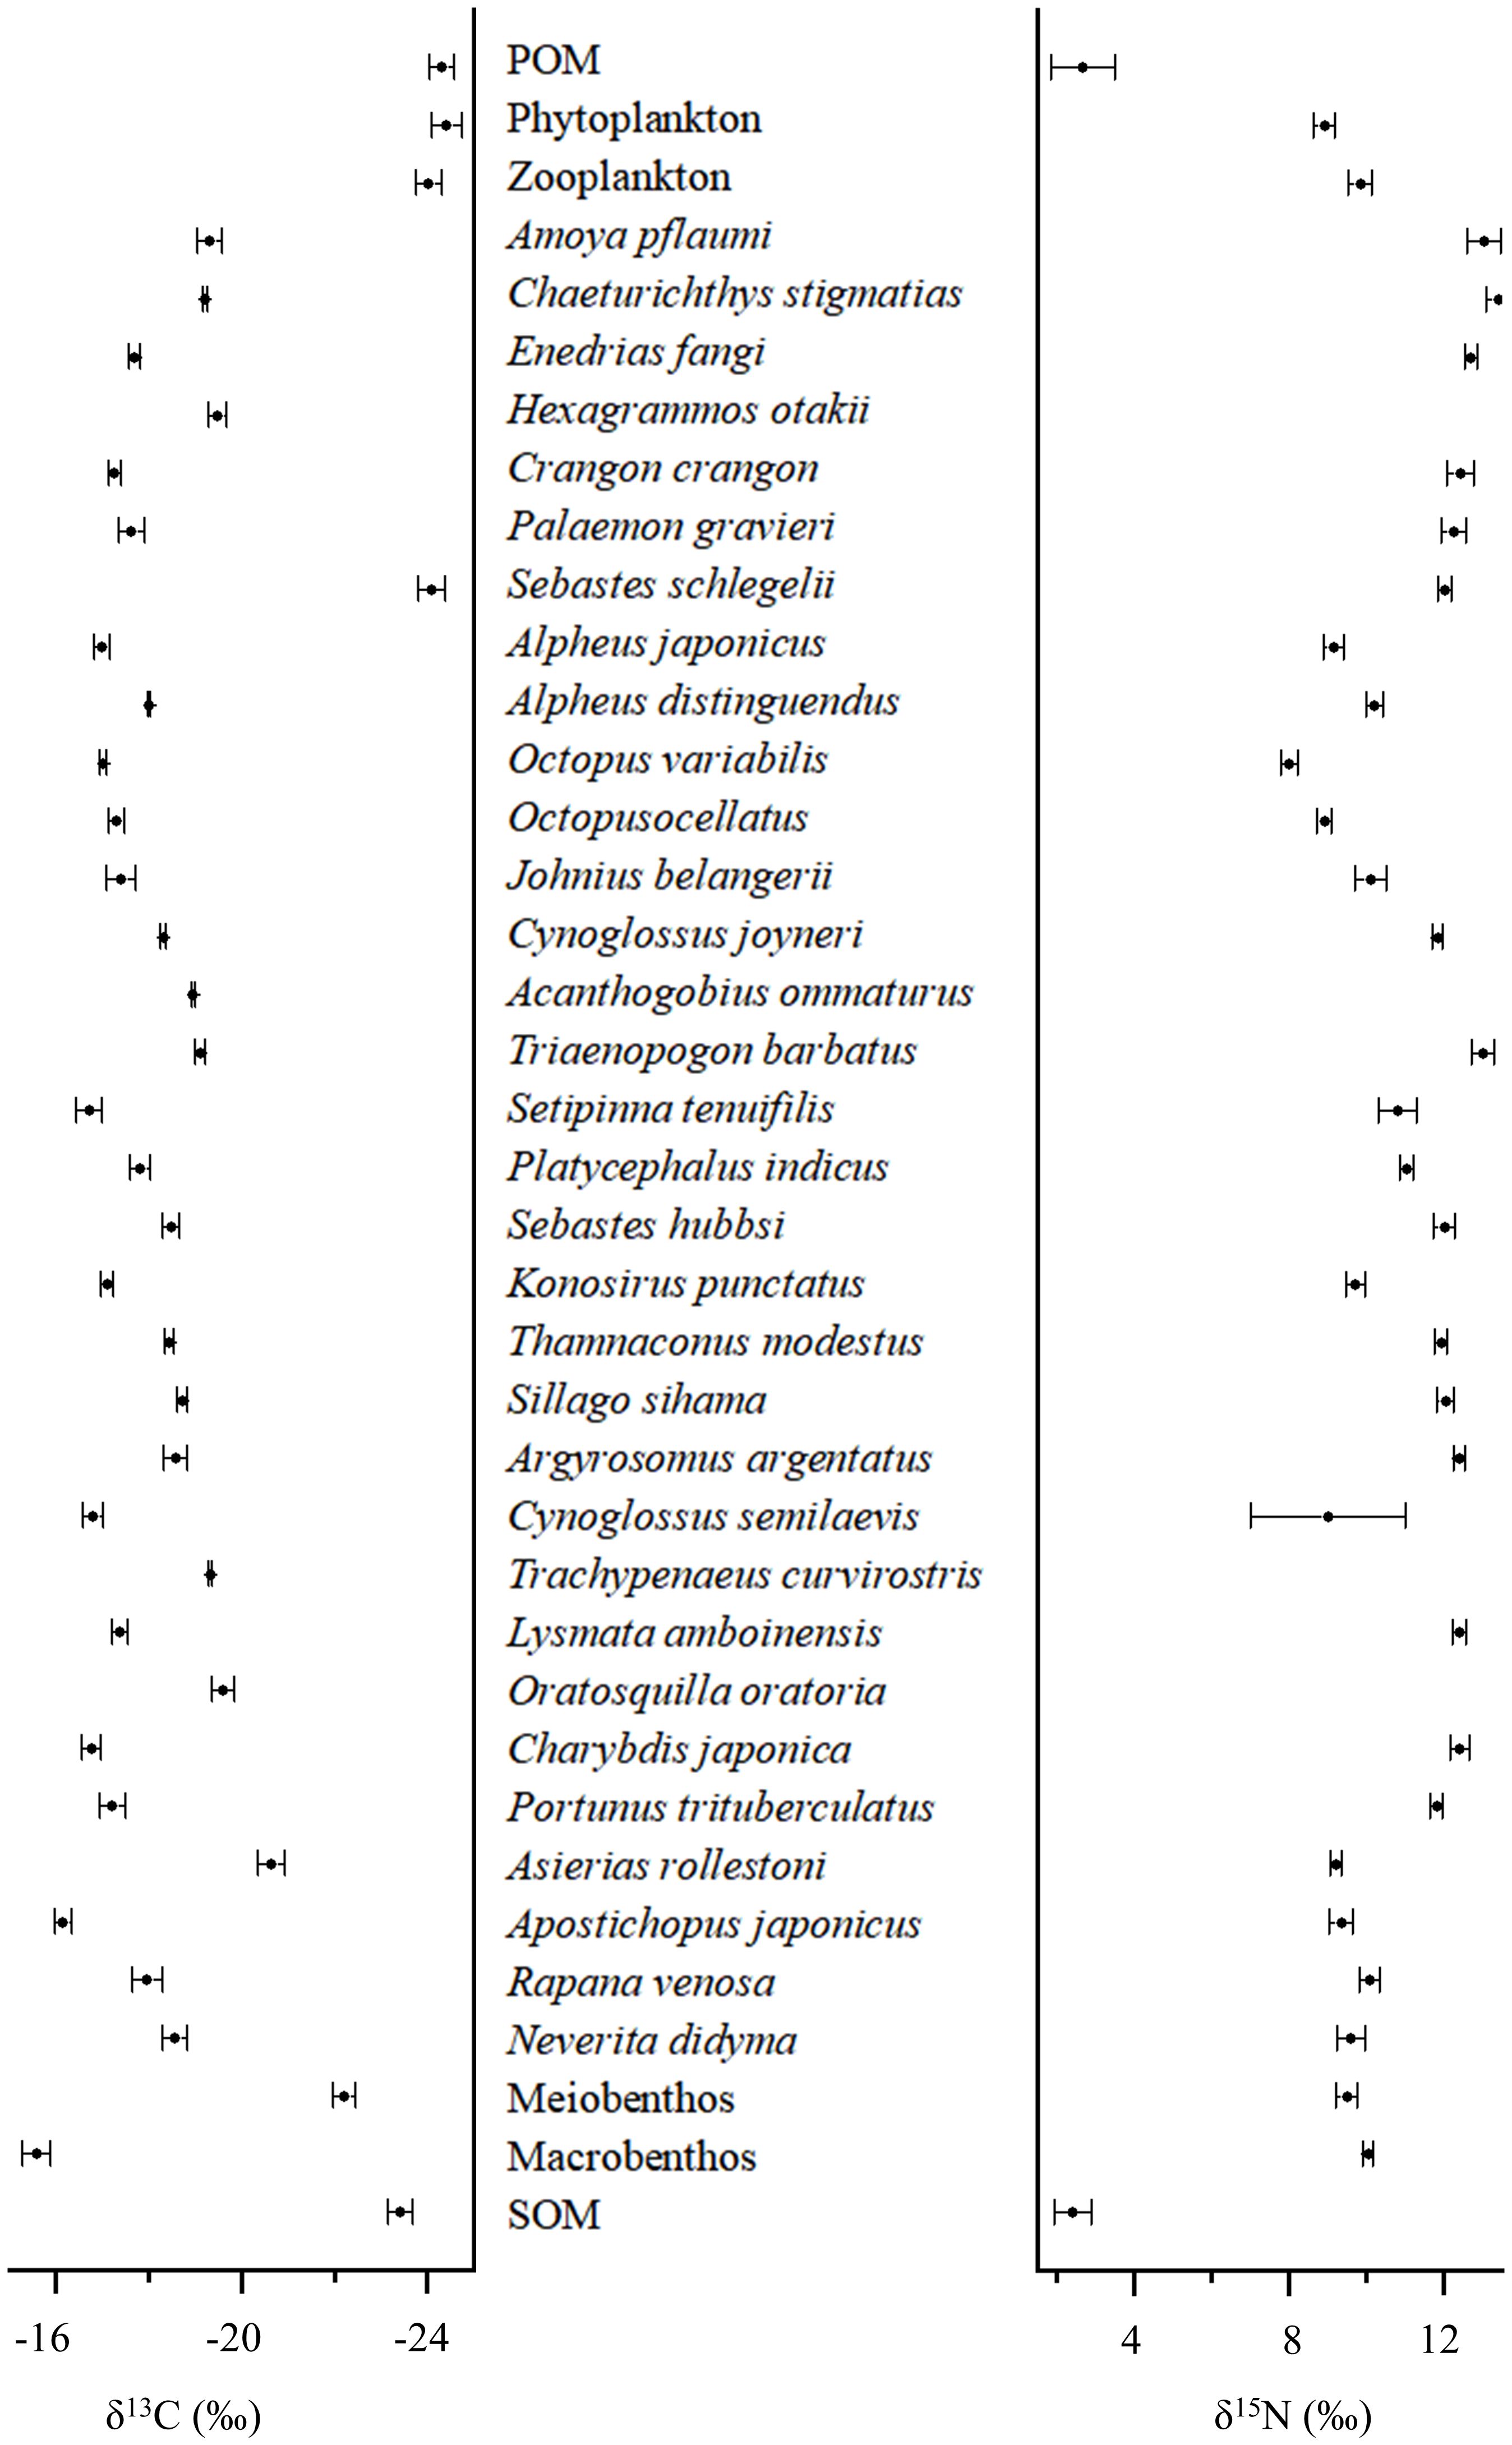
Figure 3. δ13C and δ15N of biotic and abiotic components in the study area.
As shown in Table 2, results of the MixSIAR model analysis of the dietary sources of 36 biological species indicate that zooplankton are the mostly consumed feed. Crustaceans are the biggest consumers of zooplankton, with a maximum contribution rate of 40.2%. Zooplankton mainly feed on phytoplankton and POM, which account for 42.8% and 35.01% of their diet, respectively.
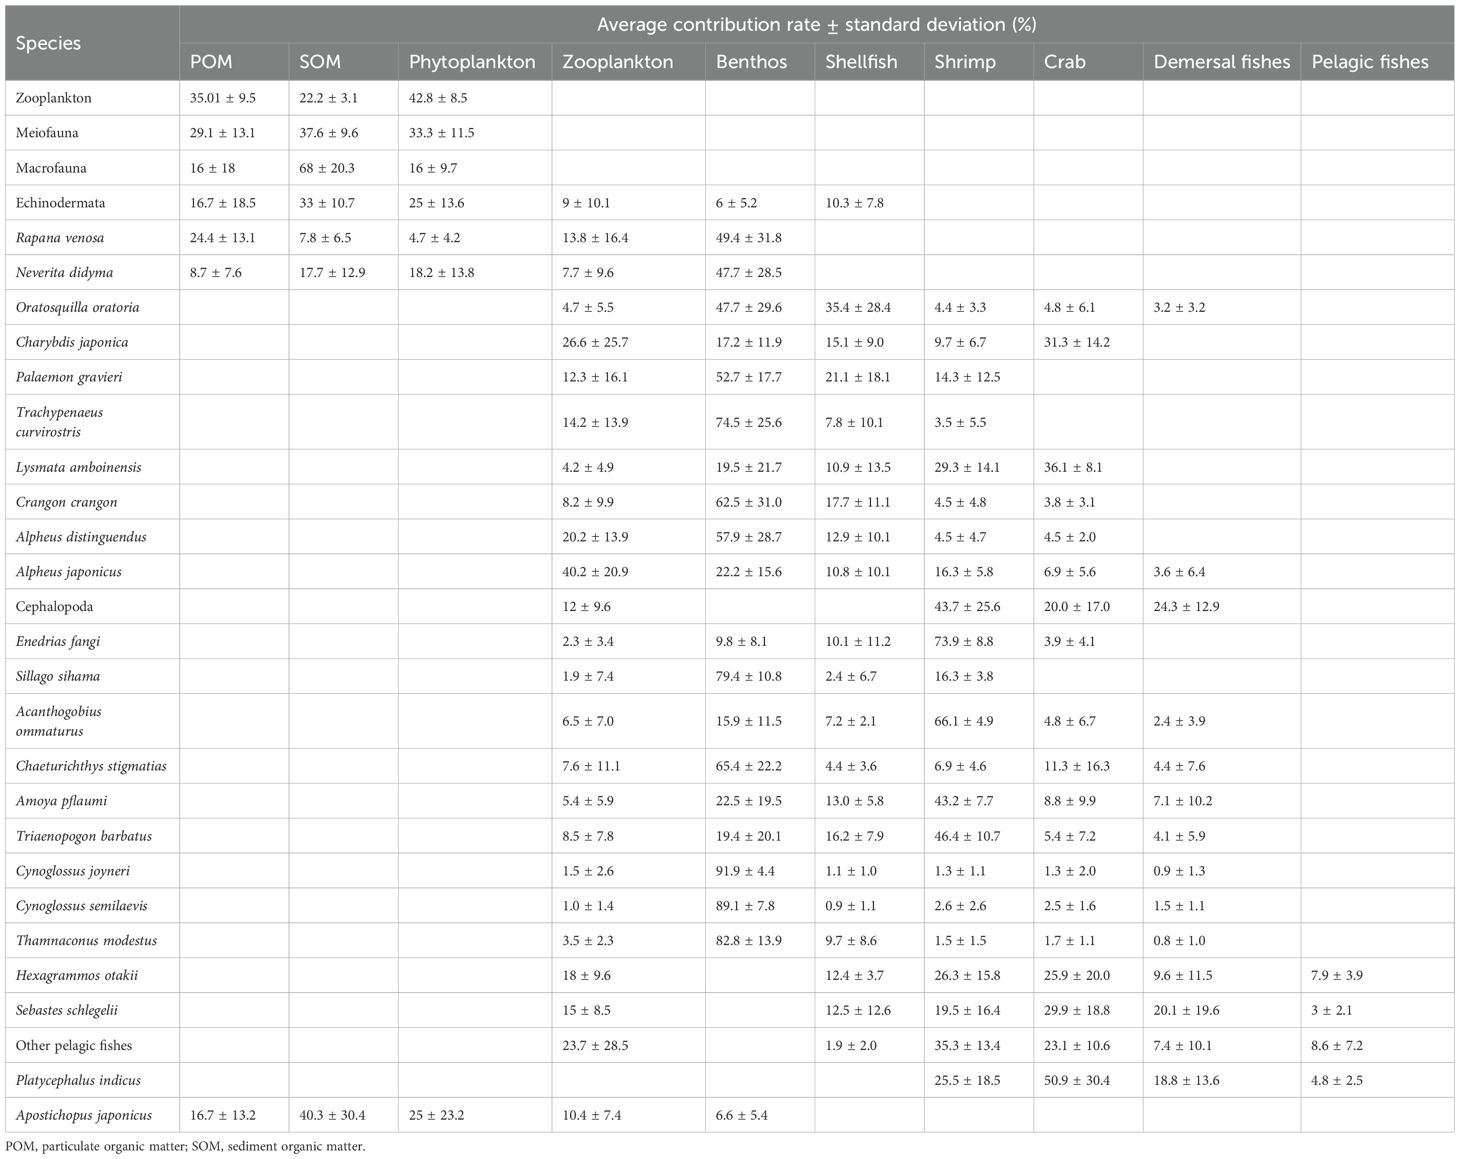
Table 2. Food contribution rates of each species in the Haizhidu marine ranching.
3.2 Ecological model quality analysis
In this study, we used the PREBAL pre-test to check the consistency of biomass, P/B, Q/B, and P/Q of the food web model in the study area. The results are shown in Supplementary Figure 1. The PREBAL results are consistent with the overall trend shown by the model. Specifically, the biomass of cephalopods may be overestimated, while the biomass of Charybdis japonica, shellfish and Apostichopus japonicus may be underestimated. In addition, the mortality rate of zooplankton and the consumption rate of other other macrofauna may also be overestimated. After PREBAL pre-test, our model data showed high consistency and are therefore relatively credible.
The confidence index of the Ecopath model for the study area was recorded at 0.69. According to the guidelines proposed by Morissette et al. (2006), the typical range for the general confidence index is between 0.16 and 0.68. Monte Carlo simulations show that the optimal input parameters for B, P/B, and Q/B are consistent with the actual inputs and remain unchanged. The confidence level of the Haizhidu marine ranching Ecopath model, as developed in this study, exceeds the upper limit of this range. Consequently, the model’s credibility is considered high.
3.3 Ecological carrying capacity assessment
In this investigation, the parameters output by the Ecopath model are provided in Table 3. In the Haizhidu marine ranching ecosystem, the biomass of the sediment detritus functional group is the biggest, reaching 37.75 t/km2; followed by phytoplankton, which is 21.40 t/km2; and the lowest biomass is the other pelagic fishes, which is just 0.26 t/km2. In addition, in this ecosystem, the EE value of other crustaceans is the highest, 0.97, while the EE value of the Johnius belangerii is the lowest, just 0.11.
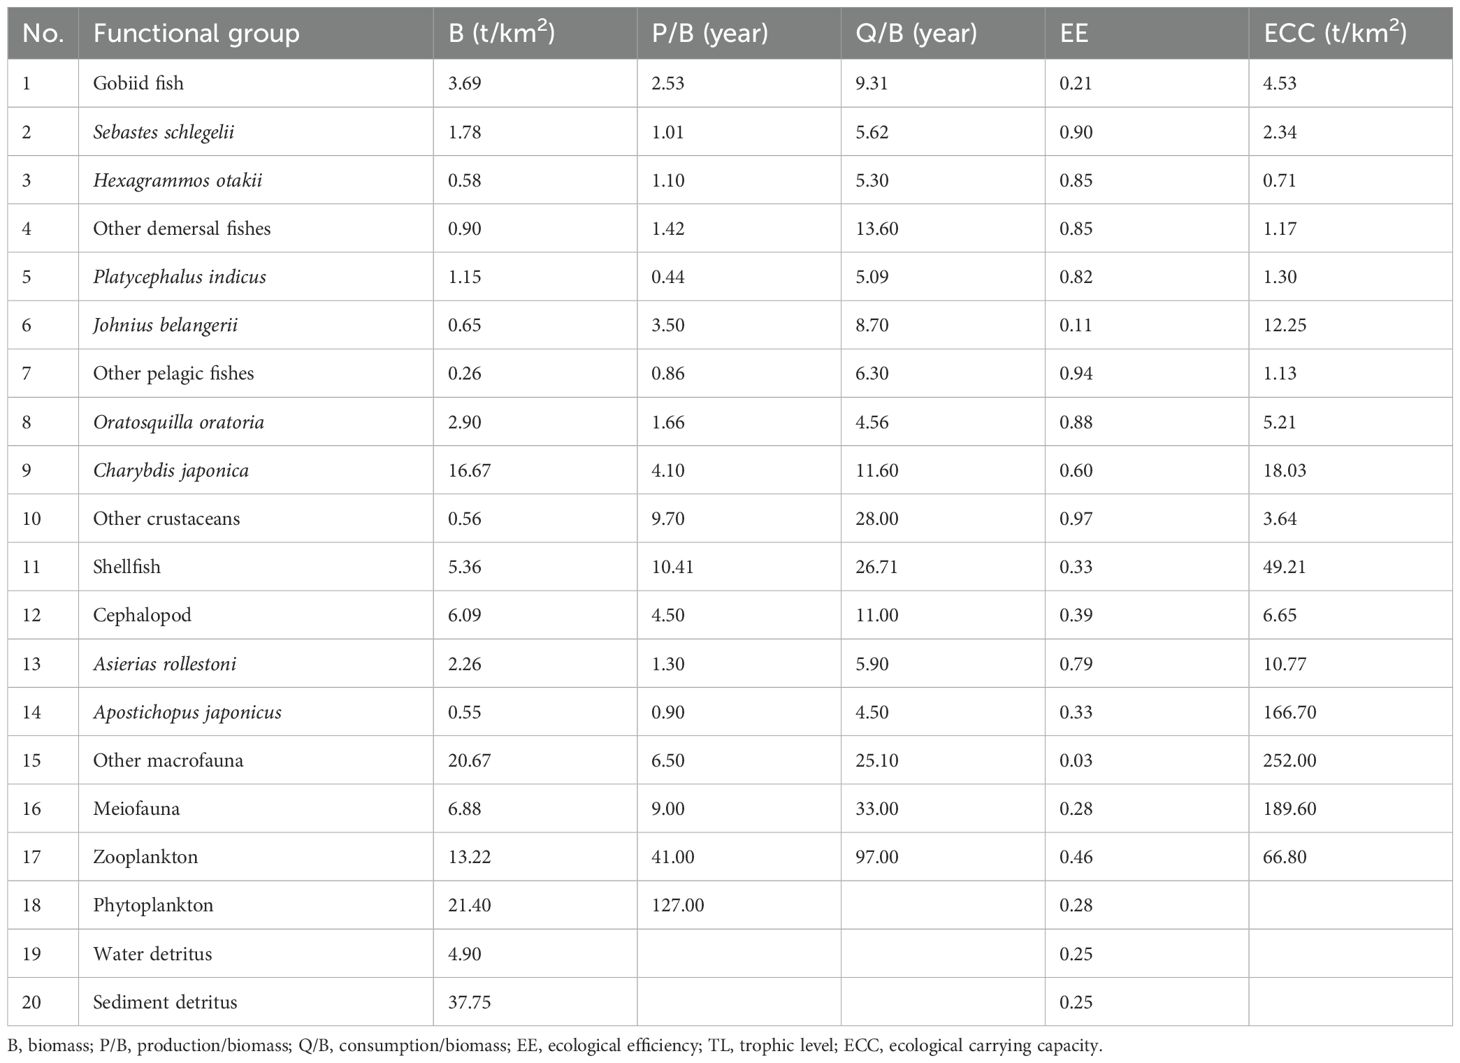
Table 3. Output parameters of the Ecopath model for the Haizhidu marine ranching.
We examined the ECC of other functional categories excluding phytoplankton, water detritus, and sediment detritus. The evaluation findings are provided in Table 3.
3.4 Analysis on the overall characteristics of marine ranching ecosystem
Table 4 displays the trophic levels (TL) of each functional category in the Haizhidu marine ranching ecosystem. Among them, the trophic level of Platycephalus indicus is the greatest (3.70), followed by Sebastes schlegelii (3.43) and cephalopods (3.43). The energy transfer of this ecosystem is mostly concentrated on TL I and TL II, among which the energy throughput of detritus is the largest in TL I, while the energy throughput of zooplankton is the highest in TL II.
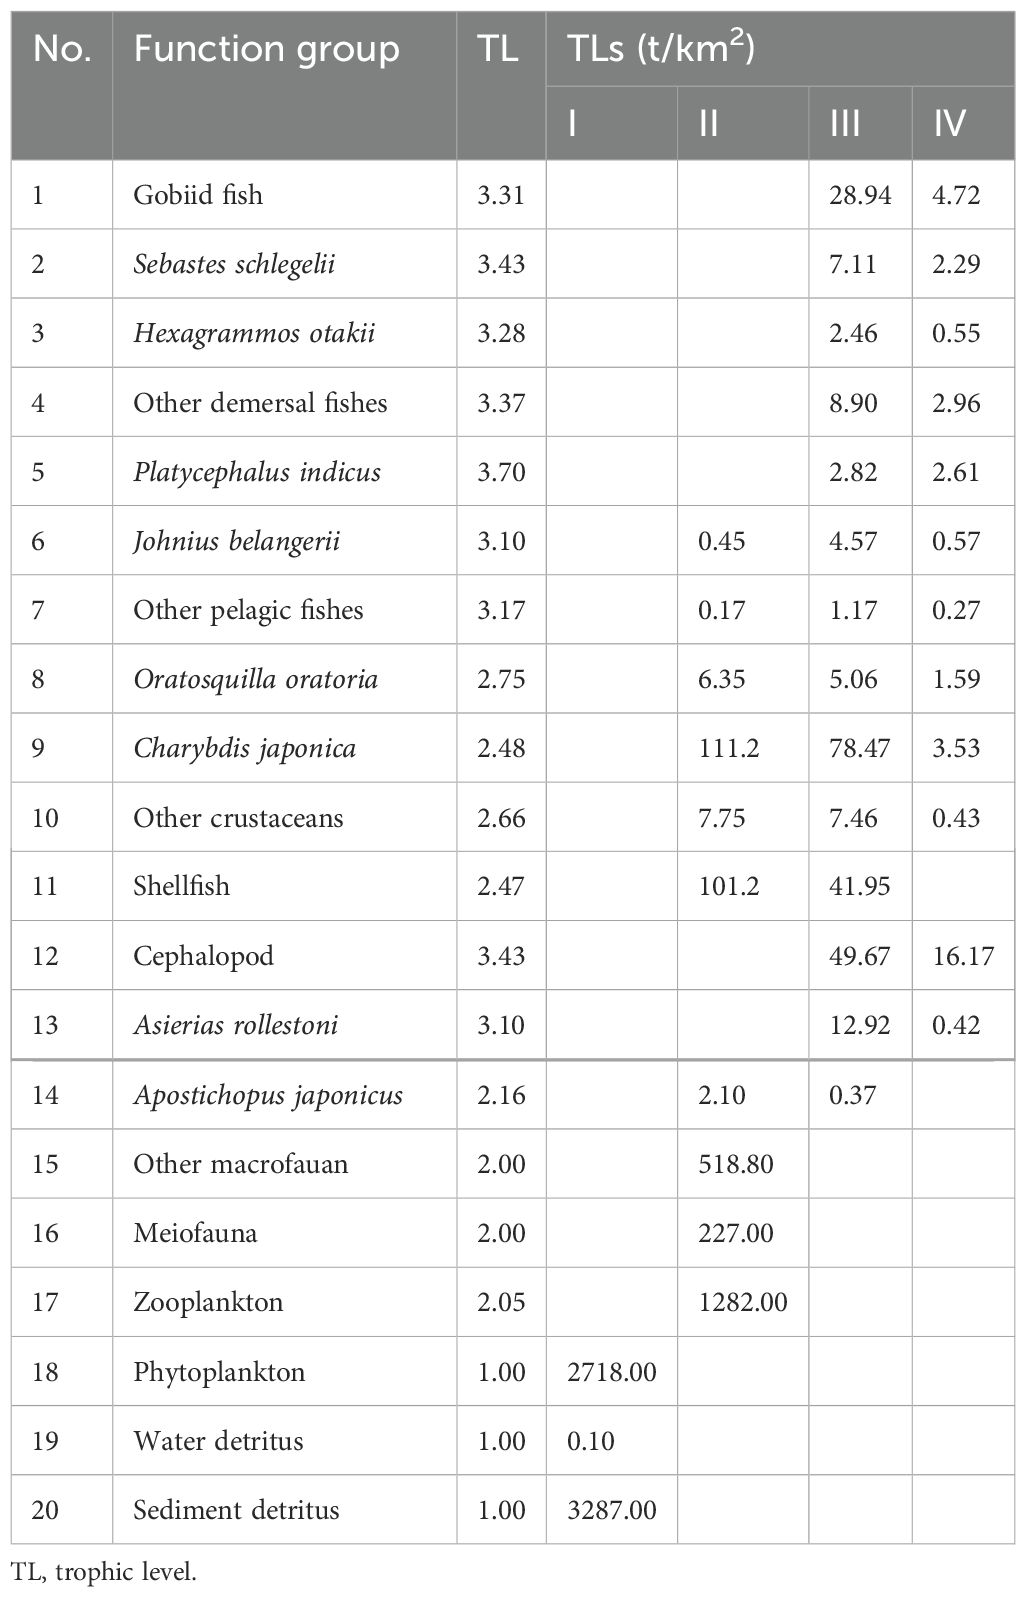
Table 4. Trophic levels and trophic transfer of each functional group in the Haizhidu marine ranching.
The findings of ecological network analysis are given in Figure 4. The radar graphic demonstrates that as the shellfish biomass increases, the system parameters adapt to varied degrees. Among the measures characterizing the system scale, except TPP, TST, TB, and TR all indicate an increased trend, among which TB and TR increase most dramatically, which are 1.51 and 1.54 times of the current condition, respectively. While among the measures reflecting system maturity and stability, TPP/TR, TPP/TB, H, SOI, and overhead/capacity (O/C) declined, and FMPL, FCI, ascendancy/capacity (A/C), and AMI increased. CI has not changed. In addition, the TTE of energy transfer and the SDI of system biodiversity showed a decreasing tendency, and the exact values are provided in Supplementary Table S4.
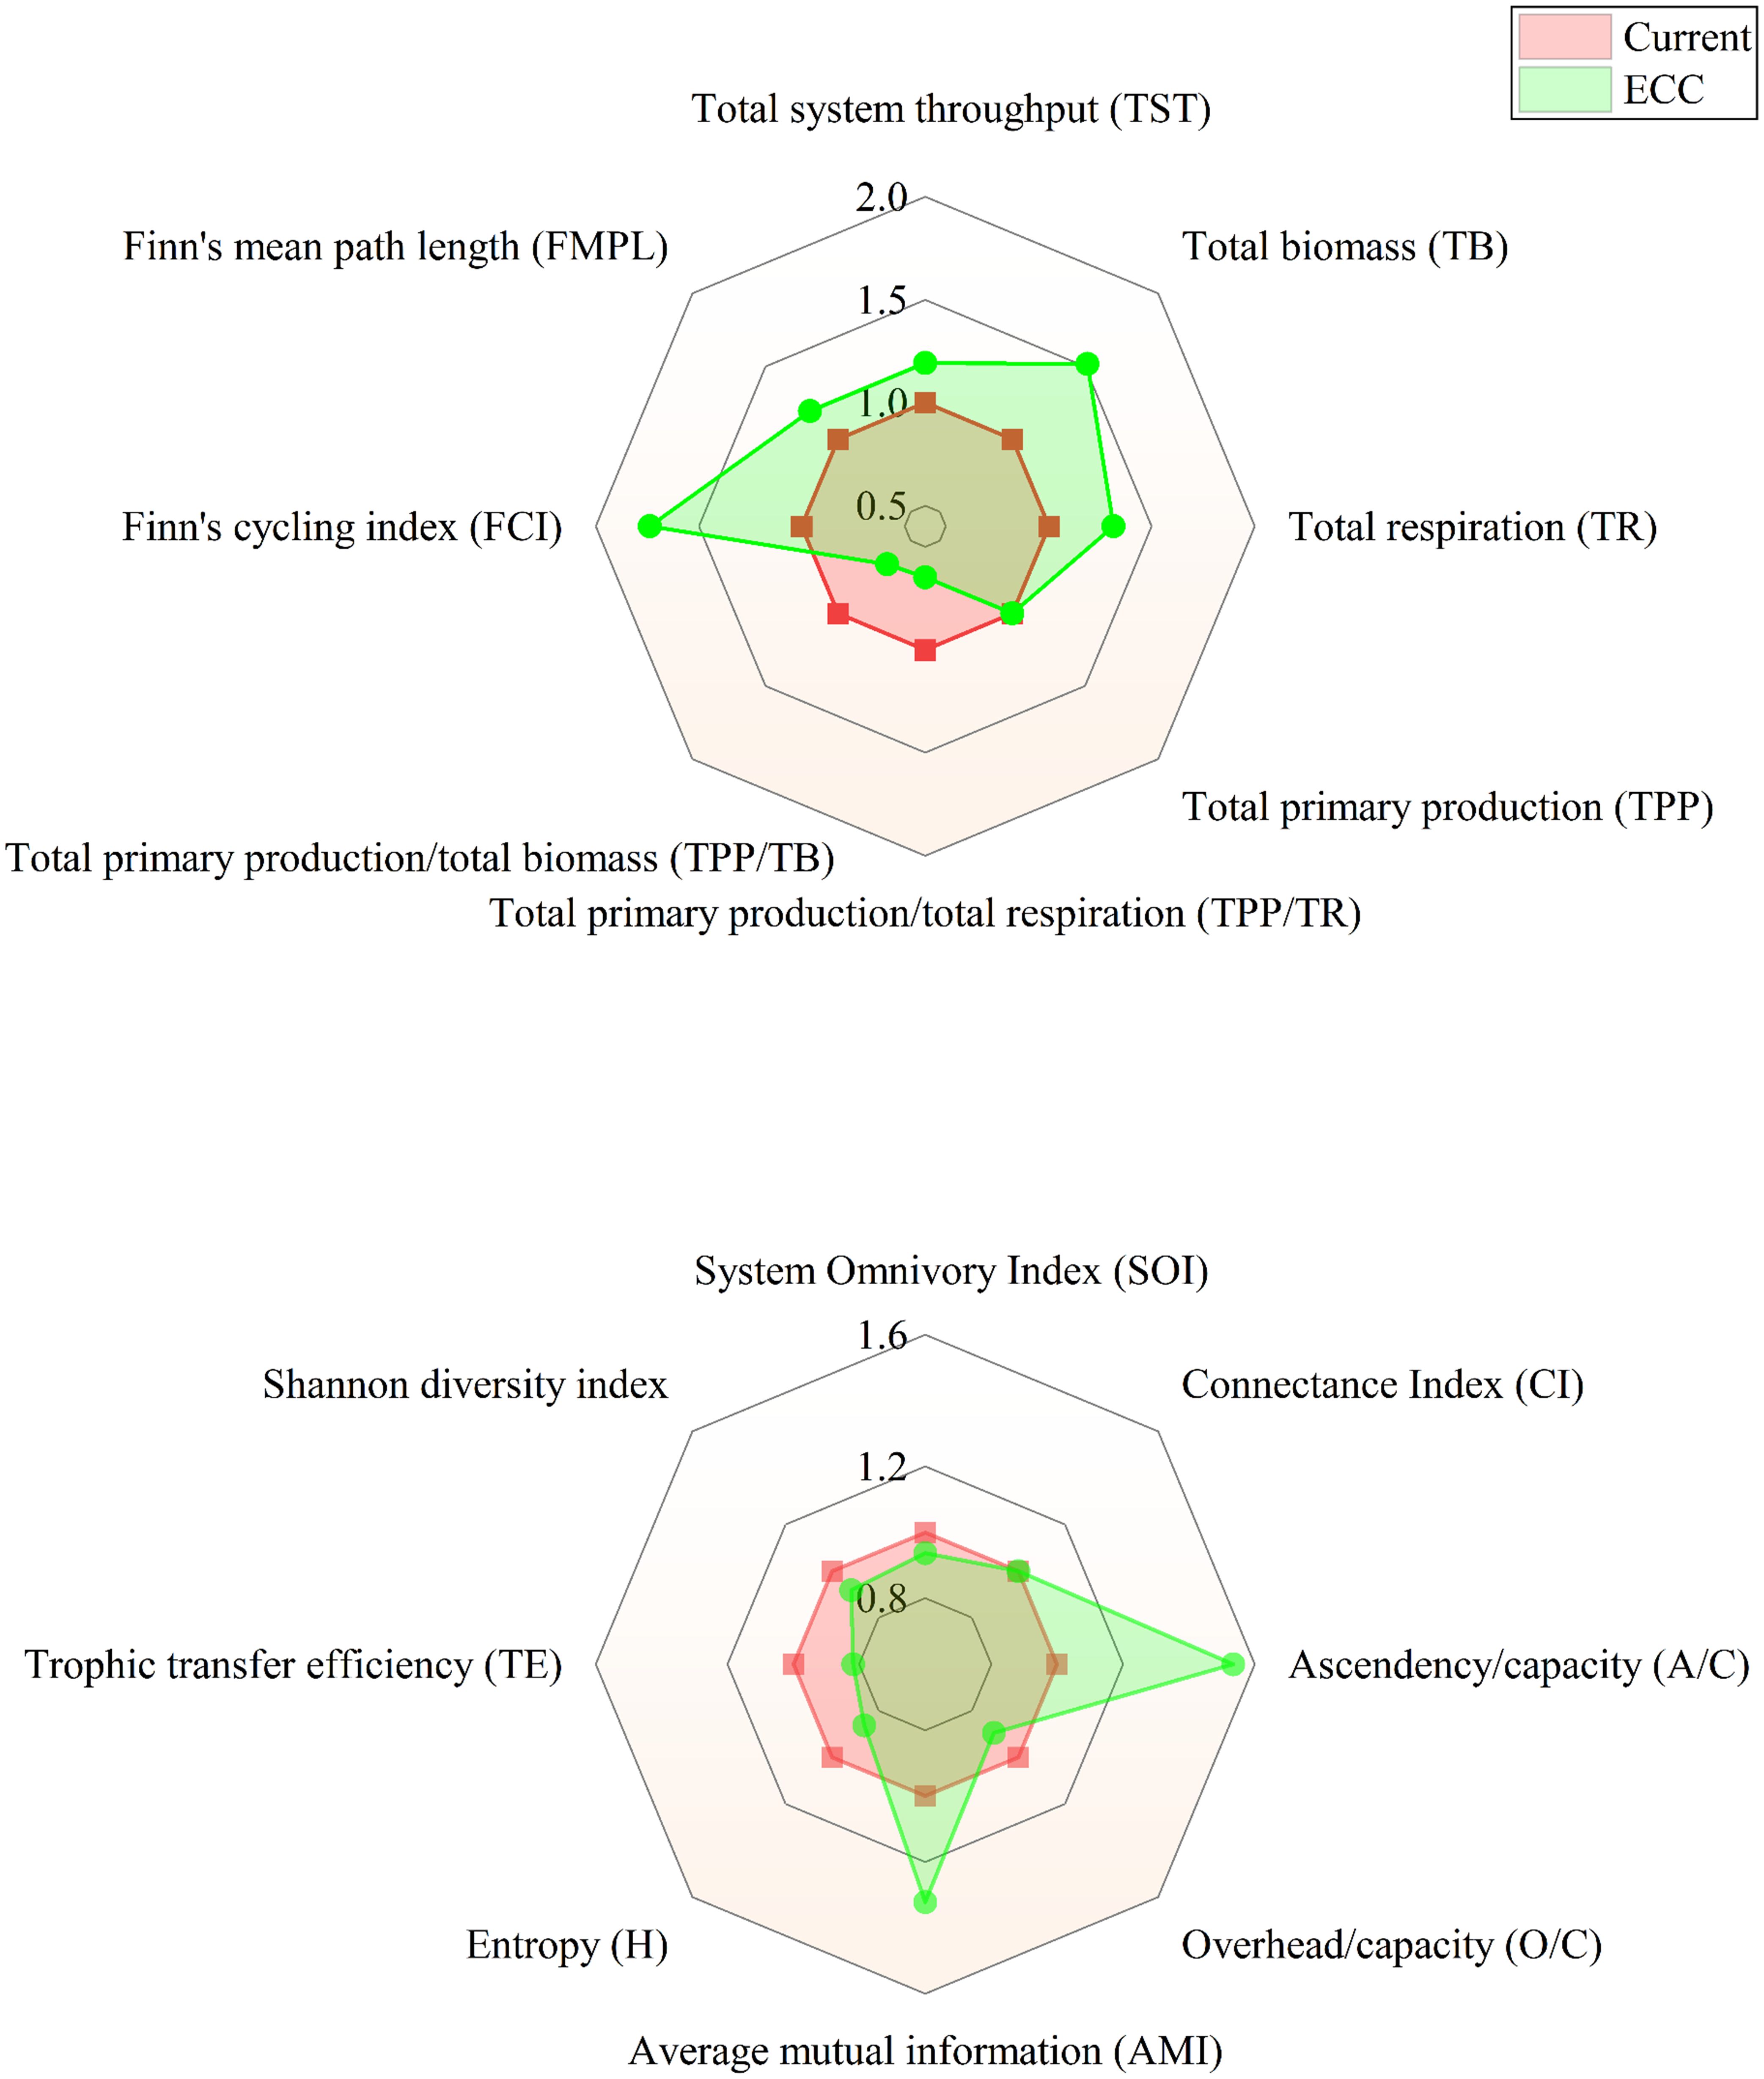
Figure 4. Relative changes in ecological network indices predicted by the EwE model after reaching ecological carrying capacity.
Figure 5 illustrates the Lindemann energy diagram. The total energy transfer efficiency of the system falls with the increase of shellfish biomass, but the transfer efficiency of primary producers and detritus to TL II grows, among which the increase of primary producers is bigger than that of detritus. There is a modest reduction from TL II to TL III and from TL III to TL IV.
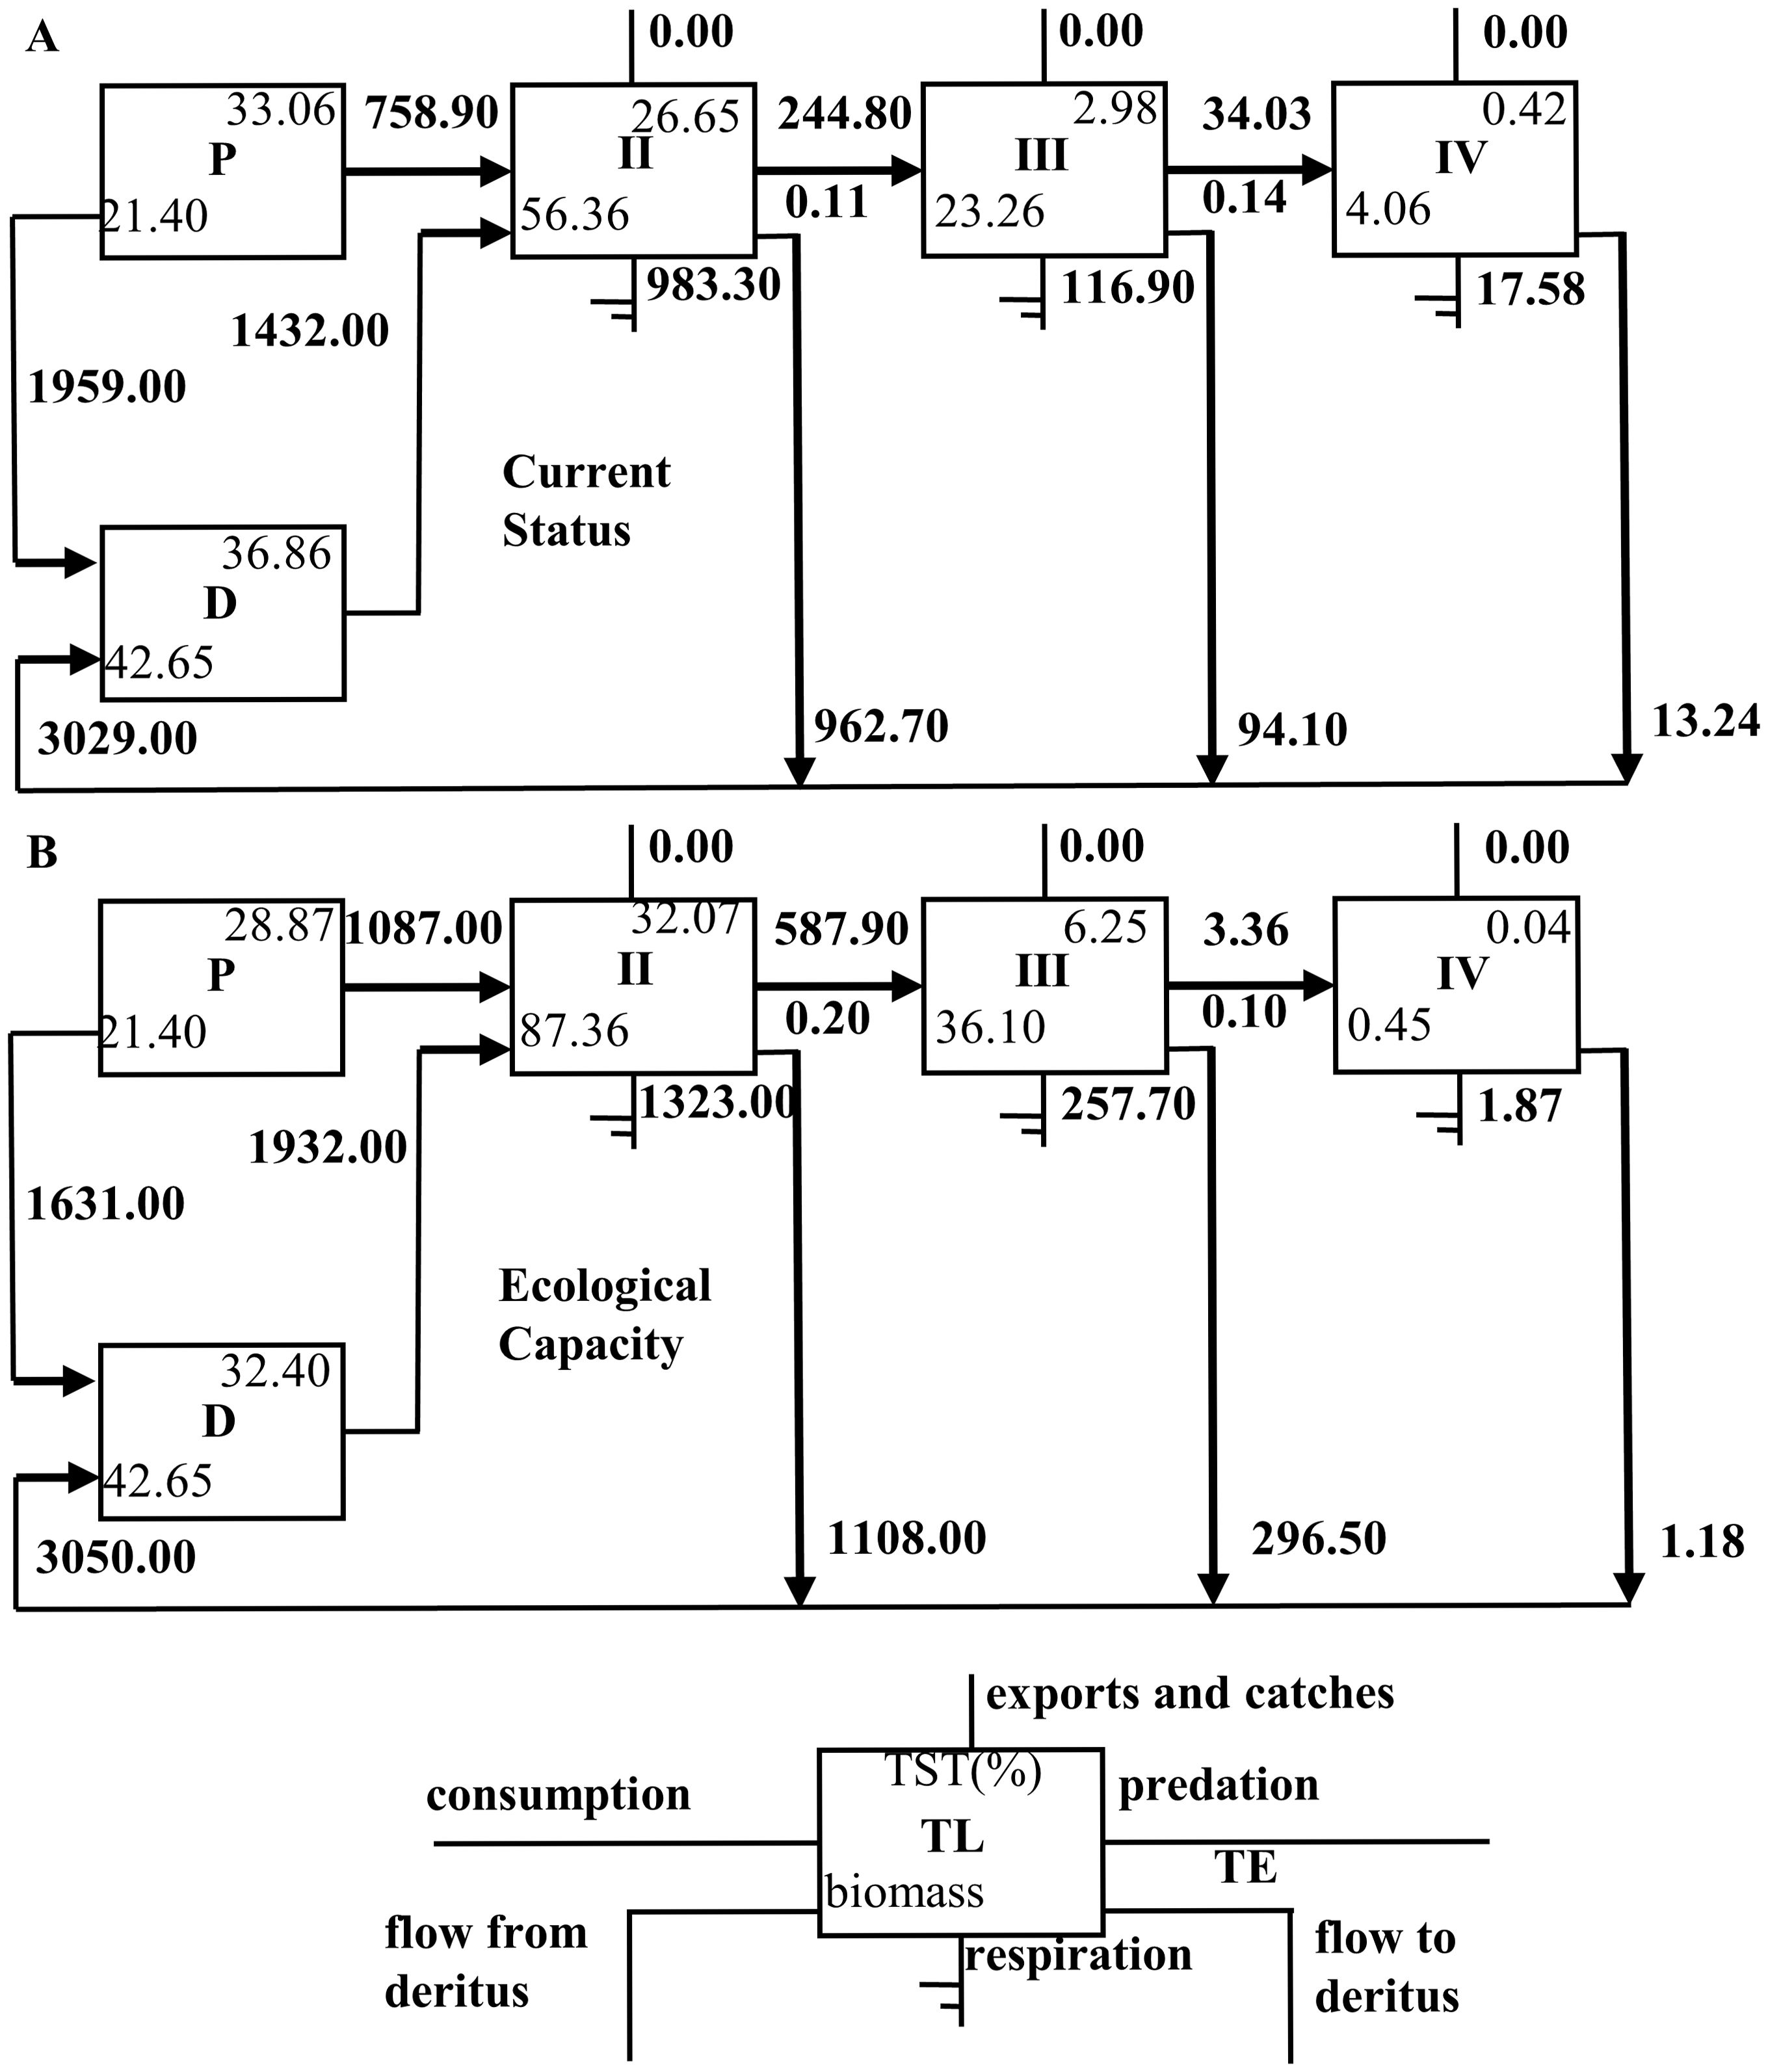
Figure 5. Lindemann energy flow diagram of the current state and after reaching ecological carrying capacity in the Haizhidu marine ranching. (P, primary production; D, detritus; TL, trophic level; TE, transfer efficiency; TST, total system throughput; A: current; B: ECC).
3.5 Potential impacts of shellfish enhancement on other functional groups
The findings of the Ecosim dynamic simulation are given in Figure 6. Under the three scenarios, the growth of shellfish biomass had diverse consequences on other functional categories. As shellfish biomass rose, we discovered that the abundance of Sebastes schlegelii, Hexagrammos otakii, Platycephalus indicus, Apostichopus japonicus, Asierias rollestoni, and Zooplankton were all below the status quo by the end of the simulation. Among these species, Hexagrammos otakii and Platycephalus indicus were the most significantly impacted. As the shellfish biomass rose, the quantity of Oratosquilla oratoria, Charybdis japonica, other crustaceans, cephalopods, Other macrofauna, meiofauna, phytoplankton, water detritus, and sediment detritus increased toward the end of the simulation. Both are lower than maintaining the status quo. Among them, other demersal fishes and Gobiid fish were the most positively affected. However, we discovered that the number of Johnius belangerii and other demersal fishes decreased drastically under all scenarios, with their biomass reducing to zero by the end of the experiment. Positive or negative effects were more evident when shellfish biomass exceeded ECC and grew to 120% of ECC.
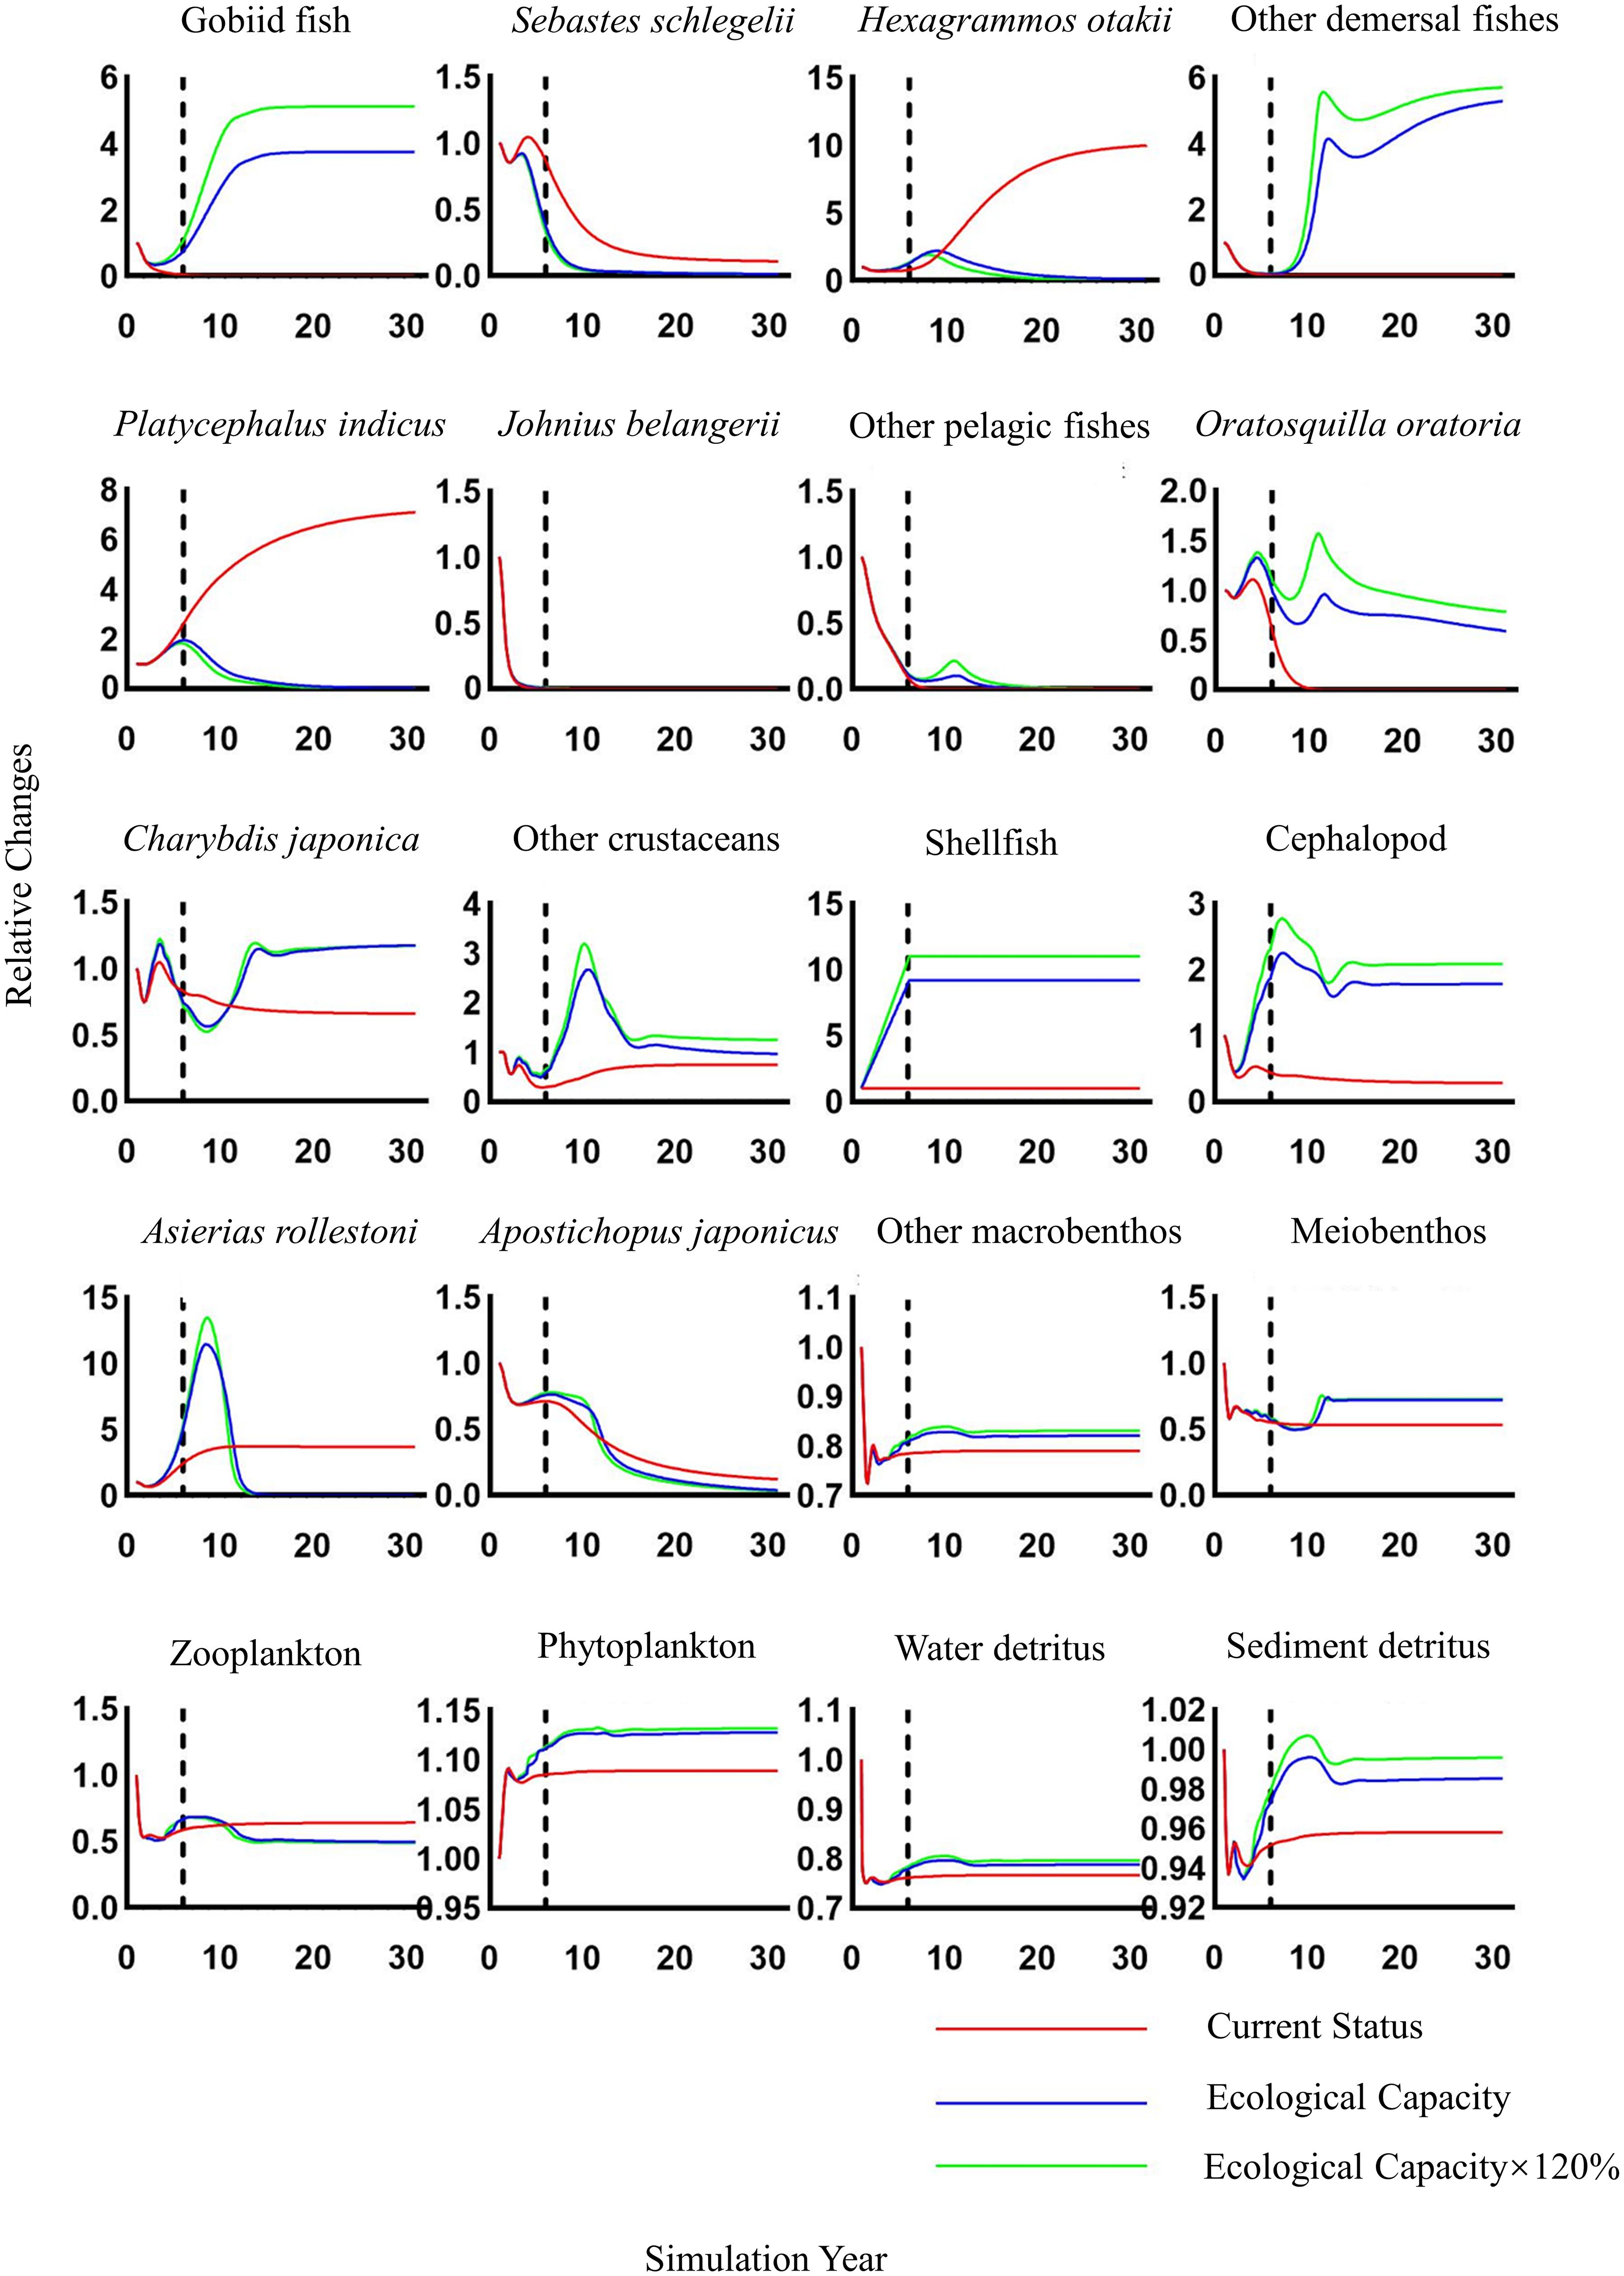
Figure 6. Relative changes in biomass of each functional group in the simulated Haizhidu marine ranching ecosystem over 30 years under three scenarios of shellfish increase (status, ECC, 120% ECC). Shellfish biomass remains unchanged after the dashed line. ECC, ecological carrying capacity.
3.6 Assessment of the carbon sequestration potential of marine ranching
The Haizhidu marine ranching primarily comprised the shellfish Rapana venosa and Neverita didyma, contributing 70.65% and 29.35% of the total shellfish biomass, respectively. The carbon content of Rapana venosa and Neverita didyma was (28.91 ± 2.55) % and (27.07 ± 3.06) %, respectively. Table 5 present the carbon sequestration capacity and potential of the shellfish, respectively. The current total carbon sequestration of shellfish is 1.52 t/km2, while the carbon sequestration after reaching the ECC is 13.96 t/km2, with a potential carbon sequestration of 12.44 t/km2.
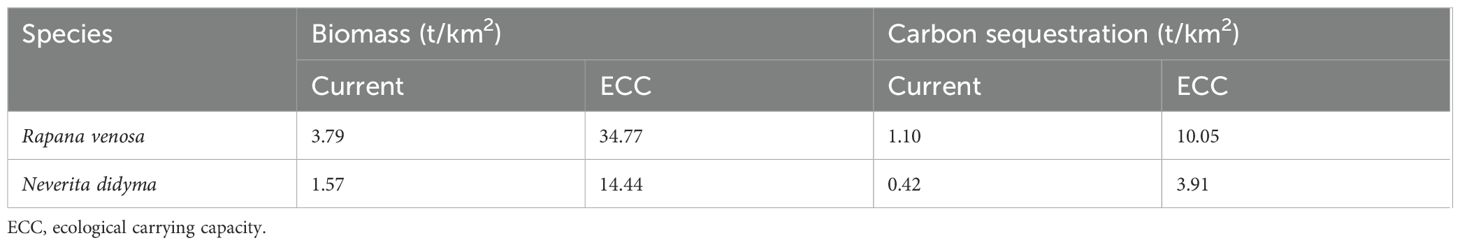
Table 5. Carbon sequestration capacity of Rapana venosa and Neverita didyma.
The carbon fixation of various organisms in Haizhidu marine ranching is presented in Table 6. The overall carbon fixation excluding shellfish is presently 19.32 t/km2. The total carbon fixing of shellfish is 20.84 t/km2. The total carbon fixation of shellfish after achieving the ecological potential is 33.74 t/km2, and the carbon fixation has increased by 61.90%.
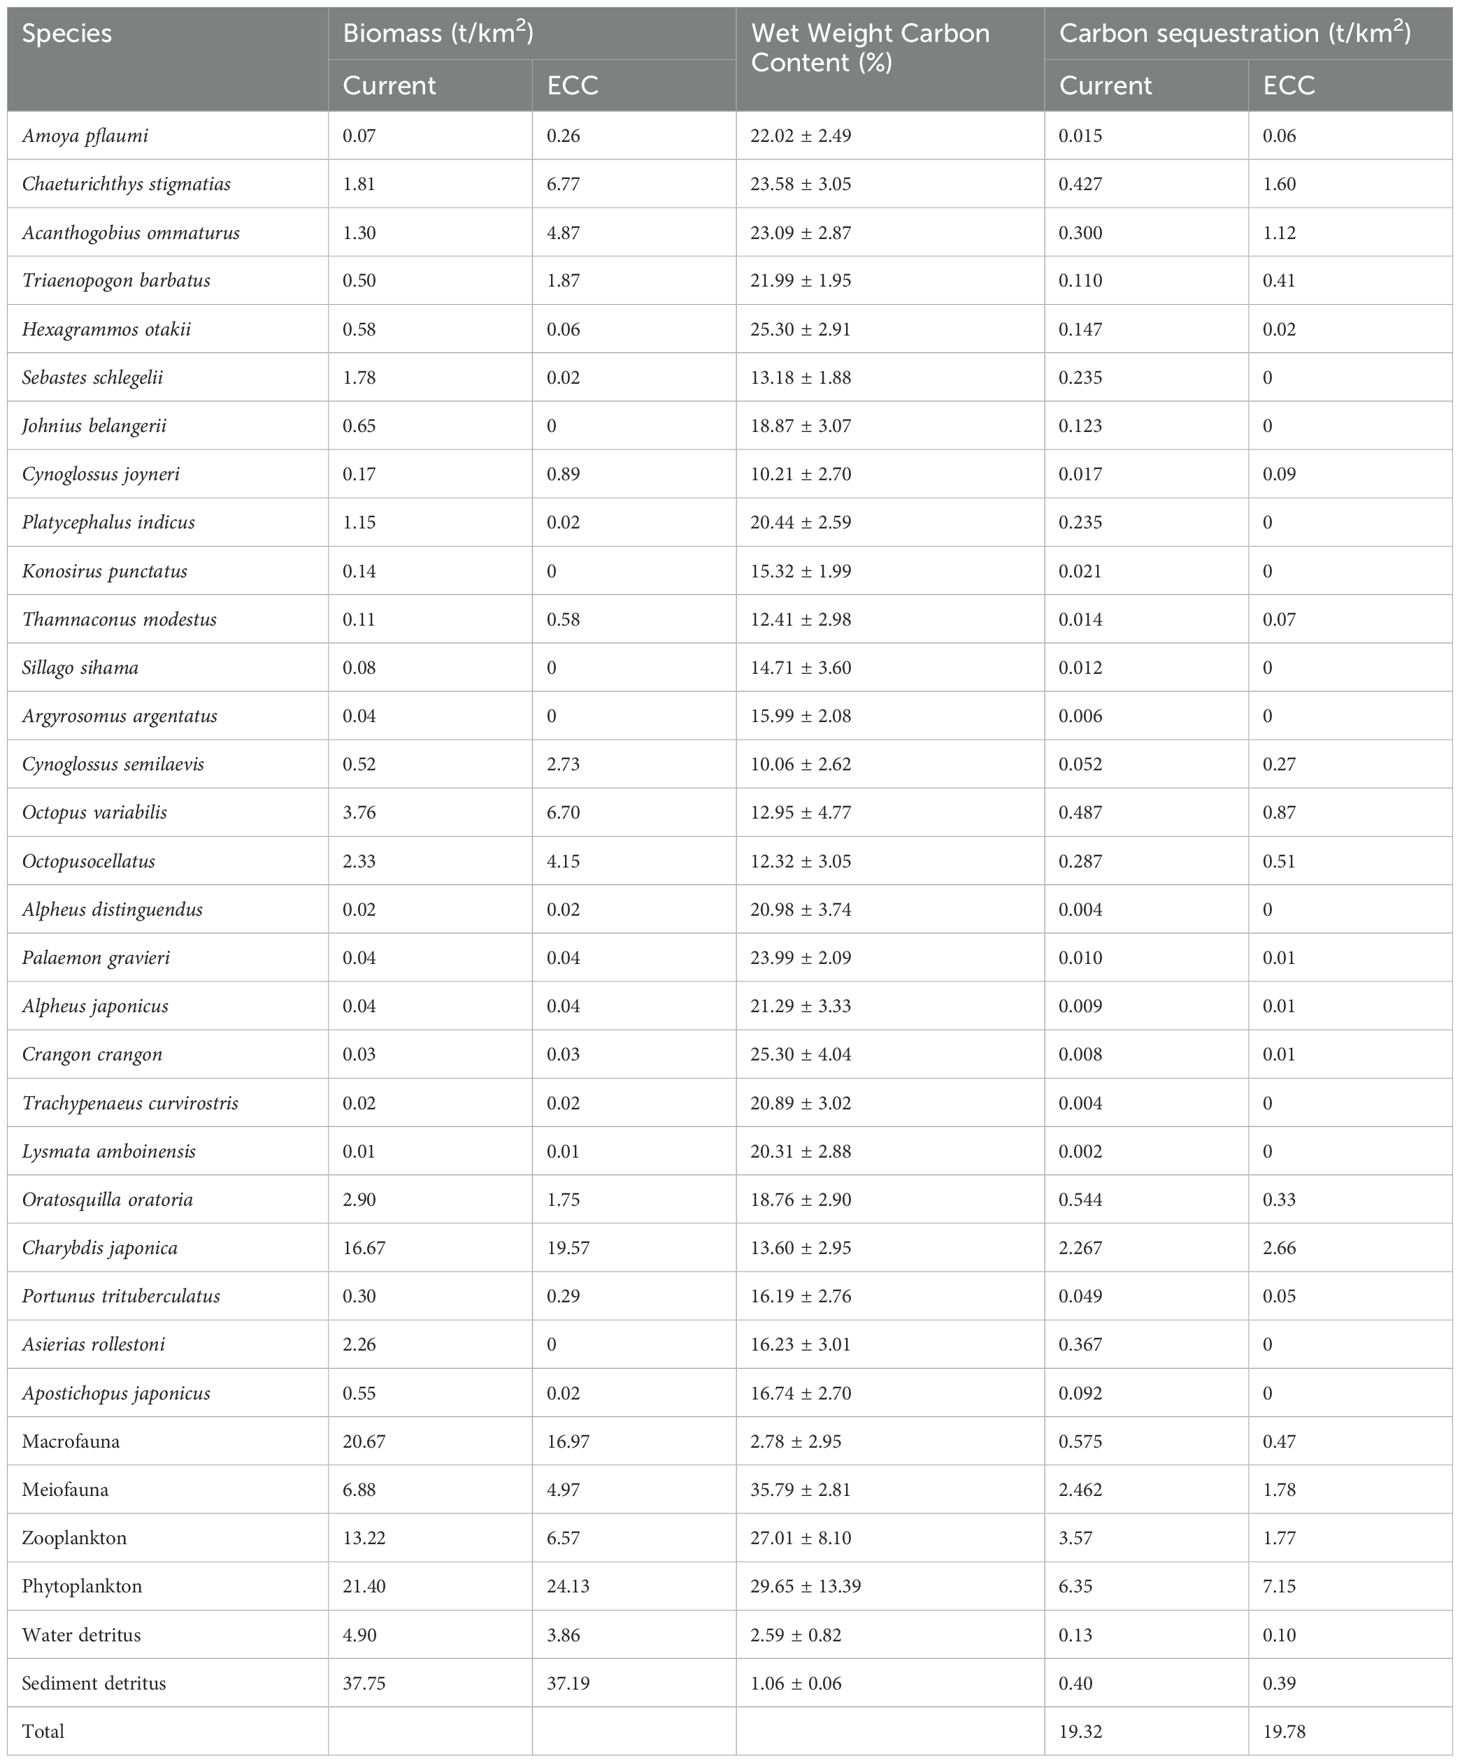
Table 6. Carbon sequestration quantities of other species in the Haizhidu marine ranching.
4 Discussion
Our study comprehensively analyzed ecosystem size, maturity, stability, and energy transfer dynamics to forecast potential effects of increasing shellfish biomass within the marine ranching ecosystem. Preliminary findings suggest the Haizhidu marine ranching ecosystem is not yet fully mature. However, as shellfish biomass approaches its ECC, the ecosystem is projected to exhibit enhanced maturity and stability. Additionally, the system’s carbon sequestration potential is estimated to reach 12.90 t/km2.
Our results showed that when shellfish biomass reached ECC, TST, TB, and TR all increased, and the overall size of the marine ranch ecosystem expanded. According to Odum (1969) and Christensen et al. (2005), TPP/TR and TPP/TB are both important parameters for assessing the maturity of an ecosystem: when an ecosystem gradually develops and matures, TPP/TR and TPP/TB usually approach 1. In this study, the values of TPP/TR and TPP/TB were always greater than 1. However, as the biomass of shellfish increased to the ECC, both TPP/TB and TPP/TR decreased, and their values were closer to 1. This shows that the ecosystem has become more mature, which is consistent with the results obtained by Liu et al. (2015) when estimating the ECC of Ruditapes philippinarum in Jiaozhou Bay. This may be due to the increased complexity of energy flows in the ecosystem, as evidenced by the increase in TST, FCI, and FMPL values, i.e., the shift of food chains from linear to web-like (Libralato, 2013). This is comparable to the velocities of the 1–10 km2 ecosystem described by Heymans et al. (2011). This trend underscores an optimized energy utilization rate and elongated material cycle path. Further, ecosystem stability and maturity are characterized by the A/C, AMI, and H. A higher A/C ratio indicates a well-organized ecosystem less prone to spontaneous collapse. Li et al. (2023) suggests the system is most stable when the A/C ratio reaches 45.96%. In the study area, the current A/C ratio is 28.61%. Simulations indicate that when the biomass of shellfish increases to the ECC, the A/C ratio increases to 43.92%. The current ecosystem is not fully stable, as indicated by the A/C ratio of 28.61%. With the shellfish biomass reaches ECC, the A/C ratio improves to 43.92%, suggesting an enhanced capacity to resist self-disturbance, yet the system remains unstable. According to Odum (1969) and Finn (1976), a mature ecosystem exhibits a high FCI and low H. In this study, as the shellfish biomass increases to the ECC, the FCI increases by 73.85%, while H decreased by 13.68%, indicating a more mature and stable ecosystem. The corresponding increase in AMI (from 1.15 bits to 1.52 bits) suggests that the ecosystem is subject to more constraints, with energy flowing along more fixed pathways, consistent with Odum’s (1969) assertion that a higher AMI indicates a more stable and mature ecosystem.
Ecological network analysis has revealed a correlation between increasing shellfish biomass and a decline in the SDI, a metric indicative of ecosystem diversity. This trend implies a potential adverse effect on biodiversity within the ecosystem. This finding is corroborated by the research of Li et al. (2023), which also noted a negative influence of heightened shellfish biomass on species diversity. Furthermore, our observations indicate a slight decrease in the TTE as shellfish attain their ECC. This outcome aligns with the simulations conducted by Lin et al. (2018), who predicted a similar decrease in energy conversion efficiency in the marine environment near the Yellow River estuary when shellfish biomass reaches its ECC.
The Lindeman trophic flow diagram illustrates a notable increase in the efficiency of energy transfer from detritus and primary producers to TL II, with a particularly significant enhancement in the transfer efficiency observed for primary producers. This improvement is primarily attributed to the substantial contribution of shellfish to TL II biomass, often exceeding 70% upon reaching their ECC. Given that shellfish predominantly consume phytoplankton, their increased presence leads to a heightened utilization rate of these primary producers. Additionally, shellfish serve as effective energy repositories by preying on macrofauna (Wang et al., 2022). This ecological role of shellfish not only bolsters the energy transfer within the ecosystem but also aids in the maintenance of biomass for large invertebrates, which are often of considerable economic value. Consequently, an increase in shellfish biomass can contribute to the preservation and enhancement of economically significant species, thereby generating economic benefits.
The dynamic simulation results from Ecosim indicate that the biomass of shellfish in the marine ranching ecosystem can be optimally expanded to a maximum of 49.21 t/km2. Surpassing this threshold is likely to exert a more significant impact on other species within the ecosystem. In this study, elevating the shellfish biomass to its ECC enhances the carbon fixation capacity of shellfish by 12.44 t/km2. This adjustment leads to a notable increase in the total carbon sequestration of the ecosystem, from the current 20.84 t/km2 to an anticipated 33.74 t/km2 upon shellfish reaching their ECC. This increase reflects a carbon sequestration potential of 12.9 t/km2 for the system, highlighting the pivotal role of shellfish in the carbon cycle of the Haizhidu marine ranching ecosystem. These findings are consistent with the research by Li et al. (2023). Our study reveals that the primary contribution to the system’s carbon sequestration at shellfish’s ECC comes from the shellfish themselves, with other functional groups experiencing only a marginal increase of about 2.5% in their total carbon sequestration. This minimal increase suggests that the rise in shellfish biomass could directly or indirectly influence other ecosystem components. Shellfish primarily feed on sediment detritus, making its availability a critical limiting factor, as noted by Sun et al. (2022). During the simulation, the biomass of sediment detritus remained above 85% of its initial value and began to rise in the third year after the shellfish biomass increased. This resilience could be attributed to the low vulnerability of shellfish and their lower EE values, which may limit the increased predation pressure on sediment detritus. This represents potential space for the shellfish to grow without depleting food resources. However, the increase in shellfish biomass was found to inversely affect the biomass of zooplankton, potentially due to heightened competition for food resources (Pang et al., 2023). This competition could reduce the availability of food for zooplankton and impact other functional groups that rely on it. Notably, Hexagrammos otakii and Platycephalus indicus experienced a dramatic reduction in biomass, nearing 99.99% by the end of the simulation. Two main factors could explain this phenomenon. First, the decline in Hexagrammos otakii and Platycephalus indicus biomass might be associated with the reproductive success of shellfish, which share over 50% dietary overlap with these species, relying heavily on zooplankton. Second, the proliferation of shellfish might encroach upon the habitat and survival space of other species, altering spatial dynamics within the ecosystem and potentially reducing available space for other organisms. Conversely, an increase in shellfish biomass was observed to significantly boost the biomass of Oratosquilla oratoria, Charybdis japonica and cephalopods, indicating a complex interplay of ecological interactions within the ecosystem.
Shellfish are renowned for their significant contributions to ecosystem services within their growth environment. As one of the most sustainable sources of animal protein, they capitalize on naturally occurring phytoplankton, eliminating the need for external bait inputs (Walker et al., 2023). This feeding behavior not only sustains the shellfish population but also supports the broader ecosystem. The propagation of shellfish often necessitates the introduction of settlement structures, which can modify environmental conditions and provide habitats for other organisms, potentially augmenting species diversity (Wang et al., 2022). However, an increase in shellfish biomass may exert negative influences on ecological structure and species diversity (Zhang et al., 2023). Our study identifies the primary shortfall as insufficiency of primary producers in the aquatic environment. First, the reduction of biodiversity may increase the risk of fishery collapse. The over-proliferation of shellfish may lead to a decrease in the biomass of other economic fish and invertebrates. For example, the biomass of Hexagrammos otakii and Platycephalus indicus plummeted to nearly 99.99% by the end of the simulation, which may weaken the stability of fishery resources and reduce the sustainability of fisheries (Cardinale et al., 2012). Second, the decline in biodiversity may reduce the ecosystem’s ability to adapt to environmental changes and decrease the redundancy of carbon sequestration functions. This means that in the face of environmental disturbances or climate change, the entire ecosystem’s carbon sequestration capacity may become more vulnerable and unable to maintain the original level of carbon fixation (Weiskopf et al., 2024).
Therefore, to address these potential negative impacts, appropriate reproduction of macroalgae as a food source may be a good solution (Watanabe et al., 2020). This is similar to our previous research conclusions in Bohai Bay (Li et al., 2023), and Xu et al. (2019) also did related work. Macroalgae play a role in aquatic ecosystems, such as providing food sources, providing habitats and shelters, regulating seawater carbonate systems, and improving water quality. They provide important ecological support for shellfish and other functional groups, and promote the balance and stability of the entire ecosystem (Li et al., 2023). In addition, it is worth considering the introduction of other species with high ecological and economic value for aquaculture in marine ranches. This approach can enhance biodiversity, mitigate the risks associated with the dominance of a single species, and improve the overall stability and carbon sequestration capacity of the ecosystem (Born et al., 2004). Finally, establishing a long-term ecological monitoring system to regularly assess changes in biodiversity, ecosystem structure, and functions within marine ranches is essential. Based on the monitoring results, management strategies should be adjusted in a timely manner to ensure the health and sustainable development of the ecosystem.
Our study has certain limitations. Ecosim, a dynamic model based on time series, simulates ecosystem changes over time by adjusting parameters in the Ecopath model (Christensen et al., 2005). However, our Ecosim simulation relied solely on a single - survey dataset, lacking historical data for comparison and validation. This might affect the accuracy of the model’s output (Christensen and Walters, 2004). In the future studies, we should integrate historical literature, long - term monitoring data, and conduct multiple surveys across different seasons and years. This approach will help capture the dynamic changes in ecosystems, improve data representation and reliability, and reduce the uncertainty in parameter estimation (Subramaniam et al., 2020).
5 Conclusion
Research shows that the Haizhidu marine ranching is currently in an immature state, but the increase in shellfish biomass has significantly improved the stability and maturity of the ecosystem. Based on the ECC of shellfish, this study used the Ecosim model for dynamic simulation and calculated that the total carbon sequestration of the system increased by 61.9% after the simulation, with a sequestration potential of 12.9 t/km2, mainly from shellfish. However, the increase in shellfish biomass has had an adverse effect on certain functional groups due to insufficient primary productivity. We suggest that the introduction of macroalgae can increase primary productivity, thereby alleviating the adverse effects on other functional groups and promoting the overall balance and stable development of the marine ranching ecosystem. Therefore, the implementation of scientific and reasonable ecological management strategies is the key to enhancing system stability and carbon sequestration capacity during the development of marine ranching.
Data availability statement
The original contributions presented in the study are included in the article/Supplementary Material. Further inquiries can be directed to the corresponding authors.
Ethics statement
Written informed consent was obtained from the individual(s) for the publication of any identifiable images or data included in this article.
Author contributions
JY: Data curation, Investigation, Methodology, Visualization, Writing – original draft. YaC: Conceptualization, Supervision, Writing – review & editing. YiC: Conceptualization, Writing – review & editing. JS: Formal Analysis, Writing – review & editing. BW: Conceptualization, Writing – review & editing. XG: Conceptualization, Writing – review & editing. GW: Formal Analysis, Writing – review & editing. LG: Formal Analysis, Writing – review & editing. HL: Formal Analysis, Writing – review & editing. QL: Data curation, Visualization, Writing – review & editing. XL: Data curation, Visualization, Writing – review & editing. JZ: Conceptualization, Writing – review & editing. ZL: Data curation, Visualization, Writing – review & editing. FM: Data curation, Visualization, Writing – review & editing. HZ: Data curation, Visualization, Writing – review & editing. WL: Conceptualization, Writing – review & editing. ZP: Conceptualization, Supervision, Writing – review & editing.
Funding
The author(s) declare that financial support was received for the research and/or publication of this article. This research was funded by National Key R&D Program of China (2024YFD2401801), Hebei Province Natural Science Foundation Outstanding Youth Fund Project (C2023204161), Marine Ecological Restoration and Smart Ocean Engineering Research Center of Hebei Open Fund (HBMESO2303), Hebei Provincial Department of Education Research Course Construction Project (YKCSZ2024033), Hebei Agriculture Research System (HBCT2024290202).
Acknowledgments
We gratefully acknowledge Haojun Dong for his assistance during the fieldwork. We also thank Hongda Liu, Zhaoxing Wu, Yingfei Yang, Yujie Liu and Shukang Wang for helpful discussions and proofreading during the writing of the article.
Conflict of interest
Author HZ, WL were employed by the company Tangshan Haidu Seafood Co., Ltd.
The remaining authors declare that the research was conducted in the absence of any commercial or financial relationships that could be constructed as a potential conflict of interest.
Generative AI statement
The author(s) declare that no Generative AI was used in the creation of this manuscript.
Publisher’s note
All claims expressed in this article are solely those of the authors and do not necessarily represent those of their affiliated organizations, or those of the publisher, the editors and the reviewers. Any product that may be evaluated in this article, or claim that may be made by its manufacturer, is not guaranteed or endorsed by the publisher.
Supplementary material
The Supplementary Material for this article can be found online at: https://www.frontiersin.org/articles/10.3389/fmars.2025.1583896/full#supplementary-material
References
Bacher C., Grant J., Hawkins A. J. S., Fang J. G., Zhu M. Y., Besnard M. (2003). Modelling the effect of food depletion on scallop growth in Sungo Bay (China). Aquat. Living. Resour. 16, 10–24. doi: 10.1016/S0990-7440(03)00003-2
Born A. F., Immink A. J., Bartley D. M. (2004). Marine and coastal stocking: Global status and information needs Vol. 429 (Rome: Food and Agriculture Organization of the United Nations), 1.
Cao G. S., Shen J. S. (2022). Ecological compensation standards of carbon sink resources in the marine ranch. J. Nat. Resour. 37, 3153–3166. doi: 10.31497/zrzyxb.20221209
Cardinale B. J., Duffy J. E., Gonzalez A., Hooper D. U., Perrings C., Venail P., et al. (2012). Biodiversity loss and its impact on humanity. Nature 486, 59–67. doi: 10.1038/nature11148
Christensen V., Walters C. J. (2004). Ecopath with Ecosim: methods, capabilities and limitations. Ecol. Model. 172, 109–139. doi: 10.1016/j.ecolmodel.2003.09.003
Christensen V., Walters C. J., Pauly D. (2005). Ecopath with Ecosim: a user’s guide Vol. 154 (Vancouver: Fisheries Centre, University of British Columbia), 31.
Colléter M., Valls A., Guitton J., Gascuel D., Pauly D., Christensen V. (2015). Global overview of the applications of the Ecopath with Ecosim modeling approach using the EcoBase models repository. Ecol. Modell. 302, 42–53. doi: 10.1016/j.ecolmodel.2015.01.025
Dutta D., Schimel D. S., Sun Y., Tol C. V. D., Frankenberg C. (2019). Optimal inverse estimation of ecosystem parameters from observations of carbon and energy fluxes. Biogeosciences 16, 77–103. doi: 10.5194/bg-16-77-2019
Endo T., Hotta Y., Hisamichi Y., Kimura O., Sato R., Haraguchi K., et al. (2012). Stable isotope ratios and mercury levels in red meat products from baleen whales sold in Japanese markets. Ecotox. Environ. Safe. 79, 35–41. doi: 10.1016/j.ecoenv.2012.01.020
Feng J. C., Sun L. W., Yan J. Y. (2023). Carbon sequestration via shellfish farming: A potential negative emissions technology. Renew. Sust. Energ. Rev. 171, 113018. doi: 10.1016/j.rser.2022.113018
Feng J., Tian X. L., Dong S. L., He R. P., Zhang K., Zhang D. X., et al. (2022). Temporal dynamics in energy fluxes and trophic structure of a Portunus trituberculatus polyculture ecosystem during different culture periods. Front. Mar. Sci. 9. doi: 10.3389/fmars.2022.873643
Filgueira R., Guyondet T., Thupaki P., Sakamaki T., Grant J. (2021). The effect of embayment complexity on ecological carrying capacity estimations in bivalve aquaculture sites. J. Clean. Prod. 288, 125739. doi: 10.1016/j.jclepro.2020.125739
Finn J. T. (1976). Measures of ecosystem structure and function derived from analysis of flows. J. Theor. Biol. 56, 363–380. doi: 10.1016/S0022-5193(76)80080-X
Gao S. K., Gong S. M., Chen Z., Zhang X., Zhang S., Yu W. W. (2021). Comparing the trophic structure of the Lvsi Fishing Ground as estimated from the Ecopath model and stable isotopic analysis. Estuar. Coast. Shelf. S. 262, 107559. doi: 10.1016/j.ecss.2021.107559
Han D. Y., Chen Y., Zhang C. L., Ren Y. P., Xu B. D., Xue Y. (2018). Evaluation of effects of shellfish aquaculture and capture fishery on a semi-closed bay ecosystem. Estuar. Coast. Shelf. S. 207, 175–182. doi: 10.1016/j.ecss.2018.04.005
Heymans J. J., Coll M., Libralato S., Christensen V. (2011). Ecopath theory, modeling, and application to coastal ecosystems. Treatise Estuar. Coast. Sci. (Oxford), 93–113. doi: 10.1016/B978-0-12-374711-2.00905-0
Hurst N. R., Locher B., Steinmuller H., Walters L. (2022). Organic carbon dynamics and microbial community response to oyster reef restoration. Limnol. Oceanogr. 67, 1157–1168. doi: 10.1002/lno.12063
Inglis G., Hayden B. J., Ross A. H. (2000). An overview of factors affecting the carrying capacity of coastal embayments for mussel culture (Christchurch: National Institute of Water & Atmospheric Research), 69 vi + 31p.
Li Z. P., Chen Y., Wang G., Mu J. D., Sun Y. F., Yu H. L., et al. (2023). Ecological carrying capacity and carbon sequestration potential of bivalve shellfish in marine ranching: A case study in Bohai Bay, China. Front. Mar. Sci. 10. doi: 10.3389/fmars.2023.1174235
Libralato S. (2013). “System omnivory index,” in Encyclopedia of ecology. Eds. Jørgensen S. E., Fath B. D. Vol. 1 (Oxford: Elsevier Science), 481–486. doi: 10.1016/B978-0-12-409548-9.00605-9
Lin Q., Wang J., Li Z. Y., Shan X. J. (2018). Ecological carrying capacity of shellfish in the Yellow River estuary and its adjacent waters. J. Appl. Ecol. 29, 3131–3138. doi: 10.13287/j.1001-9332.201809.039
Liu M., Shu M. X., Lian Q. P., Guo A. H., Zhou D., Zou S. B., et al. (2024). Assessment of ecosystem characteristics and fishery carbon sink potential of Qianxiahu reservoir based on trophic level and carbon content methods. Fishes 9, 438. doi: 10.3390/fishes9110438
Liu X. H., Wang Z. L., Zhang M. L., Wang B., Sun P. X. (2015). Carrying capacity of manila Ruditapes philippinarum in Jiaozhou Bay estimated by an ecosystem model. Fish. Sci. 34, 733–740. doi: 10.16378/j.cnki.1003-1111.2015.12.001
Loneragan N. R., Jenkins G. I., Taylor M. D. (2013). Marine stock enhancement, restocking, and sea ranching in Australia: future directions and a synthesis of two decades of research and development. Rev. Fish. Sci. 21, 222–236. doi: 10.1080/10641262.2013.796810
McKindsey C. W., Thetmeyer H., Landry T., Silvert W. (2006). Review of recent carrying capacity models for bivalve culture and recommendations for research and management. Aquaculture 261, 451–462. doi: 10.1016/j.aquaculture.2006.06.044
Moraes D. F. R. C., Attayde D. L. J., Henry-Silva G. G. (2020). Stable isotopes of C and N as dietary indicators of Nile tilapia (Oreochromis niloticus) cultivated in net cages in a tropical reservoir. Aquacul. Rep. 18, 100458. doi: 10.1016/j.aqrep.2020.100458
Morissette L., Hammill M. O., Savenkoff C. (2006). The trophic role of marine mammals in the northern Gulf of St. Lawrence. Mar. Mammal. Sci. 22, 74–103. doi: 10.1111/j.1748-7692.2006.00007.x
Newell C. L., O’Rear T. A., Durand J. R. (2022). Untangling the food web of suisun marsh using isotopes. Front. Young Minds. 10. doi: 10.3389/frym.2022.631331
Odum E. P. (1969). The Strategy of Ecosystem Development: An understanding of ecological succession provides a basis for resolving man's conflict with nature. Science 164, 262–270. doi: 10.1126/science.164.3877.262
Oginah A. S., Ang’ienda O. P., Onyango O. P. (2020). Evaluation of habitat use and ecological carrying capacity for the reintroduced Eastern black rhinoceros ( Diceros bicornis michaeli ) in Ruma National Park, Kenya. Afr. J. Ecol. 58, 34–45. doi: 10.1111/aje.12674
Ortiz M., Berrios F., Campos L., Uribe R., Ramirea A., Hermosillo-Núñez B., et al. (2015). Mass balanced trophic mo dels and short-term dynamical simulations for benthic ecological systems of Mejillones and Antofagasta bays (SE Pacific): comparative network structure and assessment of human impacts. Ecol. Model. 309, 153–162. doi: 10.1016/j.ecolmodel.2015.04.006
Palomares M. L. D., Pauly D. (1998). Predicting food consumption of fish populations as functions of mortality, food type, morphometrics, temperature and salinity. Mar. Freshwater. Res. 49, 447–453. doi: 10.1071/MF98015
Pan Z., Gao Q. F., Dong S. L., Wang F., Jiang X. Y., Zhang G., et al. (2019a). Remineralization and preservation of sedimentary organic carbon, and authigenic mineral formation in Alian Bay and its adjacent areas, China: Implication for the influence of abalone (Haliotis discus hannai Ino) and kelp (Saccharina japonica) mariculture. Aquaculture 507, 301–312. doi: 10.1016/j.aquaculture.2019.04.051
Pan Z., Gao Q. F., Dong S. L., Wang F., Li H. D., Zhao K., et al. (2019b). Effects of abalone (Haliotis discus hannai Ino) and kelp (Saccharina japonica) mariculture on sources, distribution, and preservation of sedimentary organic carbon in Ailian Bay, China: Identified by coupling stable isotopes (δ13C and δ15N) with C/N ratio analyses. Mar. Pollut. Bull. 141, 387–397. doi: 10.1016/j.marpolbul.2019.02.053
Pang B. J., Li H. J., Li M. M., Chen Y., Li T. S., Lan W. L. (2023). Effects of shellfish culture on the community and mortality of zooplankton in a subtropical Bay. J. Oceanol. Limnol. 41, 458–468. doi: 10.1007/s00343-2073-6
Papapanagiotou G., Tsagarakis K., Koutsidi M., Tzanatos E. (2020). Using traits to build and explain an ecosystem model: Ecopath with Ecosim modelling of the North Aegean Sea (Eastern Mediterranean). Estuar. Coast. Shelf. S. 236, 106614–106614. doi: 10.1016/j.ecss.2020.106614
Pauly D. (1980). On the interrelationships between natural mortality, growth parameters, and mean environmental temperature in 175 fish stocks. Ices. J. Mar. Sci. 39, 175–192. doi: 10.1093/ICESJMS/39.2.175
Pauly D., Christensen V. (1993). Stratified models of large marine ecosystems: a general approach and an application to the South China Sea. Large marine ecosystems: stress, mitigation and sustainability. Environ. Sci. 376, 148–174. Available at: https://hdl.handle.net/20.500.12348/2935 (Accessed September 15, 2023).
Peterson B. J., Fry B. (1987). Stable isotopes in ecosystem studies. Annu. Rev. Ecol. Syst. 18, 291–320. doi: 10.1146/annurev.es.18.110187.001453
Planas M. (2022). Was that my meal? Uncertainty from source sampling period in diet reconstruction based on stable isotopes in a syngnathid fish. Front. Mar. Sci. 9. doi: 10.3389/fmars.2022.982883
Shi J. W., Zhang M. Y., Zhao S. (2024). Ecological capacity assessment of sepiella maindroni in the sea area of zhongjieshan archipelago based on ecopath model. J. Zhejiang Ocean Univ. (Natural Science). 43, 51–62.
Sreekanth G. B., Chakraborty S. K., Jaiswar A. K., Zacharia P. U., Mohamed K. S. (2021). Modeling the impacts of fishing regulations in a tropical Indian estuary using Ecopath with Ecosim approach. Environ. Dev. Sustain. 23, 1–19. doi: 10.1007/s10668-021-01410-3
Subramaniam R., Melbourne-Thomas J., Corney S., Alexander K., Péron C., Ziegler P., et al. (2020). Time-dynamic food web modelling to explore environmental drivers of ecosystem change on the Kerguelen Plateau. Front. Mar. Sci. 7. doi: 10.3389/fmars.2020.00641
Sun Y., Yu X. B., Yao W. Z., Wu Z. L. (2022). Research progress in relationships between freshwater bivalves and algae. Ecotox. Environ. Safe. 239, 113665. doi: 10.1016/j.ecoenv.2022.113665
Tadiso T. M., Borgstrøm R., Rosseland B. O. (2011). Mercury concentrations are low in commercial fish species of Lake Ziway, Ethiopia, but stable isotope data indicated biomagnification. Ecotox. Environ. Safe. 74, 953–959. doi: 10.1016/j.ecoenv.2011.01.005
Tumbiolo M. L., Downing J. A. (1994). An empirical model for the prediction of secondary production in marine benthic invertebrate populations. Mar. Ecol. Prog. Ser. 114, 165–174. doi: 10.3354/meps114165
Ulanowicz R. E. (2004). Quantitative methods for ecological network analysis. Comput. Biol. Chem. 28, 321–339. doi: 10.1016/j.compbiolchem.2004.09.001
Walker C., Corrigan S., Daniels C., Wilding C., Woodward E. M. S., Widdicombe C. E., et al. (2023). Field assessment of the potential for small scale co-cultivation of seaweed and shellfish to regulate nutrients and plankton dynamics. Aquacul. Rep. 33, 101789. doi: 10.1016/j.aqrep.2023.101789
Wan X. L., Li Q. Q., Qiu L. L., Du Y. W. (2021). How do carbon trading platform participation and government subsidy motivate blue carbon trading of marine ranching? A study based on evolutionary equilibrium strategy method. Mar. Policy. 130, 104567. doi: 10.1016/j.marpol.2021.104567
Wang S. K. (2021). The construction status and existing problems of marine ranches in Hebei Province. Hebei. Fisheries. (05), 36–40. doi: 10.3969/j.issn.1004-6755.2021.05.013
Wang Z. G. (2023). The synergistic change rule between target species and keystone species in marine ranching. [master’s thesis]. (Dalian (Liaoning): Dalian Ocean University). doi: 10.27821/d.cnki.gdlhy.2023.000429
Wang X., Feng J., Lin C., Liu H. (2022). Structural and functional improvements of coastal ecosystem based on artificial oyster reef construction in the Bohai Sea, China. Front. Mar. Sci. 9. doi: 10.3389/fmars.2022.829557
Wang Y. J., Liu X. M., Wang W. J., Sun G. H., Feng Y. W., Xu X. H., et al. (2024). The investigation on stress mechanisms of Sepia esculenta larvae in the context of global warming and ocean acidification. Aquacul. Rep. 36, 102120. doi: 10.1016/j.aqrep.2024.102120
Watanabe K., Yoshida G., Hori M., Umezawa Y. (2020). Macroalgal metabolism and lateral carbon flows can create significant carbon sinks. Biogeosciences 17, 2425–2440. doi: 10.5194/bg-17-2425-2020
Weiskopf S. R., Isbell F., Arce-Plata M. I., Marco M. D., Harfoot M., Johnson J., et al. (2024). Biodiversity loss reduces global terrestrial carbon storage. Nat. Commun. 15, 4354. doi: 10.1038/s41467-024-47872-7
Xiao S. W., Liu X. G., Zhou R. F., Zhao Y. X., Sun Z. Y. (2023). Energy flow analysis of grass carp pond system based on Ecopath model. Environ. Sci. Pollut. R. 31, 1–14. doi: 10.1007/s11356-023-27154-3
Xu S. N., Chen Z. Z., Li C. H., Huang X. P., Li S. Y. (2011). Assessing the carrying capacity of tilapia in an intertidal mangrove-based polyculture system of Pearl River Delta, China. Ecol. Model. 222, 846–856. doi: 10.1016/j.ecolmodel.2010.11.014
Xu M., Qi L., Zhang L. B., Zhang T., Yang H. S., Zhang Y. L. (2019). Ecosystem attributes of trophic models before and after construction of artificial oyster reefs using Ecopath. Aquacult. Env. Interac. 11, 111–127. doi: 10.3354/aei00284
Zhang X. P., Song H. J., Zhuang H. F., Yi S. J., Hong X. G., Chu J. S., et al. (2023). Calculating the carrying capacity of bivalve mariculture in the Changshan Archipelago (Bohai Strait, China): Ecopath modeling perspective. J. Sea. Res. 192, 102367. doi: 10.1016/j.seares.2023.102367
Zhang Y. L., Xu B. Y., Zhang C. L., Ji Y. P., Ren Y. P., Cheng Y., et al (2020). Spatial heterogeneity in the feeding habits and feeding ground distribution of Johnius belangerii in Haizhou Bay during spring. J. Fish. Sci. China. 27, 315–326. doi: 10.3724/SP.J.1118.2020.19092
Keywords: marine ranching, ecological carrying capacity, stable isotope, carbon sequestration potential, Ecopath with Ecosim
Citation: Yan J, Chen Y, Cao Y, Sun J, Wen B, Gao X, Wang G, Gong L, Liu H, Li Q, Liu X, Zhang J, Li Z, Ma F, Zhang H, Li W and Pan Z (2025) Marine ranching enhances ecosystem stability and biological carbon sequestration potential: insights from Ecopath with Ecosim model simulation of 30-year ecological path of a national marine ranching in China. Front. Mar. Sci. 12:1583896. doi: 10.3389/fmars.2025.1583896
Received: 26 February 2025; Accepted: 07 April 2025;
Published: 29 April 2025.
Edited by:
Jinghui Fang, Chinese Academy of Fishery Sciences (CAFS), ChinaCopyright © 2025 Yan, Chen, Cao, Sun, Wen, Gao, Wang, Gong, Liu, Li, Liu, Zhang, Li, Ma, Zhang, Li and Pan. This is an open-access article distributed under the terms of the Creative Commons Attribution License (CC BY). The use, distribution or reproduction in other forums is permitted, provided the original author(s) and the copyright owner(s) are credited and that the original publication in this journal is cited, in accordance with accepted academic practice. No use, distribution or reproduction is permitted which does not comply with these terms.
*Correspondence: Zhe Pan, bGZwYW56aGVAMTYzLmNvbQ==; Bin Wen, YndlbkBzaG91LmVkdS5jbg==; Weidong Li, d2VpZG9uZzE5NzBAaG90bWFpbC5jb20=