Abstract
The musculature of yellowfin tuna (Thunnus albacares) exhibits distinct functional specialization, with slow-twitch oxidative red muscle and fast-twitch glycolytic white muscle demonstrating marked disparities in energy metabolic characteristics. To elucidate the molecular mechanisms underlying these functional divergences, this study implemented an integrated approach incorporating ultrastructural analysis via transmission electron microscopy (TEM), transcriptomic profiling, and enzymatic activity assays of key metabolic regulators. TEM imaging revealed that red muscle fibers contain larger mitochondria and prominent lipid droplets compared to white muscle fibers. Our transcriptome analysis identified 3,162 genes with significant expression differences-1,515 were up-regulated, and 1,647 were down-regulated. Functional enrichment analysis demonstrated significant association of red muscle DEGs with oxidative phosphorylation, tricarboxylic acid cycle, and fatty acid β-oxidation, while white muscle preferentially enriched glycolysis/gluconeogenesis pathways. Enzymatic validation revealed red muscle exhibited higher citrate synthase activity (2.3-fold) and elevated β-hydroxyacyl-CoA dehydrogenase levels (1.8-fold), whereas white muscle showed greater hexokinase activity (4.7-fold) and increased lactate dehydrogenase activity (3.2-fold). These findings provide novel insights into the physiological adaptations underlying the distinctive swimming strategies of scombroid fishes, revealing evolutionary optimization of muscle metabolic pathways corresponding to their sustained cruising capacity and burst swimming performance.
Introduction
In vertebrates, skeletal muscle is a crucial tissue that maintains body movement and metabolism. In fish, red muscle (RM) and white muscle (WM) are the main types of skeletal muscle located in different anatomical regions based on their function (Frontera and Ochala, 2015; Wu et al., 2018). Red muscle, mainly found near the lateral line, contains large amounts of mitochondria, lipid droplets, glycogen granules, and myoglobin, mainly energized by lipid and carbohydrate oxides and used for sustained muscle contraction (Shibata et al., 2016). The white muscle, which occupies most of the body, has few mitochondria and lacks myoglobin (Wakeling and Johnston, 1999). It primarily relies on anaerobic glycolysis to provide energy for short bursts of exercise (Ciciliot et al., 2013). Over the past few decades, scientists have studied fish skeletal muscle from several perspectives, including the observation of the muscle tissue’s ultrastructure (Guppy et al., 1979), the classification, structure, and function of muscle fibers (Houssard et al., 2017), and the biochemical characteristics of different muscle tissue (Pillai and Alexander, 1982). In recent years, research on the metabolic mechanisms of the growth of hard-skeletal fish has been focused on weak swimming abilities and smaller species, such as Piaractus mesopotamicus (Mareco et al., 2015), Pseudocaranx dentex (Wang et al., 2022), Schizothorax prenanti (Li et al., 2019), and Takifugu rubripes (Gao et al., 2017). Despite previous investigations, a detailed molecular characterization of energy metabolism in high-speed fish remains limited, which our study addresses. Therefore, studying these fishes to understand the molecular metabolic regulatory mechanisms of different muscle types is essential.
Animals get their energy mostly from metabolizing three nutrients: carbohydrates, lipids, and protein (Churova et al., 2015). Carbohydrate metabolism, comprising glycolysis, glycogen synthesis, pentose phosphate pathway, and the citric acid cycle (TCA), is regulated by key enzymes such as hexokinase (HK), phosphofructokinase (PFK), and citrate synthase (CS) (Rakus et al., 2015). Research (He et al., 2013) discovered that Cyprinus carpio red muscle exhibits significantly higher citrate synthase activity than white muscle tissue. The activity of lipase (LPS), fatty acid synthesis (FAS), and carnitine palmitoyltransferase-1 (CPT-1) are crucial enzymes that regulate fat synthesis and decomposition (Huang et al., 2018; Tan et al., 2019). A study found that Cpt1b knockout mice significantly reduced mitochondrial oxidative phosphorylation and increased triglycerides in muscle tissue (Shi et al., 2013). As a crucial energy source for fish, proteins involve various enzymes to facilitate and promote fish growth. Previous studies have revealed that aspartate transaminase (AST) and alanine transaminase (ALT) participate in the body’s amino acid metabolism process, collaborating with glucose dehydrogenase (GDH) to facilitate deamination (Zhang et al., 2018). Until now, there has been limited research on the enzyme activity associated with energy metabolism in large, high-speed, continuous swimming fish muscle (Suarez et al., 1986; Malik et al., 2021). Consequently, it is imperative to assess the metabolic activity of these fish to reveal variations in muscle tissue metabolism.
Its widespread distribution in tropical and subtropical waters of the world’s oceans, its high swimming speed, its high basal metabolic rate, its high muscle content, and its highly migratory habits have made it a popular catch (Korsmeyer and Dewar, 2001; Betancor et al., 2017). It is an excellent model for the study of continuous swimming fish muscles. Recently, tuna has become popular among consumers due to its delicious meat rich in protein, lipids and unsaturated fatty acids [such as docosahexaenoic acid (DHA) and eicosatetraenoic acid (EPA)] and other nutrients (Zhang et al., 2019; Zhang et al., 2020). In addition, the market demand for tuna accounts for about 10% of the international seafood market (Brill and Hobday, 2017; Singh et al., 2021). So far, research on the muscle tissue of yellowfin tuna has been limited to muscle physiochemistry (Shadwick and Syme, 2008) and nutrient components (Zhang et al., 2019), no molecular mechanism study was involved. Increasingly, transcriptomics technologies have been used to study fish growth and development, evolutionary adaptation, and environmental stress, facilitating in-depth studies of fish growth and development (Qian et al., 2014). So, it is necessary to use transcriptomics technology to study the differences in muscle energy metabolism, which will be more helpful in comprehensively understanding the physiological characteristics of yellowfin tuna.
The current study investigates the structural and functional differences between red and white muscles in yellowfin tuna through multiple methodologies, including transmission electron microscopy (TEM), transcriptomics, and metabolic enzyme activity analysis. It aims to elucidate the physiological mechanisms underlying their adaptation to long-distance migration and burst predation, while clarifying differentiation strategies in energy metabolism between the two muscle types. On one hand, the findings are expected to advance theoretical innovations in fish locomotor physiology and provide novel perspectives on the evolutionary adaptations of teleost. On the other hand, the research will offer scientific support for tuna resource conservation and the sustainable development of marine ecosystems.
Materials and methods
Sample collection and storage
Six juvenile yellowfin tuna were collected from the Central South China Sea (Coordinates: 17°41′N-18°17′N, 110°60′E-112°14′E, Temperature: 25°C ± 3°C) in August 2021, and average body length (43.73 ± 2.45 cm) and weight (1.96 ± 0.57 kg) are as described in our previous study (Zou et al., 2023). Following capture, the fish were anesthetized using 1 g/L MS-222 (Shanghai McLean Biochemical Technology) for 30 seconds before dissection (Townley et al., 2016). The sample size was determined based on preliminary power analyses to ensure statistical reliability in detecting differential gene expression and enzyme activity differences. Post-dissection, tissue samples were immediately flash-frozen in liquid nitrogen and stored at –80°C until further analysis.
Transmission electron microscope observation
TEM determination was performed as described in our previous study (Lu et al., 2022). Briefly, tissue was fixed in TEM fixative and stored at 4°C. After washing in 0.1 M PBS (pH 7.4), tissues were fixed in 1% OsO4 for 2 hours at room temperature. Samples were dehydrated through a graded series of alcohol solutions (30%-100%), followed by acetone washes and resin embedding. Subsequently, 60–80 nm slices of the intestinal sample were produced with an ultrathin slicing device (Leica EM UC7 ultramicrotome, Leica, Munich, Germany). For contrast enhancement, double staining was conducted using 2% uranium acetate and 2.6% lead citrate at room temperature (Beijing Zhongjingkeyi Technology Co., Ltd., Beijing, China). Images were captured using an HT7800 transmission electron microscope (Hitachi, Tokyo, Japan) at 80 kV and a magnification of 2000x.
Constructing cDNA library and sequencing transcriptomes
Standard procedures were followed for the extraction of total RNA using Trizol as described by our previous study (Lu et al., 2023a). Subsequently, RNA integrity, concentration, and purity were assessed using 1% agarose gel electrophoresis, a Nanodrop spectrophotometer (IMPLEN, CA, USA), and the Agilent Bioanalyzer 2100. Further RNA-sequencing assays were conducted by Biotree Technology Co. Ltd. (Shanghai, China). For RNA sample preparation, 1 µg RNA was used as input for each sample. The cDNA library was constructed according to the manufacturer’s NEBNext® UltraTM RNA Library Prep Kit from Illumina, performed Illumina sequencing after quality inspection (Only samples with a RIN > 7.0 were used for subsequent library construction), and generated 150 bp paired-end reads. The raw sequence data has been submitted to the NCBI Sequence Read Archive under the accession number SRP479951.
Differential gene screening and enrichment analysis
Following the successful construction of the library, sequencing was carried out on the Illumina HiSeq Xten 6000 platform, and the raw data were processed, combined, and trimmed using fastp (version 0.20.0) (Chen et al., 2018): 1) getting rid of reads that contain adapters; 2) discarding reads with over 10% unidentified nucleotides (N); 3) excluding reads with more than 50% bases of low quality (Q-value ≤ 20). Using HISAT2 v2.0.5 (http://daehwankimlab.github.io/hisat2/), the clean data were mapped to the yellowfin tuna reference genome (https://www.ncbi.nlm.nih.gov/assembly/GCF_914725855.1/). The assembly of transcripts was executed de novo with StringTie software (version 2.1.2) (http://ccb.jhu.edu/software/stringtie/). The analysis of differentially expressed genes (DEGs) was conducted using the DESeq2 software, version 2.1.2, available at http://bioconductor.org/packages/stats/bioc/DESeq2/, with DEGs selected based on the criteria of an adjusted p-value (Padj) < 0.05 and an absolute log2 fold change of ≥ 1.0. In addition, KEGG pathway enrichment analysis and Gene Ontology (GO) functional enrichment analysis were performed using Cluster Profiler (3.4.4) software (Wentzel et al., 2020).
Quantitative real-time PCR reaction analysis
A total of fifteen genes were selected for quantitative real-time PCR validation (qRT-PCR) to verify the transcriptome data accuracy, and primer sequences are shown in Supplementary Table S1. We performed qRT-PCR reactions using a Roche LightCycler® 480 instrument utilizing SYBR qPCR Master Mix reagents (Venozan, Biotech, China) with β-actin as the internal reference gene to acquire the CT value of each sample and calculate its relative expression using the 2-ΔΔCt method (Livak and Schmittgen, 2001).
Physiological and biochemical indexes
The red and white muscle tissue homogenates of the head kidney, spleen and skin were prepared with 10 multiple (w/v) ice-cold saline and centrifuged at 6000 g at 4°C for 20 min, then collected supernatant for the analysis of related parameters as described by previous study (Lu et al., 2023b). The supernatant was taken after centrifugation for subsequent determination of relevant enzyme activities and content. All kits were purchased from Nanjing Jiancheng Bioengineering Institute. The protein assay kit (BCA method) determined the total protein concentration (Item No. A045-4-2). The enzymes that assess glucose metabolism physiologically and biochemically include citrate synthase (CS) (Item No. A108-1-2), succinate dehydrogenase (SDH) (Item No. A022-1-1), hexokinase (HK) (Item No. A077-3-1), pyruvate kinase (PK) (Item No. A076-1-1), phosphofructokinase (PFK) (Item No. A076-1-1), and lactate dehydrogenase (LDH) (Item No. A020-2-2). In addition, lipase (LPS) (Item No. A054-2-1), fatty acid synthase (FAS) (Item No. H231-1-2), carnitine palmitoyl coenzyme 1 (CPT-1) (Item No. H230-1-2), triglyceride (TG) (Item No. A110-1-1), total cholesterol (T-CHO) (Item No. A111-1-1), high-density lipoprotein cholesterol content (HDL-C) (Item No. A112-1-1) and low-density lipoprotein cholesterol content (LDL-C) (Item No. A113-2-1) related to lipid metabolism were also measured. Each assay was performed in triplicate.
Statistical analysis
SPSS 23 (IBM SPSS Statistics, USA) and GraphPad Prism 9.0 for Windows (GraphPad Software, USA) were used for the data analysis. Statistical comparisons between red and white muscle tissues were performed using independent samples t-tests. A P-value of < 0.05 was considered statistically significant, while P < 0.01 was deemed highly significant. Each assay was performed in triplicate, and results were expressed as mean ± standard error.
Results
Transmission electron microscope of RM and WM tissue
Figure 1 illustrates TEM images of red muscle (RM) and white muscle (WM). RM images show numerous large, oval mitochondria and abundant lipid droplets, whereas WM displays fewer, elongated mitochondria.
Figure 1
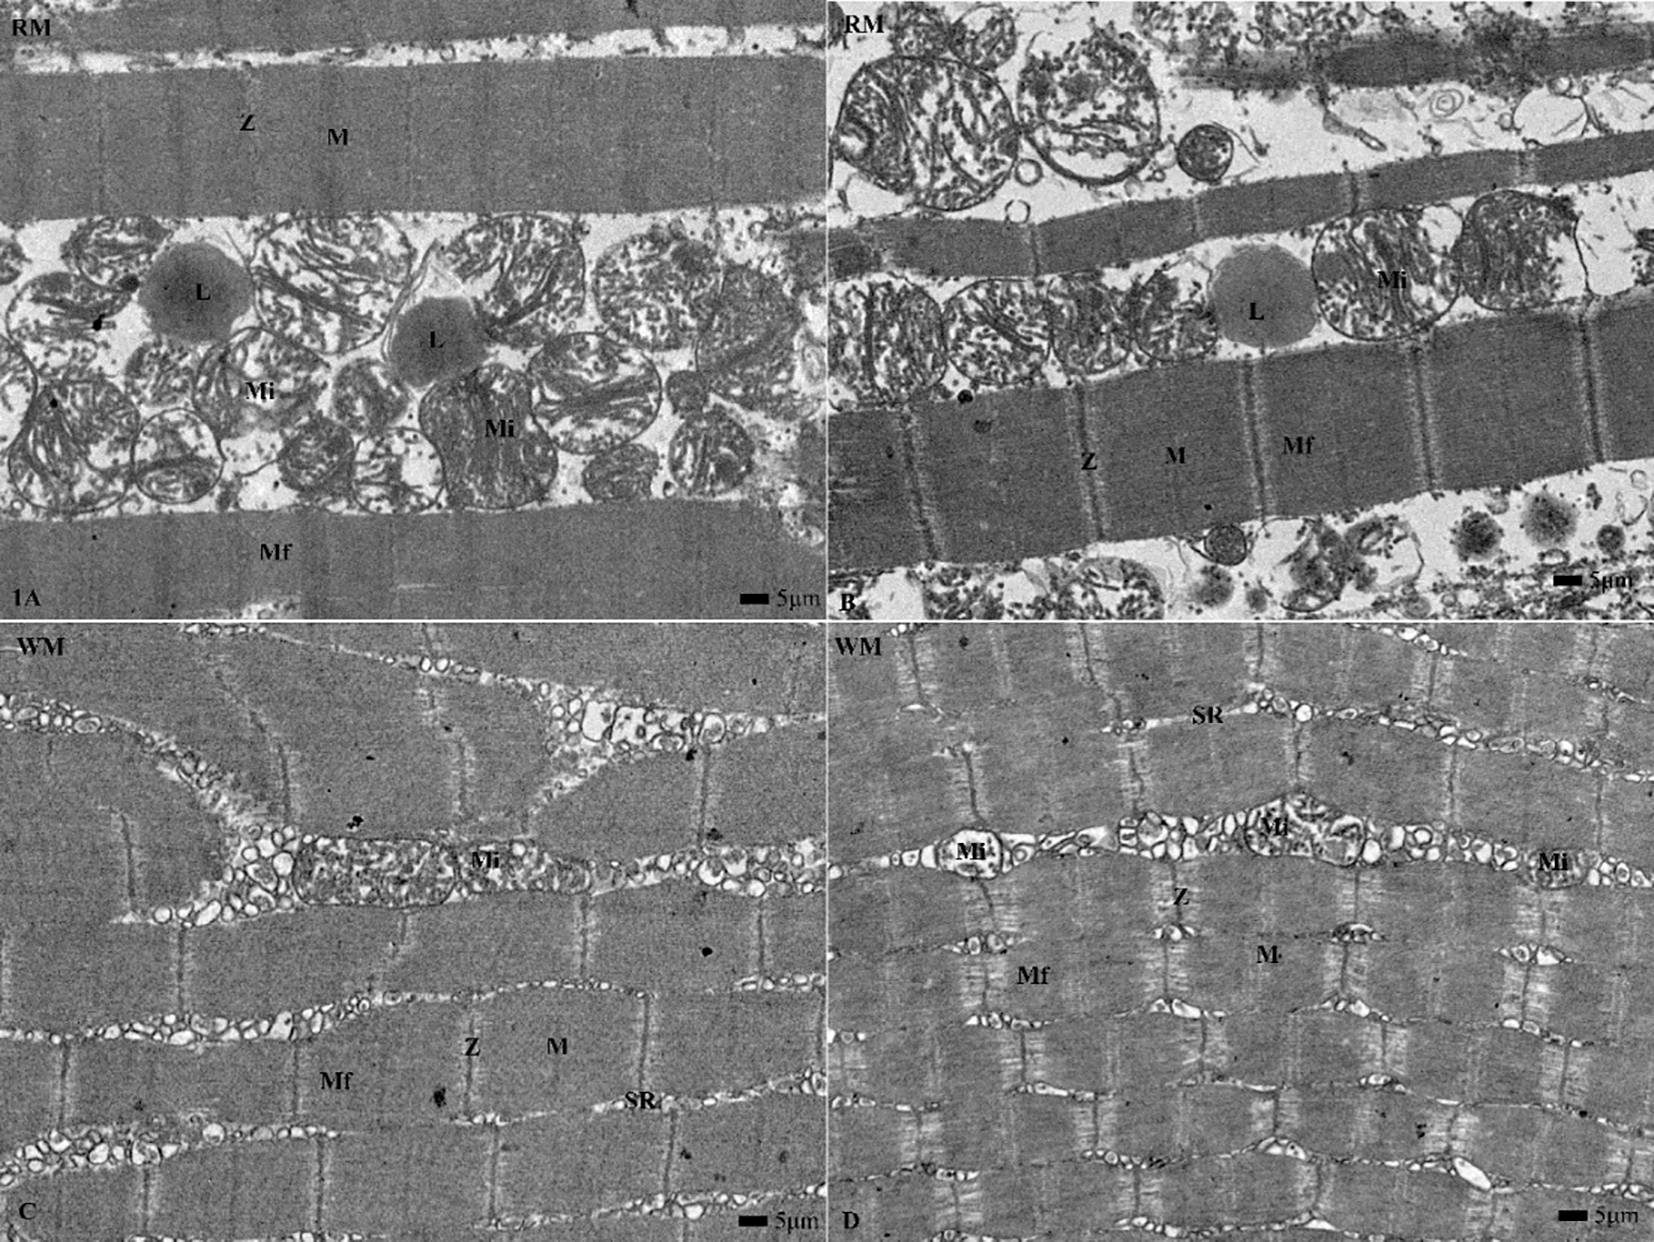
Transmission electron microscope sections of red (RM) and white (WM) muscles from yellowfin tuna. RM exhibits numerous large, oval mitochondria with surrounding lipid droplets, whereas WM shows fewer, elongated mitochondria and a well-developed sarcoplasmic reticulum. Mf, myofibril; SR, sarcoplasmic reticulum; Mi, mitochondria; M, M line; Z, Z line; L, lipid droplets; Magnification, 2000X; Scale bar = 5μm.
Transcriptome sequencing and annotation
According to Illumina sequencing results, we obtained 40.07-47.22 million raw reads, whereas 40.00-45.40 million clean reads were generated after filtering the data. The results showed high similarity with the reference genome. In addition, the sample’s Q20, Q30, and GC contents ranged from 97.38% to 97.78%, 92.79% to 93.64%, and 47.38% to 52.2%, respectively, demonstrating high-quality transcriptome sequencing data, which satisfy the subsequent analysis requirements (Figure 2A).
Figure 2
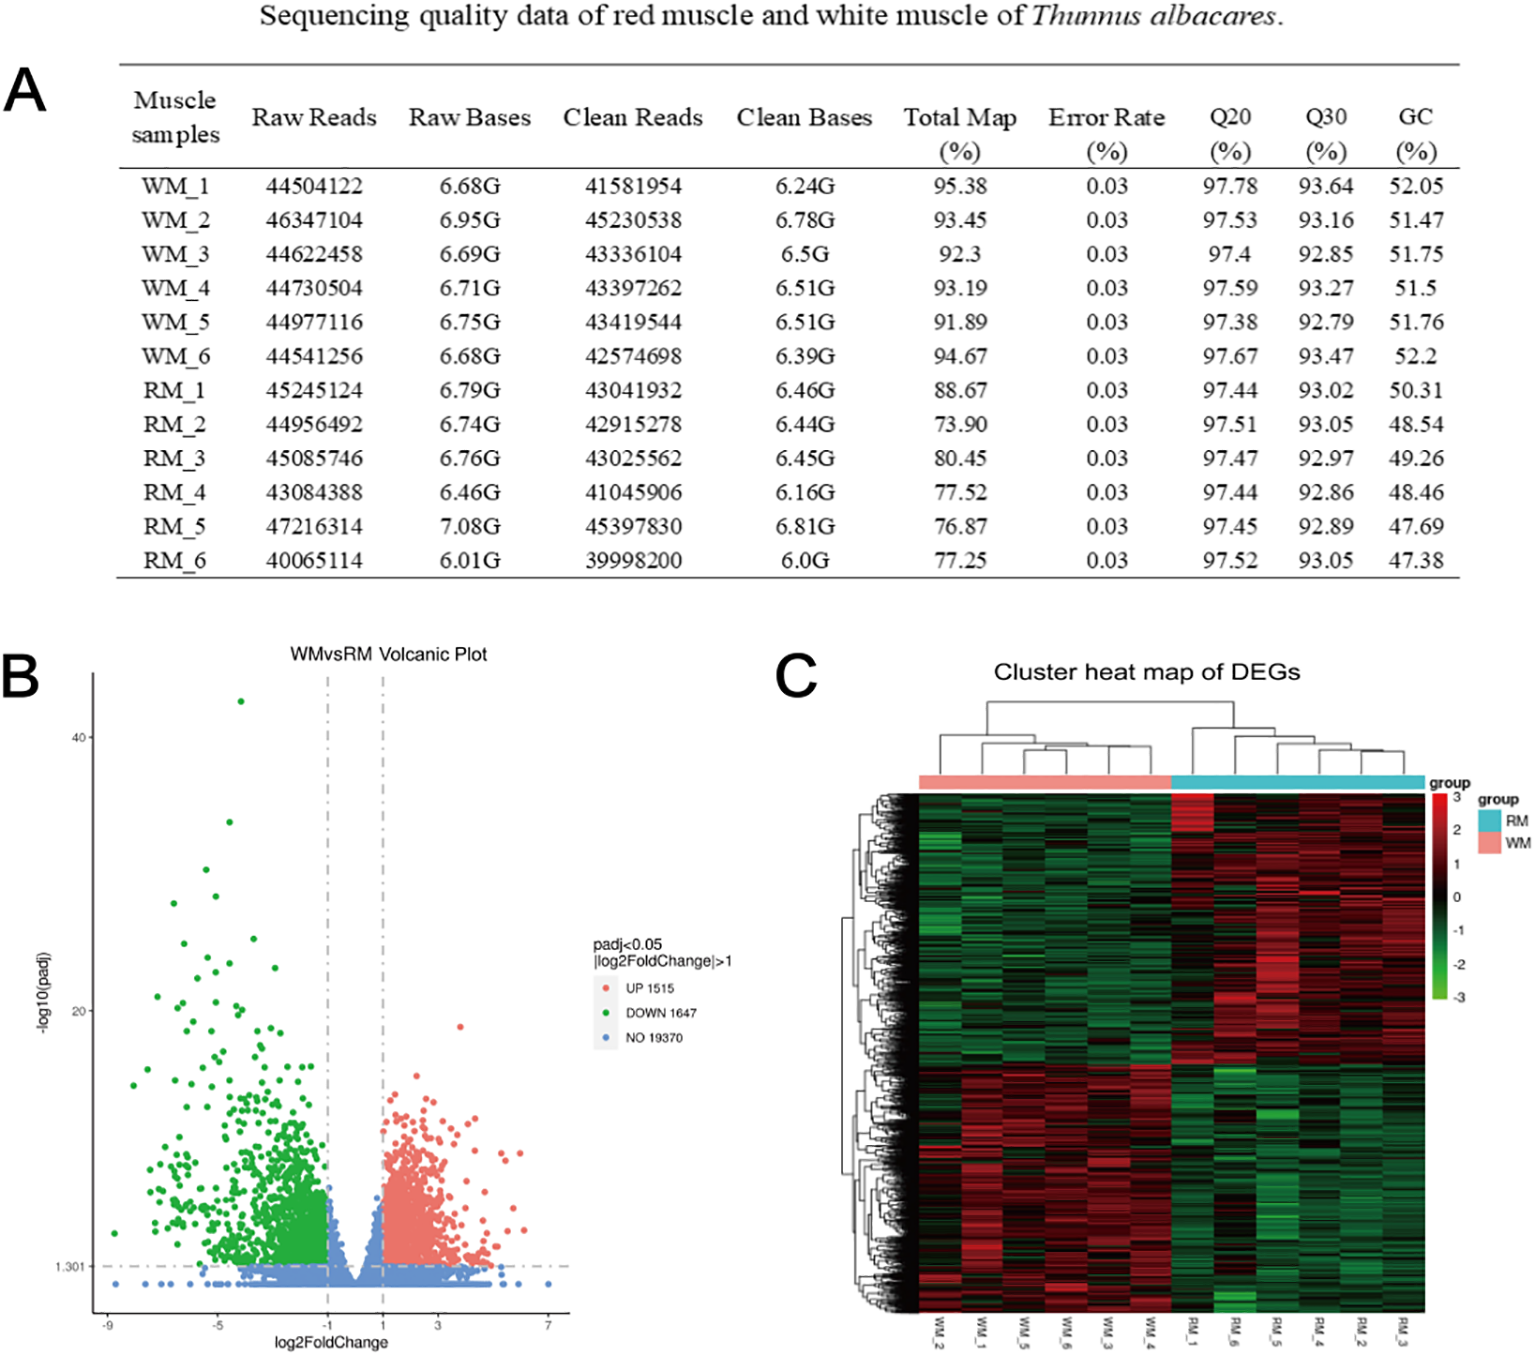
Sequencing data and the DEGs expression. Red and white muscles. (A) Sequencing quality data of red muscle and white muscle of T. albacares. (B) The volcanic map showed the distribution of DEGs. Under the criteria for |log2FoldChange|>1 and Padj < 0.05, red dots represented up-regulated and down-regulated genes with green dots. (C) The cluster heat map of DEGs between red and white muscle. In the figure, the abscissa is the sample name, and the ordinate is the value after normalizing the differential gene FPKM.
Screening and identification of DEGs
Red and white muscle tissues showed a total of 3,162 DEGs, of which 1,515 and 1,647 were significantly regulated in WM and RM, respectively (Figure 2B). Furthermore, DEGs were analyzed by cluster analysis, which revealed that some of them perform similar biological processes (Figure 2C).
GO enrichment analysis of DEGs
To determine the significance of DEGs in biological processes, cellular components, and molecular functions in both WM and RM tissues, functional enrichment analysis was carried out on their GO annotation. A total of 872 GO terms were significantly enriched for all DEGs (P < 0.05). In the WM group, up-regulated genes were mostly found in biological processes (Figure 3A), including translation (GO:0006412), amide biosynthesis (GO:0043604), peptide biosynthesis (GO:0043043), and peptide metabolism (GO:0006518). In contrast, the other two biological processes did not show significant enrichment. Figure 3B showed that genes significantly up-regulated in the RM group were mainly concentrated in the biological process group, including proton transmembrane transport (GO:1902600), energy coupled proton transport, down electrochemical gradient (GO:0015985), ATP synthesis coupled proton transport (GO:0015986), etc. In molecular function, the main enrichments were in electron transfer activity (GO:0009055), proton transmembrane transporter activity (GO:0015078), cofactor binding (GO:0048037), etc. Besides, the mitochondrion (GO:0005739), mitochondrial inner membrane (GO:0005743), organelle inner membrane (GO:0019866), and mitochondrial part (GO:0044429) were significantly enriched in the cellular component group (Padj < 0.05).
Figure 3
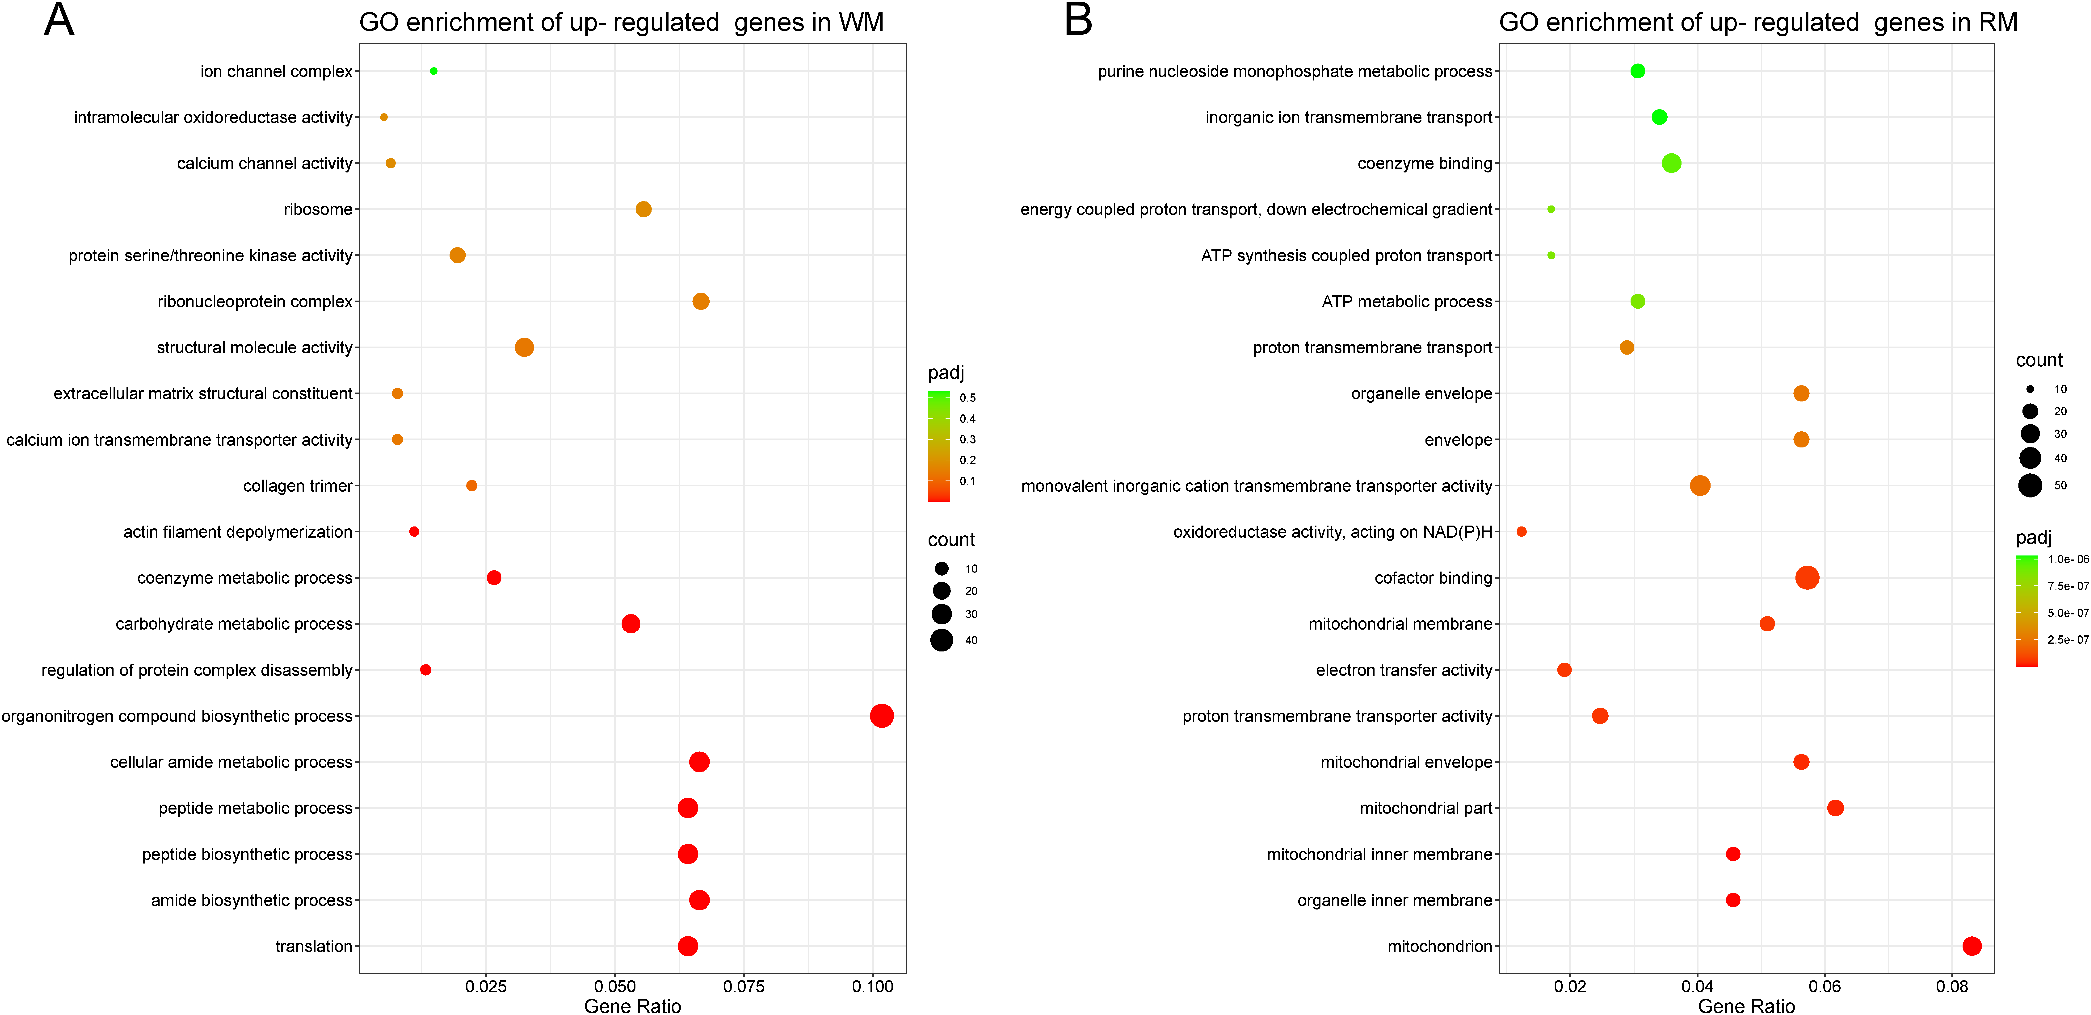
GO enrichment analysis of DEGs in red and white muscles. (A) White muscle significantly up-regulated genes GO enrichment. (B) Red muscle significantly up-regulated genes GO enrichment. The x-axis gene ratio represents the ratio of DEGs annotated on the GO number to the total number of differential genes. The Padj represents the P-value adjusted for multiple hypothesis testing. The size of the count indicates the number of DEGs annotated to the GO terms.
KEGG enrichment analysis of DEGs
An analysis of KEGG pathway data was also conducted to classify DEGs. This analysis identified 151 pathways with 1078 DEGs significantly enriched in 26 of them (P < 0.05). The metabolism of starch and sucrose (ola00500), glycolysis and gluconeogenesis (ola00010), amino acid synthesis (ola01230), and insulin signaling pathway (ola04901) were significantly enriched in WM tissue (Figure 4A). Oxidative phosphorylation (ola00190), cardiac muscle contraction (ola04260), carbon metabolism (ola01200), PPAR signaling pathway (ola03320), and fatty acid metabolism/degradation/biosynthesis (ola01212; ola00071; ola00061) were the main pathways in RM tissue (Figure 4B). DEG enrichment results from KEGG provided molecular evidence for differences in energy metabolism between RM and WM tissues. The oxidative phosphorylation pathway is the most differentially enriched. In this pathway, 75 genes were annotated, of which 61 showed differential expression between RM and WM (Padj < 0.05). Among these, only phospholysine phosphohistidine inorganic pyrophosphate phosphatase (LHPP) and V-type H+-transporting ATPase 16 kDa proteolipid subunit (ATPeV0C) were significantly up-regulated in WM. Meanwhile, the rest were significantly down-regulated (Padj < 0.05) (Figure 5A).
Figure 4
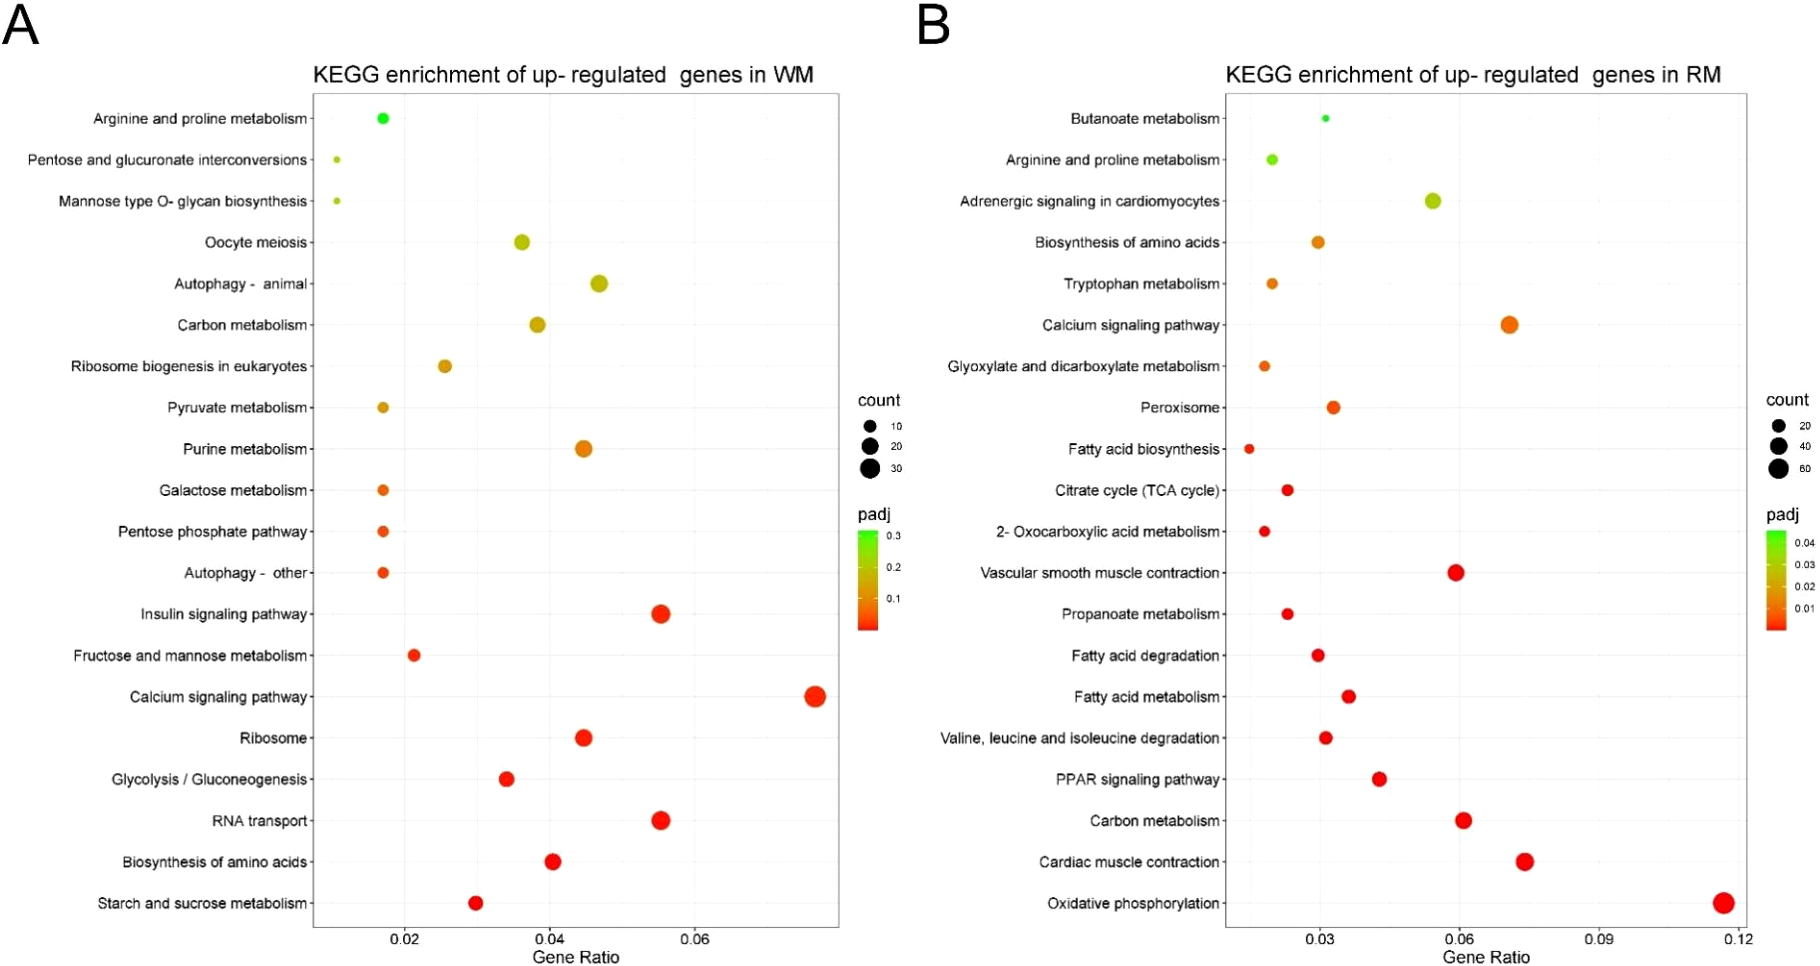
KEGG enrichment analysis of DEGs in red and white muscles. (A) White muscle significantly up-regulated genes KEGG enrichment. (B) Red muscle significantly up-regulated genes KEGG enrichment. The x-axis represents the ratio of the number of DEGs annotated to the KEGG pathway to the total number of DEGs. The Padj represents the corrected P-value for multiple hypothesis testing. The size of the count indicates the number of differential genes annotated to the KEGG pathway number.
Figure 5
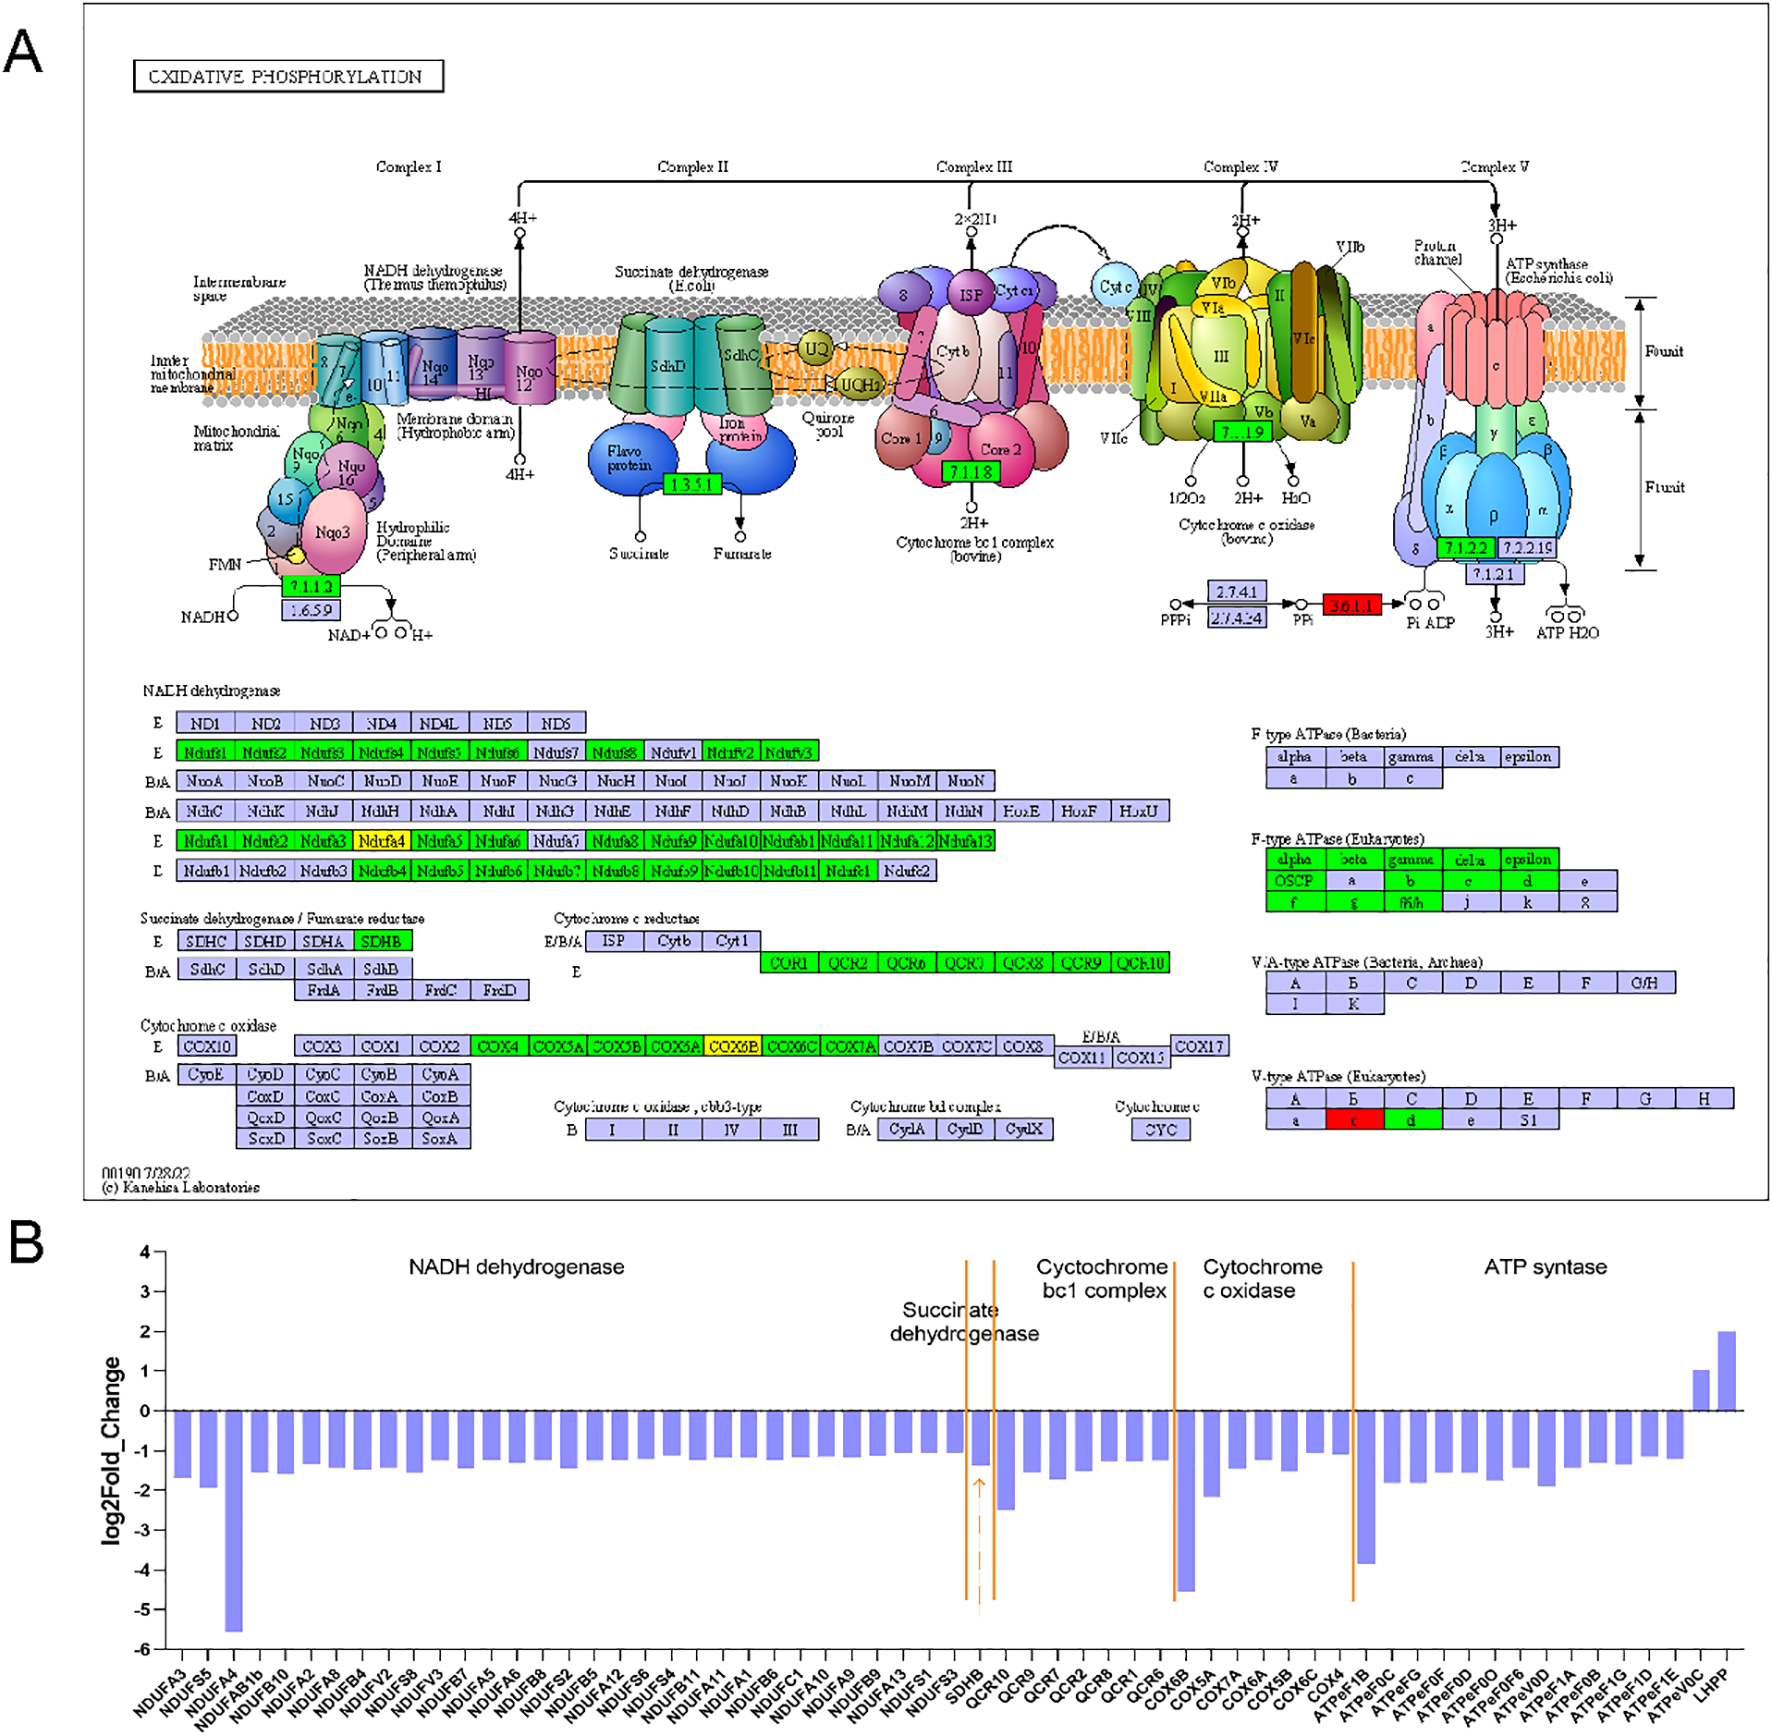
DEGs in oxidative phosphorylation pathways associated with red and white muscle. (A) Mapping to oxidative phosphorylation pathway differentially expressed genes, green boxes indicate down-regulated genes in white muscle, and red boxes indicate up-regulated genes in white muscle. (B) Fold change in the log2 scale of the genes marked in A.
qRT-PCR
We performed qRT-PCR validation on 15 DEGs to verify the reliability of the transcriptome data, including BPGM, GAPDH, GYS, ENO3, COX5A, ACAA2, CS, PPP1R3, PGM, HACD4, PGAM2, PGK1, CPT2, ECI1, and ACO2, which were involved in glucose metabolism, lipid metabolism, and carbon metabolism (Supplementary Table S1). A comparison of the qRT-PCR results with the RNA-Seq analysis results is shown in Figure 6, which indicates that the RNA-Seq data were accurate.
Figure 6
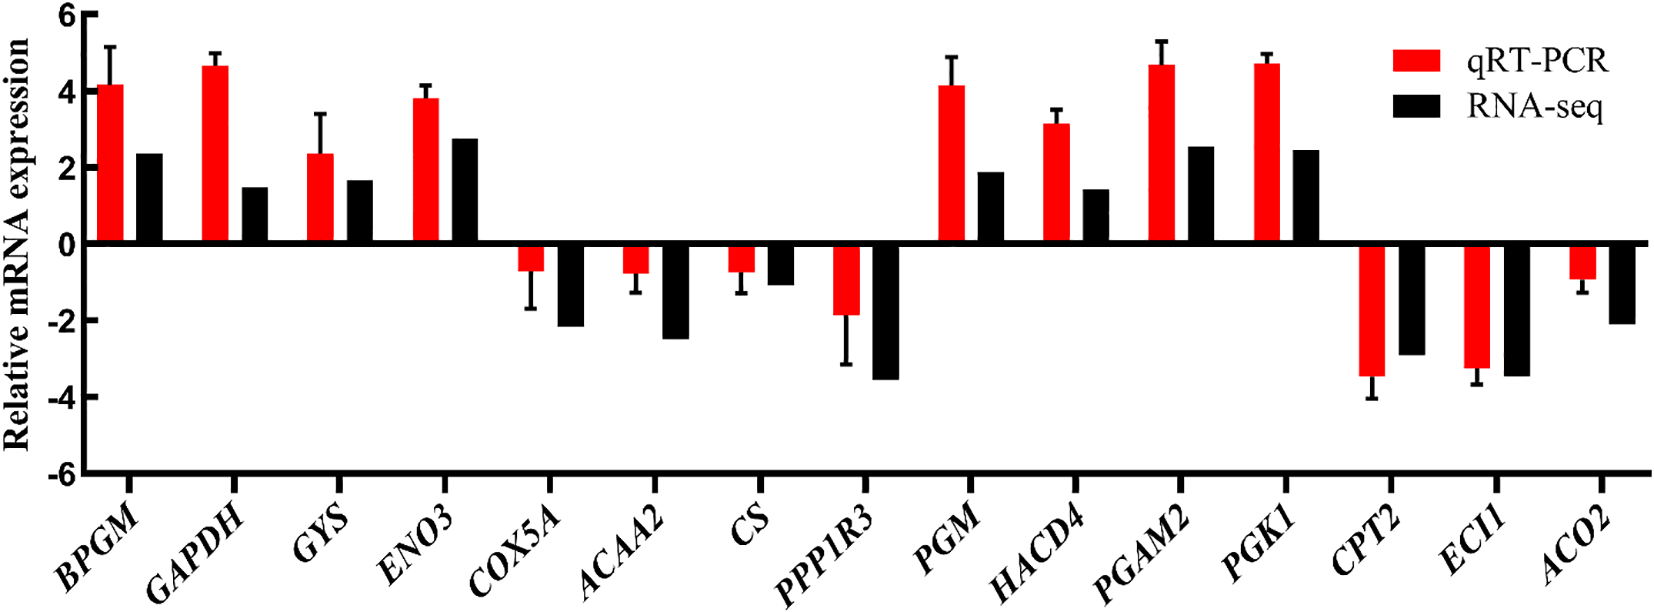
qRT-PCR validation of RNA-seq gene expression profiles.
The physiological and biochemical indicators
The physiological and biochemical indicators associated with energy metabolism were also detected. There was a significant increase in glucose metabolism enzyme activities in WM (P < 0.05), as shown in Figure 7A. In contrast, CS, MDH, and SDH were significantly higher in RM (P < 0.05). However, PFK was not significantly different between the muscle tissues (P > 0.05). The lipid metabolism results presented in Figure 7B show that TG, T-CHO, HDL, and LDL content and LPS activity were significantly higher in RM (P < 0.01). In contrast, FAS and CPT-1 content were higher in WM (P < 0.05).
Figure 7
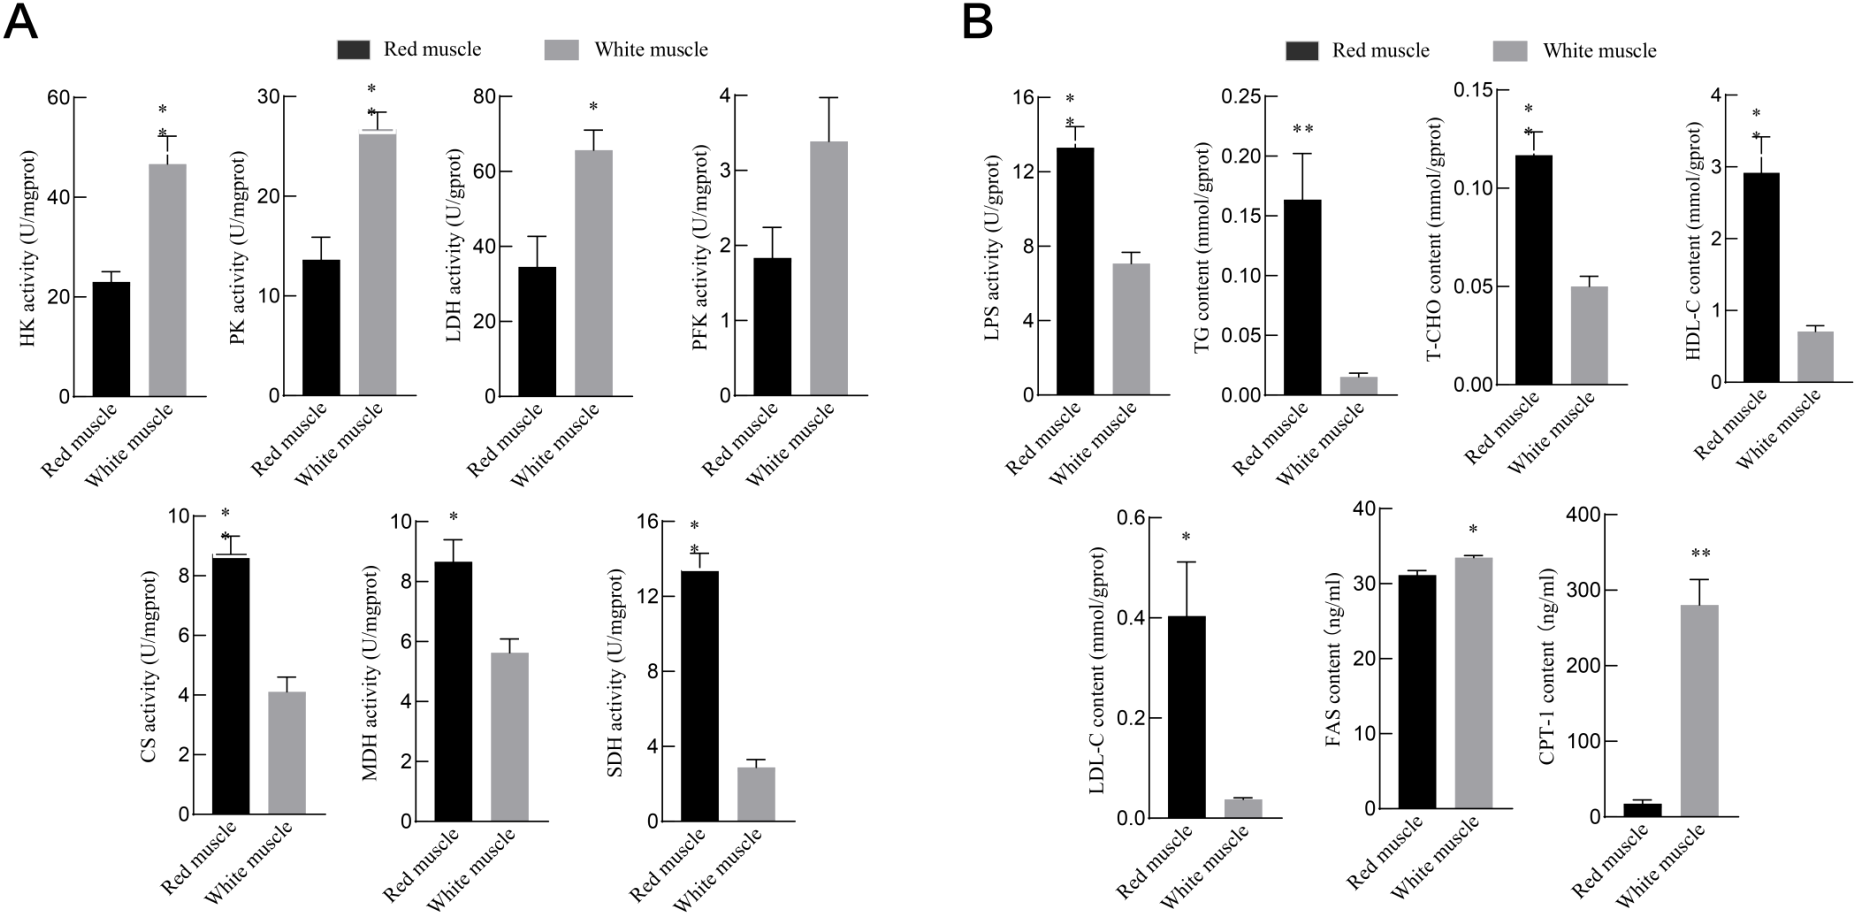
Energy metabolism parameters of red and white muscles. (A&B). (A) Represents the results of physiological and biochemical indicators of glucose metabolism. (B) Represents the results of physiological and biochemical indicators related to lipid metabolism. * and ** indicate significant differences at 0.05 level (P < 0.05) and extremely significant differences at 0.01 level (P < 0.01).
Discussion
As is well-known, Yellowfin tuna (Thunnus albacares) is a species of high-speed ocean predator (Katz et al., 2001). The exceptional swimming capabilities of yellowfin tuna (Thunnus albacares) are closely associated with their distinct muscle types (red and white muscles) (Kieffer, 2000; Ciezarek et al., 2020). In this study, through comprehensive research methodologies (TEM, transcriptomics, and metabolic enzyme activity analysis), we revealed a remarkable divergence in energy metabolism between the RM and WM of yellowfin tuna.
Mitochondria are cellular energy converters, and their structure, shape, and content vary in different tissues (Lin et al., 2020; Long et al., 2022). The TEM results showed that the mitochondria in RM were round or oval, and the mitochondria in WM tissue were flat and long. Therefore, mitochondria are also the main site of oxidative phosphorylation, and the number of mitochondria is directly related to tissue oxidative phosphorylation capacity (Benard et al., 2006). TEM that the number of mitochondria in RM tissue was more than that in WM tissue, similar to the results of Tilapia (Wu et al., 2018) and Lagodon rhomboides (Neurohr et al., 2021). These findings suggest that RM tissue has a higher mitochondrial oxidative phosphorylation level than WM tissue to produce more ATP for sustained aerobic exercise (Malik et al., 2021). Mitochondrial oxidative phosphorylation, a key regulatory pathway for muscle contraction, promotes carbon metabolism and the TCA cycle (Cecchini, 2013; Park et al., 2014). In addition, transcriptome analysis found that the oxidative phosphorylation pathway was the key regulatory pathway in skeletal muscle (Song et al., 2021). Our TEM findings are consistent with those found in Takifugu rubripes and Pseudocaranx dentex (Gao et al., 2017), which both down-regulated the expression of many genes in this signaling pathway (Figure 5B). It was further indicated that the RM tissue of yellowfin tuna has a higher level of oxidative phosphorylation, which ensured the sustainable energy demand of swimming movement.
During endurance swimming and growth, fish muscles use lipids as their primary source of energy (Weber et al., 2016; Pecoraro et al., 2017). Skeletal muscle stores extra fatty acids as triacylglycerol in lipid droplets within the muscle tissue (Api et al., 2018). TEM results indicated that RM tissue contained various-sized lipid droplets, and no lipid droplets were seen in WM tissue, which was similar to the result of the Oncorhynchus mykiss study (Magnoni et al., 2013), suggesting higher fatty acid content in yellowfin tuna RM tissue, providing energy for sustained aerobic exercise. Additionally, transcriptome sequencing results revealed up-regulated lipid metabolism-related signaling pathways in RM, including fatty acid metabolism, degradation, and biosynthesis pathways (Figure 4B). Moreover, genes like CPT2, ACAA2, ACADM, HSD17B8, CPT1A, ACSL, ECI1, MYC, and MECR, involved in the regulation of muscle lipid metabolism were higher in RM than in WM (Supplementary Table S2). These results imply that RM tissue relies on lipid metabolism to provide energy for fish locomotion (George and Don Stevens, 1978). Additionally, studies indicate that peroxisome proliferator-activated receptors (PPARs) regulate lipid metabolism and promote muscle fiber formation (Zhang et al., 2017). In our study, key genes such as NR1C1, NR1C3, PLIN2, FABP3, LPL, and FABP2, associated with the PPAR signaling pathway, exhibited significantly higher expression in RM and promoted lipid metabolism (Supplementary Figure S1). Besides, we assessed lipid metabolism enzyme activities and physiological indicators. The results demonstrated that RM has higher LPS activity and related physiological indicators content, which conformed to Salmo trutta (Anttila et al., 2010), indicating that the RM of yellowfin tuna has a high lipid metabolism capacity. In lipid deposition, FAS, one of the main enzymes in fatty acid synthesis, plays a vital role (Tan et al., 2019). At the same time, CPT-1 acts as a limiting factor in fatty acid β-oxidation, promoting the oxidative breakdown of fatty acids (Ayisi and Zhao, 2017). Our measurements indicated that the levels of two enzymes were significantly elevated in WM compared to RM, implying enhanced activity in fatty acid synthesis and oxidation. This observed phenomenon could be attributed to juvenile yellowfin tuna’s higher WM tissue muscle composition proportion.
Glucose metabolism is another way for muscles to obtain energy, including anaerobic glycolysis, gluconeogenesis, and the TCA cycle pathway. Transcriptome sequencing revealed a significant up-expression of genes related to the glycolysis/gluconeogenesis pathway, including LDHBA, ENO3, PKMB, HK2, GAPDH, ALDO, PGK, PGAM2, BPGM, and others, in WM tissue (Supplementary Figure S2). In contrast, ACO2, CS, MDH1AB, PDHA, PDHB, SDHB, DLAT IDH3, DLST, and LSC2, involved in the tricarboxylic acid cycle, exhibited a down-regulated expression level in RM tissue (Supplementary Figure S3). These results were reported by bluefin tuna and other fish (Shibata et al., 2016; Teulier et al., 2019), suggesting that red and white muscle tissues rely on distinct metabolic pathways for energy supply. Studies have found that enzyme activity is relatively stable and closely linked to gene expression so that it can indicate tissues’ aerobic and anaerobic metabolic capacities (Lawrence DeKoning et al., 2004; Drazen et al., 2015). We measured the activities of key enzymes of the glucose metabolism pathway and identified that the enzymes’ activity correlated with glycolysis/gluconeogenesis, like HK, PK, and LDH, were substantially greater in WM than in RM. Meanwhile, the CS, SDH, and MDH activity attached to aerobic oxidation were greatly higher in RM than in WM, which was in line with the above gene expression results. These results showed that WM demonstrates a heightened anaerobic metabolic capacity, while RM showcases a superior aerobic metabolic capacity.
Conclusions
In conclusion, this study elucidates the energy metabolism differences between the red and white muscle tissues of yellowfin tuna from multiple perspectives, thereby establishing a foundation for future investigations into muscle development. The findings indicate that RM is characterized by a high abundance of mitochondria and lipid droplets, which correspond to elevated expression levels of genes and enzyme activities associated with oxidative phosphorylation, lipid metabolism, and the tricarboxylic acid (TCA) cycle. Conversely, WM exhibits a predominance of genes and enzymes associated with anaerobic glycolysis and gluconeogenesis. Notably, discrepancies between mRNA expression levels and enzyme activities suggest the involvement of complex post-transcriptional regulatory mechanisms. While this study provides valuable insights into the differential energy metabolism of red and white muscle tissues, further studies focusing on post-transcriptional modifications and protein expression are necessary to fully elucidate the underlying regulatory mechanisms. These findings are anticipated to contribute significantly to theoretical advancements in the field of fish locomotor physiology and offer new insights into the evolutionary adaptations of teleosts.
Statements
Data availability statement
The datasets presented in this study can be found in online repositories. The names of the repository/repositories and accession number(s) can be found in the article/Supplementary Material.
Ethics statement
The animal study was approved by Hainan University Institutional Animal Care and Use Committee. The study was conducted in accordance with the local legislation and institutional requirements.
Author contributions
ZL: Funding acquisition, Investigation, Writing – original draft, Writing – review & editing. QL: Data curation, Investigation, Methodology, Validation, Writing – original draft, Writing – review & editing. EY: Conceptualization, Writing – review & editing. JX: Conceptualization, Funding acquisition, Investigation, Resources, Writing – review & editing. ZG: Conceptualization, Funding acquisition, Investigation, Resources, Writing – review & editing.
Funding
The author(s) declare that financial support was received for the research and/or publication of this article. This study was supported by the Opening Foundation of Hainan Tropical Oceanography University & Yazhouwan Innovation Research Institute (2022RHDKFKT03), Hainan University Research Start-up Fund (KYQD(ZR)23175) and Hainan University technical service project Fund (RH2400009234).
Acknowledgments
The authors are very grateful to the reviewers for their valuable comments on the manuscript.
Conflict of interest
The authors declare that the research was conducted in the absence of any commercial or financial relationships that could be construed as a potential conflict of interest.
Generative AI statement
The author(s) declare that no Generative AI was used in the creation of this manuscript.
Publisher’s note
All claims expressed in this article are solely those of the authors and do not necessarily represent those of their affiliated organizations, or those of the publisher, the editors and the reviewers. Any product that may be evaluated in this article, or claim that may be made by its manufacturer, is not guaranteed or endorsed by the publisher.
Supplementary material
The Supplementary Material for this article can be found online at: https://www.frontiersin.org/articles/10.3389/fmars.2025.1585044/full#supplementary-material
References
1
Anttila K. Jäntti M. Mänttäri S. (2010). Effects of training on lipid metabolism in swimming muscles of sea trout (Salmo trutta). J. Comp. Physiol. B.180, 707–714. doi: 10.1007/s00360-010-0446-1
2
Api M. Bonfanti E. Lombardo F. Pignalosa P. Hardiman G. Carnevali O. (2018). Effects of age on growth in Atlantic bluefin tuna (Thunnus thynnus). Gen. Comp. Endocrinology.265, 64–70. doi: 10.1016/j.ygcen.2018.01.010
3
Ayisi C. L. Zhao J. (2017). Fatty acid composition, lipogenic enzyme activities and mrna expression of genes involved in the lipid metabolism of nile tilapia fed with palm oil. Turkish J. Fisheries Aquat. Sci.17, 405–415. doi: 10.4194/1303-2712-v17_2_20
4
Benard G. Faustin B. Passerieux E. Galinier A. Rocher C. Bellance N. et al . (2006). Physiological diversity of mitochondrial oxidative phosphorylation. Am. J. Physiology-Cell Physiol.291 (6), C1172–C1182. doi: 10.1152/ajpcell.00195.2006
5
Betancor M. B. Ortega A. de la Gándara F. Tocher D. R. Mourente G. (2017). Molecular aspects of lipid metabolism, digestibility and antioxidant status of Atlantic bluefin tuna (T. thynnus L.) larvae during first feeding. Aquaculture479, 357–369. doi: 10.1016/j.aquaculture.2017.06.011
6
Brill R. W. Hobday A. J. (2017). Tunas and their fisheries: safeguarding sustainability in the twenty-first century. Rev. Fish Biol. Fisheries.27, 691–695. doi: 10.1007/s11160-017-9500-3
7
Cecchini G. (2013). Respiratory complex II: Role in cellular physiology and disease. Biochim. Biophys. Acta (BBA) - Bioenergetics.1827, 541–542. doi: 10.1016/j.bbabio.2013.02.010
8
Chen S. Zhou Y. Chen Y. Gu J. (2018). fastp: an ultra-fast all-in-one FASTQ preprocessor. Bioinformatics34, i884–i890. doi: 10.1093/bioinformatics/bty560
9
Churova M. V. Meshcheryakova O. V. Veselov A. E. Nemova N. N. (2015). Activity of enzymes involved in the energy and carbohydrate metabolism and the level of some molecular-genetic characteristics in young salmons (Salmo salar L.) with different age and weight. Ontogenez46, 254–262. doi: 10.1134/S1062360415050021
10
Ciciliot S. Rossi A. C. Dyar K. A. Blaauw B. Schiaffino S. (2013). Muscle type and fiber type specificity in muscle wasting. Int. J. Biochem. Cell Biol.45, 2191–2199. doi: 10.1016/j.biocel.2013.05.016
11
Ciezarek A. Gardner L. Savolainen V. Block B. (2020). Skeletal muscle and cardiac transcriptomics of a regionally endothermic fish, the Pacific bluefin tuna, Thunnus orientalis. BMC Genomics21, 642. doi: 10.1186/s12864-020-07058-z
12
Drazen J. C. Friedman J. R. Condon N. E. Aus E. J. Gerringer M. E. Keller A. A. et al . (2015). Enzyme activities of demersal fishes from the shelf to the abyssal plain. Deep Sea Res. Part I: Oceanographic Res. Papers.100, 117–126. doi: 10.1016/j.dsr.2015.02.013
13
Frontera W. R. Ochala J. (2015). Skeletal muscle: A brief review of structure and function. Calcified Tissue Int.96, 183–195. doi: 10.1007/s00223-014-9915-y
14
Gao K. Wang Z. Zhou X. Wang H. Kong D. Jiang C. et al . (2017). Comparative transcriptome analysis of fast twitch muscle and slow twitch muscle in Takifugu rubripes. Comp. Biochem. Physiol. Part D Genomics Proteomics24, 79–88. doi: 10.1016/j.cbd.2017.08.002
15
George J. C. Don Stevens E. (1978). Fine structure and metabolic adaptation of red and white muscles in tuna. Environ. Biol. Fishes.3, 185–191. doi: 10.1007/BF00691942
16
Guppy M. Hulbert W. C. Hochachka P. W. (1979). Metabolic sources of heat and power in tuna muscles: II. Enzyme and metabolite profiles. J. Exp. Biol.82, 303–320. doi: 10.1242/jeb.82.1.303
17
He W. Xia W. Cao Z.-D. Fu S.-J. (2013). The effect of prolonged exercise training on swimming performance and the underlying biochemical mechanisms in juvenile common carp (Cyprinus carpio). Comp. Biochem. Physiol. Part A: Mol. Integr. Physiol.166, 308–315. doi: 10.1016/j.cbpa.2013.07.003
18
Houssard P. Lorrain A. Tremblay-Boyer L. Allain V. Graham B. S. Menkes C. E. et al . (2017). Trophic position increases with thermocline depth in yellowfin and bigeye tuna across the Western and Central Pacific Ocean. Prog. Oceanography.154, 49–63. doi: 10.1016/j.pocean.2017.04.008
19
Huang H. Zhang Y. Cao M. Xue L. Shen W. (2018). Effects of fasting on the activities and mRNA expression levels of lipoprotein lipase (LPL), hormone-sensitive lipase (HSL) and fatty acid synthetase (FAS) in spotted seabass Lateolabrax maculatus. Fish Physiol. Biochem.44, 387–400. doi: 10.1007/s10695-017-0442-4
20
Katz S. L. Syme D. A. Shadwick R. E. (2001). Enhanced power in yellowfin tuna. Nature410, 770–771. doi: 10.1038/35071170
21
Kieffer J. D. (2000). Limits to exhaustive exercise in fish. Comp. Biochem. Physiol. Part A: Mol. Integr. Physiol.126, 161–179. doi: 10.1016/S1095-6433(00)00202-6
22
Korsmeyer K. E. Dewar H. (2001). Tuna metabolism and energetics. Fish Physiology: Acad. Press;19, 35–78. doi: 10.1016/S1546-5098(01)19003-5
23
Lawrence DeKoning A. B. Picard Daniel J. Bond Stephen R. Schulte Patricia M. (2004). Stress andInterpopulation Variation in Glycolytic Enzyme Activity and Expression in a Teleost FishFundulus heteroclitus. Physiol. Biochem. Zoology.77, 18–26. doi: 10.1086/378914
24
Li R. Zhang R. Yi J. Guo W. Cheng Q. Zhi L. et al . (2019). Characterization and expression profiles of muscle transcriptome in Schizothoracine fish, Schizothorax prenanti. Gene685, 156–163. doi: 10.1016/j.gene.2018.10.070
25
Lin G.-M. Audira G. Juniardi S. Hsiao C.-D. (2020). Metatranscriptomic analysis reveals co-expression pattern of mitochondrial oxidative phosphorylation (OXPHOS) genes among different species of bony fishes in muscle tissue. J. King Saud Univ. - Science.32, 3084–3090. doi: 10.1016/j.jksus.2020.08.018
26
Livak K. J. Schmittgen T. D. (2001). Analysis of relative gene expression data using real-time quantitative PCR and the 2(-Delta Delta C(T)) Method. Methods25, 402–408. doi: 10.1006/meth.2001.1262
27
Long J. Xia Y. Qiu H. Xie X. Yan Y. (2022). Respiratory substrate preferences in mitochondria isolated from different tissues of three fish species. Fish Physiol. Biochem.48, 1555–1567. doi: 10.1007/s10695-022-01137-6
28
Lu Z. Y. Feng L. Jiang W. Wu P. Liu Y. Jiang J. et al . (2023a). Mannan oligosaccharides alleviate oxidative injury in the head kidney and spleen in grass carp (Ctenopharyngodon idella) via the Nrf2 signaling pathway after Aeromonas hydrophila infection. J. Anim. Sci. Biotechnol.14, 58. doi: 10.1186/s40104-023-00844-1
29
Lu Z. Y. Feng L. Jiang W.-D. Wu P. Liu Y. Jin X.-W. et al . (2022). An Antioxidant Supplement Function Exploration: Rescue of Intestinal Structure Injury by Mannan Oligosaccharides after Aeromonas hydrophila Infection in Grass Carp (Ctenopharyngodon idella). Antioxidants11, 806. doi: 10.3390/antiox11050806
30
Lu Z. Y. Jiang W. D. Wu P. Liu Y. Ren H.-M. Jin X.-W. et al . (2023b). Cellular antioxidant mechanism of mannan-oligosaccharides involving in enhancing flesh quality in grass carp (Ctenopharyngodon idella). J. Sci. Food Agriculture.103, 1172–1182. doi: 10.1002/jsfa.12211
31
Magnoni L. J. Crespo D. Ibarz A. Blasco J. Fernández-Borràs J. Planas J. V. (2013). Effects of sustained swimming on the red and white muscle transcriptome of rainbow trout (Oncorhynchus mykiss) fed a carbohydrate-rich diet. Comp. Biochem. Physiol. Part A: Mol. Integr. Physiol.166, 510–521. doi: 10.1016/j.cbpa.2013.08.005
32
Malik A. Dickson K. A. Kitagawa T. Fujioka K. Estess E. E. Farwell C. et al . (2021). Scaling of locomotor muscle oxidative and glycolytic metabolic enzymes during the ontogeny of regional endothermy in Pacific bluefin tuna (Thunnus orientalis). Marine Biol.168, 130–147. doi: 10.1007/s00227-021-03945-5
33
Mareco E. A. Garcia de la Serrana D. Johnston I. A. Dal-Pai-Silva M. (2015). Characterization of the transcriptome of fast and slow muscle myotomal fibres in the pacu (Piaractus mesopotamicus). BMC Genomics16, 182. doi: 10.1186/s12864-015-1423-6
34
Neurohr J. M. Paulson E. T. Kinsey S. T. (2021). A higher mitochondrial content is associated with greater oxidative damage, oxidative defenses, protein synthesis and ATP turnover in resting skeletal muscle. J. Exp. Biol.224, jeb242462. doi: 10.1242/jeb.242462
35
Park S.-Y. Gifford J. R. Andtbacka R. H. I. Trinity J. D. Hyngstrom J. R. Garten R. S. et al . (2014). Cardiac, skeletal, and smooth muscle mitochondrial respiration: are all mitochondria created equal? Am. J. Physiology-Heart Circulatory Physiol.307, H346–H352. doi: 10.1152/ajpheart.00227.2014
36
Pecoraro C. Zudaire I. Bodin N. Murua H. Taconet P. Díaz-Jaimes P. et al . (2017). Putting all the pieces together: integrating current knowledge of the biology, ecology,fisheries status,stock structure and management of yellowfin tuna (Thunnus albacares). Rev. Fish Biol. Fisheries.27, 811–841. doi: 10.1007/s11160-016-9460-z
37
Pillai N. G. Alexander K. M. (1982). A comparative study on certain biochemical aspects of red and white myotomal muscles of the black skipjack tuna, Euthynnus affinis Cantor. Proc. Anim. Sci.91, 349–355. doi: 10.1007/BF03186128
38
Qian X. Ba Y. Zhuang Q. Zhong G. (2014). RNA-seq technology and its application in fish transcriptomics. Omics A J. Integr. Biol.18, 98–110. doi: 10.1089/omi.2013.0110
39
Rakus D. Gizak A. Deshmukh A. Wiśniewski J. R. (2015). Absolute quantitative profiling of the key metabolic pathways in slow and fast skeletal muscle. J. Proteome Res.14, 1400–1411. doi: 10.1021/pr5010357
40
Shadwick R. E. Syme D. A. (2008). Thunniform swimming: muscle dynamics and mechanical power production of aerobic fibres in yellowfin tuna (Thunnus albacares). J. Exp. Biol.211, 1603–1611. doi: 10.1242/jeb.013250
41
Shi W. Hu S. Wang W. Zhou X. Qiu W. (2013). Skeletal muscle-specific CPT1 deficiency elevates lipotoxic intermediates but preserves insulin sensitivity. J. Diabetes Res.2013, 163062. doi: 10.1155/2013/163062
42
Shibata M. Mekuchi M. Mori K. Muta S. Chowdhury V. S. Nakamura Y. et al . (2016). Transcriptomic features associated with energy production in the muscles of Pacific bluefin tuna and Pacific cod. Bioscience Biotechnology Biochem.80, 1114–1124. doi: 10.1080/09168451.2016.1151341
43
Singh A. Benjakul S. Zhou P. Zhang B. Deng S. (2021). Effect of squid pen chitooligosaccharide and epigallocatechin gallate on discoloration and shelf-life of yellowfin tuna slices during refrigerated storage. Food Chem.351, 129296. doi: 10.1007/s11160-017-9500-3
44
Song J. Li Q. Ke L. Liang J. Jiao W. Pan H. et al . (2021). Qiangji jianli decoction alleviates hydrogen peroxide-induced mitochondrial dysfunction via regulating mitochondrial dynamics and biogenesis in L6 myoblasts. Oxid. Med. Cell. Longevity.2021, 6660616. doi: 10.1155/2021/6660616
45
Suarez R. K. Mallet M. D. Daxboeck C. Hochachka P. W. (1986). Enzymes of energy metabolism and gluconeogenesis in the Pacific blue marlin, Makaira nigricans. Can. J. Zoology64, 694–697. doi: 10.1139/z86-102
46
Tan X. Sun Z. Ye C. (2019). Dietary Lycium barbarum extract administration improved growth, meat quality and lipid metabolism in hybrid grouper (Epinephelus lanceolatus ♂ × E. fuscoguttatus ♀) fed high lipid diets. Aquaculture504, 190–198. doi: 10.1016/j.aquaculture.2019.01.044
47
Teulier L. Thoral E. Queiros Q. McKenzie D. J. Roussel D. Dutto G. et al . (2019). Muscle bioenergetics of two emblematic Mediterranean fish species: Sardina pilchardus and Sparus aurata. Comp. Biochem. Physiol. Part A: Mol. Integr. Physiol.235, 174–179. doi: 10.1016/j.cbpa.2019.06.008
48
Townley I. K. Karchner S. I. Skripnikova E. Wiese T. E. Hahn M. E. Rees B. B. (2016). Sequence andfunctional characterization of hypoxia-inducible factors, HIF1α, HIF2αa, and HIF3α, fromthe estuarine fish, Fundulus heteroclitus. Am. J. Physiology-Regulatory Integr. Comp. Physiol.312, R412–R425. doi: 10.1152/ajpregu.00402.2016
49
Wakeling J. M. Johnston I. A. (1999). White muscle strain in the common carp and red to white muscle gearing ratios in fish. J. Exp. Biol.202, 521–528. doi: 10.1242/jeb.202.5.521
50
Wang H. Li B. Yang L. Jiang C. Zhang T. Liu S. et al . (2022). Expression profiles and transcript properties of fast-twitch and slow-twitch muscles in a deep-sea highly migratory fish, Pseudocaranx dentex. PeerJ10, e12720. doi: 10.7717/peerj.12720
51
Weber J. M. Choi K. Gonzalez A. Omlin T. (2016). Metabolic fuel kinetics in fish: swimming, hypoxia and muscle membranes. J. Exp. Biol.219, 250–258. doi: 10.1242/jeb.125294
52
Wentzel A. S. Petit J. van Veen W. G. Fink I. R. Scheer M. H. Piazzon M. C. et al . (2020). Transcriptome sequencing supports a conservation of macrophage polarization in fish. Sci. reports.10, 13470. doi: 10.1038/s41598-020-70248-y
53
Wu M.-P. Chang N.-C. Chung C.-L. Chiu W.-C. Hsu C.-C. Chen H.-M. et al . (2018). Analysis of titin in red and white muscles: crucial role on muscle contractions using a fish model. BioMed. Res. Int.2018, 5816875. doi: 10.1155/2018/5816875
54
Zhang Y. Ma X. Dai Z. (2019). Comparison of nonvolatile and volatile compounds in raw, cooked, and canned yellowfin tuna (Thunnus albacores). J. Food Process. Preservation.43, e14111. doi: 10.1111/jfpp.14111
55
Zhang J. Tao N. Qian X. Wang X. Wang M. (2020). Evaluation of antioxidative capacity and lipidomics profiling of big eye tuna (Thunns obesus) head soup with different colloidal particle size. Int. J. Food Sci. Technology.55, 3254–3266. doi: 10.1111/ijfs.14588
56
Zhang J. Zhao N. Sharawy Z. Li Y. Ma J. Lou Y. (2018). Effects of dietary lipid and protein levels on growth and physiological metabolism of Pelteobagrus fulvidraco larvaeunder recirculating aquaculture system (RAS). Aquaculture495, 458–464. doi: 10.1016/j.aquaculture.2018.06.004
57
Zhang L. Zhou Y. Wu W. Hou L. Chen H. Zuo B. et al . (2017). Skeletal muscle-specific overexpression of PGC-1α Induces fiber-type conversion through enhanced mitochondrial respiration and fatty acid oxidation in mice and pigs. Int. Journalof BiologicalSciences13, 1152–1162. doi: 10.7150/ijbs.20132
58
Zou Y. Wu D. Wei L. Xiao J. Zhang P. Huang H. et al . (2023). Mucus-associated microbiotas among different body sites of wild tuna from the South China Sea. Front. Marine Science.9. doi: 10.3389/fmars.2022.1073264
Summary
Keywords
Thunnus albacares , energy metabolism, tissue structure, red and white muscle, transcriptome
Citation
Lu Z, Li Q, Yongo E, Xiao J and Guo Z (2025) Comparative energy metabolism in red and white muscles of juvenile yellowfin tuna, Thunnus albacore. Front. Mar. Sci. 12:1585044. doi: 10.3389/fmars.2025.1585044
Received
03 March 2025
Accepted
07 April 2025
Published
01 May 2025
Volume
12 - 2025
Edited by
Yafei Duan, South China Sea Fisheries Research Institute, China
Reviewed by
Taner Yildiz, Istanbul University, Türkiye
Subrata Dasgupta, Central Institute of Fisheries Education (ICAR), India
Updates
Copyright
© 2025 Lu, Li, Yongo, Xiao and Guo.
This is an open-access article distributed under the terms of the Creative Commons Attribution License (CC BY). The use, distribution or reproduction in other forums is permitted, provided the original author(s) and the copyright owner(s) are credited and that the original publication in this journal is cited, in accordance with accepted academic practice. No use, distribution or reproduction is permitted which does not comply with these terms.
*Correspondence: Zhiyuan Lu, luzy@hainanu.edu.cn; Zhiqiang Guo, guozq@hainanu.edu.cn
†These authors have contributed equally to this work
Disclaimer
All claims expressed in this article are solely those of the authors and do not necessarily represent those of their affiliated organizations, or those of the publisher, the editors and the reviewers. Any product that may be evaluated in this article or claim that may be made by its manufacturer is not guaranteed or endorsed by the publisher.