 Fenglin Wang
 Qi Liu
 Yinquan Qu1
 Tianxiang Gao
- 1Fisheries College, Zhejiang Ocean University, Zhoushan, China
- 2School of Marine Sciences, Ningbo University, Ningbo, China
- 3Wuhan Onemore-Tech Co., Ltd, Wuhan, China
The family Echeneidae, which belongs to the order Carangiformes, is a group of marine fish recognized for their distinctive hitchhiking behavior. In this study, high-throughput sequencing technology was utilized to investigate the genomic characteristics of three species within the family Echeneidae. The results indicated that the genome sizes of Remora remora, Remora albescens, and Echeneis naucrates were 677.93 Mb, 574.19 Mb, and 572.04 Mb, respectively, and they exhibited similar genomic features. The GC content of these species ranged from 40.37% to 41.50%, the repeat sequence proportion varied between 27.98% and 39.53%, and the heterozygosity rate extended from 0.43% to 0.65%. A total of 527,027, 440,593, and 458,014 simple sequence repeats (SSRs) were identified in the genomes of R. remora, R. albescens, and E. naucrates, with mononucleotide repeats being the predominant type. The mitochondrial genomes of the three species were successfully assembled based on the genomic data. The phylogenetic tree constructed from single-copy homologous genes demonstrated that R. remora and R. albescens clustered within the genus Remora, while E. naucrates formed a lineage in the genus Echeneis. The results of the PSMC analysis revealed that these three species experienced rapid population expansion before the Last Interglacial Period, followed by a decline in their populations after reaching their peak during the Last Glacial Period. Notably, R. albescens exhibited significant bimodal population dynamics during both the Last Glacial and Glacial Maximum Periods. Overall, this study provides valuable genomic data for the research of Echeneidae species and establishes a crucial foundation for further exploration of their evolutionary history and ecological adaptations.
1 Introduction
The family Echeneidae, widely recognized as remoras or sharksuckers, represents a distinctive group of marine fish recognized for their specialized hitchhiking behavior, facilitated by a highly modified dorsal fin that functions as a suction disc (O’Toole, 2002; Kenaley et al., 2019). Echeneidae, within the order Carangiformes, encompasses three genera and eight species: Echeneis (E. naucrates, E. neucratoides), Remora (R. remora, R. albescens, R. australis, R. brachyptera, R. osteochir), and Phtheirichthys (P. lineatus) (Kenaley et al., 2019). These species are primarily distributed in tropical and warm temperate waters, with some inhabiting both coastal and pelagic environments (Gao et al., 2024). They attach to various vertebrate hosts, including sharks, whales, and sea turtles, thereby gaining benefits such as increased mobility, predator protection, and enhanced feeding opportunities (O’Toole, 2002; Beckert et al., 2016a; Kenaley et al., 2019). Despite their ecological significance and potential applications in bioinspired research (Beckert et al., 2016b; Flammang and Kenaley, 2017; Wang et al., 2017), the phylogenetic relationships within the family Echeneidae remain debated. Based on morphological data, O’Toole (2002) posited that R. brachyptera represents a distinct lineage, while R. osteochir and R. albescens are more closely related. Gray et al. (2009) reported that R. brachyptera and R. remora share a closer evolutionary relationship with each other than with R. osteochir based on the partial mitochondrial genes. This viewpoint is further supported by the phylogenetic tree constructed from ultraconserved element (UCE) loci by Glass et al. (2023). Conversely, Santini and Carnevale (2015) and Kenaley et al. (2019) argued that R. brachyptera and R. osteochir are more closely related than R. remora utilizing partial mitochondrial genes and UCE loci, respectively. However, phylogenetic trees based on single or limited gene sequences often fail to accurately represent the true evolutionary relationships among these species.
Advancements in high-throughput sequencing and bioinformatics have significantly enhanced our ability to explore whole-genome information (Massouras et al., 2010; Liu et al., 2024). Genome survey analysis facilitates the prediction of essential genomic metrics such as genome size, heterozygosity ratio, repeat ratio, and GC content, which are essential for informing optimal sequencing and assembly strategies (Surachat et al., 2022; Song et al., 2022). Additionally, it supports the identification of microsatellites, which play a crucial role in genetic studies and population analysis (Ziya Motalebipour et al., 2016; Xiong et al., 2021). Whole-genome data derived from high-throughput sequencing not only allow for the extraction of mitochondrial genomes and single-copy homologous genes but also facilitate the prediction of historical population dynamics (Van Dam et al., 2021; Ma et al., 2024; Zhao et al., 2024). The increased accessibility and cost-effectiveness of these technologies have rendered them indispensable tools for unraveling the genomic architecture and evolutionary history, offering new insights into species differentiation and population genetics.
In this study, the whole genome data of three Echeneidae species was obtained. Our objectives include assessing the genomic characteristics of these species, identifying microsatellite motifs, reconstructing the phylogenetic relationships using single-copy homologous genes, and analyzing the historical dynamics of their populations. These data will enrich our understanding of Echeneidae genetics and provide novel perspectives on evolutionary biology and taxonomy.
2 Materials and methods
2.1 Samples collection, DNA extraction and whole-genome sequencing
Samples of two species, one individual of E. naucrates and one individual of R. albescens, were collected from the Northern South China Sea. Additionally, one individual of R. remora was obtained from the coastal waters of Zhoushan, Zhejiang Province, China (Figure 1). Following preliminary morphological identification, muscle tissue was extracted from each sample and preserved in 95% absolute ethanol for genomic DNA extraction. All sample handling procedures in this study adhered strictly to the Animal Care Quality Assurance Standards of China and Zhejiang Ocean University (Animal Ethics No. 2024150).
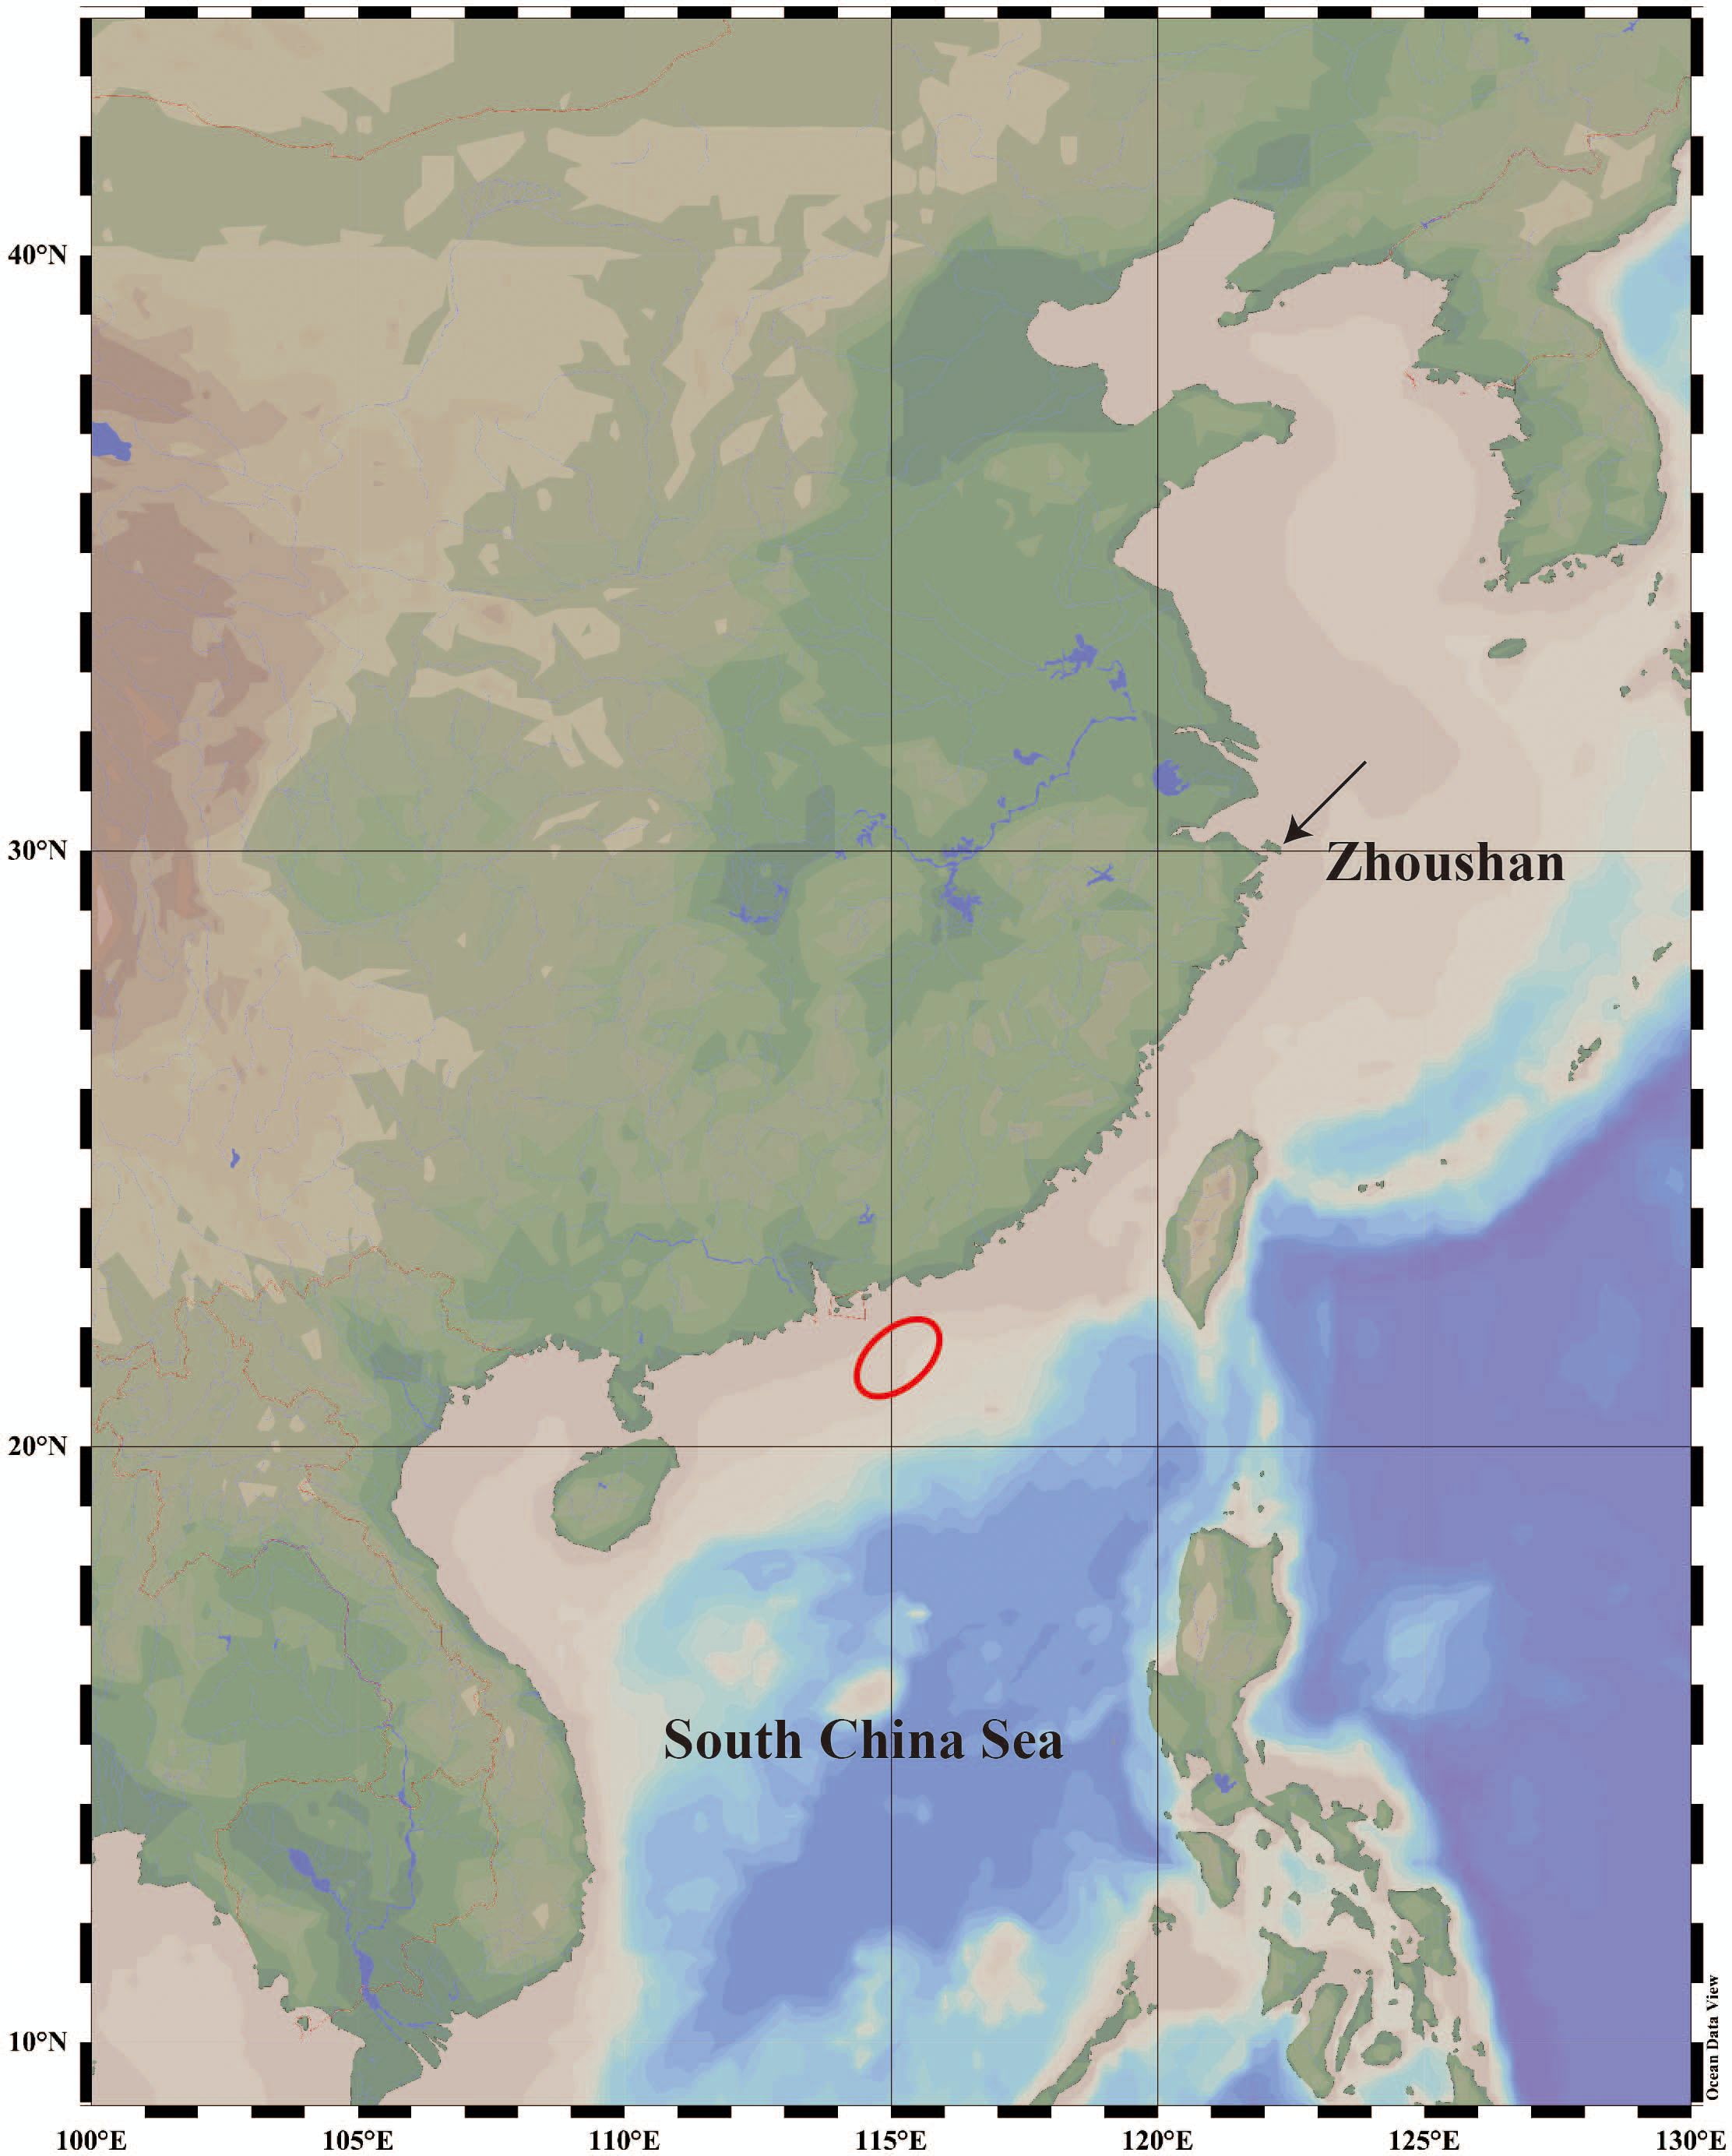
Figure 1. Sampling locations of three Echeneidae species. The red circle represents the sampling location in the Northern South China Sea.
Total genomic DNA extraction was performed using the DNeasy Blood and Tissue Kit (Qiagen, Venlo, The Netherlands) in accordance with the manufacturer’s protocol. The quality and concentration of the extracted DNA were assessed using the NanoDrop 1000 microspectrophotometer and the Qubit fluorometer. Random DNA fragments were generated using an ultrasonic crusher. Library preparation involved end-repair, A-tailing, adaptor ligation, purification, and PCR amplification. The constructed library was subsequently sequenced on the Illumina NovaSeq 6000 platform using PE150 sequencing (OneMore-Tech, Wuhan, China).
2.2 Sequencing data quality control and K-mer analysis
In this study, FASTP v0.23.2 software was initially employed to filter and conduct quality control on the raw sequencing data. Specific operations included trimming low-quality bases with an average quality below Q20 at both ends, removing adapter sequences, filtering out reads containing more than 40% low-quality bases (quality value below Q15) or N content more than 5, and discarding short reads shorter than 50 bp. Additionally, PCR duplicates were removed to ensure high-quality clean data for subsequent analysis. The quality of the sequencing data was evaluated by calculating the Q20 and Q30 values, as well as the GC content. Subsequently, K-mer analysis was performed using GCE v1.0.0 software and genome size was estimated based on the K-mer frequency distribution (Liu et al., 2013). The genome size was calculated using the formula: G (genome size) = K-mer_number (total number of K-mers)/K-mer_depth (expected coverage depth), with the K value set to 17. Finally, we employed GCE v1.0.0 software to assess the heterozygosity and repeat sequence content of the genome.
2.3 Genome assembly, evaluation, and simple sequence repeat motif identification
In this study, the clean reads were individually assembled into distinct contigs and scaffolds utilizing SOAPdenovo2 v2.04 with a K-mer size of 51 and other parameters at the default settings (Luo et al., 2012). The quality of the assembled genome sequences was further assessed with BUSCO v5.8.1 software (Manni et al., 2021), utilizing the actinopterygii_odb10 database as a reference. Additionally, conserved gene sequences within each genome were identified. To detect microsatellite motifs throughout the whole genome, we utilized the Perl script “misa.pl” from the MISA software v2.1. The search parameters were established as follows: mono-, di-, tri-, tetra-, penta-, and hexanucleotide microsatellite motifs must repeat at least 10, 6, 5, 5, 5, and 5 times, respectively. The maximum interruption distance between two different SSRs was set to 100 bp to classify compound microsatellites.
2.4 Mitochondrial genome assembly
The filtered clean reads were assembled into complete mitochondrial genomes using the NOVOplasty v2.6.3 software (Dierckxsens et al., 2016). The assembled mitochondrial genome sequences were annotated and visualized as circular maps using MitoFish (Iwasaki et al., 2013; Zhu et al., 2023).
2.5 Phylogenetic analysis
Annotated amino acid sequences of five species were downloaded from the NCBI database to construct a phylogenetic tree of single-copy homologous genes (Supplementary Table S1). Single-copy homologous genes were extracted with Orthofinder software v2.5.5. The MAFFT v7.505 with the auto parameter and trimAl v1.5 with the automated1 parameter to align and trim the filtered sequences. The results of the multiple sequence alignment were analyzed by ModelTest-NG software v0.1.7 to select the optimal evolutionary model (JTT+I+G4+F) (Darriba et al., 2020). A maximum likelihood (ML) phylogenetic tree was then constructed using RAxML-NG software v1.2.2 (Kozlov et al., 2019), calculating bootstrap values based on 1000 replicates, with Caranx melampygus serving as the outgroup. Bayesian inference (BI) was used MrBayes v. 3.2.7a, the parameters set as “mcmc ngen=1000000, printfreq=1000, nruns=2, diagnfreq=5000, samplefreq=100, nchains=4, temp=0.1, burninfrac=0.25”. Finally, the phylogenetic tree was visualized using the online tool iTOL v6.9 (https://itol.embl.de/).
2.6 Historical population dynamics analysis
The PSMC method was applied to estimate the historical population dynamics of three fish species from the Echeneidae family. The BWA-MEM algorithm was employed to align clean reads with the assembled genome. Samtools v0.1.19 was applied to process the mapped BAM file using the parameter of “-bF 12”. The fq2psmcfa tool within the PSMC software was utilized to generate the input file (psmcfa) required for PSMC modeling. The PSMC analysis was conducted with default parameters (-N25-t15-r5-p “4 + 25× 2 + 4 + 6”) to infer variations in effective population size (Ne). The final results were visualized using the “psmc_plot.pl” script, with a substitution rate set at “-u 0.6 e-8” and a generation time of 2 years.
3 Results
3.1 Whole-genome sequencing and K-mer analysis
The clean data obtained from the R. remora, R. albescens, and E. naucrates samples were 72.39 Gb, 66.15 Gb, and 77.76 Gb, respectively (Table 1). The Q20 and Q30 values for all samples exceeded 96% and 91%, respectively, demonstrating the reliability of the sequencing data (Table 1). K-mer analysis revealed K-mer depths of 92, 97, and 116 for the three species. Additionally, the genome size, heterozygosity ratio, and proportion of repeat sequences were evaluated through K-mer analysis, as summarized in Table 2. Among the three Echeneidae species, R. remora exhibited the largest genome size (677.93 Mb), whereas E. naucrates had the smallest genome size (572.04 Mb). The heterozygosity rates were 0.62% for R. remora, 0.65% for R. albescens, and 0.43% for E. naucrates. Repeat rates for R. remora, R. albescens, and E. naucrates were 39.53%, 27.98%, and 30.14%, respectively.
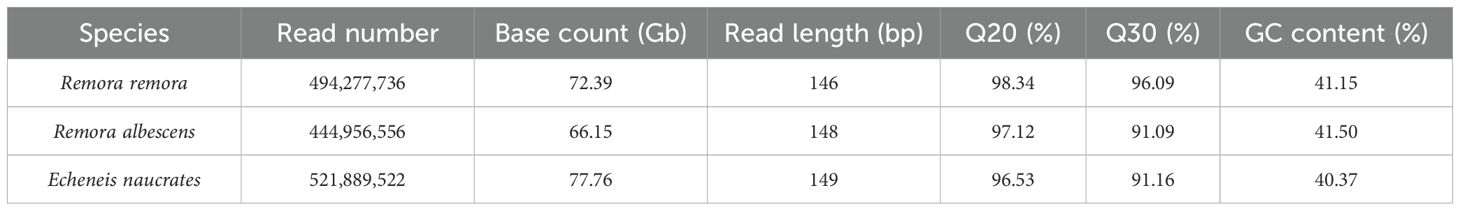
Table 1. The statistical information of sequencing data of three Echeneidae species.
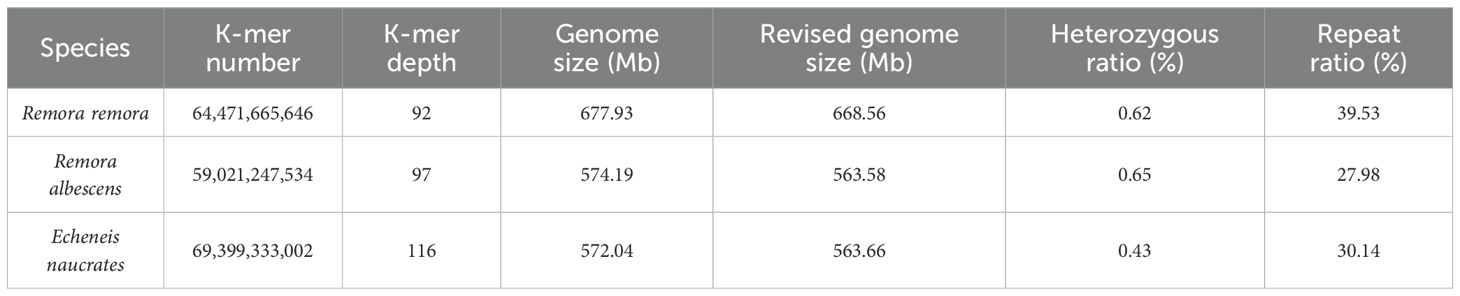
Table 2. Genomic characteristics statistics based on 17-mer analysis of three Echeneidae species.
3.2 Genomic assembly and estimation
A draft genome was assembled using the SOAPdenovo2 software v2.04. The draft genome information of the three species was presented in Table 3. R. albescens exhibited the greatest total length and number of sequences, however, it had the smallest N50 and N90 lengths. The GC content for R. remora, R. albescens, and E. naucrates was 41.15%, 41.50%, and 40.37%, respectively (Table 1). BUSCO analysis revealed that the complete BUSCOs for R. albescens were only 60.9%, indicating lower assembly quality (Supplementary Table S2). In contrast, the complete BUSCOs for R. remora and E. naucrates were 83.5% and 84.6%, respectively, demonstrating superior assembly performance for these two species. Furthermore, the missing BUSCOs for R. remora and E. naucrates were only 6.7% and 5.8%, respectively (Supplementary Table S2).
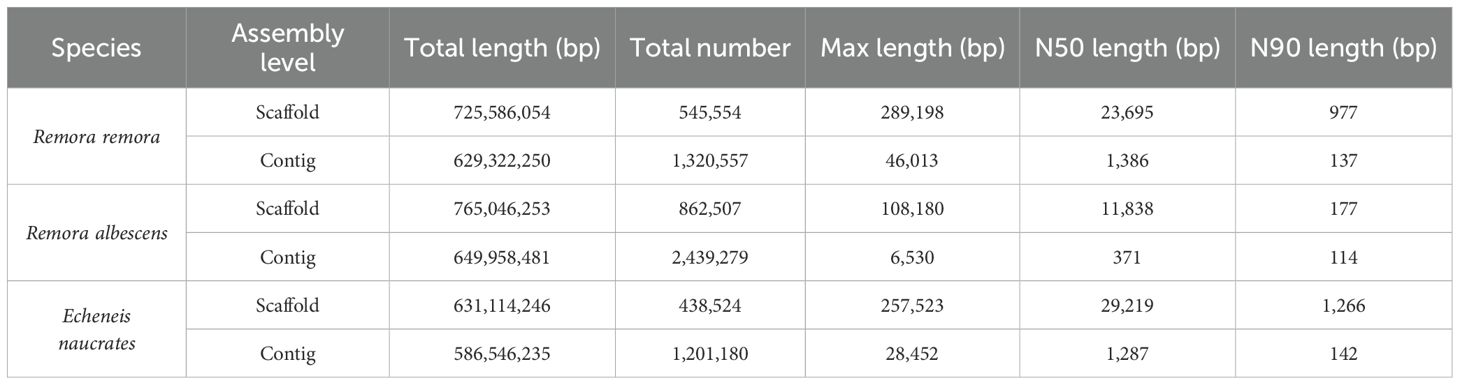
Table 3. The genome assembly result of three Echeneidae species.
3.3 Identification and statistics of SSR molecular markers
The prediction results for SSRs motifs in three species were shown in Table 4. The total number of identified SSRs in the genomes of R. remora, R. albescens, and E. naucrates was 527,027, 440,593, and 458,014, respectively. Additionally, the number of SSR-containing sequences identified in these species was 126,810, 152,310, and 108,926. In terms of microsatellite motif types, mononucleotide repeats constitute the largest proportion (54.40%-58.25%), followed by dinucleotide repeats (31.02%-35.14%), trinucleotide repeats (6.73%-7.14%), tetranucleotide repeats (2.85%-3.81%), pentanucleotide repeats (0.29%-0.34%), and hexanucleotide repeats (0.13%-0.19%) (Figure 2A). The distribution patterns of microsatellite repeats among the three species exhibited notable similarities, characterized by a decreasing proportion of microsatellites observed as the number of repeat units increased (Figure 2B). Among the specific motif types, A/T, AC/GT, and AAT/ATT were the most prevalent in mononucleotide, dinucleotide, and trinucleotide repeats, respectively, across all three species (Figure 2C).
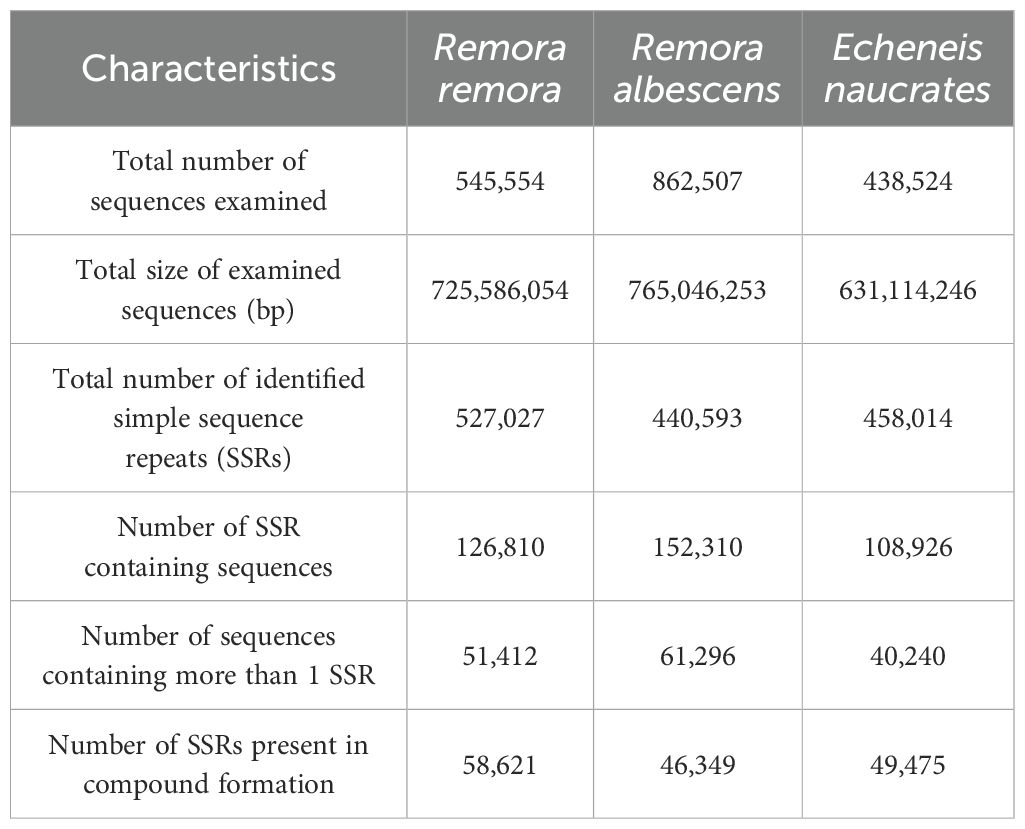
Table 4. Microsatellite motifs of three Echeneidae species.

Figure 2. Distribution and abundance of different SSR motifs. (A) Proportion of various repeat types of three Echeneidae species. (B) The distribution and frequency of microsatellite motifs of three Echeneidae species. (C) Frequency of mononucleotide, dinucleotide, and trinucleotide repeats for three Echeneidae species.
3.4 Mitochondrial genome assembly and phylogenetic analysis
The complete mitochondrial genomes of R. remora, R. albescens, and E. naucrates were characterized as closed circular molecules, with lengths of 16,623 bp, 16,648 bp, and 16,611 bp, respectively (Figure 3). Each mitochondrial genome of three species comprised 13 protein-coding genes (PCGs), 22 tRNA genes, two rRNA genes, and a control region. Notably, the ND6 PCG and eight tRNA genes (tRNA-Gln, tRNA-Ala, tRNA-Asn, tRNA-Cys, tRNA-Tyr, tRNA-Ser, tRNA-Glu, tRNA-Pro) were located on the light strand (L-strand), while the remaining 28 genes were situated on the heavy strand (H-strand).
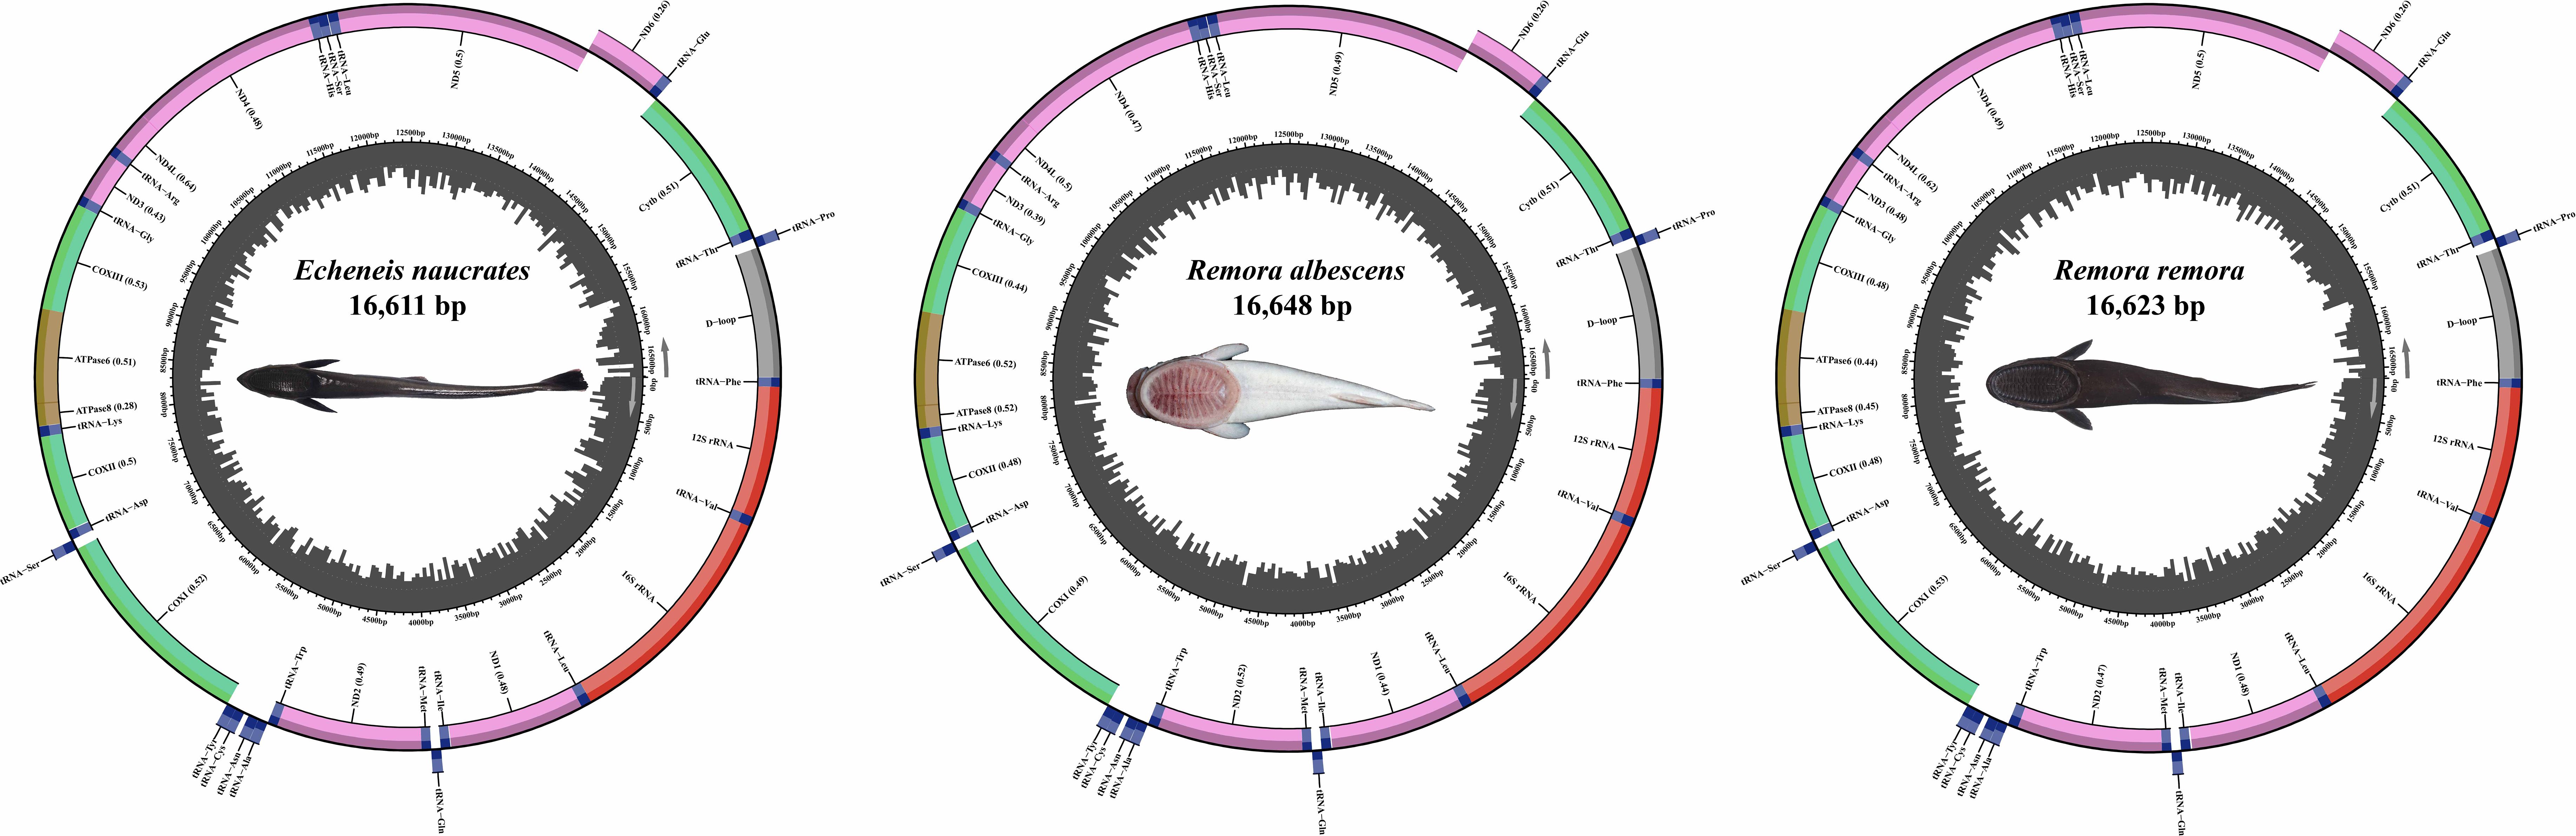
Figure 3. The structure of mitochondrial genomes of three Echeneidae species.
Additionally, we utilized Caranx melampygus as an outgroup and constructed a phylogenetic tree based on 438 shared single-copy homologous genes across the genomes of various species to investigate the evolutionary relationships among three species within the Echeneidae family. The phylogenetic trees constructed using the ML and BI methods exhibited a consistent topological structure. The analysis demonstrated that the three Echeneidae species formed a distinct cluster, while species from the Carangidae family were grouped separately (Figure 4). Notably, R. remora and R. albescens clustered within the genus Remora, while E. naucrates belonging to the genus Echeneis formed a separate lineage (Figure 4).
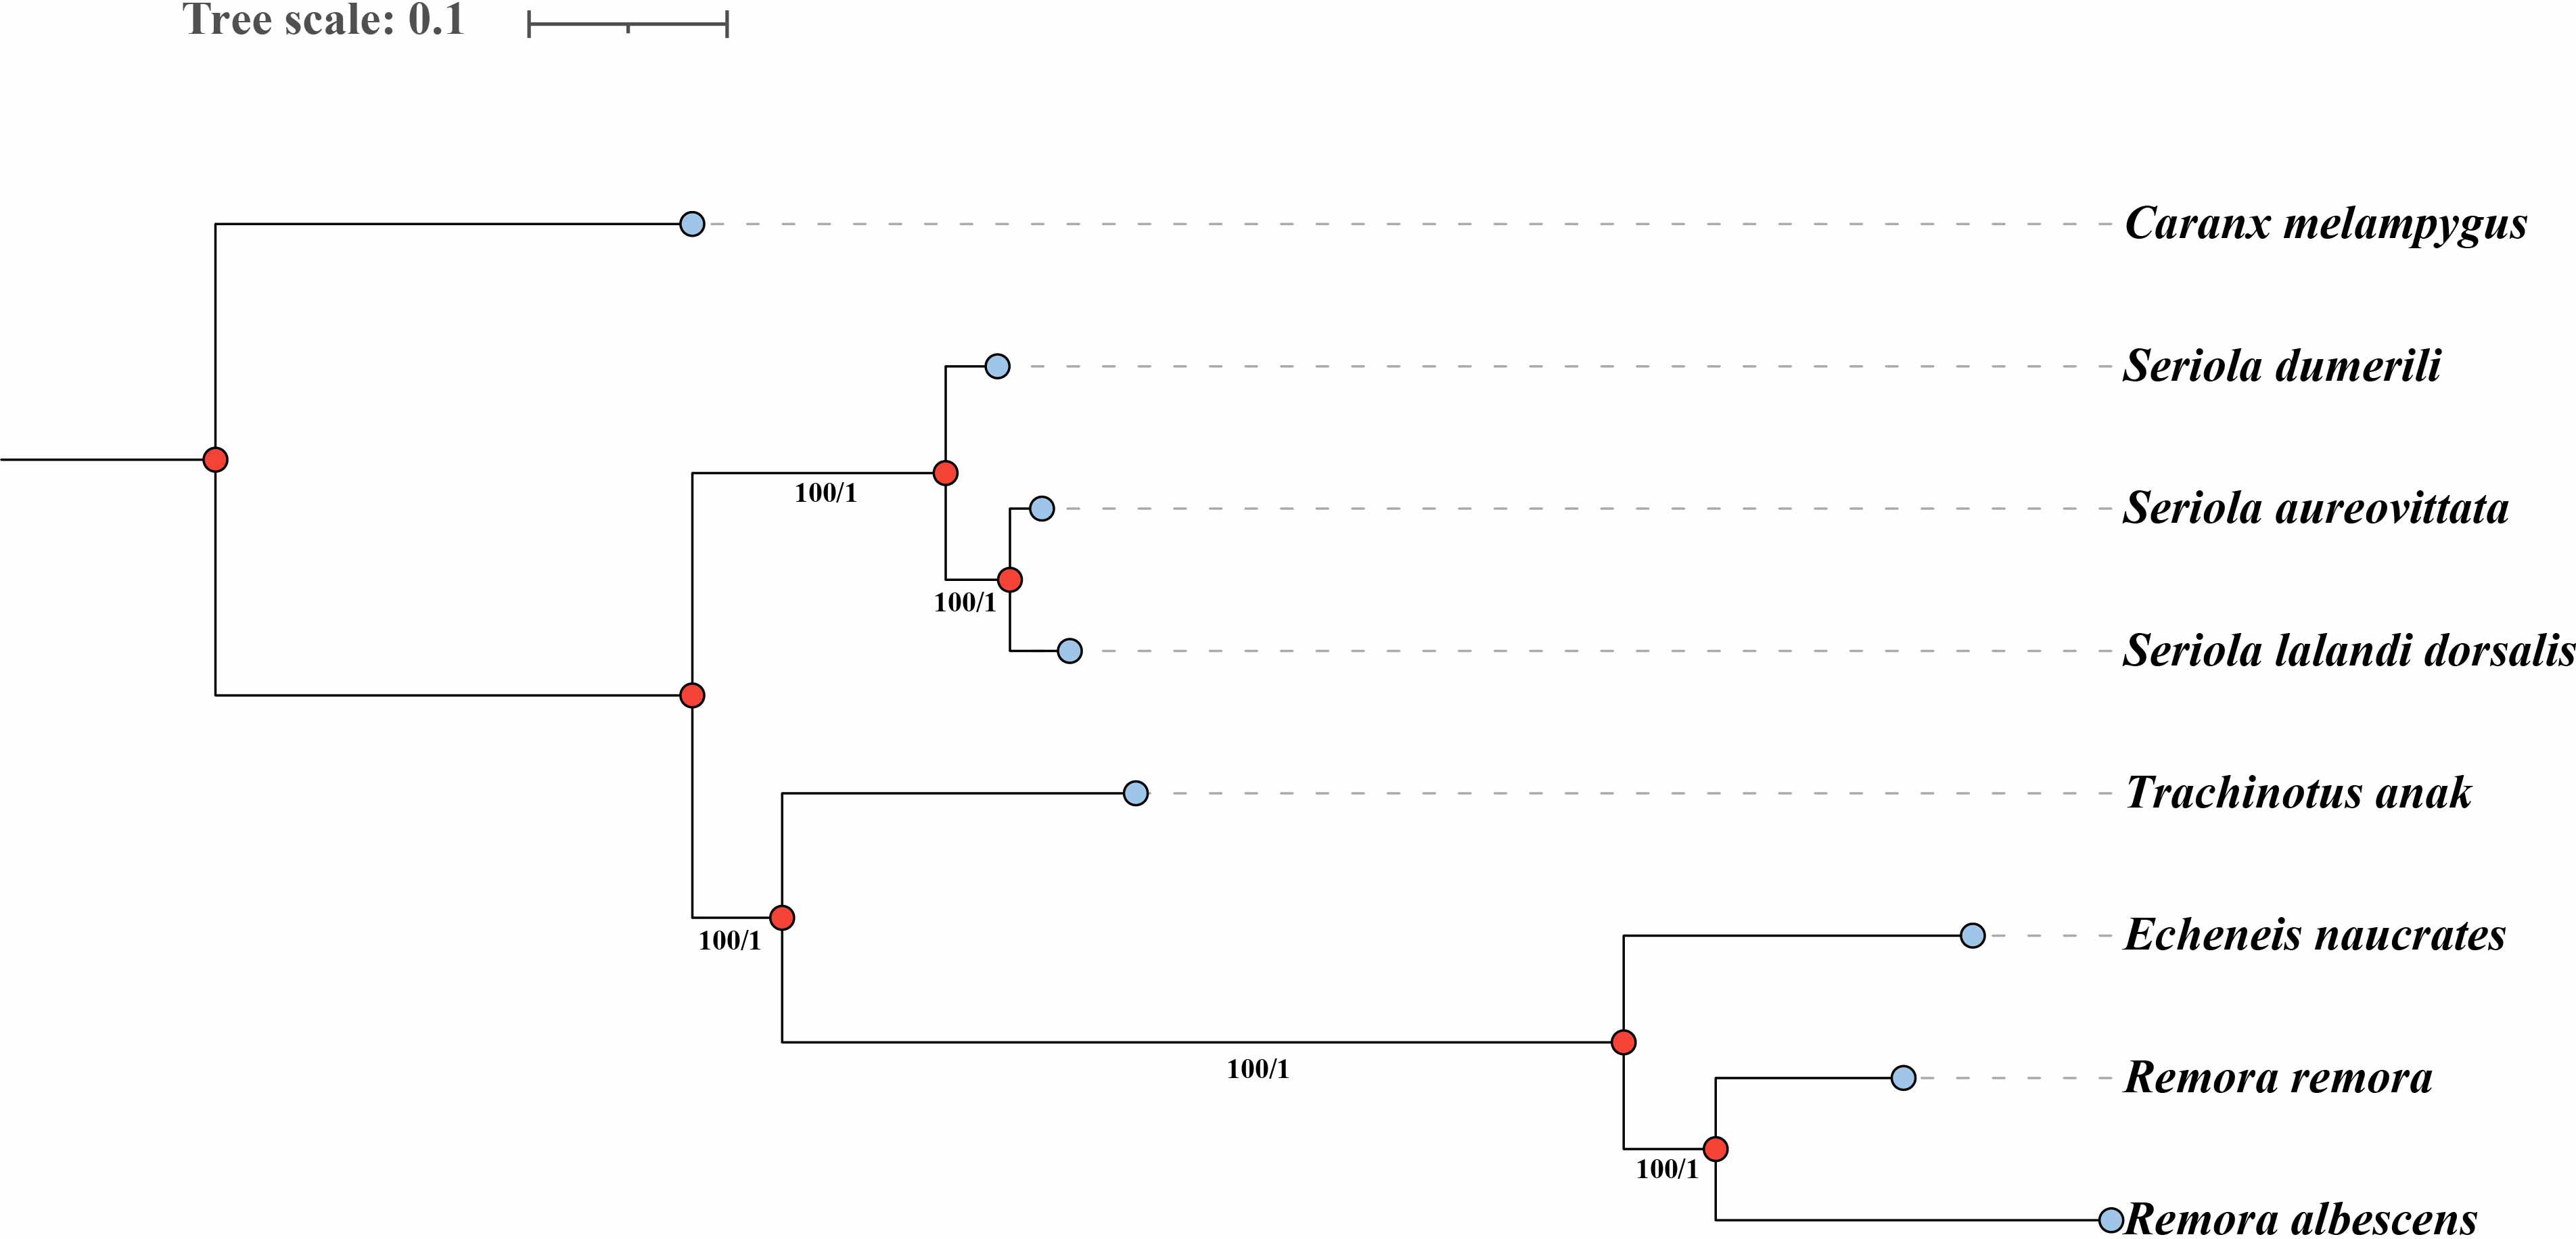
Figure 4. Phylogenetic trees based on single-copy homologous genes of three Echeneidae species using the maximum likelihood (ML) and Bayesian inference (BI) methods. The numbers at the nodes are the bootstrap support values (left) and Bayesian posterior probabilities (right). The blue dots represent external nodes, while the red dots represent internal nodes in the phylogenetic tree.
3.5 Historical population dynamics
We utilized the PSMC model to conduct a population history analysis of three species within the Echeneidae family (Figure 5). The results showed the effective population sizes of three species began to display similar patterns of rapid expansion before the Last Interglacial Period. During the Last Glacial Period, the effective population sizes for all three species reached their respective peaks and then began to decline. Notably, R. albescens exhibited a significant peak in effective population size during the Last Glacial Period, followed by another pronounced peak during the Last Glacial Maximum. Additionally, following these expansion events, the effective population sizes of E. naucrates and R. albescens were significantly greater than that of R. remora.
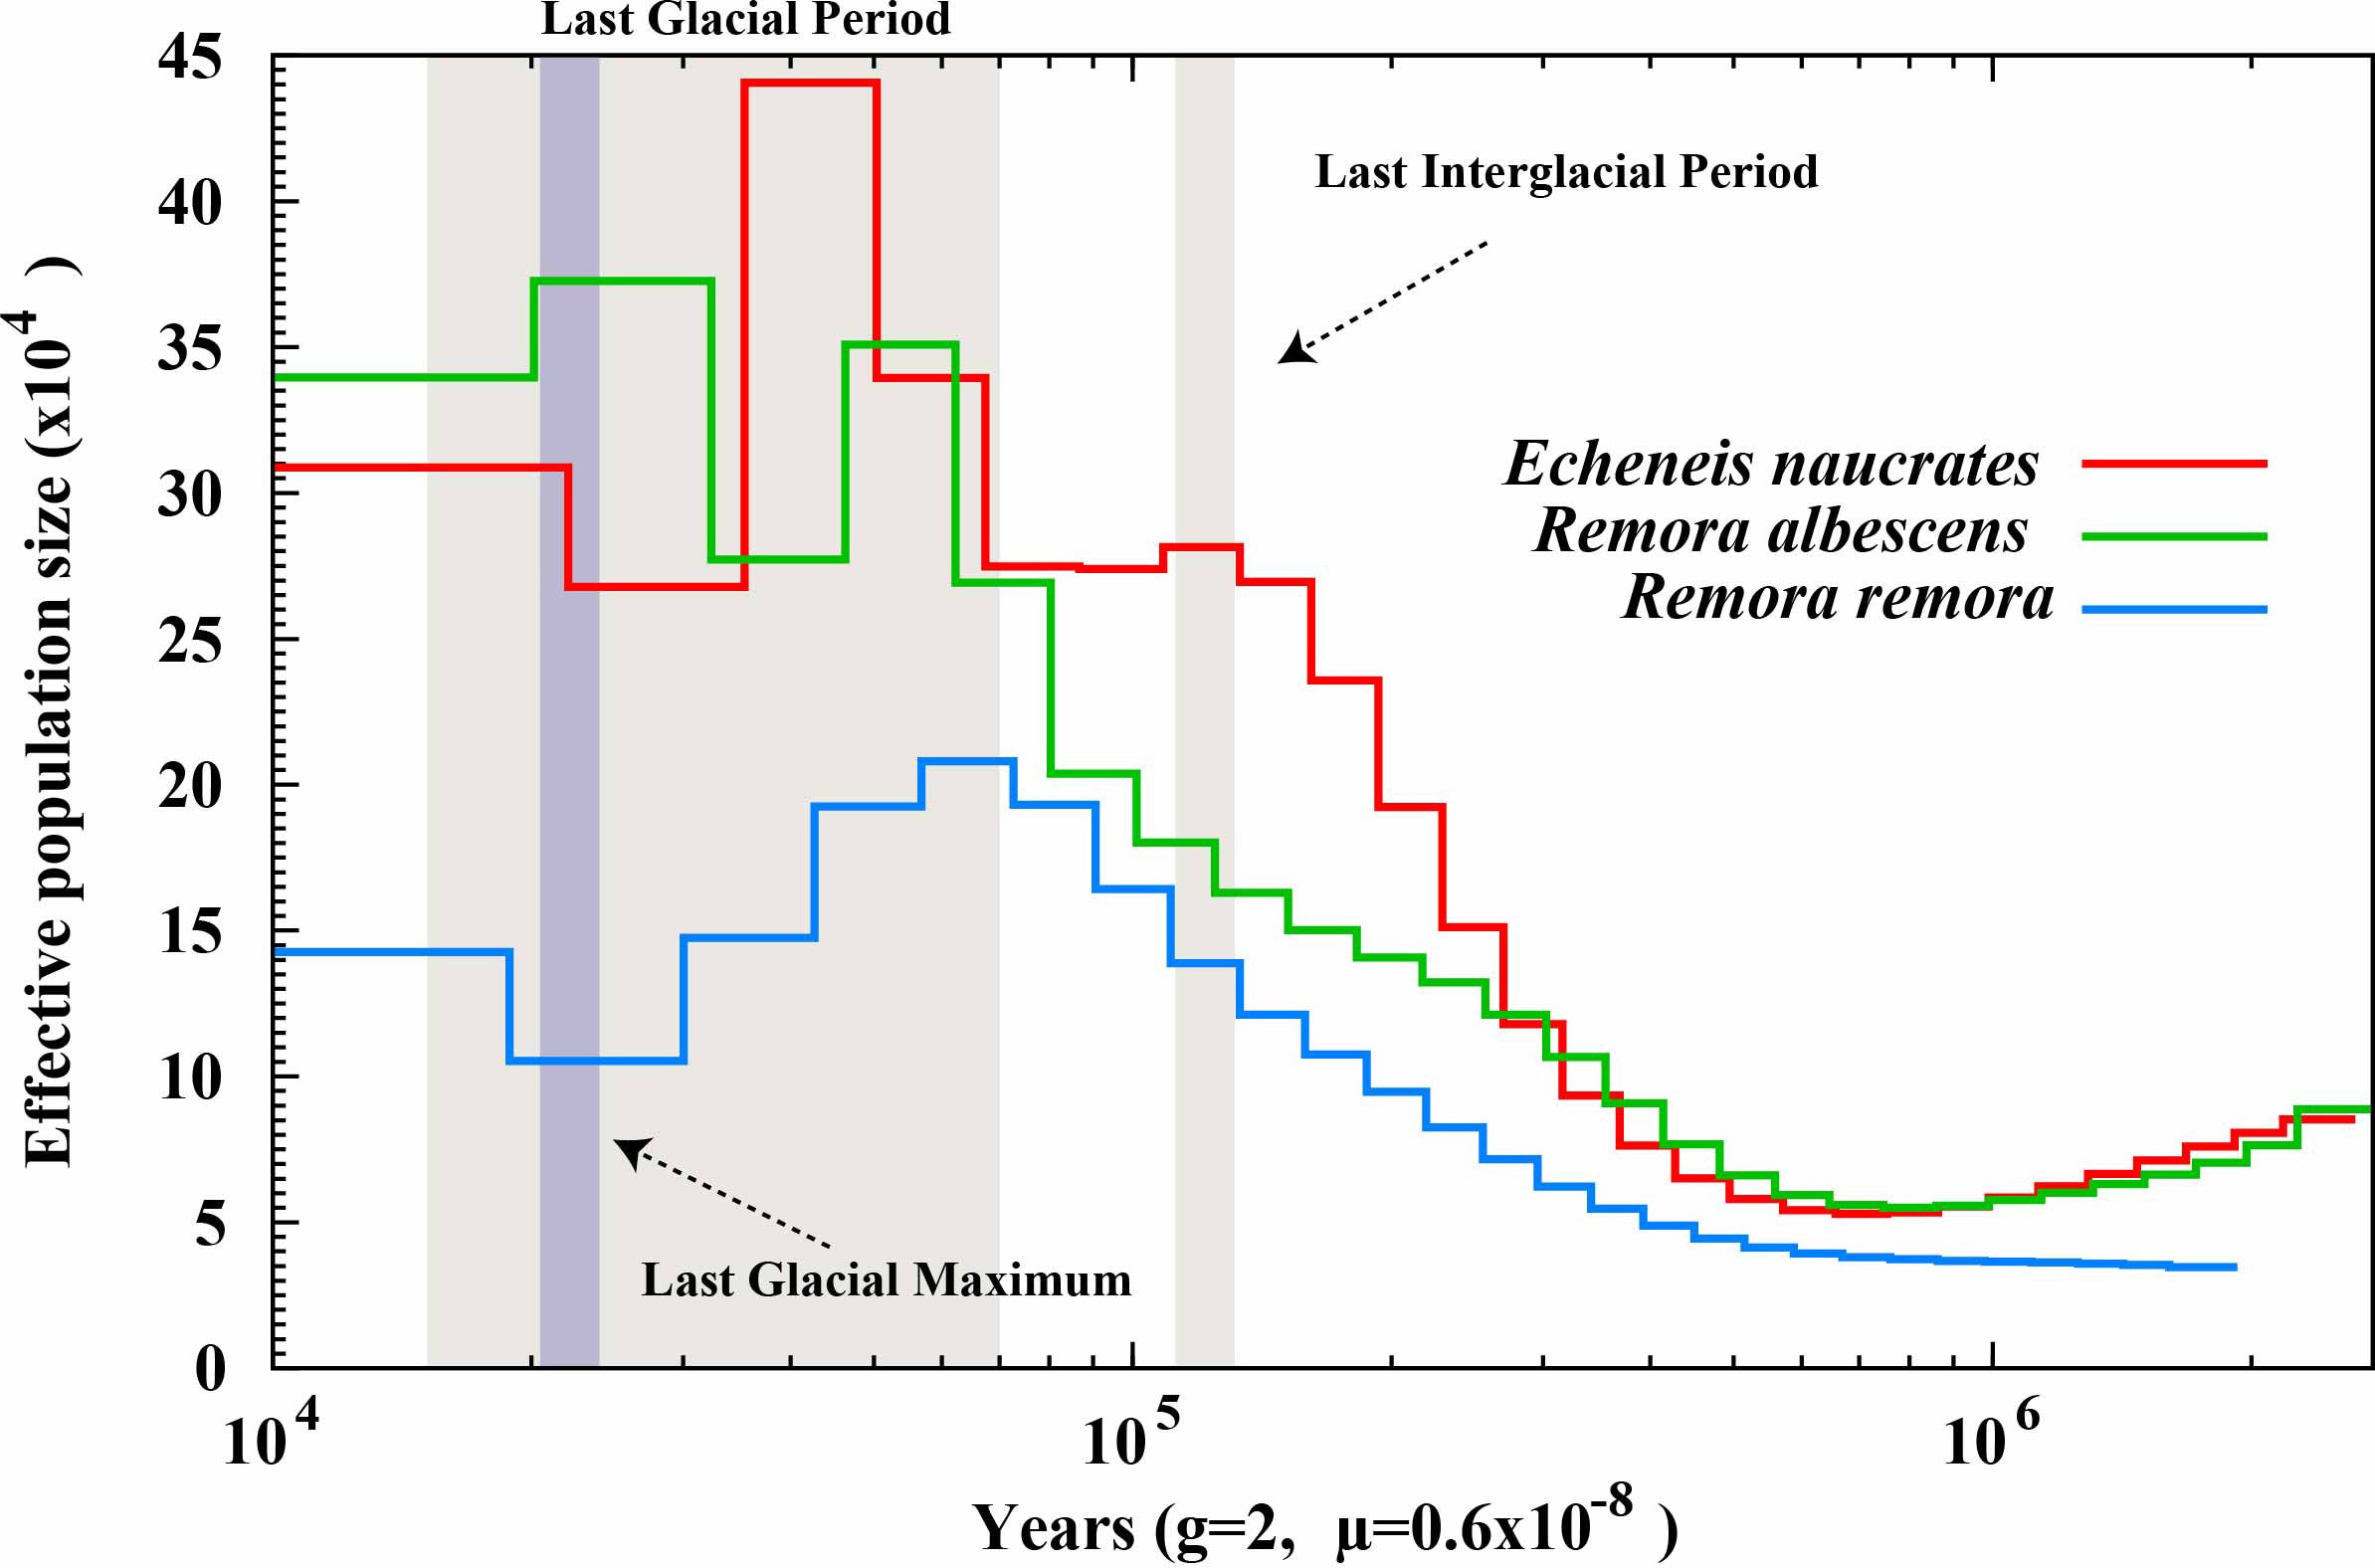
Figure 5. Estimates of effective population size for three Echeneidae species. The 'g' denotes the generation time of the species in years, while 'μ' indicates the mutation rate of the species. .
4 Discussion
The rapid advancement of high-throughput sequencing technologies and sequence assembly algorithms has significantly enhanced the efficiency and cost-effectiveness of obtaining whole genomes (Gaither et al., 2018; Kon et al., 2021). This substantial growth in genome sequences has been a major driving force behind progress in the life sciences (Satam et al., 2023). Given the considerable differences in genome size and complexity among various species, whole-genome shotgun sequencing serves as a crucial and economical method for acquiring complete genomes across diverse species (Xu et al., 2019; Jo et al., 2021). Currently, genomic resources for Echeneidae fishes are limited, with published genomes only for E. naucrates and R. albescens (Gao et al., 2024; Zhou et al., 2024a). This study employed next-generation sequencing (NGS) technology to analyze the whole genomes of three Echeneidae species, with the genome of R. remora being reported for the first time.
The high Q20 (>96%) and Q30 (>91%) values across all samples indicated that the sequencing data are of high quality and reliable for subsequent analyses. Genome sizes for the three Echeneidae species were estimated using K-mer analysis, yielding 677.93 Mb for R. remora, 574.19 Mb for R. albescens, and 572.04 Mb for E. naucrates. The estimated genome sizes of species within the Carangiformes order, as reported in recent literature, range from 544.2 Mb in the E. naucrates to 716.4 Mb in Seriola lalandi dorsalis (Zhang et al., 2019). These findings align with the observed pattern that most fish genomes are typically under 1 Gb (Zhou et al., 2024b), highlighting a relatively compact genomic structure across these species. The difference of genome size between R. remora and R. albescens may be attributed to the higher repeat rate observed in R. remora, which contributes to its larger genome size. Additionally, R. albescens exhibits a lower N50 length, potentially resulting from inadequate sample preservation that led to gene degradation and consequently affected its genome size. Notably, the genome of E. naucrates was characterized by a low heterozygosity ratio (0.43%) and a repeat sequence ratio (30.14%), suggesting a simpler genomic structure. In contrast, R. remora and R. albescens exhibited relatively high heterozygosity rates (0.5%~0.7%), which belonged to the microheterozygous genome (Simpson, 2014). Remora albescens displayed the highest number of contigs and the shortest N50 length, which led to a lower percentage of complete BUSCOs (60.9%). This relatively low completeness is likely attributed to higher heterozygosity ratio of R. albescens, enhancing the difficult for genome assembly. The de novo assembly approach adopted in this study, which was conducted without a reference genome. The absence of a reference genome may complicate the assembly of highly repetitive or low-coverage regions, ultimately resulting in incomplete assemblies. To enhance the completeness and accuracy of future assemblies, we recommend utilizing reference genomes from well-characterized species for reference-guided assembly. Furthermore, the GC content of the three species was mid-GC content and in the normal range (Zhou et al., 2013; Song et al., 2022), ranging from 40.37% to 41.50%. Overall, the relatively straightforward genomic architecture of Echeneidae fishes makes them well-suited for further whole-genome sequencing efforts.
Microsatellite markers have been extensively utilized in various research fields such as population genetics, genetic linkage map construction, and kinship identification (Cheng et al., 2015; Lei et al., 2021). Compared to the traditional methods, the development of microsatellite markers using high-throughput sequencing data presents several advantages such as lower costs, higher efficiency, and greater output (Zane et al., 2002; Ma et al., 2024). In this study, mononucleotide repeats were identified as the most abundant SSR motifs in the three species, similar to the findings reported in five Goby species (Ma et al., 2024). Remora remora exhibited the highest number of identified SSRs, likely attributable to its higher proportion of genomic repeat sequences. Additionally, the number of microsatellites in all three species decreased gradually with the increase in repeat number. Similar findings were found Dysomma anguillare (Yang et al., 2024) and Siganus oramin (Huang et al., 2024). This trend may be related to the reduced stability of longer microsatellite loci or the higher mutation rates associated with repeated base units (Harr and Schlötterer, 2000; Zhao et al., 2022). Furthermore, motifs containing A or T were more prevalent than those containing C or G, which was consistent with the whole-genome SSR study of Scatophagus argus and Tridentiger bifasciatus (Huang et al., 2019; Zhao et al., 2022). Collectively, these findings provide essential information for the development of microsatellites in Echeneidae species and offer strong support for subsequent population genetic breeding research.
In this study, we found the mitochondrial genome lengths of R. remora, R. albescens, and E. naucrates to be 16,623 bp, 16,648 bp, and 16,611 bp, respectively. These lengths are generally consistent with previously reported data (NC_022508.1, OP057074.2). The mitochondrial genomes of three species exhibited similar structure, which comprise 13 PCGs, 22 tRNA genes, two rRNA genes, and one control region. These genomic structural features align with the mitochondrial genome structure observed in most bony fishes (Liao et al., 2024; Qin et al., 2024). Notably, the ND6 PCG and eight tRNA genes are situated on the L-strand, while the remaining 28 genes are located on the H-strand. This gene distribution pattern is common among fish (Colín et al., 2023; Liao et al., 2024) and contributes to the stability and functionality of the mitochondrial genome. The detailed analysis of the mitochondrial genomes of R. remora, R. albescens, and E. naucrates had been previously published (Wang et al., 2025). In the phylogenetic analysis, the species of the family Echeneidae clustered together, while the species of the family Carangidae formed a separate branch. The species R. remora and R. albescens grouped within the genus Remora, whereas E. naucrates, belonging to the genus Echeneis, formed another distinct lineage. This clustering is consistent with our previous reports based on phylogenetic trees constructed using the 13 PCGs of the mitochondrial genome (Wang et al., 2025). Due to the limited genomic data available for species within the family Echeneidae, additional samples of these species are necessary to enhance the genome database and elucidate their evolutionary relationships.
Historical population dynamics offer valuable insights into how external factors, such as climate change, influence species distribution (Karamanlidis et al., 2021). Results of PSMC analysis indicate that, before the Last Interglacial Period, the effective population sizes of three species within the Echeneidae family experienced significant expansion. This expansion may be attributed to climate warming, improved marine ecosystems, and expanded available habitats, which collectively facilitated rapid species growth during this period (Obreht et al., 2022). However, by the Last Glacial Period, the effective population sizes of these three species had peaked and subsequently entered a bottleneck phase. This suggests that the severe climatic conditions of the abrupt decline in temperature and fluctuations in sea level in the Last Glacial Period may have intensified the population bottleneck effect (Hu et al., 2010; Hoareau et al., 2012). The PSMC analysis is a method that relies on whole genome sequence information, while missing data exceeding 25% in sequencing can adversely impact the analysis results (Nadachowska-Brzyska et al., 2016). Interestingly, R. albescens demonstrated a population peak during the Last Glacial Period, followed by another peak during the Last Glacial Maximum, possibly linked to its lower BUSCO completeness. Additionally, we speculate that this species may possess strong ecological adaptability and migratory capabilities. In contrast, the population sizes of E. naucrates and R. remora displayed only modest growth during the Last Glacial Maximum, which may be linked to differences in their habitat ranges (Hollowed et al., 2013), reproductive strategies (Servili et al., 2020), and adaptability to climate change (Hodapp et al., 2023). Genetic diversity plays a crucial role in influencing the abundance and distribution of species (Liggins et al., 2021). The population size of R. remora was significantly lower than that of E. naucrates and R. albescens following an expansion event, suggesting a potential decrease in genetic diversity. Additionally, this decrease in effective population size of R. remora may be attributed to a decrease in population structure rather than a true population contraction (Mather et al., 2019). Future research will require a larger sample size and more precise predictive methods to validate this.
5 Conclusion
This study employed high-throughput sequencing technology to conduct a comprehensive preliminary investigation and in-depth analysis of the genomic characteristics, types and number of SSRs, mitochondrial genomes, species evolutionary relationships, and historical population dynamics of three species from the Echeneidae family. The genomes of three species ranged from 572 to 678 Mb and exhibited similar SSRs distribution patterns. Phylogenetic analysis based on single-copy homologous genes indicated that R. remora and R. albescens cluster together to form the genus Remora, while E. naucrates forms a separate branch, belonging to the genus Echeneis. Furthermore, PSMC analysis revealed that the three Echeneidae species experienced rapid population expansion before the Last Interglacial Period, followed by a decline after peaking during the Last Glacial Period. The findings of this study not only enhance our understanding of the genomics and evolutionary biology of Echeneidae species but also hold significant theoretical and practical implications for biodiversity conservation and fisheries resource management.
Data availability statement
The raw data have been deposited in the China National Center for Bioinformation/Beijing Institute of Genomics, Chinese Academy of Sciences (https://ngdc.cncb.ac.cn/gsa), with accession number CRA023300.
Ethics statement
The animal study was approved by the Animal Care Quality Assurance Standards of Zhejiang Ocean University. The study was conducted in accordance with the local legislation and institutional requirements.
Author contributions
FW: Conceptualization, Data curation, Formal analysis, Methodology, Software, Visualization, Writing – original draft. QL: Formal analysis, Software, Writing – review & editing. YQ: Software, Writing – review & editing. TG: Conceptualization, Funding acquisition, Investigation, Methodology, Supervision, Writing – review & editing. XG: Investigation, Visualization, Writing – review & editing. XZ: Funding acquisition, Project administration, Resources, Supervision, Writing – review & editing.
Funding
The author(s) declare that financial support was received for the research and/or publication of this article. This research was funded by the National Key Research and Development Program of China (2023YFD2401903) and the National Natural Science Foundation of China (41776171).
Conflict of interest
Author QL was employed by the company Wuhan Onemore-Tech Co., Ltd.
The remaining authors declare that the research was conducted in the absence of any commercial or financial relationships that could be construed as a potential conflict of interest.
Generative AI statement
The author(s) declare that no Generative AI was used in the creation of this manuscript.
Publisher’s note
All claims expressed in this article are solely those of the authors and do not necessarily represent those of their affiliated organizations, or those of the publisher, the editors and the reviewers. Any product that may be evaluated in this article, or claim that may be made by its manufacturer, is not guaranteed or endorsed by the publisher.
Supplementary material
The Supplementary Material for this article can be found online at: https://www.frontiersin.org/articles/10.3389/fmars.2025.1586527/full#supplementary-material
References
Beckert M., Flammang B. E., Anderson E. J., and Nadler J. H. (2016a). Theoretical and computational fluid dynamics of an attached remora (Echeneis naucrates). Zoology 119, 430–438. doi: 10.1016/j.zool.2016.06.004
Beckert M., Flammang B. E., and Nadler J. H. (2016b). A model of interfacial permeability for soft seals in marine-organism, suction-based adhesion. MRS Adv. 1, 2531–2543. doi: 10.1557/adv.2016.445
Cheng J., Yanagimoto T., Song N., and Gao T. (2015). Population genetic structure of chub mackerel Scomber japonicus in the Northwestern Pacific inferred from microsatellite analysis. Mol. Biol. Rep. 42, 373–382. doi: 10.1007/s11033-014-3777-2
Colín A., Del Río-Portilla M. A., Lafarga-De La Cruz F., Ingle-De La Mora G., and García-De León F. J. (2023). Assembly, characterization, and phylogenetic relationships of mitogenomes of two species of Mexican trout (Oncorhynchus chrysogaster and O. mykiss nelsoni). Fishes 8, 178. doi: 10.3390/fishes8040178
Darriba D., Posada D., Kozlov A. M., Stamatakis A., Morel B., and Flouri T. (2020). ModelTest-NG: A new and scalable tool for the selection of DNA and protein evolutionary models. Mol. Biol. Evol. 37, 291–294. doi: 10.1093/molbev/msz189
Dierckxsens N., Mardulyn P., and Smits G. (2016). NOVOPlasty: de novo assembly of organelle genomes from whole genome data. Nucleic Acids Res. 45, e18. 10.1093/nar/gkw955
Flammang B. E. and Kenaley C. P. (2017). Remora cranial vein morphology and its functional implications for attachment. Sci. Rep. 7, 5914. doi: 10.1038/s41598-017-06429-z
Gaither M. R., Gkafas G. A., De Jong M., Sarigol F., Neat F., Regnier T., et al. (2018). Genomics of habitat choice and adaptive evolution in a deep-sea fish. Nat. Ecol. Evol. 2, 680–687. doi: 10.1038/s41559-018-0482-x
Gao T., Liu K., Liu Q., and Wang D. (2024). An improved chromosome-level genome assembly and annotation of Echeneis naucrates. Sci. Data. 11, 452. doi: 10.1038/s41597-024-03309-w
Glass J. R., Harrington R. C., Cowman P. F., Faircloth B. C., and Near T. J. (2023). Widespread sympatry in a species-rich clade of marine fishes (Carangoidei). Proc. R. Soc B. 290, 0230657. doi: 10.1098/rspb.2023.0657
Gray K. N., McDowell J. R., Collette B. B., and Graves J. E. (2009). A molecular phylogeny of the Remoras and their relatives. Bull. Mar. Sci. 84, 183–198.
Harr B. and Schlötterer C. (2000). Long microsatellite alleles in Drosophila melanogaster have a downward mutation bias and short persistence times, which cause their genome-wide underrepresentation. Genetics 155, 1213–1220. doi: 10.1093/genetics/155.3.1213
Hoareau T. B., Boissin E., and Berrebi P. (2012). Evolutionary history of a widespread Indo-Pacific goby: The role of Pleistocene sea-level changes on demographic contraction/expansion dynamics. Mol. Phylogenet. Evol. 62, 566–572. doi: 10.1016/j.ympev.2011.10.004
Hodapp D., Roca I. T., Fiorentino D., Garilao C., Kaschner K., Kesner-Reyes K., et al. (2023). Climate change disrupts core habitats of marine species. Global Change Biol. 29, 3304–3317. doi: 10.1111/gcb.v29.12
Hollowed A. B., Barange M., Beamish R. J., Brander K., Cochrane K., Drinkwater K., et al. (2013). Projected impacts of climate change on marine fish and fisheries. ICES J. Mar. Sci. 70, 1023–1037. doi: 10.1093/icesjms/fst081
Hu A., Meehl G. A., Otto-Bliesner B. L., Waelbroeck C., Han W., Loutre M., et al. (2010). Influence of Bering Strait flow and North Atlantic circulation on glacial sea-level changes. Nat. Geosci. 3, 118–121. doi: 10.1038/ngeo729
Huang Y., Jiang D., Li M., Mustapha U. F., Tian C., Chen H., et al. (2019). Genome survey of male and female spotted scat (Scatophagus argus). Animals 9, 1117. doi: 10.3390/ani9121117
Huang X., Li T., Yang Y., Guo Z., Jiang J., Lin H., et al. (2024). Genome survey of Siganus oramin: Identification and development of genome-wide microsatellite markers. Aquacult. Rep. 39, 102520. doi: 10.1016/j.aqrep.2024.102520
Iwasaki W., Fukunaga T., Isagozawa R., Yamada K., Maeda Y., Satoh T. P., et al. (2013). MitoFish and MitoAnnotator: A mitochondrial genome database of fish with an accurate and automatic annotation pipeline. Mol. Biol. Evol. 30, 2531–2540. doi: 10.1093/molbev/mst141
Jo E., Cho Y. H., Lee S. J., Choi E., Kim J., Kim J.-H., et al. (2021). Genome survey and microsatellite motif identification of Pogonophryne albipinna. Biosci. Rep. 41, BSR20210824. doi: 10.1042/BSR20210824
Karamanlidis A. A., Skrbinšek T., Amato G., Dendrinos P., Gaughran S., Kasapidis P., et al. (2021). Genetic and demographic history define a conservation strategy for earth’s most endangered pinniped, the Mediterranean monk seal Monachus monachus. Sci. Rep. 11, 373. doi: 10.1038/s41598-020-79712-1
Kenaley C. P., Stote A., Ludt W. B., and Chakrabarty P. (2019). Comparative functional and phylogenomic analyses of host association in the remoras (Echeneidae), a family of hitchhiking fishes. Integr. Org. Biol. 1, obz007. doi: 10.1093/iob/obz007
Kon T., Pei L., Ichikawa R., Chen C., Wang P., Takemura I., et al. (2021). Whole-genome resequencing of large yellow croaker (Larimichthys crocea) reveals the population structure and signatures of environmental adaptation. Sci. Rep. 11, 11235. doi: 10.1038/s41598-021-90645-1
Kozlov A. M., Darriba D., Flouri T., Morel B., and Stamatakis A. (2019). RAxML-NG: a fast, scalable and user-friendly tool for maximum likelihood phylogenetic inference. Bioinformatics 35, 4453–4455. doi: 10.1093/bioinformatics/btz305
Lei Y., Zhou Y., Price M., and Song Z. (2021). Genome-wide characterization of microsatellite DNA in fishes: survey and analysis of their abundance and frequency in genome-specific regions. BMC Genomics 22, 421. doi: 10.1186/s12864-021-07752-6
Liao X., Shih Y., Jia C., and Gao T. (2024). Complete mitochondrial genome of four Peristediidae fish species: Genome characterization and phylogenetic analysis. Genes 15, 557. doi: 10.3390/genes15050557
Liggins L., Noble C., and The Ira Moana Network (2021). The ira moana project: A genetic observatory for aotearoa’s marine biodiversity. Front. Mar. Sci. 8, 740953. doi: 10.3389/fmars.2021.740953
Liu B., Shi Y., Yuan J., Hu X., Zhang H., Li N., et al. (2013). Estimation of genomic characteristics by analyzing K-mer frequency in de novo genome projects. Quant. Biol. 35, 62–67. doi: 10.48550/arXiv.1308.2012
Liu Q., Zhao X., Qu Y., Wang Y., Guo X., Li W., et al. (2024). A comprehensive genome survey study unveils the genomic characteristics and phylogenetic evolution of fishes in the Uranoscopidae family. Front. Mar. Sci. 11, 1383635. doi: 10.3389/fmars.2024.1383635
Luo R., Liu B., Xie Y., Li Z., Huang W., Yuan J., et al. (2012). SOAPdenovo2: an empirically improved memory-efficient short-read de novo assembler. GigaScience 1, 2047-217X-1–18. doi: 10.1186/2047-217X-1-18
Ma S., Zhao X., and Song N. (2024). Whole-genome survey analyses of five goby species provide insights into their genetic evolution and invasion-related genes. IJMS 25, 3293. doi: 10.3390/ijms25063293
Manni M., Berkeley M. R., Seppey M., Simão F. A., and Zdobnov E. M. (2021). BUSCO update: Novel and streamlined workflows along with broader and deeper phylogenetic coverage for scoring of eukaryotic, prokaryotic, and viral genomes. Mol. Biol. Evol. 38, 4647–4654. doi: 10.1093/molbev/msab199
Massouras A., Decouttere F., Hens K., and Deplancke B. (2010). WebPrInSeS: automated full-length clone sequence identification and verification using high-throughput sequencing data. Nucleic Acids Res. 38, W378–W384. doi: 10.1093/nar/gkq431
Mather N., Traves S. M., and Ho S. Y. W. (2019). A practical introduction to sequentially Markovian coalescent methods for estimating demographic history from genomic data. Ecol. Evol. 10, 579–589. doi: 10.1002/ece3.v10.1
Nadachowska-Brzyska K., Burri R., Smeds L., and Ellegren H. (2016). PSMC analysis of effective population sizes in molecular ecology and its application to black-and-white Ficedula flycatchers. Mol. Ecol. 25, 1058–1072. 10.1111/mec.13540
O’Toole B. (2002). Phylogeny of the species of the superfamily Echeneoidea (Perciformes: Carangoidei: Echeneidae, Rachycentridae, and Coryphaenidae), with an interpretation of echeneid hitchhiking behaviour. Can. J. Zool. 80, 596–623. doi: 10.1139/z02-031
Obreht I., De Vleeschouwer D., Wörmer L., Kucera M., Varma D., Prange M., et al. (2022). Last Interglacial decadal sea surface temperature variability in the eastern Mediterranean. Nat. Geosci. 15, 812–818. doi: 10.1038/s41561-022-01016-y
Qin Q., Chen L., Zhang F., Xu J., and Zeng Y. (2024). Characterization of the complete mitochondrial genome of Schizothorax kozlovi (Cypriniformes, Cyprinidae, Schizothorax) and insights into the phylogenetic relationships of Schizothorax. Animals 14, 721. doi: 10.3390/ani14050721
Santini F. and Carnevale G. (2015). First multilocus and densely sampled timetree of trevallies, pompanos and allies (Carangoidei, Percomorpha) suggests a Cretaceous origin and Eocene radiation of a major clade of piscivores. Mol. Phylogenet. Evol. 83, 33–39. doi: 10.1016/j.ympev.2014.10.018
Satam H., Joshi K., Mangrolia U., Waghoo S., Zaidi G., Rawool S., et al. (2023). Next-generation sequencing technology: Current trends and advancements. Biology 12, 997. doi: 10.3390/biology12070997
Servili A., Canario A. V. M., Mouchel O., and Muñoz-Cueto J. A. (2020). Climate change impacts on fish reproduction are mediated at multiple levels of the brain-pituitary-gonad axis. Gen. Comp. Endocr. 291, 113439. doi: 10.1016/j.ygcen.2020.113439
Simpson J. T. (2014). Exploring genome characteristics and sequence quality without a reference. Bioinformatics 30, 1228–1235. doi: 10.1093/bioinformatics/btu023
Song N., Zhao X., Cai C., and Gao T. (2022). Profile of the genomic characteristics and comparative studies of five Trichiuridae species by genome survey sequencing. Front. Mar. Sci. 9, 962307. doi: 10.3389/fmars.2022.962307
Surachat K., Deachamag P., and Wonglapsuwan M. (2022). The first de novo genome assembly and sex marker identification of Pluang Chomphu fish (Tor tambra) from Southern Thailand. Comput. Struct. Biotechnol. J. 20, 1470–1480. doi: 10.1016/j.csbj.2022.03.021
Van Dam M. H., Henderson J. B., Esposito L., and Trautwein M. (2021). Genomic characterization and curation of UCEs improves species tree reconstruction. Syst. Biol. 70, 307–321. doi: 10.1093/sysbio/syaa063
Wang F., Jia C., Gao T., Guo X., and Zhang X. (2025). Characterization of complete mitochondrial genome and phylogeny of three Echeneidae species. Animals 15, 81. doi: 10.3390/ani15010081
Wang Y., Yang X., Chen Y., Wainwright D. K., Kenaley C. P., Gong Z., et al. (2017). A biorobotic adhesive disc for underwater hitchhiking inspired by the remora suckerfish. Sci. Robot. 2, eaan8072. doi: 10.1126/scirobotics.aan8072
Xiong Y., Lei X., Bai S., Xiong Y., Liu W., Wu W., et al. (2021). Genomic survey sequencing, development and characterization of single- and multi-locus genomic SSR markers of Elymus sibiricus L. BMC Plant Biol. 21, 3. doi: 10.1186/s12870-020-02770-0
Xu S., Zhao L., Xiao S., and Gao T. (2019). Whole genome resequencing data for three rockfish species of Sebastes. Sci. Data 6, 97. doi: 10.1038/s41597-019-0100-z
Yang T., Zhu Z., Liu Y., and Wang S. (2024). The first genome-wide survey of shortbelly eel (Dysomma Anguillare Barnard 1923) to provide genomic characteristics, microsatellite markers and complete mitogenome information. Biochem. Genet. 62, 2296–2313. doi: 10.1007/s10528-023-10543-1
Zane L., Bargelloni L., and Patarnello T. (2002). Strategies for microsatellite isolation: a review. Mol. Ecol. 11, 1–16. doi: 10.1046/j.0962-1083.2001.01418.x
Zhang D., Guo L., Guo H., Zhu K., Li S., Zhang Y., et al. (2019). Chromosome-level genome assembly of golden pompano (Trachinotus ovatus) in the family Carangidae. Sci. Data 6, 216. doi: 10.1038/s41597-019-0238-8
Zhao X., Liu Y., Du X., Ma S., Song N., and Zhao L. (2022). Whole-genome survey analyses provide a new perspective for the evolutionary biology of Shimofuri goby, Tridentiger bifasciatus. Animals 12, 1914. doi: 10.3390/ani12151914
Zhao X., Zheng T., Song N., Qu Y., and Gao T. (2024). Whole-genome survey reveals interspecific differences in genomic characteristics and evolution of Pampus fish. Front. Mar. Sci. 10, 1332250. doi: 10.3389/fmars.2023.1332250
Zhou W., Hu Y., Sui Z., Fu F., Wang J., Chang L., et al. (2013). Genome survey sequencing and genetic background characterization of Gracilariopsis lemaneiformis (Rhodophyta) based on next-generation sequencing. PLoS One 8, e69909. doi: 10.1371/journal.pone.0069909
Zhou C., Liu Q., Qu Y., Qiao Y., Gao T., and Wang D. (2024a). The first chromosomal-level genome assembly and annotation of white suckerfish Remora albescens. Sci. Data 11, 523. doi: 10.1038/s41597-024-03363-4
Zhou Q., Wang J., Li J., Chen Z., Wang N., Li M., et al. (2024b). Decoding the fish genome opens a new era in important trait research and molecular breeding in China. Sci. China Life Sci. 67, 2064–2083. doi: 10.1007/s11427-023-2670-5
Zhu T., Sato Y., Sado T., Miya M., and Iwasaki W. (2023). MitoFish, mitoAnnotator, and miFish pipeline: updates in 10 years. Mol. Biol. Evol. 43, msad035. doi: 10.1093/molbev/msad035
Keywords: Echeneidae, whole-genome survey, genomic characteristics, microsatellite, phylogenetic evolution
Citation: Wang F, Liu Q, Qu Y, Gao T, Guo X and Zhang X (2025) Whole-genome survey reveals the genomic characteristics and phylogeny of three species within the family Echeneidae. Front. Mar. Sci. 12:1586527. doi: 10.3389/fmars.2025.1586527
Received: 03 March 2025; Accepted: 19 May 2025;
Published: 03 June 2025.
Edited by:
Marialetizia Palomba, University of Tuscia, ItalyReviewed by:
Pamela Morales, University of Chile, ChileTiziana Castrignanò, University of Tuscia, Italy
Copyright © 2025 Wang, Liu, Qu, Gao, Guo and Zhang. This is an open-access article distributed under the terms of the Creative Commons Attribution License (CC BY). The use, distribution or reproduction in other forums is permitted, provided the original author(s) and the copyright owner(s) are credited and that the original publication in this journal is cited, in accordance with accepted academic practice. No use, distribution or reproduction is permitted which does not comply with these terms.
*Correspondence: Xiumei Zhang, eGl1bWVpMTIyN0AxNjMuY29t