 Miao-Miao Wang1
 Zhiqiang Xia2*Jianming Jiang2,3Haigang Wu4Hurong Huang1Xilong Zhang2Wen-Jun Hong2Minjie Li2,5Liang-Hong Guo2,6*
- 1School of Life Science, China Jiliang University, Hangzhou, Zhejiang, China
- 2College of Energy Environment and Safety Engineering, China Jiliang University, Hangzhou, Zhejiang, China
- 3The Organic Department, China Coal Zhejiang Testing Technology Co., Ltd., Hangzhou, Zhejiang, China
- 4The Consulting Business Department, Zhejiang Jiaoke Environment Technology Co, Ltd, Hangzhou, Zhejiang, China
- 5Hangzhou Institute of Medicine, Chinese Academy of Sciences, Hangzhou, Zhejiang, China
- 6School of Environment, Hangzhou Institute for Advanced Study, University of the Chinese Academy of Sciences, Hangzhou, Zhejiang, China
Introduction: Per- and poly-fluoroalkyl substances (PFAS) are of great concern due to harm to human and wildlife health. Local-scale studies, especially those focused on ecologically important or densely populated areas, are critical to effective management, such as prioritizing resource allocation.
Methods: To prioritize management efforts, we investigated the distribution of PFAS in a densely populated coastal plain water network area in east China, followed by health and ecological risk assessments.
Results: Results demonstrated that ∑18PFAS (212.86-406.73 ng/L) in water had non-significant seasonal and weak spatial variations. Individual congeners, not the ∑PFAS concentrations, were significantly correlated with some water quality parameters. ∑PFAS in sediments, not surface water, demonstrated a significant negative relationship with river width. The perfluoroalkyl carboxylic acids (PFCAs) dominated the PFAS (water: 84.9%; sediments: 76.9%), while sediments harbored more perfluoroalkyl sulfonic acids than surface water (PFSAs; 23.1% vs. 15.1%). Spatial variation of ∑PFAS was much more profound in sediments than surface water (CV: 83.7% vs. 14.1-46.3%). Despite a low-moderate risk to water birds (RQ: 0.069-0.16), we found neither evident ecological risks to other aquatic organisms (RQ < 0.01) nor human health risks of the water PFAS.
Discussion: Our findings revealed the divergent distribution pattern of PFAS in surface water versus sediments in coastal plain water network areas, likely due to presumable well-mixed conditions caused by tidal cycles and local water level regulations. Our work suggests that management focus of PFAS pollution should be shifted to sediments to optimize resource allocation in such coastal plain water network areas.
1 Introduction
Due to their strong carbon-fluorine bonds (Khumalo et al., 2022), per- and poly-fluoroalkyl substances (PFAS) exhibit hydrophobicity, thermal stability, and acid resistance (Cai et al., 2021; Lenka et al., 2021). These properties allow for extensive uses of PFAS in a variety of industrial and consumer products (Lenka et al., 2021; Khumalo et al., 2022) but also raise concerns about their environmental persistence and potential toxicity to wildlife and human beings. PFAS are ubiquitous in water, air, and soil, demonstrating resistance to degradation (Mbanugo et al., 2025), long-distance environmental transport (Xing et al., 2021), and bioaccumulation (Sun et al., 2023), posing significant ecological and health risks.
PFAS contamination in aquatic environments is a global concern, with high concentrations reported worldwide. For example, the total concentrations of PFAS (hereafter ∑PFAS) have reached up to 218 ng/L in the Nakdong River in South Korea (∑28PFAS; Kim et al., 2021), 237 ng/L in Alabama and Georgia, USA (∑6PFAS; Viticoski et al., 2022), and 5500 ng/L in an industrial area of central Melbourne, Australia (∑42PFAS; Marchiandi et al., 2021). While large rivers generally exhibited low concentrations, e.g., 68.7 ng/L in the Polish Oder River (∑14PFAS; Zarębska et al., 2024), severe PFAS pollution persists in China, with ∑PFAS concentrations have been reported for major basins such as the Yangtze (∑11PFAS: 0-28.49 ng/L; Li et al., 2024a), Yellow (∑30PFAS: 3.13-289.06 ng/L; Li et al., 2024b), and Pearl River basins (∑57PFAS: 2.66–1060 ng/L; Chen et al., 2021).
The potential harms of PFAS are closely related to chain length. Long-chain PFAS demonstrates strong bioaccumulation because of low water solubility, high affinity for serum proteins, and prolonged retention in tissues and serum (Huang et al., 2019; Chambers et al., 2021; Fenton et al., 2021). These compounds have been detected in a variety of aquatic organisms, such as fishes and shrimps from different rivers (Zhang et al., 2022; Surma et al., 2023). Human exposure generally occurs through dietary intake and other environmental pathways, which can lead to elevated PFAS concentrations in the body (Li et al., 2024c).
The Stockholm Convention on Persistent Organic Pollutants classifies PFOS and PFOA as persistent organic pollutants (POPs) because they harm the environment and human health (Yao et al., 2022). Consequently, many countries have implemented restrictions and bans, particularly on those long-chain congeners (e.g., >C8), such as the prohibition of PFOA since 2013 (Vierke et al., 2012). However, the phase-out of long-chain PFAS has led to a progressive increase in the short-chain alternatives. For example, at Xiaolangdi (Mumtaz et al., 2019), a critical hydropower project in China, short-chain PFAS have been reported to account for 88.8% of the ∑PFAS in water (Zhao et al., 2016). Moreover, the wide use of short-chain PFAS, such as perfluorobutane sulfonic acid (PFBS) and perfluorobutanoic acid (PFBA), has been detected in many aquatic environments, including snow and ice in Polar Regions (Li et al., 2020a).
Understanding the distribution pattern is a critical prerequisite for risk assessment and effective management of PFAS pollution in aquatic environments. Existing studies have concentrated mainly on low-frequency sampling at large geographic scales, which presume to have different landscapes, industrial focuses, population densities, and hydrological and chemical conditions (Chen et al., 2021; Meng et al., 2021; Yao et al., 2022). While knowledge about PFAS distribution from large-scale surveys is critical to creating a broad map of their pollution status, localized high-resolution sampling may be more practical for developing mitigation and remediation strategies because effective management requires prioritizing resource allocation, including labor and financial investments. Urban rivers are vulnerable to pollution and are subject to management investments. For example, river dredging often improves water quality by removing excessive nutrients and other pollutants. However, refined investigations of PFAS-polluted urban rivers remain limited, impeding potential management as traditional pollutants. A refined investigation of PFAS-polluted areas profiling the pollution status and associated risks to wildlife and humans can be very supportive in directing management activities (e.g., resource allocation), especially for densely populated urban waters.
In this study, we sought to investigate distribution patterns of PFAS and associated ecological and health risks in a densely populated and hydrologically connected system (i.e., Songjiang District, Shanghai, China) located at the plain water network of the lower Yangtze River Basin. We selected this area because it represents a typical landscape in many plains worldwide. We aimed (1) to elucidate the compositional, quantitative, and spatial-temporal distribution patterns of PFAS across various sites in interconnected waterways; (2) to assess the influence of water quality on PFAS concentrations; and (3) to evaluate the ecological and health risks associated with PFAS contamination; and (4) identify priorities for management investment.
2 Materials and methods
2.1 Materials and reagents
To quantify the concentrations of PFAS, we employed 21 legacy perfluorinated compound standards, consisting of 13 PFCAs and 8 PFSAs. Nine isotopically labeled internal standards including 13C4PFBA, 13C2PFHxA, 13C4PFOA, 13C5PFNA, 13C2PFDA, 13C2PFUnDA, 13C2PFDoDA, 18O2PFHxS, and 13C4PFOS were also employed in measurement. Both standards were purchased from Wellington Laboratories, Canada, with purities greater than 98% (see more details in Supplementary Table S1). Solid phase extraction (SPE) cartridges (WAX, J&K Scientific Ltd., China) were used to extract PFAS. Methanol and other solvents used were of mass spectrometry (MS) and chromatography grade, respectively.
2.2 Sampling collection and pretreatment
We collected samples from a plain river network in Songjiang District, Shanghai, China (Figure 1), located in the midstream of the Huangpu River. The hydrodynamics of the study area, including water level (depth), flow direction, and flow velocity, are influenced by the tidal cycles extended from the East Sea, though the extent of impacts on each site might be unequal. For a comprehensive understanding of PFAS composition in water and sediments, we considered 28 sites located in industrial, agricultural, living, forest, and mixed areas regarding their surrounding land uses (see more details in Supplementary Table S2; Supplementary Information).
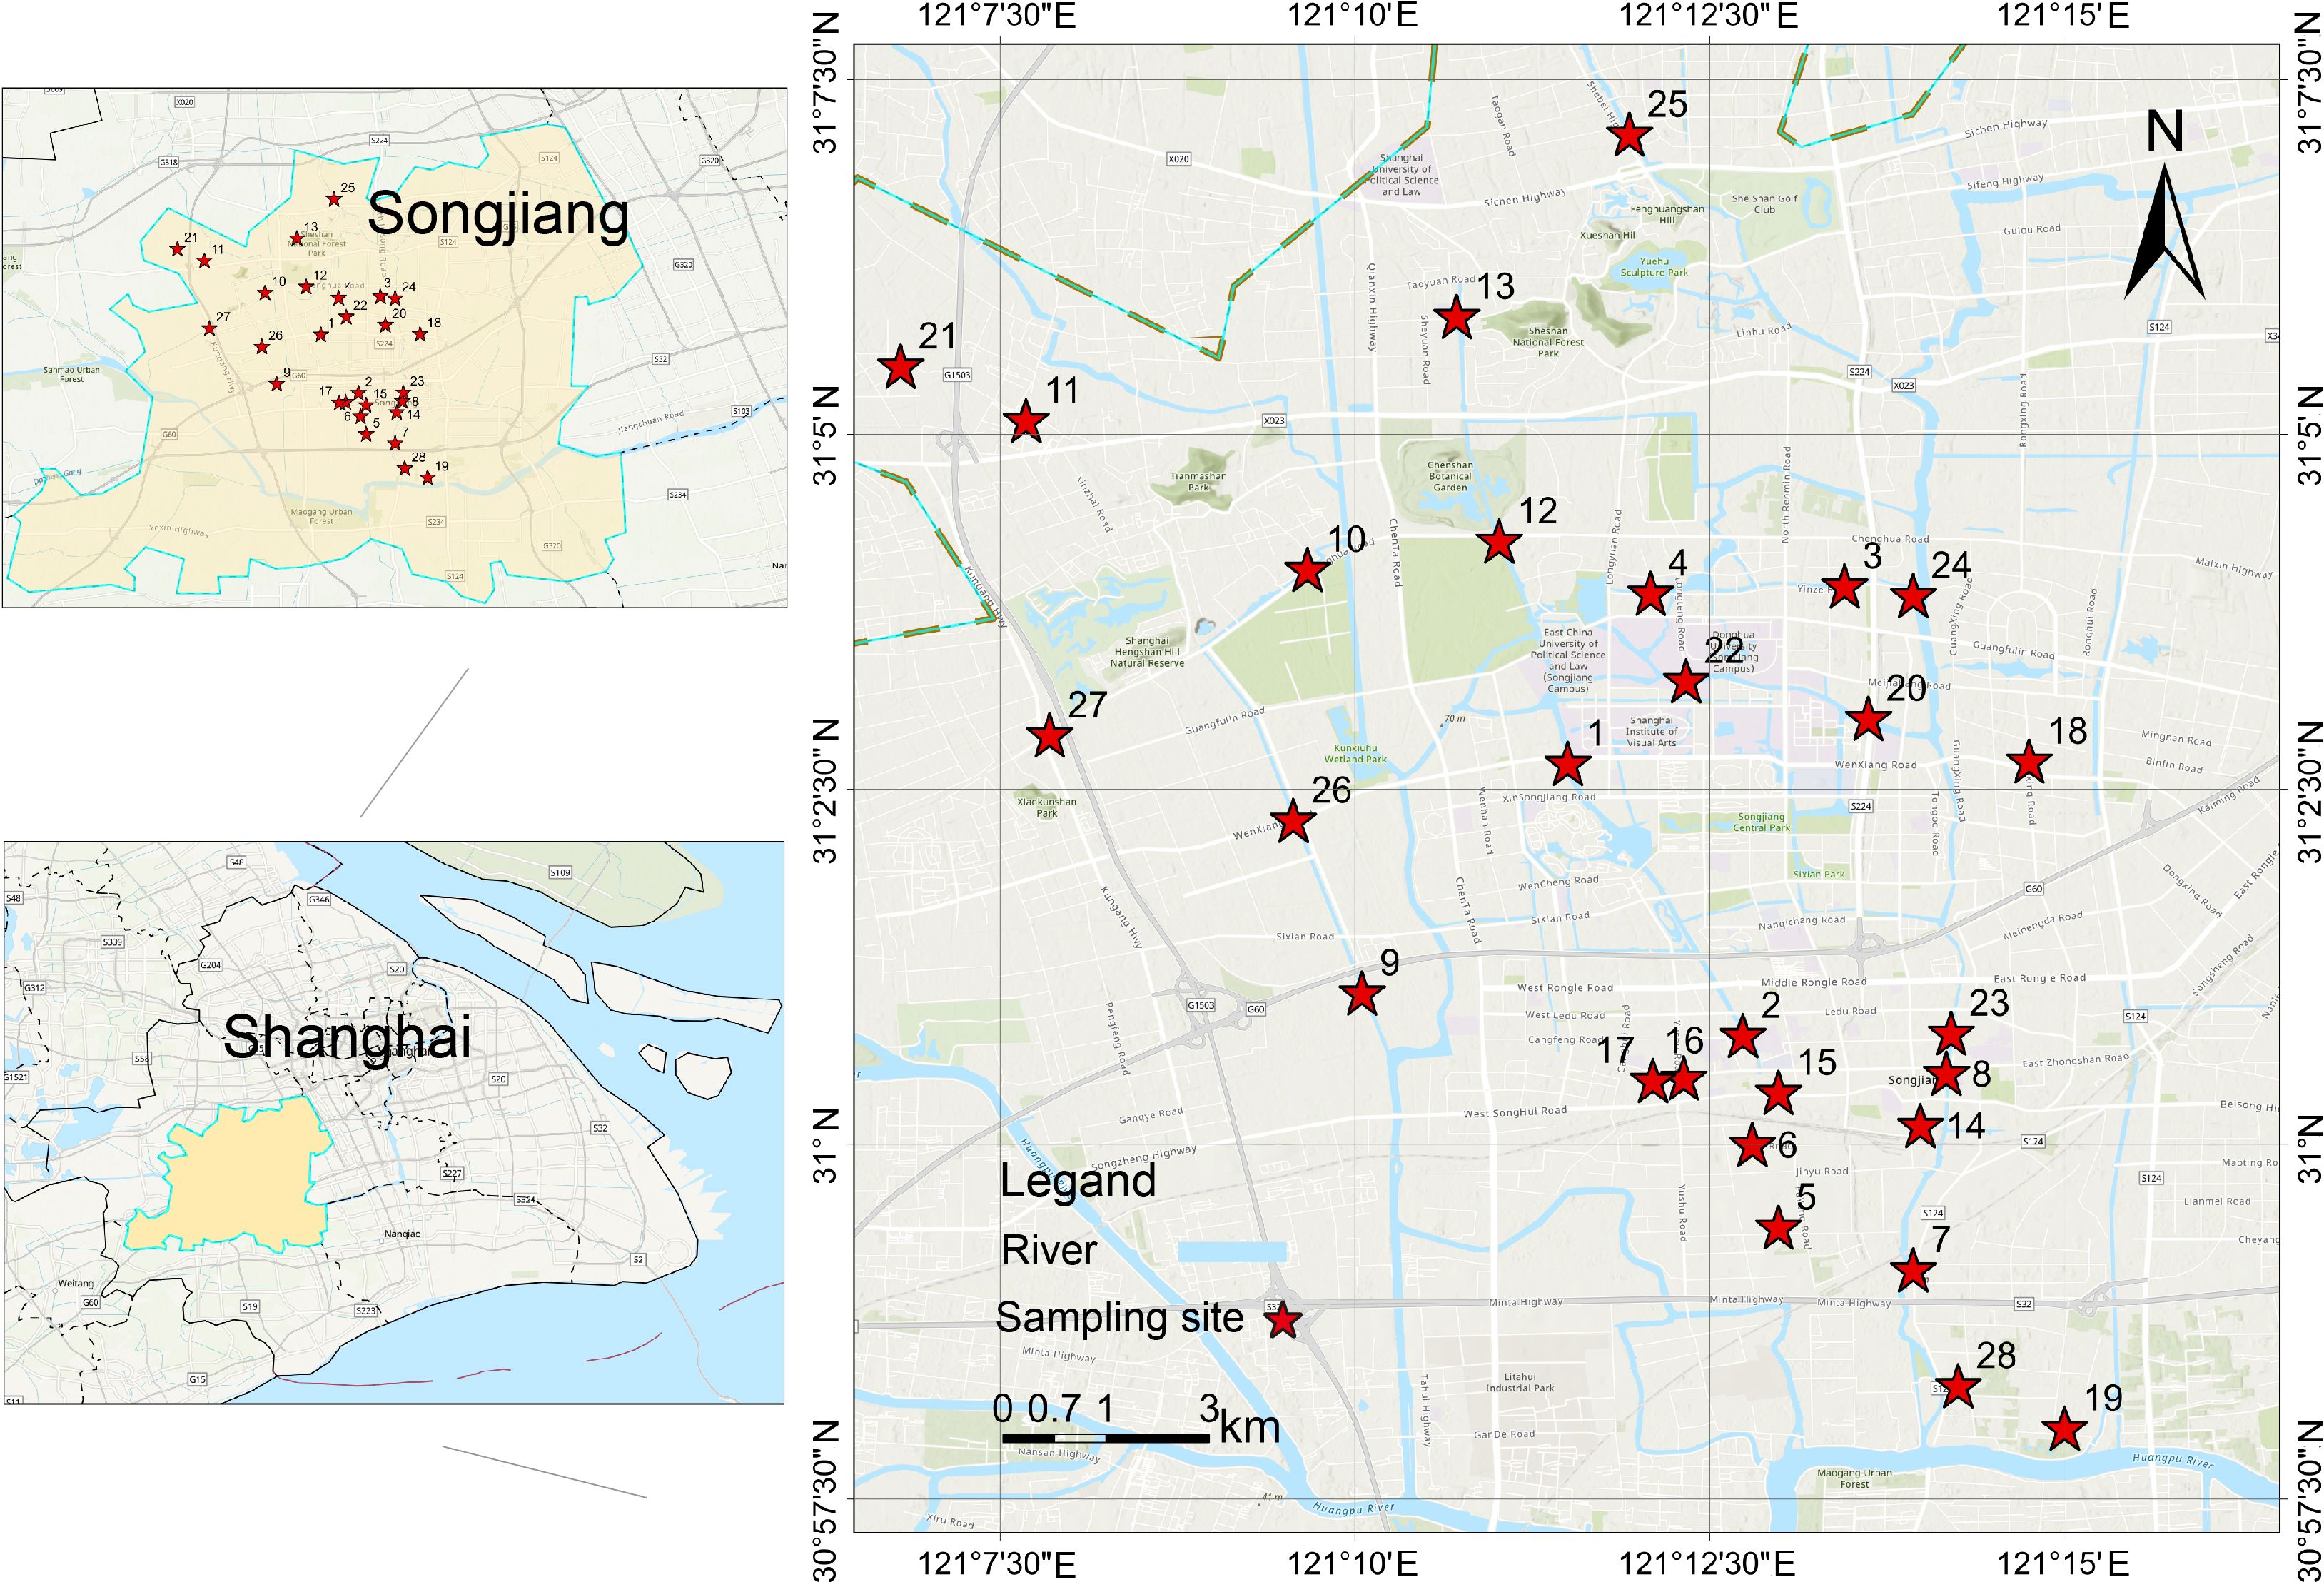
Figure 1. Sampling sites of this study.
We conducted four sampling trips (Oct. 2023; Jan., Apr. and Jul. 2024) for water and one time (Dec. 2023) for sediments, respectively. Fewer sampling trips for sediments were considered because PFAS in sediments demonstrate less temporal variability than surface water (Chen et al., 2021). We collected 1L water from the subsurface (~0.2 m depth) using a new PET bottle, which has been demonstrated to reduce the adsorption and release of PFAS (Folorunsho et al., 2024). Samples were transported to the laboratory on ice, stored at 4°C, and processed for extraction within a week. Sediment samples were collected using a Peterson grab, transported, and stored in the same manner as water samples.
The pretreatment of water samples was detailed in Supplementary Text S1 (Supplementary Information). Briefly, 400 mL of water was filtered using cellulose acetate membrane filters (0.45 μm pore size) to remove suspended particles, and 10 ng of perfluorinated internal standard was spiked to each sample. We used the weak anion exchange (WAX) columns (6 cc, 150 mg; J&K Scientific Ltd., China) to extract PFAS from the water, and the resulting extracts were concentrated to 1 mL and filtered through a 0.22 μm filter before instrumental analysis. The sediment samples were freeze-dried before being grounded and filtered through a metal sieve (50 mesh). A 2 g (dry weight, [dw]) portion of fine sediment was weighed and spiked with 10 ng of perfluorinated internal standard before subsequent treatment (see more details in Supplementary Text S2, Supplementary Information).
2.3 Instrumental analysis
PFAS extracted were quantified using an Agilent 1290 liquid chromatography system coupled with an Agilent 6470 mass spectrometer (HPLC-MS/MS) under the MRM mode, fragmentation voltage, and collision energies for each PFAS in Supplementary Table S3 (Supplementary Information). A 2 μL extract per sample was analyzed on a ZORBAX Eclipse XDB-C18 column (3.0 × 150 mm, 1.8-Micron) with a column temperature of 40°C. The full settings used in measurement were provided in Supplementary Table S4 (Supplementary Information).
2.4 Evaluation of potential health risks via water and sediment
To evaluate the risks of PFAS to aquatic organisms, we employed the risk quotient (RQ) to measure ecological risk in the present study. The RQ provides a straightforward estimate of potential ecological risks by dividing the measured environmental concentration (MEC) by the predicted no-effect concentration (PNEC) of a given PFAS congener, either in water (PNECwater) or sediment (PNECsediment) (Equation 1):
In Equation 1, different PNECs lead to different RQs. To reduce bias, we retrieved the PNECwater from studies focusing on waters in China and calculated the respective RQs. Due to the rarity of PNECsediment in existing studies, we estimated PNECsediment from PNECwater following Sun et al. (2024). Four levels of ecological risks, including very low: RQ< 0.01, low: 0.01 ≤ RQ< 0.1, moderate: 0.1 ≤ RQ< 1, and high risk: RQ ≥ 1, were assigned to samples following Meng et al. (2021).
To reflect the partitioning behavior of PFAS between sediment and water phases, we calculate Kd (L/kg dry weight, [dw]; log10 transformed, log Kd hereafter) following Meng et al. (2021). Csediment and Cwater denoted the concentrations of individual PFAS compounds in sediment (ng/g, dw) and surface water (ng/L) in Equation 2, respectively.
We also assessed health risks because the study area was densely populated (~2 million people in 604.64 km2 by 2024). Specifically, we evaluated the non-carcinogenic (non-CR) and carcinogenic (CR) risks, as described in the study by Zhao et al. (2024). Specifically, the hazard quotient (HQ) was the ratio of average daily intake (ADI) to reference dose (RfD) (Equation 3), while the carcinogenic risk (CR) was the product of ADI and carcinogenic slope factor (CSF) (Equation 4) as described in a recent study (Zhao et al., 2024). For non-carcinogenic risk, HQ was classified as follows: HQ< 1 indicates a low likelihood of harm to sensitive populations, while HQ > 1 indicates risks. CR was categorized into three levels: negligible risk (CR< 10−6), potential risk (10−6< CR< 10−4), and high risk (CR > 10−4) (Zhao et al., 2024).
2.5 Quality assurance and quality control
To avoid cross-contamination, sample collection, transport, and pretreatment were carried out carefully to reduce the introduction of perfluorinated substances. No glassware was involved throughout the sample pretreatment. A procedural blank was considered during the pretreatment of each batch of samples. During instrumental analysis, a procedural blank and a quality control sample (standard PFAS with known concentration) were included for every eight samples. Effectively correct the influence of the matrix on the response of PFAS through the internal standard method. The standard curves covered concentrations ranging from 1 to 500 ng/mL, with the correlation coefficient ranging from 0.991 to 0.999. The limit of detection (LOD) was defined as a signal-to-noise ratio (S/N) of 3, and the limit of quantitation (LOQ) of the method was set at S/N of 10. In surface water, the LOD and LOQ, analytical reproducibility, and recovery rates were 0.001-0.14 ng/L, 0.004-0.47 ng/L, 6-16%, and 73-125% (except for Perfluoroundecane sulfonate, 55%), respectively. The above parameters (i.e., LOD and LOQ, analytical reproducibility, and recovery rates) were 0.001-0.04 ng/g, 0.001-0.12 ng/g, 1-17%, and 62-96% (except for Perfluorooctadecanoic acid, 49%) for the sediment. An arbitrary concentration of zero was assigned to the sample when the instrumental concentration was lower than the limits of quantification (LOQ).
2.6 Physicochemical conditions in water
During each sampling trip, we also collected water samples for measuring physicochemical parameters, including TN (total nitrogen), TP (total phosphorus), NH3N (ammonia nitrogen), and CODMn (chemical oxygen demand) in the lab following the respective national protocols. Additional parameters, including water temperature, pH, Cond (conductivity), DO (dissolved oxygen), ORP (oxidation-reduction potential), and Chla (chlorophyll a), were measured on-site using a portable multi-parameters sonde (Luheng, China). The transparency of the water was measured using Secchi depth (SD). To address the overall pollution status of the study area, we calculated a trophic level index (TLI) using five parameters, including TN, TP, CODMn, Chla, and SD, following an established method (Huang et al., 2024).
2.7 Data analysis
Data analysis was conducted in R (version 4.2.2). One-way ANOVA or Kruskal-Wallis test was used to compare water quality averages (or median) or PFAS-related parameters. Because of the non-normal distribution, the Spearman correlations were considered to address the relationships among physicochemical parameters, between the log Kd and chain length of PFAS, and among individual PFAS congeners.
To address the variation of PFAS concentrations in time and space, we calculated the coefficient of variation (CVs) of ∑PFAS in surface water (once per month) and sediments of all congeners 100% detected in either water or sediment samples. To investigate relationships between water quality and PFAS concentrations, we used a generalized linear model (GLM) to relate the concentrations of ∑PFAS and specific congeners detected in 100% sites (i.e., PFBA, PFPeA, PFHxA, PFOA, PFBS, PFOS) to latitude and longitude of sampling site, water temperature, pH, SD, ORP, TN, TP, NH3N, TLI, DO, Chla and CODMn. Collinearities of independent variables were controlled by sequentially removing the covariate with the highest variance inflation factor (VIF) until all VIFs were no greater than five. However, the TN and TP (5< VIF<6) were retained before the model selection because both were critical parameters informing water quality. The model was further simplified using an Akaike Information Criterion (AIC)-based model selection (both directions), and diagnostic plots were checked to confirm model adequacy. For surface water, the water quality data of the respective months were used in modeling, while the four-month averages prior to sediment sampling were used in sediment modeling. To improve the model performance, a few dependent variables (i.e., PFBA, PFPeA, and ∑PFAS in surface water) were log-transformed, while others remained unchanged (i.e., PFOA and PFHxA in surface water, PFBS, PFOS and ∑PFAS in sediment) (Zuur et al., 2009). To compare the Log Kd of PFAS congeners from different basins in China, we selected the same congeners detected in our study from literature that focused on the major river basins of China, including Tibetan Plateau Lake, Huai River, Yangtze River, Pearl River, Qiantang River Basins, and the Bohai Sea Basin was also included in comparisons.
3 Results and discussion
3.1 Water quality
The average water temperature was 19.9 ± 7.2°C (mean ± SD) with apparent monthly variation (Figure 2A). The pH (7.6 ± 0.3) peaked in January and reached the lowest in July (Figure 2B). The ORP averaged 123.5 ± 42.2 mV, exhibiting high spatial variability in October but consistency in July (Figure 2C). The DO (6.98 ± 1.67 mg/L) was higher in colder months and lower in warmer months (Figure 2D). The water transparency was suboptimal, averaging 0.39 ± 0.11 m, with an increasing trend from October to July (Figure 2E). The conductivity fluctuated throughout the study, averaging 643.9 ± 72.0 µS/cm (Figure 2F). The chlorophyll a concentration (1.55 ± 0.84 µg/L), highest in October and reached the lowest in July (Figure 2G). The TN, TP, and NH3-N remained elevated, averaging 3.18 ± 1.45, 0.22 ± 0.07, and 0.67 ± 0.40 mg/L, respectively (Figures 2H–J). The CODMn averaged 4.78 ± 1.92 mg/L, lower in October and April (Figure 2K). As a result, the trophic level index (53.7 ± 3.5) was highest in January and lowest in April, indicating a mesotrophic state (Figure 2L). We observed some notable outliers in ORP and conductivity (Figures 2C, F), suggesting potential point-sourced input nearby, though their sources were unidentified.
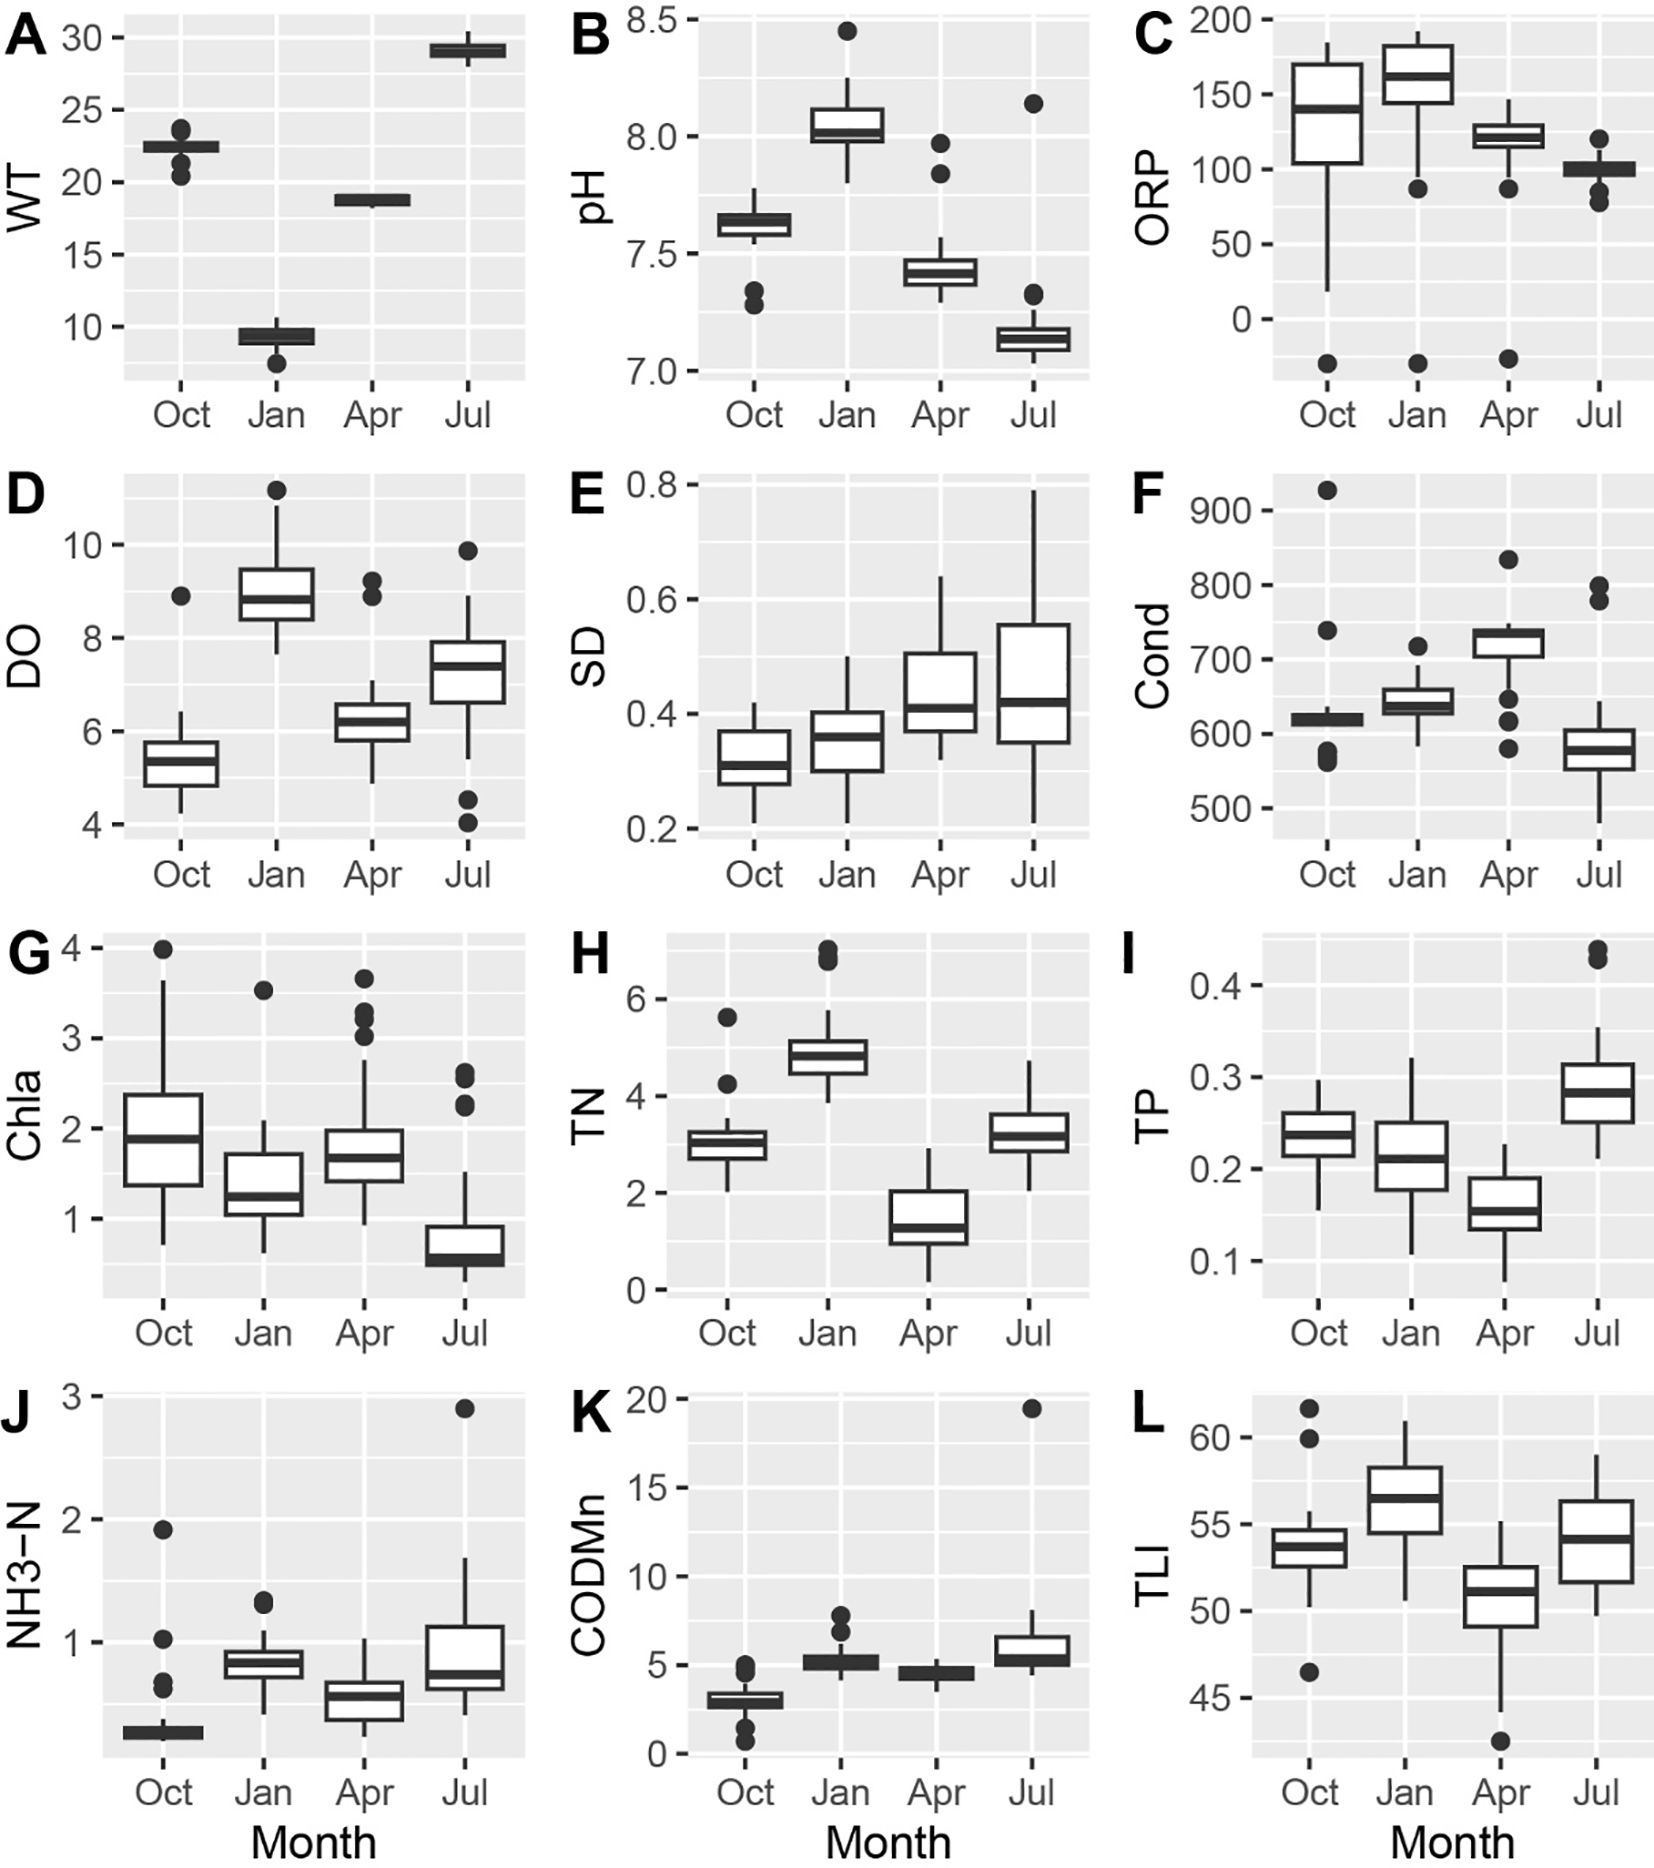
Figure 2. Water quality parameters during four sampling trips. WT, Water temperature (°C); ORP, (oxidation-reduction potential: mV); DO, dissolved oxygen (mg/L); SD, Secchi depth (m); Cond, conductivity (µS/cm); Chla, chlorophyll a (µg/L); TN, total nitrogen (mg/L); TP, total phosphorus (mg/L); NH3-N, ammonia nitrogen (mg/L); CODMn, chemical demand (mg/L); TLI, trophic level index.
3.2 PFAS in water
3.2.1 PFAS concentrations in surface water
We detected 12 PFCAs and 6 PFSAs congeners, accounting for 92.3% and 75.0% of targets, respectively. Among detected congeners, PFBA, PFPeA, PFHxA, PFOA, PFNA, and PFBS were detected in 100% of sites throughout the year. The annual average concentration of individual PFAS across all sites was 0-185.89 ng/L (Figure 3A), while a few, including PFBA, PFHxA, and PFOA (Supplementary Figure S2) demonstrated higher concentrations than that reported in history at a few places nearby (i.e., 32.42-185.89 vs. 2.32-9.08 ng/L; 50.43-76.38 vs. 8.72-38.04 ng/L; 52.63-121.56 vs. 21.89-104.66 ng/L, respectively) (Sun et al., 2018). The PFBS, however, was much lower (6.93-68.74 vs. 14.28-276.28 ng/L) than in history (Sun et al., 2018). This was likely a combined result of bans on PFBS and its presumable fast degradation because of its short chain length (C4). PFBA and PFHxA were considered alternatives to PFOA, and restrictions on the PFOA might lead to the rise of both. PFOA (C8) remained prevalent even though it was restricted in production and use, suggesting resistance to degradation (Hariharan et al., 2023) and the necessity of further routine monitoring of PFOA legacy.
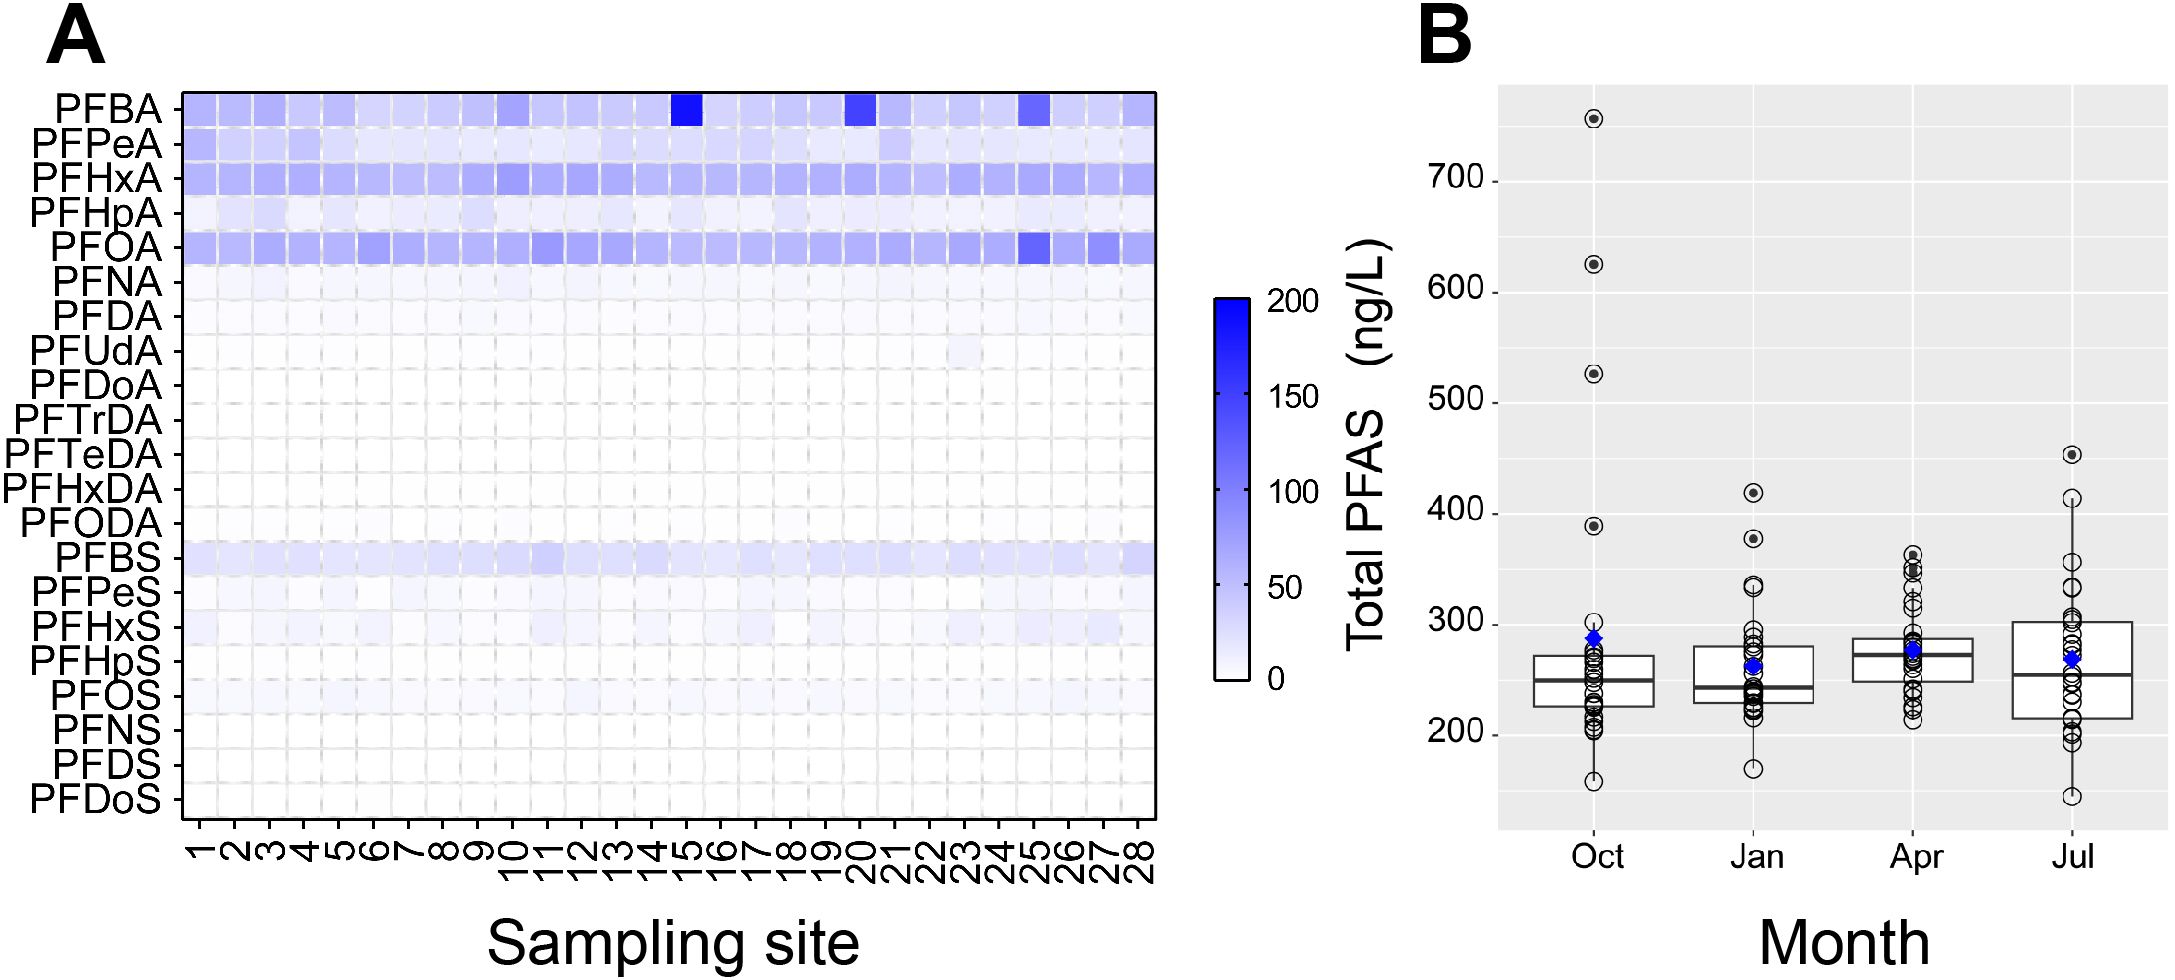
Figure 3. Concentrations of PFAS in water, showing the concentrations among sampling sites (A) and seasons (B). Solid circles represent outliers, and blue squares represent the averages in B.
The annual average concentrations of ∑PFAS in surface water was 212.86-406.73 ng/L (∑18PFAS), which was greater than in Taihu Lake (∑24PFAS: 101–167 ng/L; Liang et al., 2023) and Haihe River (∑21PFAS:1.7–172 ng/L; Li et al., 2020b) while it was comparable to the neighboring Hangzhou Bay of the Qiantang River (∑30PFAS: 63–254 ng/L; Cheng et al., 2023). Possible causes of such differences might be linked to the different populations, industrial emissions, and sampling times across these basins. We found no significant correlations between ∑PFAS and any water quality parameters (all P values > 0.05; see details in Supplementary Table S5; Supplementary Information), which was different from the Yangtze River (Pan et al., 2014). This might be related to the sampling region and scale. Our sampling area was located in an estuarine region subject to tidal recirculation, where well-mixed water conditions might have led to the attenuated correlations between water quality and ∑PFAS. Furthermore, some individual congeners (detailed in Supplementary Table S6; Supplementary Information), including PFBA and PFPeA, also demonstrated no significant correlations (all P > 0.05). Different sampling scales of the two studies and the presumable well-mixed conditions in the present study might explain such divergence.
Two possible causes might have led to the significantly negative correlation between PFOA and DO (P< 0.05). First, the high DO concentrations could promote microbial activities, leading to further degradation of PFOA (Adamson et al., 2022). In addition, higher DO concentrations implied higher dilution, which could directly reduce the concentration of PFAS. PFHxA demonstrated a significantly negative correlation with water temperature, TN (P< 0.01), and TP and CODMn (P< 0.05) but a positive correlation with conductivity (P< 0.01). Higher water temperatures could enhance microbial activities, biodegradation rates, and interactions with pollutants, which could explain the negative correlation between PFHxA and water temperature (Lipczynska-Kochany, 2018). High conductivity indicates concentrated ions, which can neutralize negatively charged anions, thereby enhancing their retention time in water and increasing the concentrations of perfluorinated compounds (Adamson et al., 2022). Based on the above theory, the negative charge of PFHxA in surface water may explain the positive correlation between conductivity and PFHxA.
3.2.2 Spatiotemporal distribution of PFAS in surface water
The ∑PFAS in autumn (Oct.), winter (Jan.), spring (Apr.), and summer (Jul.) was 278.65 (158.34-756.91), 262.55 (169.69-418.78), 277.22 (240.12-363.13), and 268.67 (144.73-453.46) ng/L, respectively (Supplementary Figure S1), demonstrating a non-significant seasonal difference (P > 0.05, Kruskal-Wallis test; Figure 3B). Overall, PFBA, PFHxA, and PFOA were the most abundant congeners throughout the year, constituting 20.62%, 21.96%, and 23.62%, respectively. Despite no seasonal differences in the ∑PFAS, the dominant PFAS congeners differed among seasons. For example, PFBA was the most concentrated congener in autumn (33.74%), while PFOA dominated in winter (23.47%) and summer (23.63%), and PFHxA in spring (30.95%) (Supplementary Figure S3). The relative concentration of PFOA (13.64%-32.93%) in the study area was similar to the middle reaches of the Yangtze River (12.8%-48.6%) (Leng et al., 2021). It should be noted that the PFOA was very stable across seasons (23.17%-24.23%), though the PFBA, PFHxA, and PFBS displayed apparent seasonal changes. For instance, the PFBA increased from 15.78% (summer) to 33.74% (autumn), while the PFHxA reduced from 30.95% (spring) to 12.98% (summer) (Figure 4A). This might indicate seasonal sources of these congeners. Positive relationships (P< 0.01; Spearman correlation) were found between PFBA, PFHxA, PFHpA, PFOA, PFNA, PFBS, and PFHpS, as well as between PFPeS, PFHxS, and PFOS (R values ranged from -0.68 to 0.66; see more details in Supplementary Table S7, Supplementary Information), suggesting shared sources of these congeners.
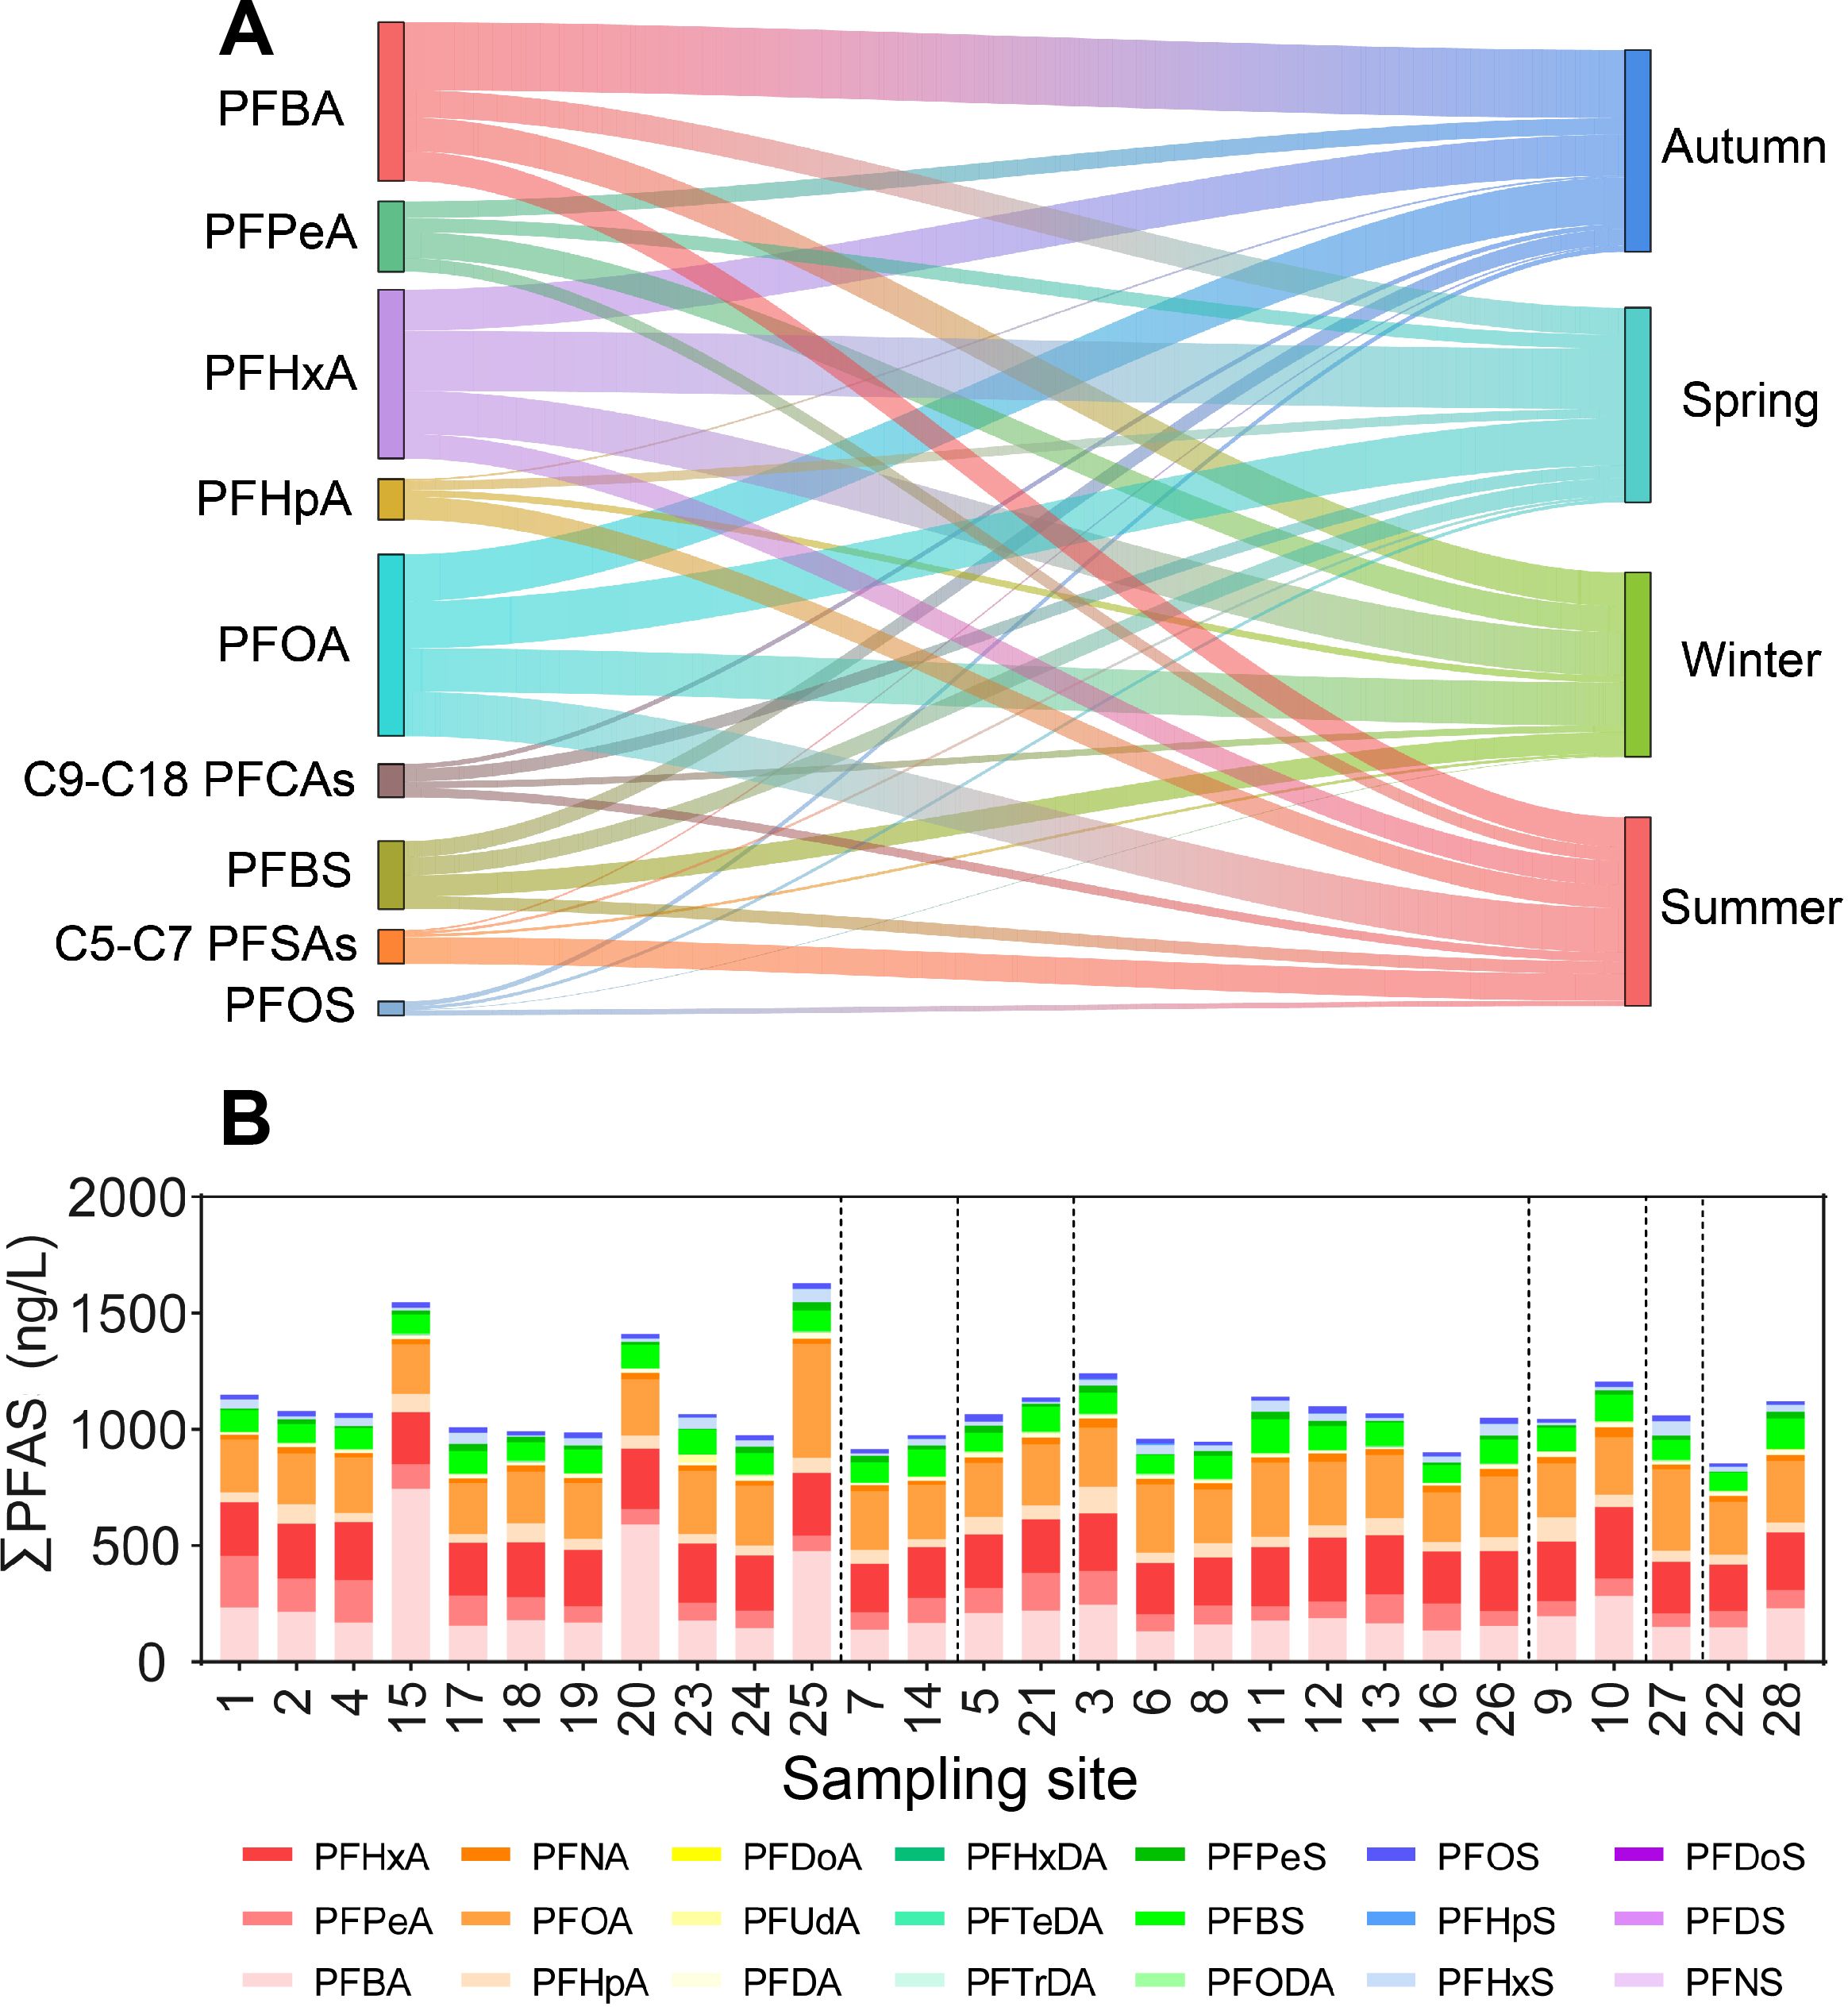
Figure 4. Seasonal changes of main PFAS in surface water (A) and the total concentrations of PFAS among sampling sites (B).
The annual averages of ∑PFAS per site ranged from 212.86 to 406.73 ng/L (Figure 4B), higher in the living zone while lower in the forest zone (only site 28; Figure 1), though no significant differences were found among zones (P > 0.05; Kruskal-Wallis test). In addition, the ∑PFAS at urban sites was higher than at rural sites (293.28 vs. 212.86 ng/L), consistent with other countries. For example, much higher concentrations in urban than rural waters have been reported in Melbourne, Australia (129.8 vs. 10.4 ng/L; Paige et al., 2024). It was unsurprising because urban waters generally harbored more PFAS sources, mainly due to more industries and greater population sizes. In the present study area, spatial variation of ∑PFAS in water was weak. For example, the CVs of water ∑PFAS among sites were 46.29% (autumn), 19.90% (winter), 14.11% (spring), and 25.05% (summer), respectively. The annual (i.e., temporal) CVs of individual congeners were 63.19% (PFBA), 41.06% (PFPeA), 9.36% (PFHxA), 21.07% (PFOA), 21.43% (PFNA), and 17.20% (PFBS). In contrast, the spatial CVs of PFBA (137.51%; autumn), PFPeA (43.28%; winter), PFNA (105.40%; spring), PFBA (45.34%; summer), and PFBS (63.95%; summer) were generally higher than the annual CVs, suggesting that ∑PFAS were relatively homogenized but individual congeners were not. In addition, substantial seasonal changes in PFBA and PFPeA might suggest point sources. These findings had critical implications for the management of PFAS pollution. For instance, less sampling effort (e.g., fewer sites or times) could be considered for monitoring the ∑PFAS but more for individual congeners in surface water in such a presumable well-mixed system.
3.3 PFAS in sediment
A total of 17 congeners were detected from sediment samples, with a detection rate of PFOA and PFBA being 100%. The ∑PFAS in sediment were 2.74-29.77 ng/g (dry weight based; Figure 5A), with concentrations of individual congeners being 0-11.26 ng/g. Some congeners, including PFBA (0.26-4.10 ng/g; 14.45%), PFOA (0.51-9.60 ng/g; 29.35%), and PFOS (0-11.26 ng/g; 13.27%) were generally more concentrated than others (Figure 5A). Like in the surface water, PFCAs had much higher concentrations than PFSAs, accounting for 76.90% (Figure 5B). In contrast, the relative concentrations of PFSAs increased from 15.05% in water to 23.07% in sediment, with the PFOS being increased by a remarkable 6.2 times (1.84% in water vs. 13.17% in sediment).
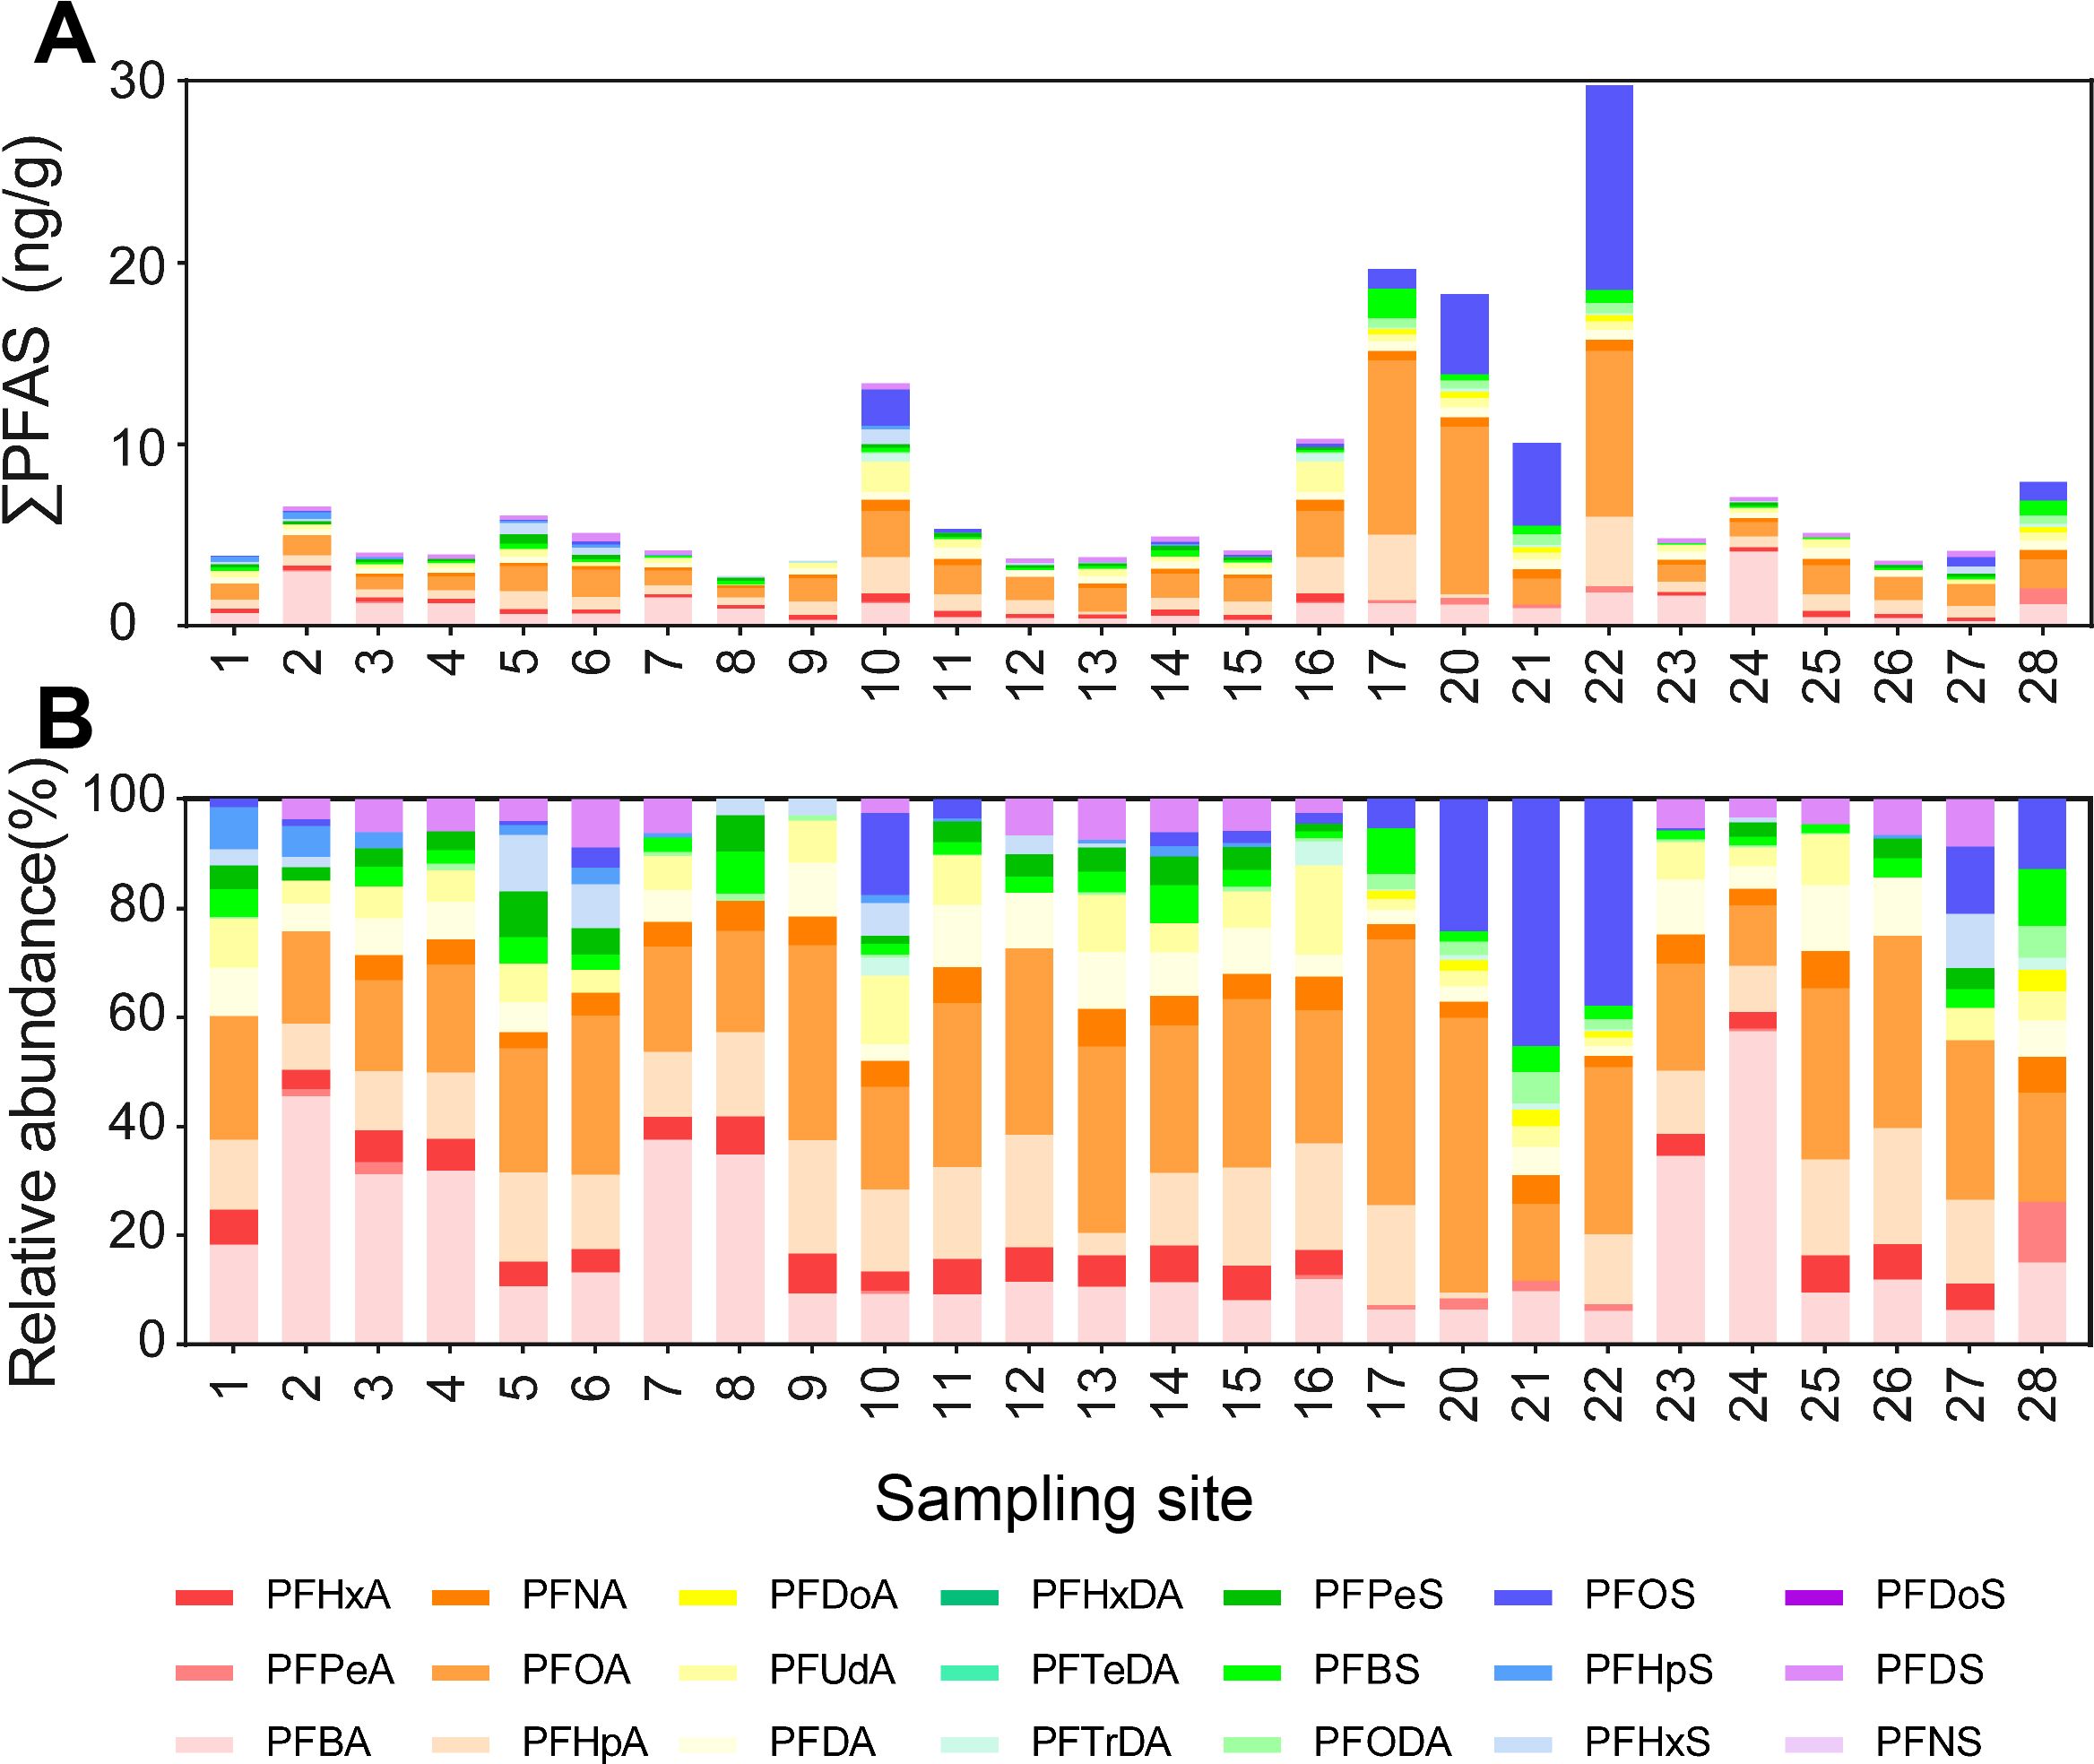
Figure 5. Total concentrations (A) and their relative abundance (B) of 21 individual PFAS congeners in sediments.
The log Kd of individual congeners ranged from 0.59 ± 0.74 (PFPeA) to 3.72 ± 0.64 (PFDoA; Figure 6A), exhibiting significantly positive correlations with their carbon chain lengths (PFCAs: R2 = 0.539, P = 2 ×10-16; PFSAs: R2 = 0.298, P = 1.38×10⁻⁷; Figures 6B, C), consistent with many existing studies (e.g., Meng et al., 2021). The positive correlations above likely stem from the increased hydrophobicity associated with the lengthening perfluorinated carbon chain (Li et al., 2020c; Meng et al., 2021). For example, the log Kd of PFOS (1.89 ± 0.83; C8) was higher than PFBS (0.92 ± 0.34; C4), PFPeS (1.67 ± 0.29; C5), and PFHxS (1.30 ± 0.73; C6), with exceptions of PFPeA (0.59 ± 0.74; C5) and PFHxA (0.62 ± 0.11; C6) which were lower than PFBA (1.23 ± 0.74; C4). It might be because PFBA, a substitute for many long-chain congeners, has high water solubilities and is abundant in water and sediments (Tao et al., 2024). In this study, each additional fluorinated carbon typically increased the log Kd by 0.255 for PFCAs (C4-C12) (Figure 6B) and by 0.261 for PFSAs (C4-C8) (Figure 6C), suggesting greater accumulation potential of PFSAs in sediments. This finding also echoed higher PFSA percentages in sediments than in surface water.
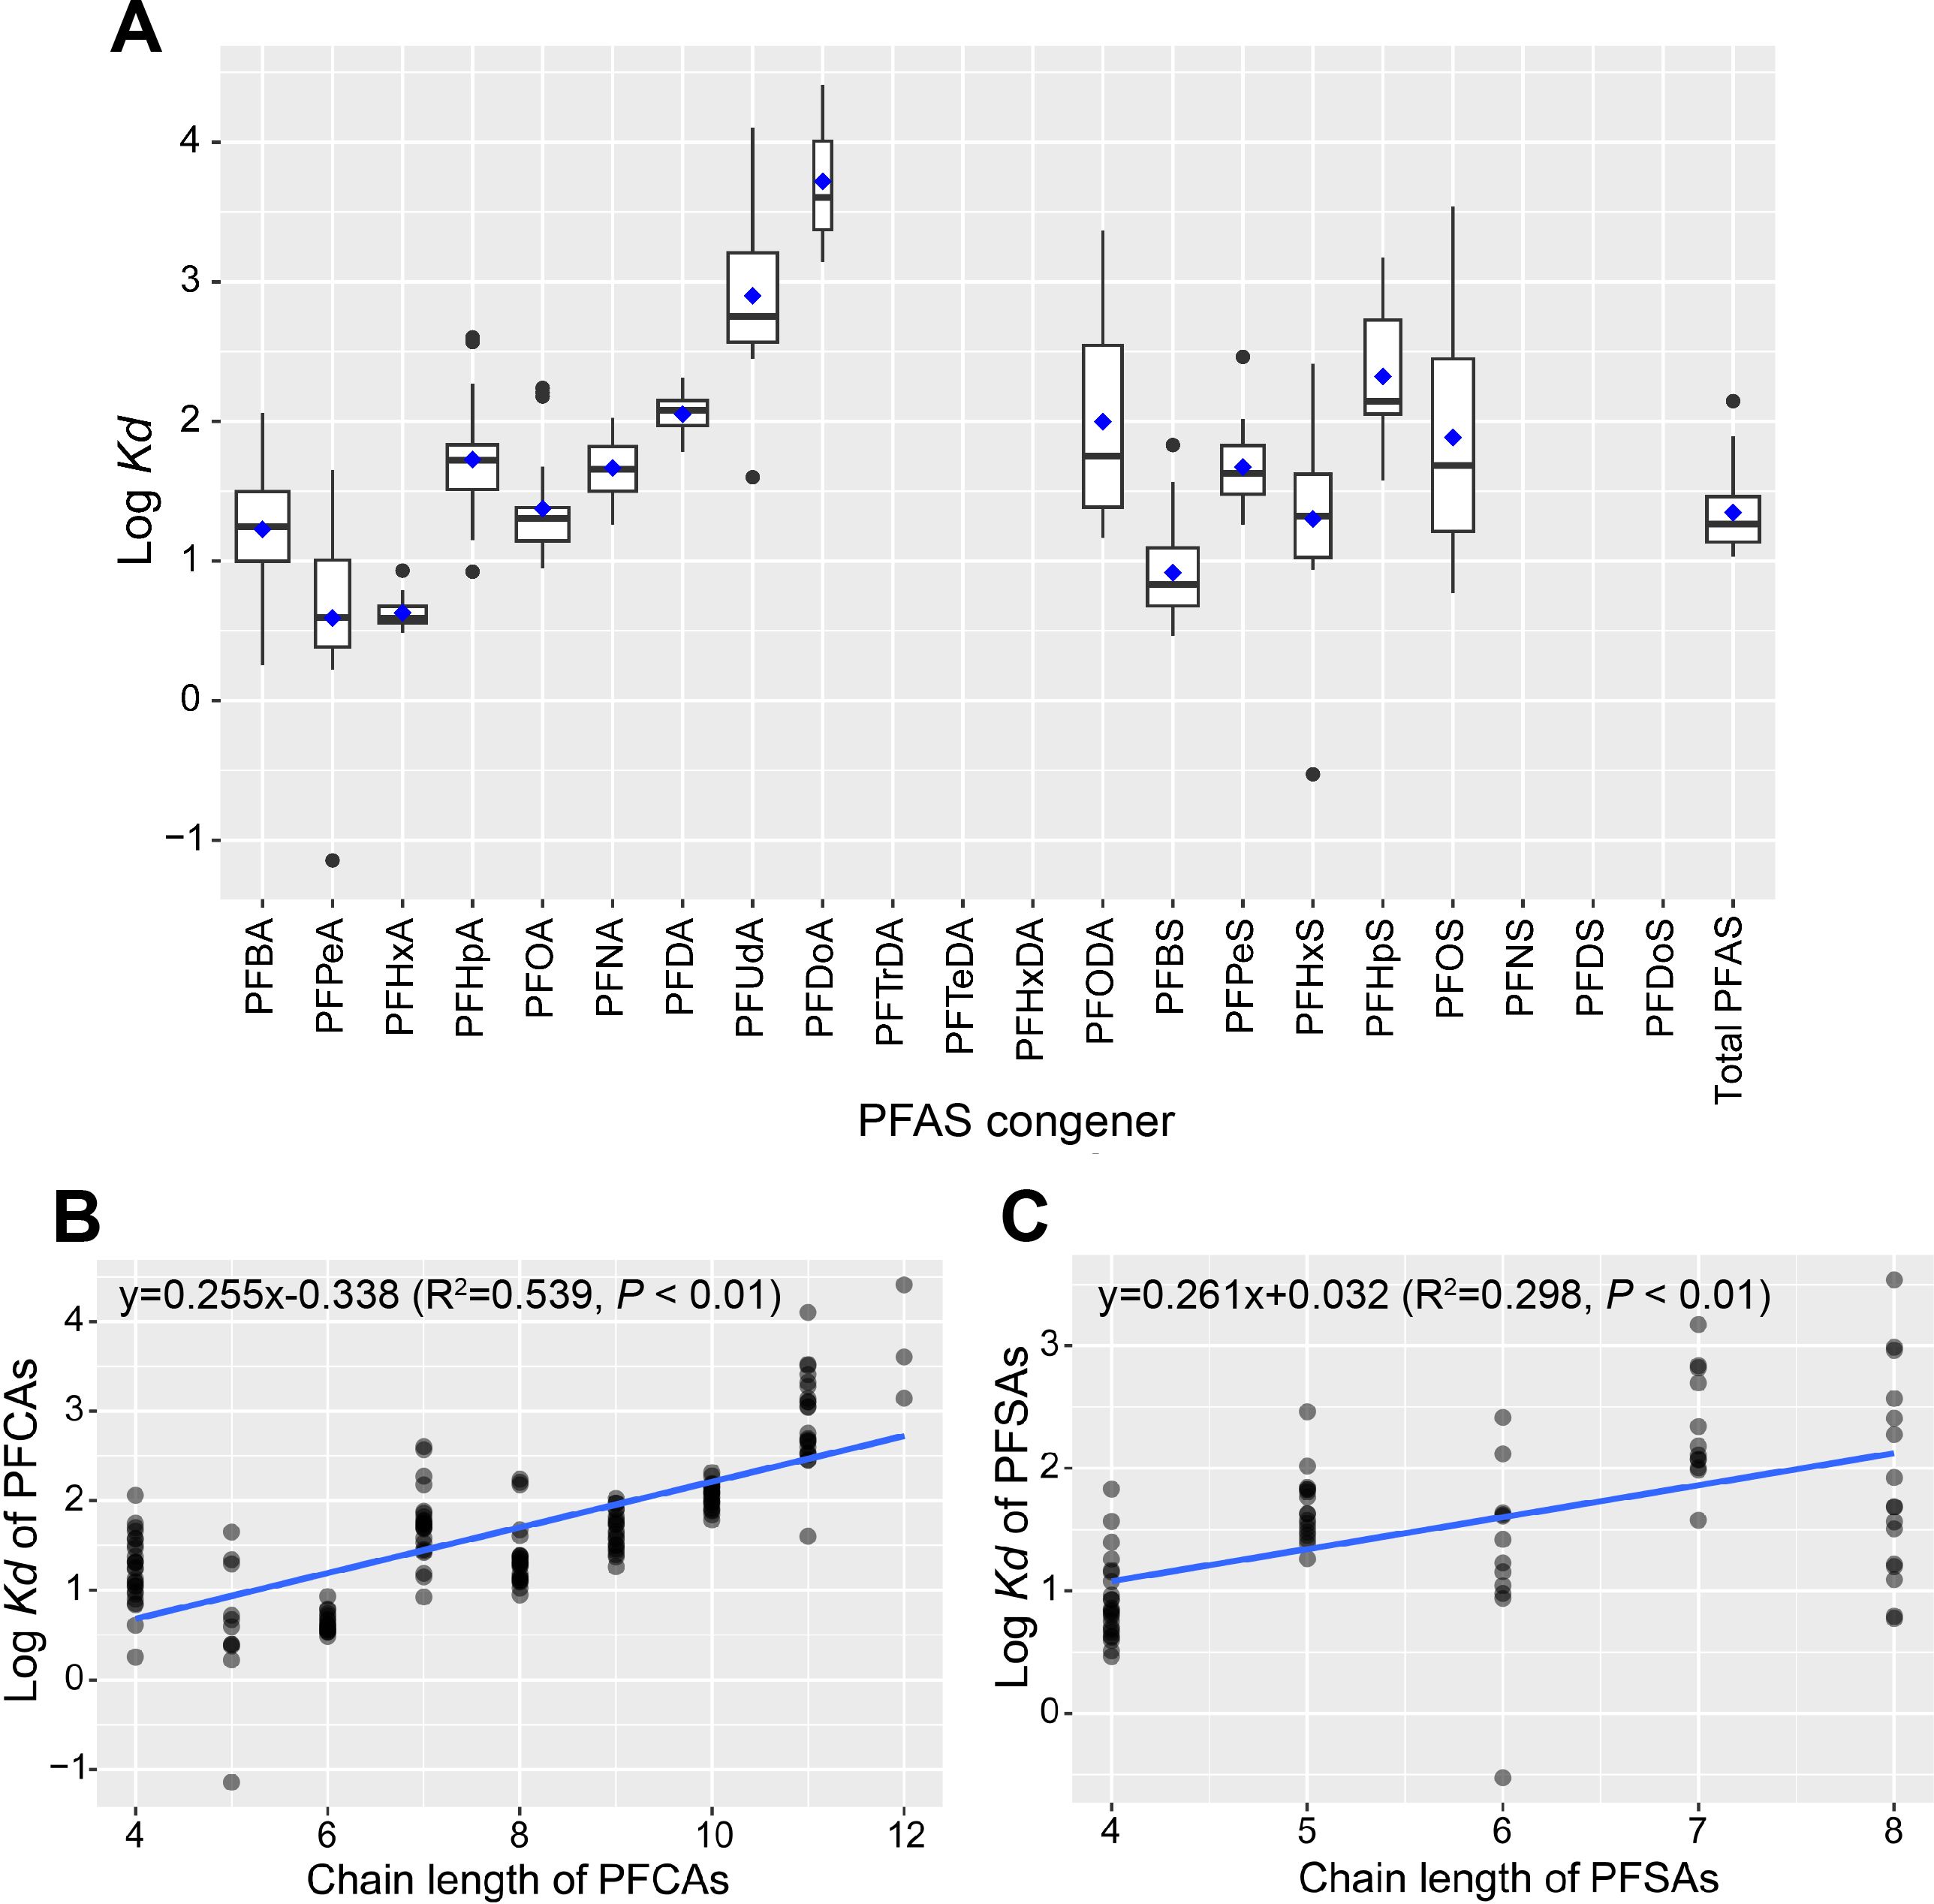
Figure 6. Log Kd values of 21 individual PFAS (A) and their relationships with chain lengths (B, C). Note that the results of PFCAs and PFSAs were arranged separately.
The log Kds of PFAS in the present study (0.59-3.72) were generally higher than the same congeners in other water basins in China, such as the Huai River (0.31-2.91) (Tao et al., 2024) and the Pearl River Basin (0.52-2.87) (Li et al., 2022), lakes in the Tibetan Plateau (0.95-2.61) (Chen et al., 2023), and were also higher than marine sediments such as the Bohai Sea (-0.17-2.90) (Meng et al., 2021), and Hangzhou Bay (1.38-3.35) (Li et al., 2024d). It was beyond the aim of this study to conduct formal comparisons between these systems, but such differences in log Kds in sediments might be an effect of local environmental conditions (e.g., DO and conductivity; Kang et al., 2019). In addition, the geological scale of the study area might have also affected the PFAS concentrations in sediment. For example, we found a significant negative relationship between ∑PFAS in sediments and the site width (R = -0.311; P< 0.05; see more details in Supplementary Information; Supplementary Table S8). However, such negative correlations were not observed in surface water. In other words, smaller rivers tend to accumulate more PFAS in sediments than larger ones, though surface water did not do so. These findings also shed light on explaining the higher log Kds in our study than the systems mentioned above because the present study system was smaller. For surface water, instantaneous point-source inputs have a greater impact on PFAS concentrations than river width (Marchiandi et al., 2021).
Unsurprisingly, the sediments and surface water differed in their relationship with river width because the presumed better-mixed condition in surface water could minimize the spatial variation within the water network. However, the nature of sediments did not support such well-mixed conditions, leading to a more diverse PFAS composition. For example, in our study, the CV of ∑PFAS in sediments (83.7%) was much higher than any CV of surface water across four seasons (14.1% to 46.3%). Such a difference between surface water and sediments suggested that we consider refined sampling strategies (e.g., more sites) to better profile the PFAS pollution pattern in sediments in such plain water networks.
3.4 Ecological risk assessment
Eight widely detected congeners, including PFBA, PFBS, PFPeA, PFOA, PFHxA (100% detected), and PFNA, PFDA, and PFOS (all considered highly toxic) were used in ecological risk assessments. The RQs in surface water were all< 0.01. However, the RQ of PFOS ranged from 4.9×10⁻⁴ to 1.2×10⁻², given the different PNECs used in the calculation (detailed RQs were available in Table 1). This suggested that, despite low absolute concentrations, the PFOS might pose the greatest threat to the aquatic organisms in the study area (Figure 7A).
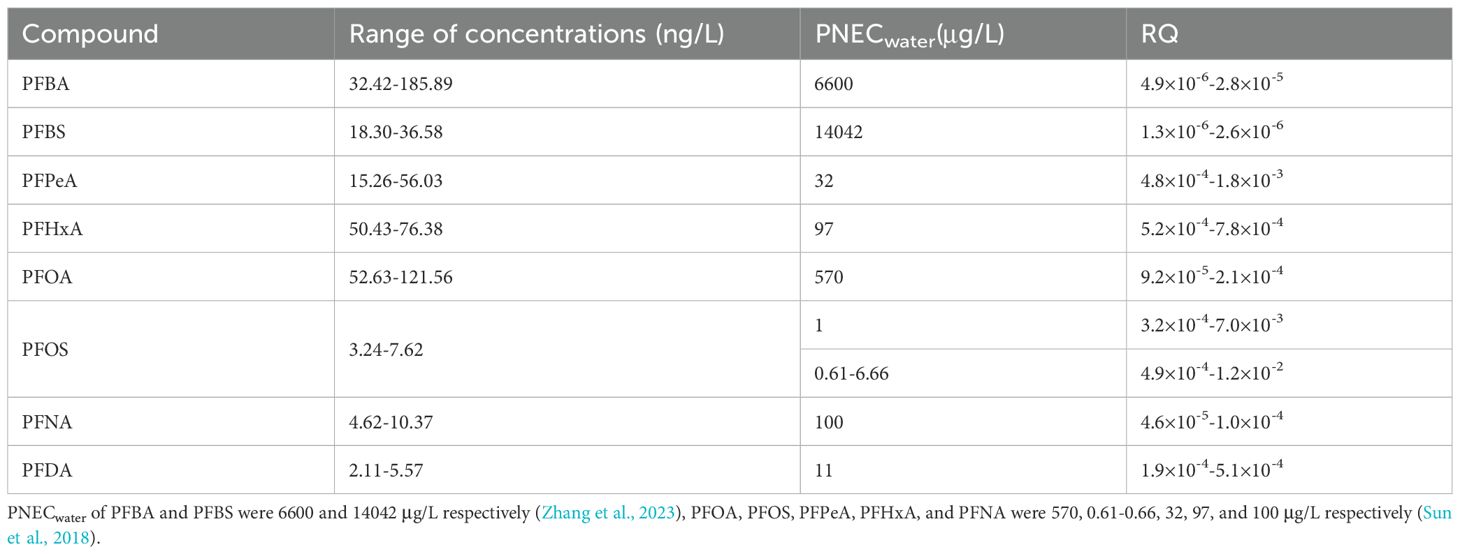
Table 1. Concentrations of individual PFAS in surface water, PNEC values, and RQ results.
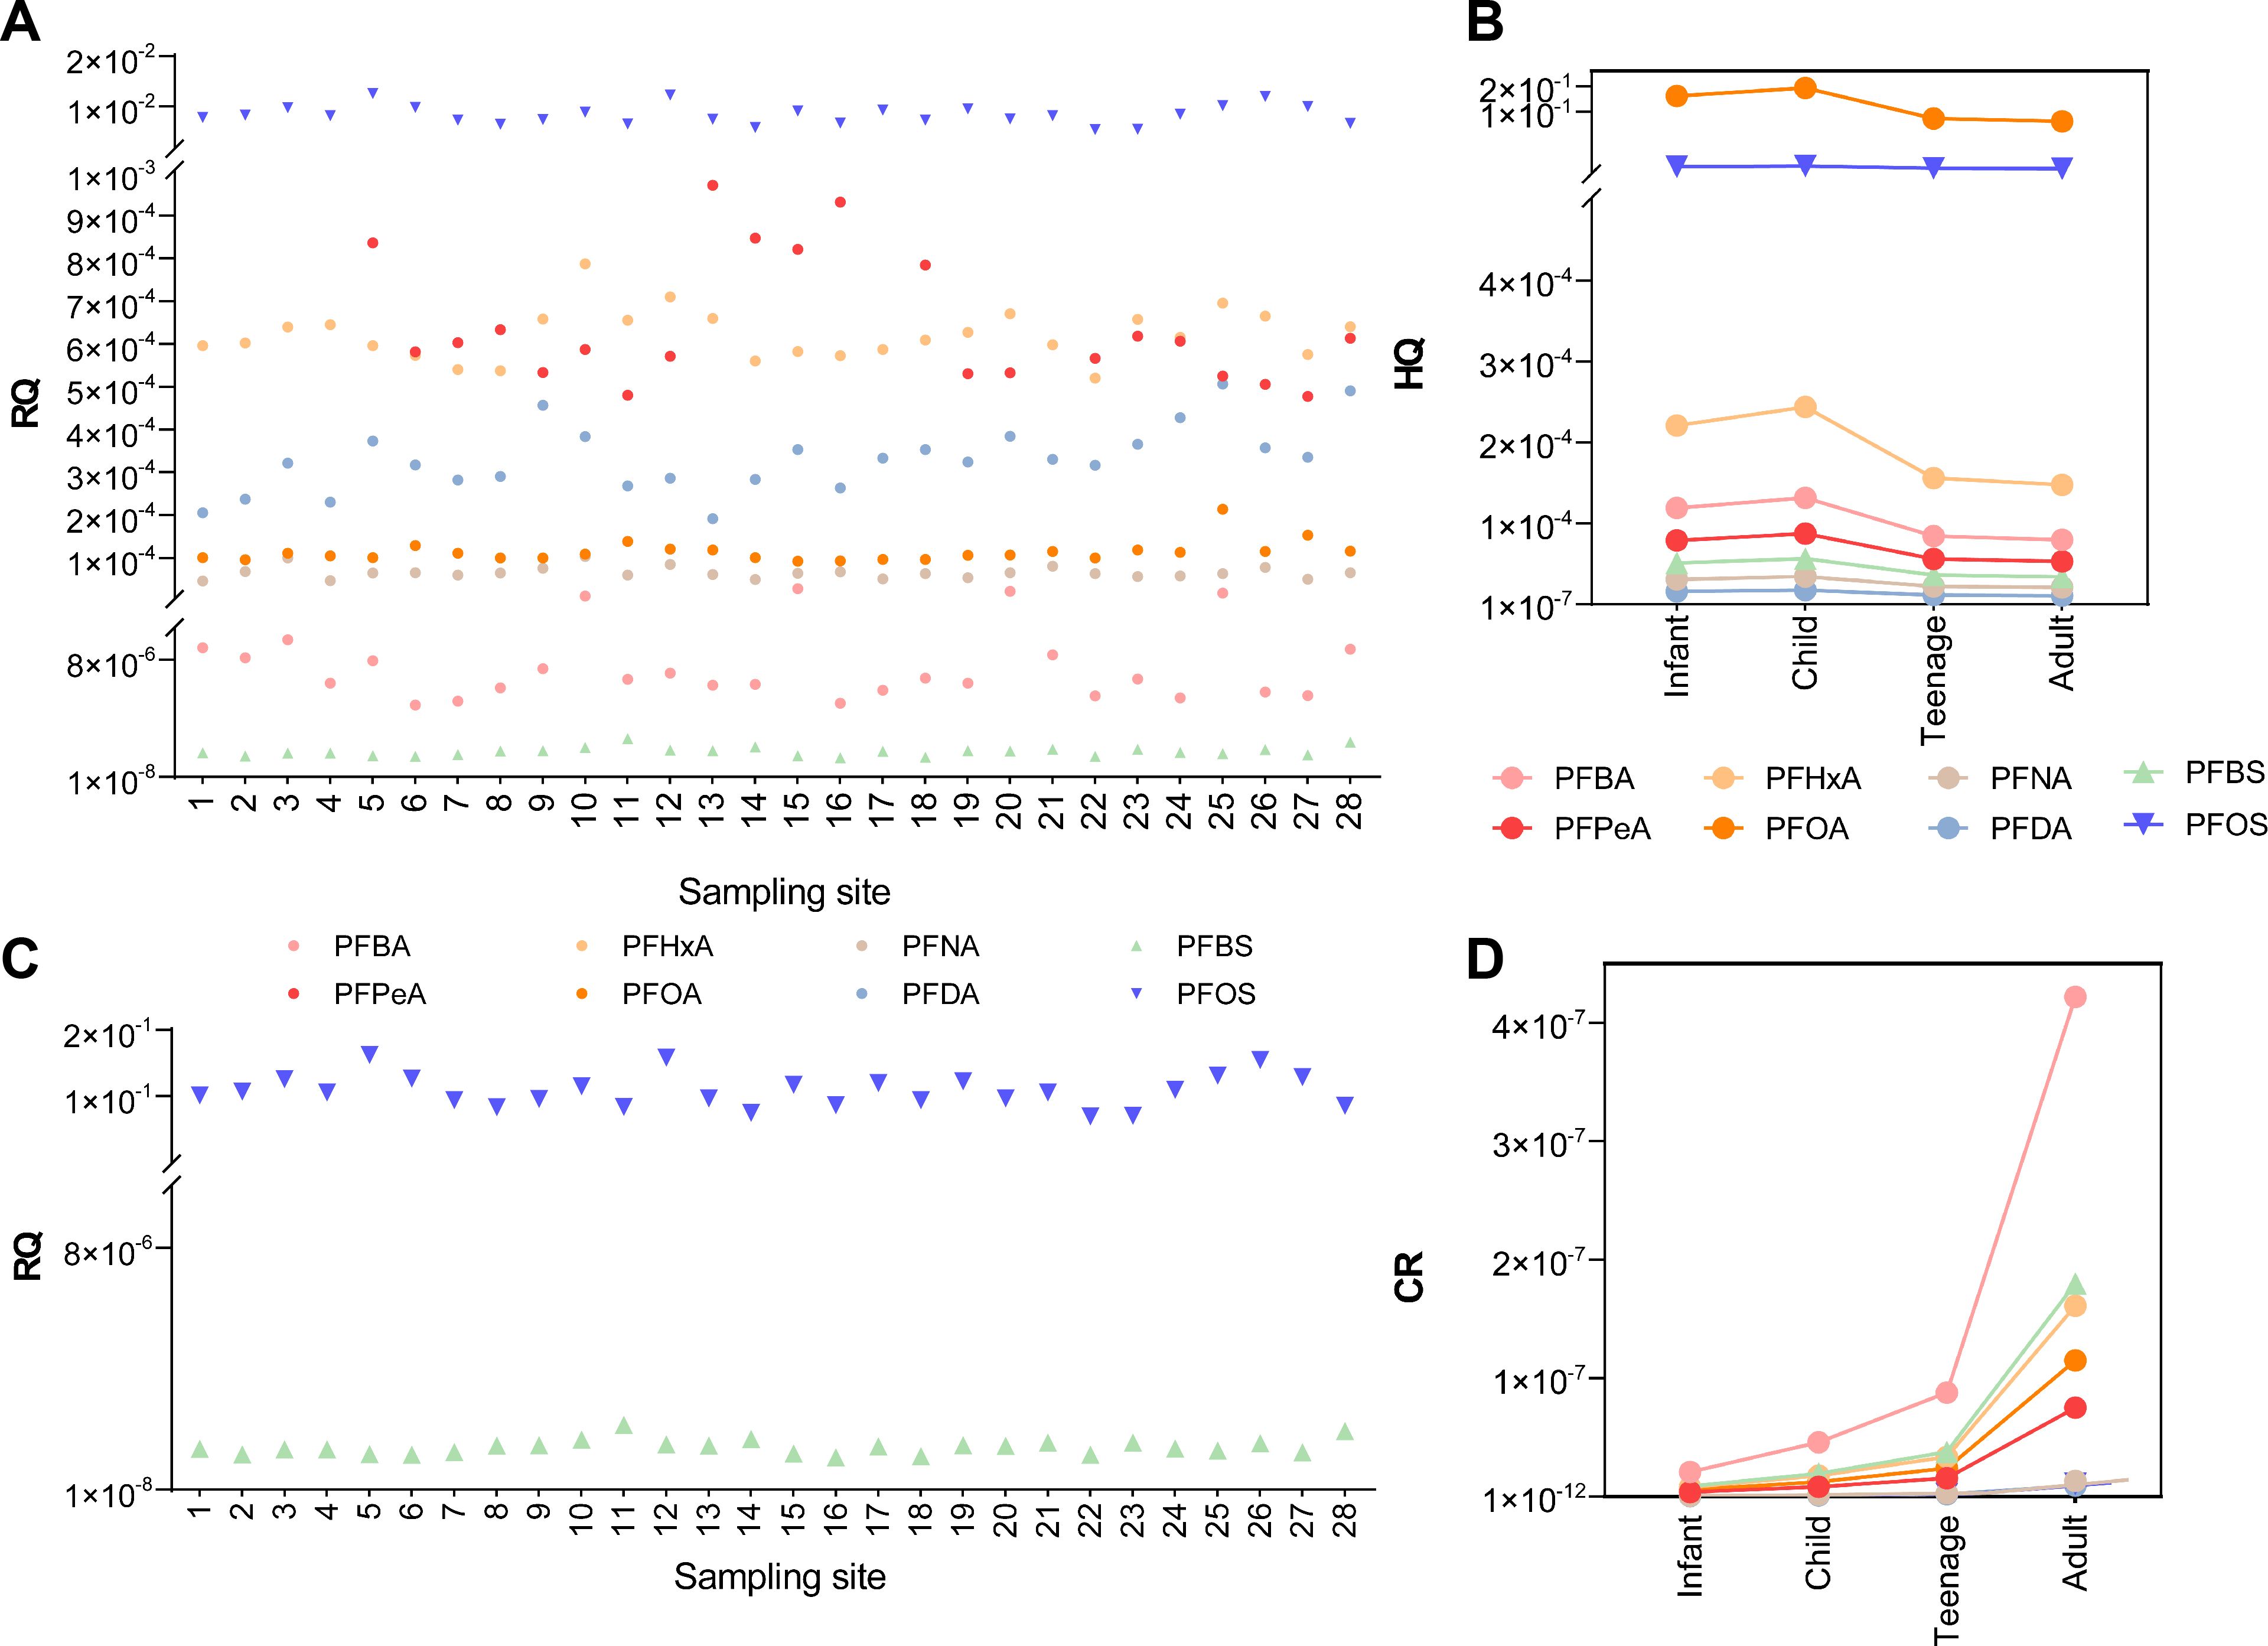
Figure 7. Ecological risk assessment results of PFAS in surface water to aquatic organisms (A) and water birds (B), respectively, and health risks assessment results for non-carcinogenic (C) and carcinogenic risk (D), respectively.
For water bird protection, a previous study reported an upper threshold of 17 mg/L and 47 ng/L for PFBS and PFOS, respectively (Sun et al., 2018). We applied these limits in our study, and the resulting RQs were 1.1-2.2×10⁻⁶ (PFBS) and 0.069 -0.16 (PFOS), respectively (Figure 7B), consistent with findings that studied several other places nearby a few years ago (Sun et al., 2018). This demonstrated that the ecological risks to aquatic biota remain generally unchanged even though fluctuations in concentrations of some congeners were apparent.
RQs were 0-1.88 or 0-3.07 for PFOS in sediments (Table 2), indicating a high risk to benthic organisms. Therefore, PFOS represented a greater threat to aquatic organisms than other congeners detected. This finding was consistent with higher PFOS risks in Bohai Sea sediments compared to seawater, and this was likely due to the lower solubility of PFOS, which allowed for greater adsorption onto solid-phase media such as sediments (Meng et al., 2021). This called more attention to PFOS in abatement or remediation strategies, particularly in sediments.
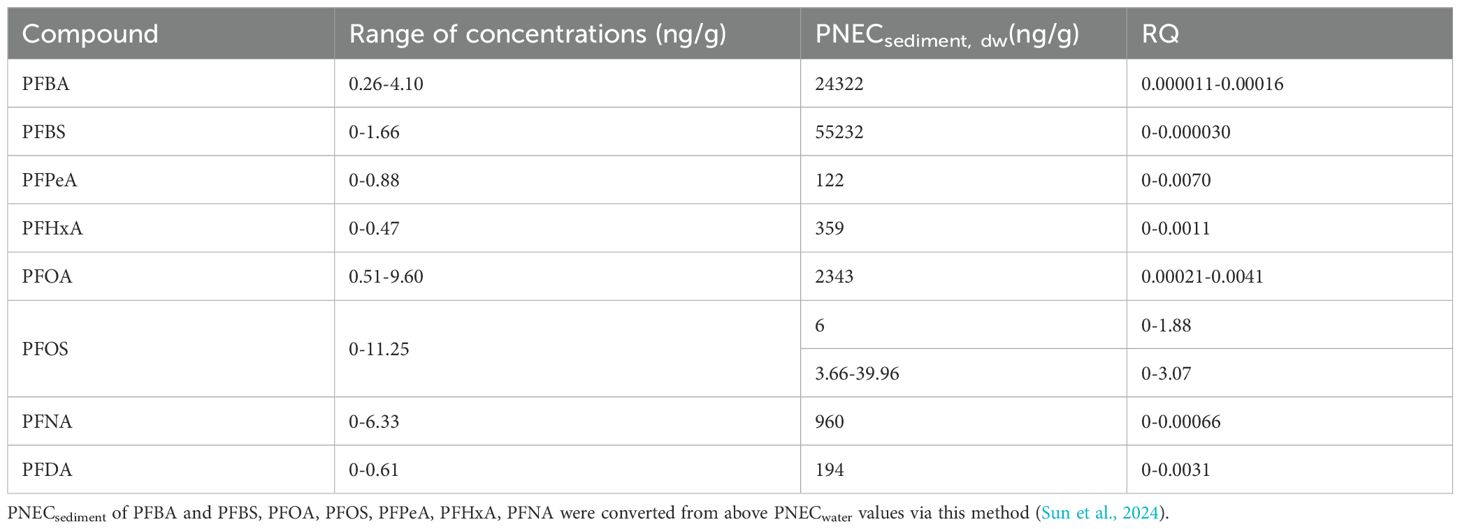
Table 2. Concentrations of individual PFAS in sediment, PNEC values, and RQ results.
3.5 Health risk assessment
Health risk assessments did not identify any non-CR or CR risks since the HQs were 0-0.17 and the CR 0-4.22×10⁻⁷ (see more details in Supplementary Tables S9 and S10; Supplementary Information). We found that HQ of PFOA was the highest among congeners, being 0.151, 0.167, 0.107, and 0.101 for infants, children, adolescents, and adults, respectively (Figure 7C). This indicated that in the study area, children had the highest non-carcinogenic risk, a finding consistent with results from the Chongqing section of the Yangtze River (Zhao et al., 2024). The PFAS posed no carcinogenic risk to all age groups. The PFBA showed a higher risk compared to other congeners, being 2.07×10⁻⁸, 4.57×10⁻⁸, 8.79×10⁻⁸, and 4.22×10⁻⁷ for infants, children, adolescents and adults, respectively, suggesting a higher carcinogenic risk for adults (Figure 7D). Together with some existing studies, our study demonstrated that short-chain PFAS, despite being used as substitutes for long-chain PFAS could pose potential risks to humans (Zhao et al., 2024).
4 Conclusions
In summary, PFAS concentrations in the selected plain water network were relatively high, dominated by PFCAs (C4-C8), PFBS, and PFOS, while longer-chain congeners were less prevalent. Notable spatial variations in sediments but not in surface water suggested that more extensive efforts should be considered in profiling PFAS pollution in sediments. PFOS in water posed a low-medium risk to water birds, while high risks of sediments PFOS to benthic organisms were identified. The health risks of assessed substances to residents could be considered negligible. Unbalanced distribution and elevated ecological risks call for more monitoring and further management of sediments (e.g., river dredging and wastewater monitoring of PFAS) in such plain water networks.
Data availability statement
The original contributions presented in the study are included in the article/Supplementary Material. Further inquiries can be directed to the corresponding authors.
Author contributions
MW: Data curation, Formal Analysis, Investigation, Methodology, Validation, Visualization, Writing – original draft. ZX: Conceptualization, Supervision, Writing – review & editing, Validation. JJ: Methodology, Validation, Writing – review & editing. HW: Validation, Writing – review & editing. HH: Writing – review & editing. XZ: Methodology, Writing – review & editing. WH: Methodology, Writing – review & editing. ML: Writing – review & editing. LG: Conceptualization, Supervision, Writing – review & editing.
Funding
The author(s) declare that financial support was received for the research and/or publication of this article. This work was financially supported by the National Key Research and Development Program of China (grant number 2023YFC3208301).
Acknowledgments
We are grateful for the constructive comments of three reviewers.
Conflict of interest
Author JJ was employed by the company China Coal Zhejiang Testing Technology Co., Ltd. Author HW was employed by the company Zhejiang Jiaoke Environment Technology Co, Ltd.
The remaining authors declare that the research was conducted in the absence of any commercial or financial relationships that could be construed as a potential conflict of interest.
Generative AI statement
The author(s) declare that no Generative AI was used in the creation of this manuscript.
Publisher’s note
All claims expressed in this article are solely those of the authors and do not necessarily represent those of their affiliated organizations, or those of the publisher, the editors and the reviewers. Any product that may be evaluated in this article, or claim that may be made by its manufacturer, is not guaranteed or endorsed by the publisher.
Supplementary material
The Supplementary Material for this article can be found online at: https://www.frontiersin.org/articles/10.3389/fmars.2025.1586800/full#supplementary-material
References
Adamson D. T., Kulkarni P. R., Nickerson A., Higgins C. P., Field J., Schwichtenberg T., et al. (2022). Characterization of relevant site-specific PFAS fate and transport processes at multiple AFFF sites. Environ. Adv. 7, 100167. doi: 10.1016/j.envadv.2022.100167
Cai Y., Wang Q., Zhou B., Yuan R., Wang F., Chen Z., et al. (2021). A review of responses of terrestrial organisms to perfluorinated compounds. Sci. Total Environ. 793, 148565. doi: 10.1016/j.scitotenv.2021.148565
Chambers W. S., Hopkins J. G., Richards S. M. (2021). A review of per- and polyfluorinated alkyl substance impairment of reproduction. Front. Toxicol. 3. doi: 10.3389/ftox.2021.732436
Chen Y., Wei L., Luo W., Jiang N., Shi Y., Zhao P., et al. (2023). Occurrence, spatial distribution, and sources of PFAS in the water and sediment from lakes in the Tibetan Plateau. J. Hazard. Mater. 443, 130170. doi: 10.1016/j.jhazmat.2022.130170
Chen C. E., Yang Y. Y., Zhao J. L., Liu Y. S., Hu L. X., Li B. B., et al. (2021). Legacy and alternative per- and polyfluoroalkyl substances (PFAS) in the West River and North River, south China: Occurrence, fate, spatio-temporal variations and potential sources. Chemosphere 283, 131301. doi: 10.1016/j.chemosphere.2021.131301
Cheng H., Jin H., Lu B., Lv C., Ji Y., Zhang H., et al. (2023). Emerging poly- and perfluoroalkyl substances in water and sediment from Qiantang River-Hangzhou Bay. Sci. Total Environ. 875, 162687. doi: 10.1016/j.scitotenv.2023.162687
Fenton S. E., Ducatman A., Boobis A., DeWitt J. C., Lau C., Ng C., et al. (2021). Per- and polyfluoroalkyl substance toxicity and human health review: current state of knowledge and strategies for informing future research. Environ. Toxicol. Chem. 40, 606–630. doi: 10.1002/etc.4890
Folorunsho O., Kizhakkethil J. P., Bogush A., Kourtchev I. (2024). Effect of short-term sample storage and preparatory conditions on losses of 18 per- and polyfluoroalkyl substances (PFAS) to container materials. Chemosphere 363, 142814. doi: 10.1016/j.chemosphere.2024.142814
Hariharan G., Sunantha G., Robin R. S., Darwin R., Purvaja R., Ramesh R. (2023). Early detection of emerging persistent perfluorinated alkyl substances (PFAS) along the east coast of India. Sci. Total Environ. 902, 166155. doi: 10.1016/j.scitotenv.2023.166155
Huang M. C., Dzierlenga A. L., Robinson V. G., Waidyanatha S., DeVito M. J., Eifrid M. A., et al. (2019). Toxicokinetics of perfluorobutane sulfonate (PFBS), perfluorohexane-1-sulphonic acid (PFHxS), and perfluorooctane sulfonic acid (PFOS) in male and female Hsd: Sprague Dawley SD rats after intravenous and gavage administration. Toxicol. Rep. 6, 645–655. doi: 10.1016/j.toxrep.2019.06.016
Huang Z., Shao Z., Shi X., He Y., Zheng X., Wang J., et al. (2024). Comprehensive eutrophication evaluation and water environment capacity analysis of Yiwu Yankou Reservoir. Environ. Sci. 45, 7074–7081. doi: 10.13227/j.hjkx.202311085
Kang M., Tian Y., Peng S., Wang M. (2019). Effect of dissolved oxygen and nutrient levels on heavy metal contents and fractions in river surface sediments. Sci. Total Environ. 648, 861–870. doi: 10.1016/j.scitotenv.2018.08.201
Khumalo S. M., Lasich M., Bakare B. F., Rathilal S. (2022). Sorption of perfluorinated and pharmaceutical compounds in plastics: a molecular simulation study. Water 14, 1951. doi: 10.3390/w14121951
Kim K. Y., Ndabambi M., Choi S., Oh J. E. (2021). Legacy and novel perfluoroalkyl and polyfluoroalkyl substances in industrial wastewater and the receiving river water: temporal changes in relative abundances of regulated compounds and alternatives. Water Res. 191, 116830. doi: 10.1016/j.watres.2021.116830
Leng Y., Xiao H., Li Z., Liu Y., Huang K., Wang J. (2021). Occurrence and ecotoxicological risk assessment of perfluoroalkyl substances in water of lakes along the middle reach of Yangtze River, China. Sci. Total Environ. 788, 147765. doi: 10.1016/j.scitotenv.2021.147765
Lenka S. P., Kah M., Padhye L. P. (2021). A review of the occurrence, transformation, and removal of poly- and perfluoroalkyl substances (PFAS) in wastewater treatment plants. Water Res. 199, 117187. doi: 10.1016/j.watres.2021.117187
Li J., Ai Y., Hu J., Xu N., Song R., Zhu Y., et al. (2020c). Polyfluoroalkyl substances in Danjiangkou Reservoir, China: occurrence, composition, and source appointment. Sci. Total Environ. 725, 138352. doi: 10.1016/j.scitotenv.2020.138352
Li J., Duan W., An Z., Jiang Z., Li L., Guo M., et al. (2024c). Legacy and alternative per- and polyfluoroalkyl substances spatiotemporal distribution in China: Human exposure, environmental media, and risk assessment. J. Hazard. Mater. 480, 135795. doi: 10.1016/j.jhazmat.2024.135795
Li F., Duan J., Tian S., Ji H., Zhu Y., Wei Z., et al. (2020a). Short-chain per- and polyfluoroalkyl substances in aquatic systems: Occurrence, impacts and treatment. In Chem. Eng. J. 38, 122506. doi: 10.1016/j.cej.2019.122506
Li Y., Feng X., Zhou J., Zhu L. (2020b). Occurrence and source apportionment of novel and legacy poly/perfluoroalkyl substances in Hai River basin in China using receptor models and isomeric fingerprints. Water Res. 168, 115145. doi: 10.1016/j.watres.2019.115145
Li L., Han T., Li B., Bai P., Tang X., Zhao Y. (2024d). Distribution control and environmental fate of PFAS in the offshore region adjacent to the Yangtze River Estuary-a study combining multiple phases analysis. Environ. Sci. Technol. 58, 15779–15789. doi: 10.1021/acs.est.4c03985
Li J., Li X., An R., Duan L., Wang G. (2024b). Occurrence, source apportionment, and ecological risk of legacy and emerging per- and poly-fluoroalkyl substances (PFAS) in the Dahei river basin of a typical arid region in China. Environ. Res. 246, 118111. doi: 10.1016/j.envres.2024.118111
Li W., Li H., Zhang D., Tong Y., Li F., Cheng F., et al. (2022). Legacy and emerging per- and polyfluoroalkyl substances behave distinctly in spatial distribution and multimedia partitioning: a case study in the Pearl River, China. Environ. Sci. Technol. 56, 3492–3502. doi: 10.1021/acs.est.1c07362
Li J., Liang E., Xu X., Xu N. (2024a). Occurrence, mass loading, and post-control temporal trend of legacy perfluoroalkyl substances (PFAS) in the middle and lower Yangtze River. Marine Pollut. Bull. 199, 115966. doi: 10.1016/j.marpolbul.2023.115966
Liang X., Zhou J., Yang X., Jiao W., Wang T., Zhu L. (2023). Disclosing the bioaccumulation and biomagnification behaviors of emerging per/polyfluoroalkyl substances in aquatic food web based on field investigation and model simulation. J. Hazard. Mater. 445, 130566. doi: 10.1016/j.jhazmat.2022.130566
Lipczynska-Kochany E. (2018). Effect of climate change on humic substances and associated impacts on the quality of surface water and groundwater: a review. Sci. Total Environ. 640–641, 1548–1565. doi: 10.1016/j.scitotenv.2018.05.376
Marchiandi J., Szabo D., Dagnino S., Green M. P., Clarke B. O. (2021). Occurrence and fate of legacy and novel per- and polyfluoroalkyl substances (PFAS) in freshwater after an industrial fire of unknown chemical stockpiles. Environ. Pollut. 278, 116839. doi: 10.1016/j.envpol.2021.116839
Mbanugo V. S., Ojo B. S., Lin T. C., Huang Y. W., Locmelis M., Han D. (2025). Per- and polyfluoroalkyl substance (PFAS) degradation in water and soil using cold atmospheric plasma (CAP): a review. ACS Phys. Chem. Au 5, 117–133. doi: 10.1021/acsphyschemau.4c00092
Meng L., Song B., Zhong H., Ma X., Wang Y., Ma D., et al. (2021). Legacy and emerging per- and polyfluoroalkyl substances (PFAS) in the Bohai Sea and its inflow rivers. Environ. Int. 156, 106735. doi: 10.1016/j.envint.2021.106735
Mumtaz M., Bao Y., Liu L., Huang J., Cagnetta G., Yu G. (2019). Per- and polyfluoroalkyl substances in representative fluorocarbon surfactants used in chinese film-forming foams: levels, profile shift, and environmental implications. Environ. Sci. Technol. Lett. 6, 259–264. doi: 10.1021/acs.estlett.9b00154
Paige T., Silva D. T., Buddhadasa S., Prasad S., Nugegoda D., Pettigrove V. (2024). Background concentrations and spatial distribution of PFAS in surface waters and sediments of the greater Melbourne area, Australia. Chemosphere 349, 140791. doi: 10.1016/j.chemosphere.2023.140791
Pan C. G., Ying G. G., Zhao J. L., Liu Y. S., Jiang Y. X., Zhang Q. Q. (2014). Spatiotemporal distribution and mass loadings of perfluoroalkyl substances in the Yangtze River of China. Sci. Total Environ. 493, 580–587. doi: 10.1016/j.scitotenv.2014.06.033
Sun Y., Shen N., Zhang D., Chen J., He X., Ji Y., et al. (2024). Occurrence, spatial distribution, sources and risk assessment of per- and polyfluoroalkyl substances in surface sediments of the Yellow River Delta Wetland. J. Ocean Univ. China 23, 1263–1274. doi: 10.1007/s11802-024-5931-3
Sun Z., Wen Y., Wang B., Deng S., Zhang F., Fu Z., et al. (2023). Toxic effects of per- and polyfluoroalkyl substances on sperm: epidemiological and experimental evidence. Front. Endocrinol. 14. doi: 10.3389/fendo.2023.1114463
Sun R., Wu M., Tang L., Li J., Qian Z., Han T., et al. (2018). Perfluorinated compounds in surface waters of Shanghai, China: source analysis and risk assessment. Ecotoxicol. Environ. Saf. 149, 88–95. doi: 10.1016/j.ecoenv.2017.11.012
Surma M., Sznajder-Katarzyńska K., Wiczkowski W., Piskuła M., Zieliński H. (2023). Detection of per-and polyfluoroalkyl substances in high-protein food products. Environ. Toxicol. Chem. 42, 2589–2598. doi: 10.1002/etc.5743
Tao Y., Pang Y., Luo M., Jiang X., Huang J., Li Z. (2024). Multi-media distribution and risk assessment of per- and polyfluoroalkyl substances in the Huai River Basin, China. Sci. Total Environ. 914, 169581. doi: 10.1016/j.scitotenv.2023.169581
Vierke L., Staude C., Biegel-Engler A., Drost W., Schulte C. (2012). Perfluorooctanoic acid (PFOA) - main concerns and regulatory developments in Europe from an environmental point of view. Environ. Sci. Europe 24, 16. doi: 10.1186/2190-4715-24-16
Viticoski R. L., Wang D., Feltman M. A., Mulabagal V., Rogers S. R., Blersch D. M., et al. (2022). Spatial distribution and mass transport of Perfluoroalkyl Substances (PFAS) in surface water: a statewide evaluation of PFAS occurrence and fate in Alabama. Sci. Total Environ. 836, 155524. doi: 10.1016/j.scitotenv.2022.155524
Xing Y., Li Q., Chen X., Fu X., Ji L., Wang J., et al. (2021). Different transport behaviors and mechanisms of perfluorooctanoate (PFOA) and perfluorooctane sulfonate (PFOS) in saturated porous media. J. Hazard. Mater. 402, 123435. doi: 10.1016/j.jhazmat.2020.123435
Yao J., Sheng N., Guo Y., Yeung L. W. Y., Dai J., Pan Y. (2022). Nontargeted identification and temporal trends of per- and polyfluoroalkyl substances in a fluorochemical industrial zone and adjacent Taihu Lake. Environ. Sci. Technol. 56, 7986–7996. doi: 10.1021/acs.est.2c00891
Zarębska M., Bajkacz S., Hordyjewicz-Baran Z. (2024). Assessment of legacy and emerging PFAS in the Oder River: occurrence, distribution, and sources. Environ. Res. 251, 118608. doi: 10.1016/j.envres.2024.118608
Zhang Y. H., Ding T. T., Huang Z. Y., Liang H. Y., Du S. L., Zhang J., et al. (2023). Environmental exposure and ecological risk of perfluorinated substances (PFAS) in the Shaying River Basin, China. Chemosphere 339, 139537. doi: 10.1016/j.chemosphere.2023.139537
Zhang Y., Liu X., Yu L., Hua Z., Zhao L., Xue H., et al. (2022). Perfluoroalkyl acids in representative edible aquatic species from the lower Yangtze River: Occurrence, distribution, sources, and health risk. J. Environ. Manage. 317, 115390. doi: 10.1016/j.jenvman.2022.115390
Zhao J., Guo C., Yang Q., Liu W., Zhang H., Luo Y., et al. (2024). Comprehensive monitoring and prioritizing for contaminants of emerging concern in the Upper Yangtze River, China: an integrated approach. J. Hazard. Mater. 480, 135835. doi: 10.1016/j.jhazmat.2024.135835
Zhao P., Xia X., Dong J., Xia N., Jiang X., Li Y., et al. (2016). Short- and long-chain perfluoroalkyl substances in the water, suspended particulate matter, and surface sediment of a turbid river. Sci. Total Environ. 568, 57–65. doi: 10.1016/j.scitotenv.2016.05.221
Keywords: PFAS, surface water, sediment, water quality, ecological risks, health risks, management
Citation: Wang M-M, Xia Z, Jiang J, Wu H, Huang H, Zhang X, Hong W-J, Li M and Guo L-H (2025) Per- and polyfluoroalkyl substances in coastal plain water network areas: shifting management focus to sediments. Front. Mar. Sci. 12:1586800. doi: 10.3389/fmars.2025.1586800
Received: 03 March 2025; Accepted: 11 April 2025;
Published: 06 May 2025.
Edited by:
Youji Wang, Shanghai Ocean University, ChinaCopyright © 2025 Wang, Xia, Jiang, Wu, Huang, Zhang, Hong, Li and Guo. This is an open-access article distributed under the terms of the Creative Commons Attribution License (CC BY). The use, distribution or reproduction in other forums is permitted, provided the original author(s) and the copyright owner(s) are credited and that the original publication in this journal is cited, in accordance with accepted academic practice. No use, distribution or reproduction is permitted which does not comply with these terms.
*Correspondence: Zhiqiang Xia, eGlhemhpcWlhbmdAaG90bWFpbC5jb20=; Liang-Hong Guo, bGhndW9AdWNhcy5hYy5jbg==