 Yong-Fei Zhang
 Ping Xiang†
 Shi-Jian Fu
- Laboratory of Evolutionary Physiology and Behavior, Chongqing Key Laboratory of Conservation and Utilization of Freshwater Fishes, Animal Biology Key Laboratory of Chongqing Education Commission, Chongqing Normal University, Chongqing, China
The responses of stress tolerance and other critical physiological functions of fish species to temperature fluctuations, and the potential relationships with their thermal history and natural habitat conditions, are vital for future population dynamic and distribution. In the present study, the thermal and hypoxia tolerance capacities, oxygen uptake capacity, swimming capacity and energy metabolism traits of two tropical and two temperate fish species acclimated at three temperatures were measured. Two tropical species exhibited much poorer cold tolerance than temperate species as expected. However, irrespective of thermal history, the two species preferred small and stagnant waterbody habitats exhibited greater heat tolerance capacity, lower swimming capacity, higher oxygen supply capacity. hence, higher hypoxia tolerance than the two species preferred to open waterbody. As anticipated, thermal tolerance capacity changed in parallel with acclimation temperature. However, hypoxia tolerance appeared to be the least sensitive to the acclimation temperature, suggesting it is the vital and conservative physiological function for aquatic breathe animals. One of the underlying mechanisms is the parallel increase in oxygen supply capacity with the increased energy and oxygen demanding by higher acclimation temperatures. All variables involved swimming capacity and metabolic parameters were more sensitive in the two tropical species, whereas one eury-thermal species was the least sensitive to temperature change. Moreover, the present study also suggests that in some species, maximum metabolic rate elicited by locomotion and digestion might exhibit different temperature sensitivity ranges, possibly as a result of long-term evolution in response to either habitat environment or life history traits. Nevertheless, the present study suggests that the difference in stress tolerance and other physiological functions, and their sensitivity to temperature, are shaped by both thermal history and habitat conditions. It provides important information for field conservation and the fisheries industry.
1 Introduction
As a result of continued destruction by human activities and dramatic changes in natural climatic conditions, global temperatures are expected to vary by 0 - 6°C across different latitudes, times of day, and seasons, accompanied by phenomena such as an increase in hot days (D’Amato and Akdiş, 2020; Varela et al., 2023; Benz et al., 2024). Changes in the environment temperature of aquatic habitats (lakes, rivers, oceans, et al.) directly and broadly impact aquatic organisms such as fish (Miranda et al., 2020; Scherer et al., 2023). The effect of temperature on fish has been documented for long times ago. Changes in water temperature can lead to changes in stress tolerance, locomotor activity, metabolism and growth performance of fish (Zhou et al., 2019; Lindmark et al., 2022; Tien et al., 2024). These changes are complex and accompany the process of adaptation of fish to their habitat conditions: increasing water temperatures directly affect their metabolic levels and resilience, which in turn alters their energy allocation and habitat survival strategies, with consequences for their geographical distribution, species survival, and reproduction (Deutsch et al., 2015; Lefevre et al., 2021).
Fish have evolved their thermal tolerances over long periods within habitats that match their ambient temperatures. However, intensified anthropogenic impacts on aquatic thermal regimes have begun pushing fish thermal tolerance thresholds to critical levels, with this pressure projected to escalate in the near future. The thermal tolerance experience of fish largely influences the ability to adapt to environmental temperature changes (Larios-Soriano et al., 2021; Olsen et al., 2021). It affects their geographic distribution characteristics, interspecific relationships, and life history responses by shaping and modifying thermal tolerance, with the fish’s phylogeny background also playing a role (Jarić et al., 2018; Riesch et al., 2018; Molina et al., 2024). In addition, thermal adaptability, i.e., phenotypic plasticity in responses to environmental temperature changes, is also critical for fish to cope effectively with temperature fluctuations and reduce individual sensitivity (Morgan et al., 2022). The acclimation response ratio (ARR) is an important indicator of the plasticity of the organism’s thermal adaptation (Ruthsatz et al., 2024). Critical temperature (CTmax, CTmin) is defined as the temperature at which fish lose equilibrium or exhibit behavioral malfunction during the experiment, thereby characterizes the limit temperature at which normal behavior and escape ability can be maintained; Lethal temperature (LTmax, LTmin) is the temperature at which fish opercula movements stops or no response to tail stimulation (Zhang et al., 2024). Generally, acclimation temperature affects thermal tolerance of fish, showing a parallel change over a certain temperature range.
Hypoxia tolerance capacity is a vital physiological function for aquatic breathe animals (Zhang et al., 2024). For fish, increased temperatures are often accompanied by reduced oxygen level in the water, and the interaction between these factors is a major test of fish resilience. Fish can mitigate the effects of moderate environmental hypoxia by increasing their respiratory rate hence maintaining the stable of the metabolism. However, under extreme hypoxic conditions, most fish species exhibit metabolic depression and lose of behavioral function (Richards, 2010, 2011). The oxygen tension at which fish cannot maintain their body equilibrium (Ploe) is one of the most reliable indicators for hypoxia tolerance in fish species (Ekström et al., 2021). It has been suggested that the hypoxia tolerance is largely determined by the oxygen uptake capacity (Seibel et al., 2021). The reaction norm of hypoxia tolerance and oxygen uptake capacity in response to environmental temperature are shaped by long-tern evolution, potentially determining the fate of field populations as aquatic habitats now experience dramatic fluctuations in temperature and oxygen tension.
Swimming performance is vital for fish due to its role in foraging, escaping and other routine activities (Becker and Genoway, 1979; Fu et al., 2022; Cai et al., 2023). Similarly, ingestion hence digestion is also an important physiological activity that provide the nutrients and energy necessary for survival. Energy metabolism, a key physiological characteristic of fish activity, characterizes the rate at which an animal can acquire food resources from the environment and convert them into energetic compounds for carrying out its routine activities. This process is affected by abiotic factors, such as temperature. The minimum level of energy metabolism required to maintain the most basic physiological activities of fish is referred to as the standard metabolic rate (SMR), below which normal physiological functioning of fish is impaired. On the contrary, maximum metabolic rate (MMR), i.e., the metabolic ceiling for fish species has been suggested can elicited by locomotion, either alone or combined with other physiology activities (Fu et al., 2022). Thus, a fish’s swimming ability would be highly correlated with its MMR. Similarly, the metabolic profile during digestion, termed as specific dynamic action (SDA) has also been documented (Chabot et al., 2016). It includes all the energy expenditures related to nutritional metabolism, such as food digestion, absorption, transformation and growth processes. The higher peak metabolic rate during SDA (PMR) usually indicates higher digestion performance, which ensure a fast digestion process either at inter- or inner-species levels (Fu et al., 2022). Investigation of responses of swimming performance and digestive function to acclimation temperature among difference species have important implication in both fisheries industry and species conservation.
Although the effects of temperature on fish physiology have been widely studied, the extent to which thermal history and contemporary habitat conditions (such as flow regime, temperature, and oxygen dynamics) jointly shape the physiology responses of fish still requires further investigation. Thus, the main goals of the present study are to investigate the possible differences in stress tolerance, and key physiological functions such as locomotion and digestion, especially their reaction norm to acclimation temperature among species with different thermal histories and habitat conditions. To achieve our goals, we selected two common tropical species, i.e., tilapia (Oreochromis niloticus) and cichlid (Sciaenochromis fryeri); and two temperate species, i.e., qingbo (Spinibarbus sinesis) and goldfish (Carassius auratus). Both tropical species are from Perciformes, whereas both temperate species belong to Cypriniforms. Furthermore, both O. niloticus and C. auratus inhabit small and stagnant waterbodies, while the other two species preferred to open waterbody.
2 Materials and methods
2.1 Acquisition and domestication of experimental fish
All experimental fish were juveniles purchased from local farms. Initially, fish were domesticated in a customized aquaculture system (Shanghai Haisheng Biological Experimental Equipment Co., Ltd, dimensions: L×W×H=45 cm×35 cm×30 cm, N = 18) for 14 days. During domestication, the photoperiod was L:D = 13:11 h, dissolved oxygen was near saturated (>7 mg O2/L), and the fish were fed once daily at 10:00 a.m. with Tongwei fish puffed feed (Tongwei, Chengdu, Sichuan Province, China, composed: 43.4% ± 0.9% protein, 8.9% ± 0.6% lipids, and 24.7% ± 1.1% carbohydrates). Water temperature was maintained at 25 ± 0.5°C.
2.2 Experimental design
For each species, 55–63 individuals were divided into three acclimation temperature groups, i.e., 20, 25, 30 °C. The water temperature either increased or decreased to the target temperature by 1 °C per day (Desforges et al., 2023). Then fish were rearing at the respective temperature for four weeks under the same conditions as during domestication (except for the temperature). After four - week temperature acclimation and withholding of food for 24 h, 32–60 individuals were selected for the experimental measurements of either stress tolerance or physiological performances, as detailed in Figure 1.

Figure 1. Diagram illustrating the experimental design.
2.3 Thermal tolerance measurement
Thermal tolerance was determined using the critical temperature method (Becker and Genoway, 1979; Zhou et al., 2019; Desforges et al., 2023). A group of six individuals with 24 h fasting was transferred into the experimental device. The details of the device were described previously (Zhang et al., 2024). Briefly, the device was a wire mesh fence cell (L × W × H = 11.5 cm × 9.5 cm × 15 cm), which was suspended in a 30 L tank, with a pump at the bottom of the tank to circulate and mix the water body. The experimental fish were allowed to be recovered for 1 h in the device. After recovery, water temperature was either increased or decreased at a constant rate of 0.3 °C/min using a chiller (1.5 P) or an adjustable power heater (3000 W) (Desforges et al., 2023). Continuous aeration ensured sufficient dissolved oxygen. The water temperature was monitored by a precision thermometer. The temperature at which the fish lost equilibrium for 10 s was taken as the critical temperature (CTmax or CTmin); the temperature at which opercular movements ceased for 10 s or the fish failed to respond to tail stimulation was taken as the lethal temperature (LTmax or LTmin) (Lutterschmidt and Hutchison, 1997; Desforges et al., 2023; Zhang et al., 2024). Subsequently, the weight and length of the experimental fish were measured (Supplementary Table 1).
The acclimation response rate (ARR), an important indicator of the plasticity of thermal adaptation (Claussen, 1977; Yanar et al., 2019), was calculated as follows (CTmax is used as an example):
where ΔCTmax and ΔT are the differences between the critical temperature and the acclimation temperature (°C) under different acclimation temperature conditions, respectively.
2.4 Hypoxia tolerance measurement
Hypoxia tolerance was measured using an intermittent respirometer as described previously (Chen et al., 2019). Prior to the measurement, fish were allowed a 1 - h recovery period in chambers (volume = 0.59 L) with continuous water exchange via an external circulating pump to ensure sufficient oxygen. During measurements, the external circulating pump was switched off while the internal recirculating pump keeping running to mix the water in the chamber. Thereafter, the oxygen tension in the respiration chamber was measured using a dissolved oxygen meter (Hash HQ 30d, Hash Inc., USA) and recorded at 2 min interval until the oxygen tension at which the experimental fish lose their body equilibrium (Ploe). Afterwards, the weight and length were measured (Supplementary Table 1).
The oxygen uptake capacity was measured along with the Ploe, the same as in the previous study (Huang et al., 2024), which was calculated as follows:
where DOk and DOk+1 are the dissolved oxygen values (mg O2/L) at measurement times k and k+1, V(L) is the difference between the respiratory chamber’s volume and the fish’s volume, m is the weight of the experimental fish (kg), t is the time interval between measurements (1/30 h, i.e., 2 min), and PO2 is the oxygen tension at measurement time k+1. The mean of three highest consecutive values (recorded at 2 - min intervals) was used as the oxygen supply capacity, i.e. α (Seibel et al., 2021; Huang et al., 2024).
2.5 Measurement of SDA and SMR
The metabolism was measured by an intermittent respirometer, which were fully described in Zhang et al. (2025). Briefly, The system comprises 10 chambers and operates in two modes: water exchange and metabolic assay. During the water exchange period, the external circulating pump was activated to rapidly replace the chamber water (>99% replacement in 2 min); during the metabolic assay period, the external circulating pump was turned off while the internal circulating pump keeping in operation to ensure the homogeneity of the water inside the chamber. The respiratory chamber was sealed off. During this period, the ambient oxygen pressure in the closed chamber was measured every 20 s using a multichannel dissolved oxygen meter (Oxy-10SMA, PreSens, Germany) and stored via accompanying software. In this experiment, two sizes of respiratory chambers (i.e. 0.325 L or 0.220 L) and both 8 - min and 12 - min metabolic assay period were used depending on the metabolic rate and body size of experimental fish. Metabolic rate (ṀO2) was calculated as follows:
where K and Ko are the rates of dissolved oxygen decrease per unit time (mg O2 L-1 h-1) in the experimental and blank chambers, respectively. V is the difference between the total chamber volume and the fish volume (L), and m is the weight of the experimental fish (kg).
The specific dynamic action procedure was as follows: Fish individuals were allowed to feed to apparent satiation in the rearing tank for a period of 30 min (Meal size is presented in Table 1). Then fish were transferred to the above - mentioned respirometer for measurement of ṀO2 (one fish in each of 9 chambers, with one empty chamber for bacterial oxygen consumption). The measurement was started immediately after the fish were transferred to the chamber and continued for 48 h. The first 24 h were used to determine the feeding metabolism, i.e. SDA (with the highest metabolic rate during this period taken as PMR). The last 24 h were used to determine the resting metabolic level (SMR), defined as the average of the lowest 10% of data of all measurements.
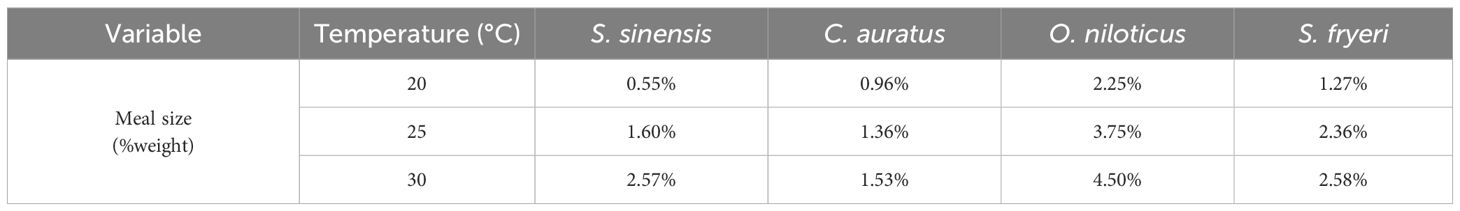
Table 1. The meal size for measurement of specific dynamic action in four fish species.
2.6 Measurement of Ucat and MMR
Ucat was measured using a Blazka-type swimming tunnel, see previous study for details (Wang et al., 2016). Briefly, after PMR measurement, experimental fish were transferred to the tunnel and allowed to be recovered for 1 h at 5 cm s-1 velocity. Subsequently, the water velocity was increased at an acceleration of approximately 10 cm per minute until the experimental fish exhausted and stayed at the end of the tunnel for 15 s (the whole process was completed within 10 min). The corresponding velocity was recorded as the value of Ucat.
After the measurement of Ucat, the exhausted individual was transferred to a closed metabolic respirometer for MMR determination (Zhang et al., 2024). A circulating water pump in the respiratory chamber ensured the water homogeneity. The dissolved oxygen in the respiration chamber was measured using a dissolved oxygen meter (Hash HQ 30d, Hash Inc., USA) at 10 s interval for a period of 5 min (sufficient to capture the peak value elicited by exhaustive exercise in fish). Then, the weight and length of the experimental fish were recorded (Supplementary Table 2).
Dissolved oxygen level was linearly fitted to the measurement time to obtain the slope S (mg O2 L-1 s-1). the bacterial oxygen consumption in the tubes was measured before the first and after the last measurement of each day, and the average slope was taken as the slope value of bacterial oxygen consumption (So). The formula was calculated as follows:
Where V is the volume of the respiratory chamber and accessory circulatory system (L, excluding the volume of the experimental fish), and m is the weight of the experimental fish (kg).
2.7 Statistical analysis
Data were analyzed by SPSS 25. The effects of species and acclimation temperature on all variables related to thermal tolerance, hypoxia tolerance, Ucat, MMR, SMR, and PMR were tested by two-way multivariate analysis of covariance (MANCOVA), using either body weight or body length (for Ucat only) as covariate. If significant, the differences in variables among different acclimation temperatures or species were further tested by LSD’s multiple comparison. Data are expressed as the means ± standard errors (SEs). P < 0.05 was considered statistically significant.
3 Results
3.1 Thermal tolerance
Both species and acclimation temperature showed significant effects on all four thermal tolerance variables (P < 0.001), and their interaction effects were also significant (P < 0.001, specifically LTmin: P = 0.011, Table 2).
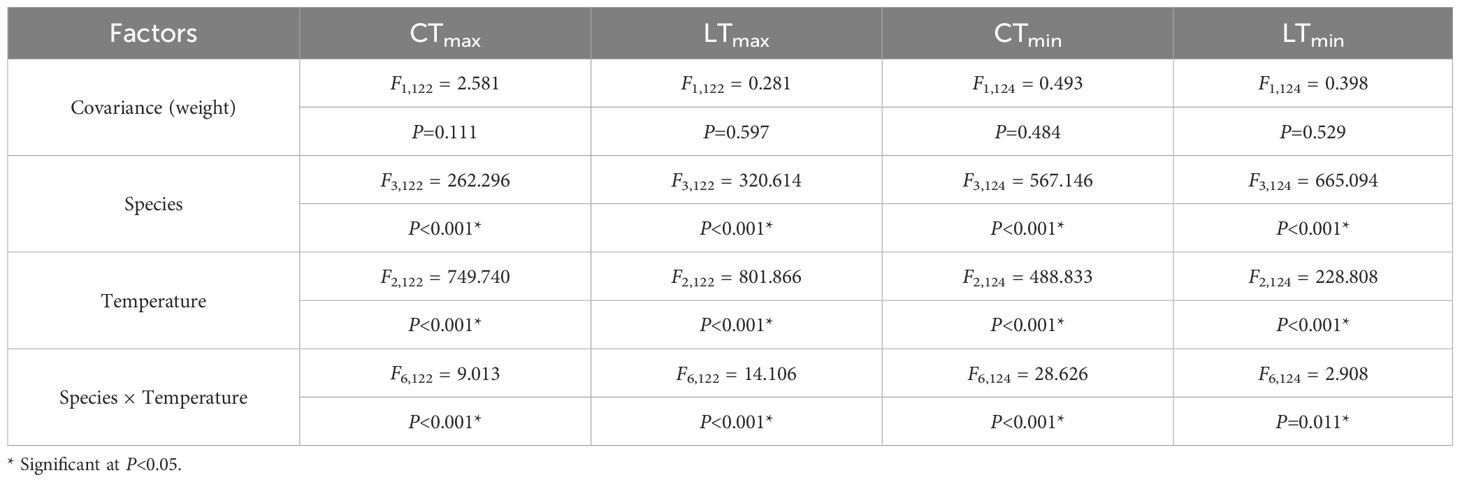
Table 2. Two-way multivariate analysis of covariance (MANCOVA) of species and acclimation temperature on the variables of thermal tolerance.
3.1.1 CTmax
When acclimated at 20 °C, CTmax of O. niloticus was significantly higher than C. auratus, then followed by S. fryeri and then by S. sinensis. When acclimated at 25 °C, CTmax of O. niloticus was significantly higher than C. auratus, then followed by S. fryeri and S. sinensis. When acclimated at 30 °C, CTmax of O. niloticus was significantly higher than that of C. auratus, whereas the latter was significantly higher than those of S. fryeri and S. sinensis (P < 0.01, Figure 2A).
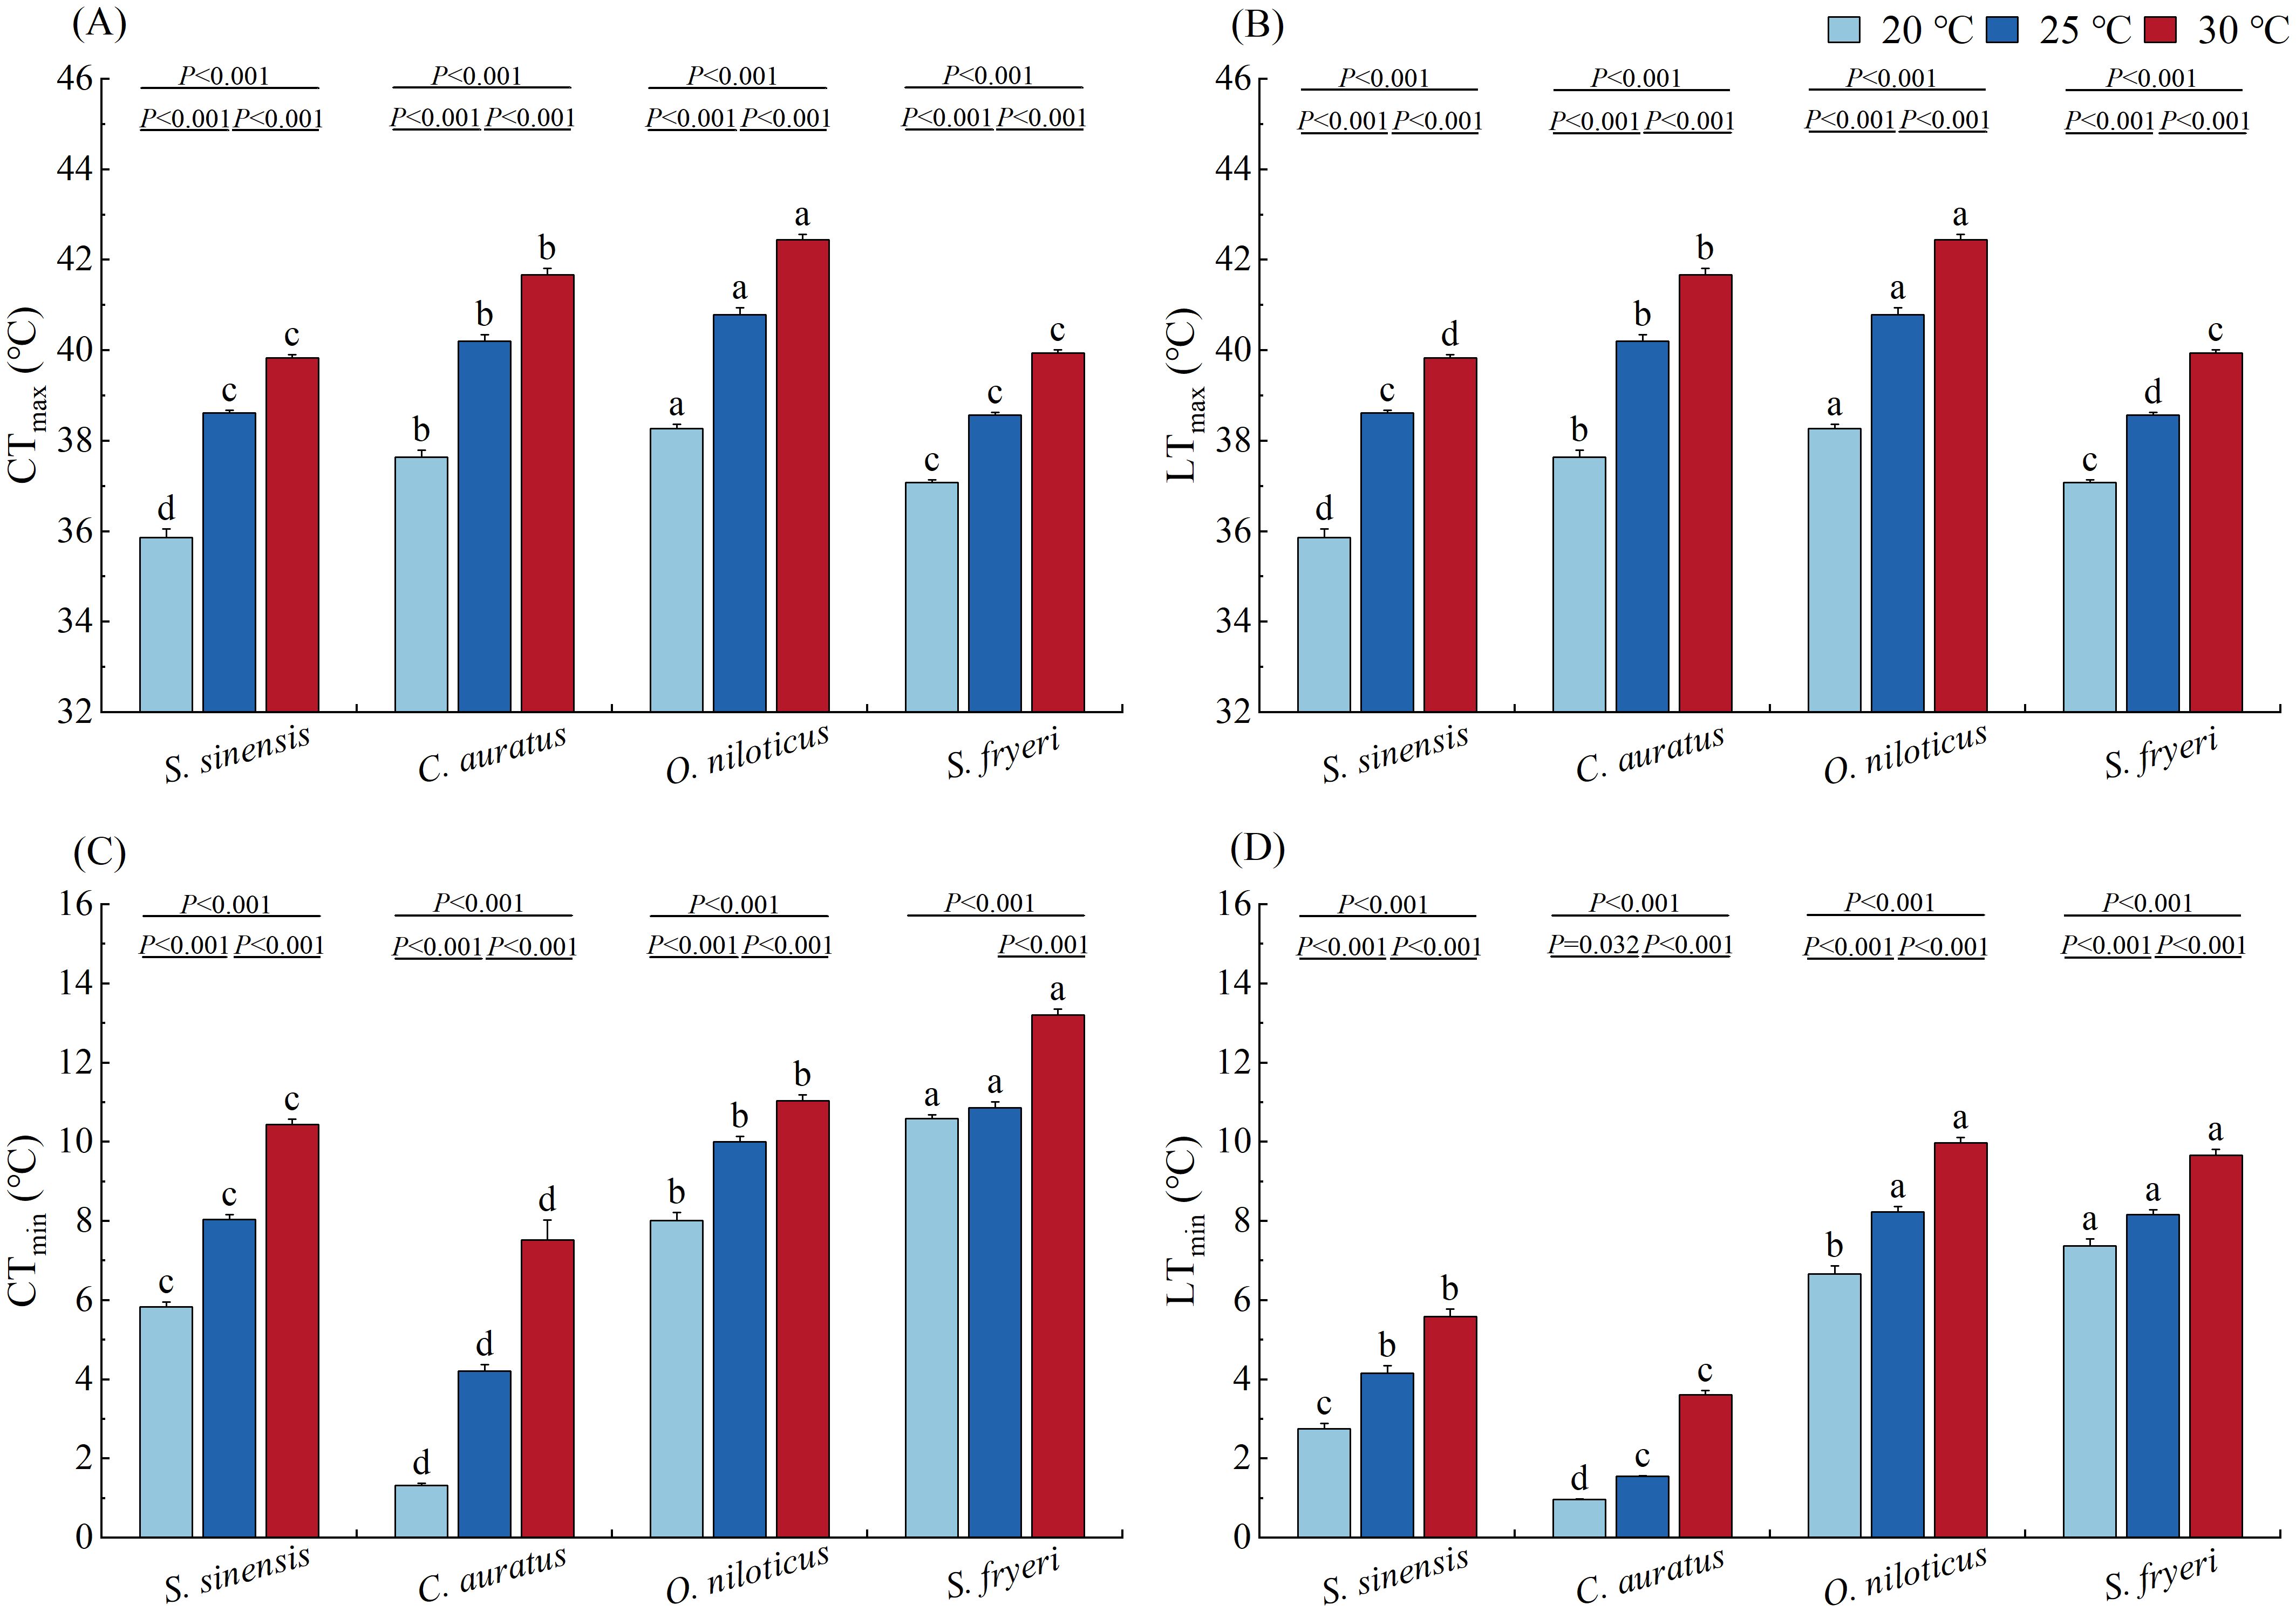
Figure 2. Effect of temperature acclimation on the variables of thermal tolerance of four fish species (means ± S.E.). (A) CTmax, (B) LTmax, (C) CTmin, (D) LTmin. Lowercase letters (a, b, c, d) indicate significant differences among species under 20 °C, 25 °C or 30 °C temperature condition (P < 0.05); The specific P - values indicate significant differences between two temperatures within the same species (P < 0.05).
CTmax increased significantly with temperature, and there were significant differences between either of two temperature groups within each species (P < 0.001, Figure 2A).
3.1.2 LTmax
When acclimated at 20 °C, LTmax of O. niloticus was significantly higher than C. auratus, then followed by S. fryeri and then by S. sinensis. When acclimated at 25 °C and 30 °C, LTmax of O. niloticus was significantly higher than C. auratus, then followed by S. sinensis or S. fryeri, and then by the other species (P < 0.05, Figure 2B).
Similar to CTmax, LTmax increased significantly with temperature, and there were significant differences between either of two temperature groups within each species (P < 0.001, Figure 2B).
3.1.3 CTmin
In all three temperature groups, CTmin of S. fryeri was significantly higher than O. niloticus, then followed by S. sinensis and then by C. auratus (P < 0.01, Figure 2C).
CTmin increased significantly with temperature, and there were significant differences between either of two temperature groups within each species (P < 0.001), except those between 20 and 25 °C in S. fryeri (P = 0.177, Figure 2C).
3.1.4 LTmin
When acclimated at 20 °C, LTmin of S. fryeri was significantly higher than O. niloticus, then followed by S. sinensis and then by C. auratus. When acclimated at 25 and 30 °C, LTmin of S. fryeri and O. niloticus were significantly higher than S. sinensis, whereas the latter was significantly higher than C. auratus (P< 0.01, Figure 2D).
LTmin increased significantly with temperature, and there were significant differences between either of two temperature groups within each species (P < 0.001, specifically the difference of C. auratus between 20 and 25 °C: P = 0.032, Figure 2D).
3.1.5 ARR
The ARR values varied profoundly (from 3.42% to 66.00%) among species and temperature intervals (Table 3).
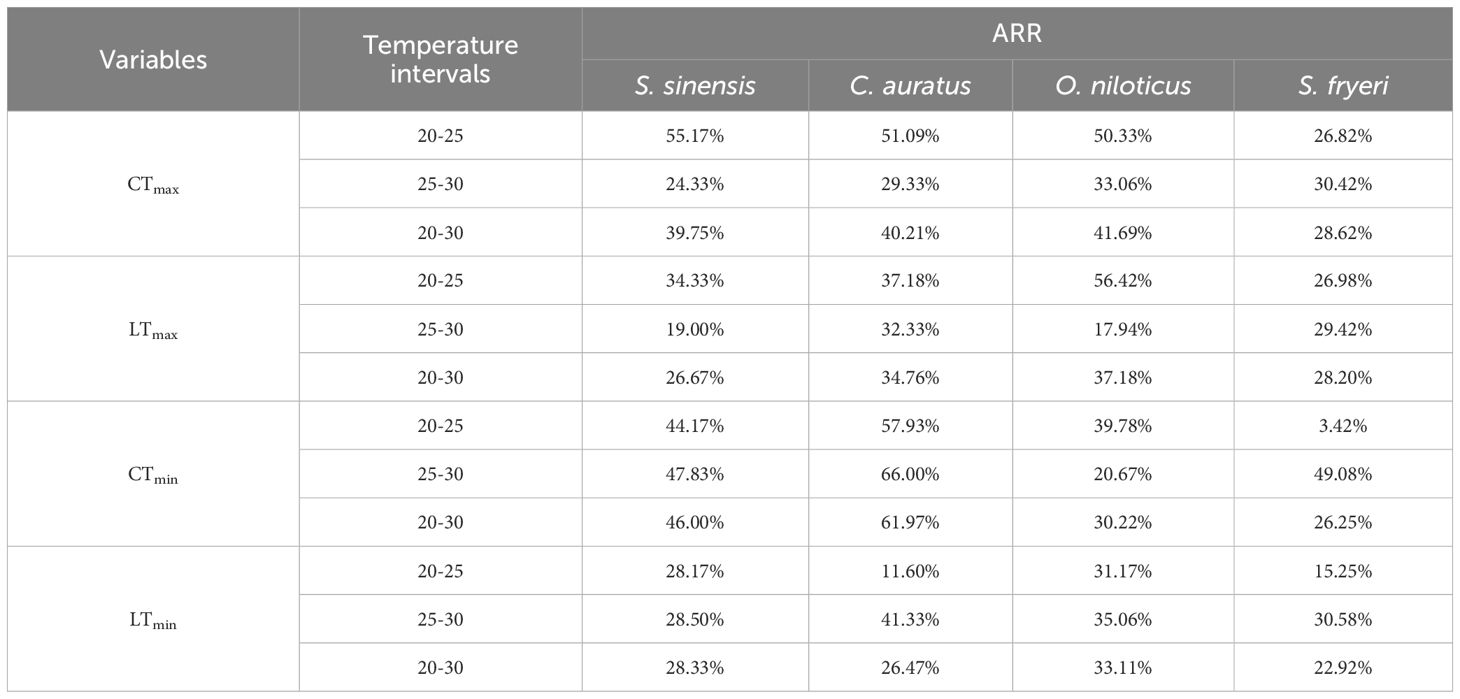
Table 3. Acclimation response rate of thermal tolerance variables in four fish species at different temperature intervals.
3.2 Hypoxia tolerance and oxygen uptake capacity
3.2.1 Ploe
Ploe varied profoundly among species (P < 0.001, Table 4). S. sinensis and S. fryeri exhibited significantly higher Ploe than those of other two species in all three temperature acclimation groups. Furthermore, Ploe of O. niloticus was significantly higher than C. auratus when acclimated at 20 °C, whereas Ploe of S. fryeri was significantly higher than S. sinensis when acclimated at 30 °C (P < 0.05, Figure 3A).
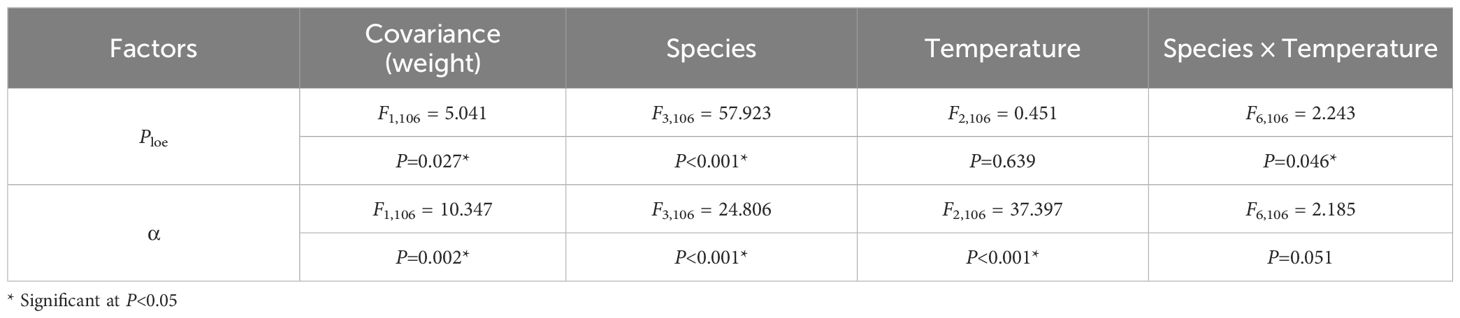
Table 4. Two-way multivariate analysis of covariance (MANCOVA) of species and acclimation temperature on the variables of hypoxia tolerance and oxygen uptake capacity.
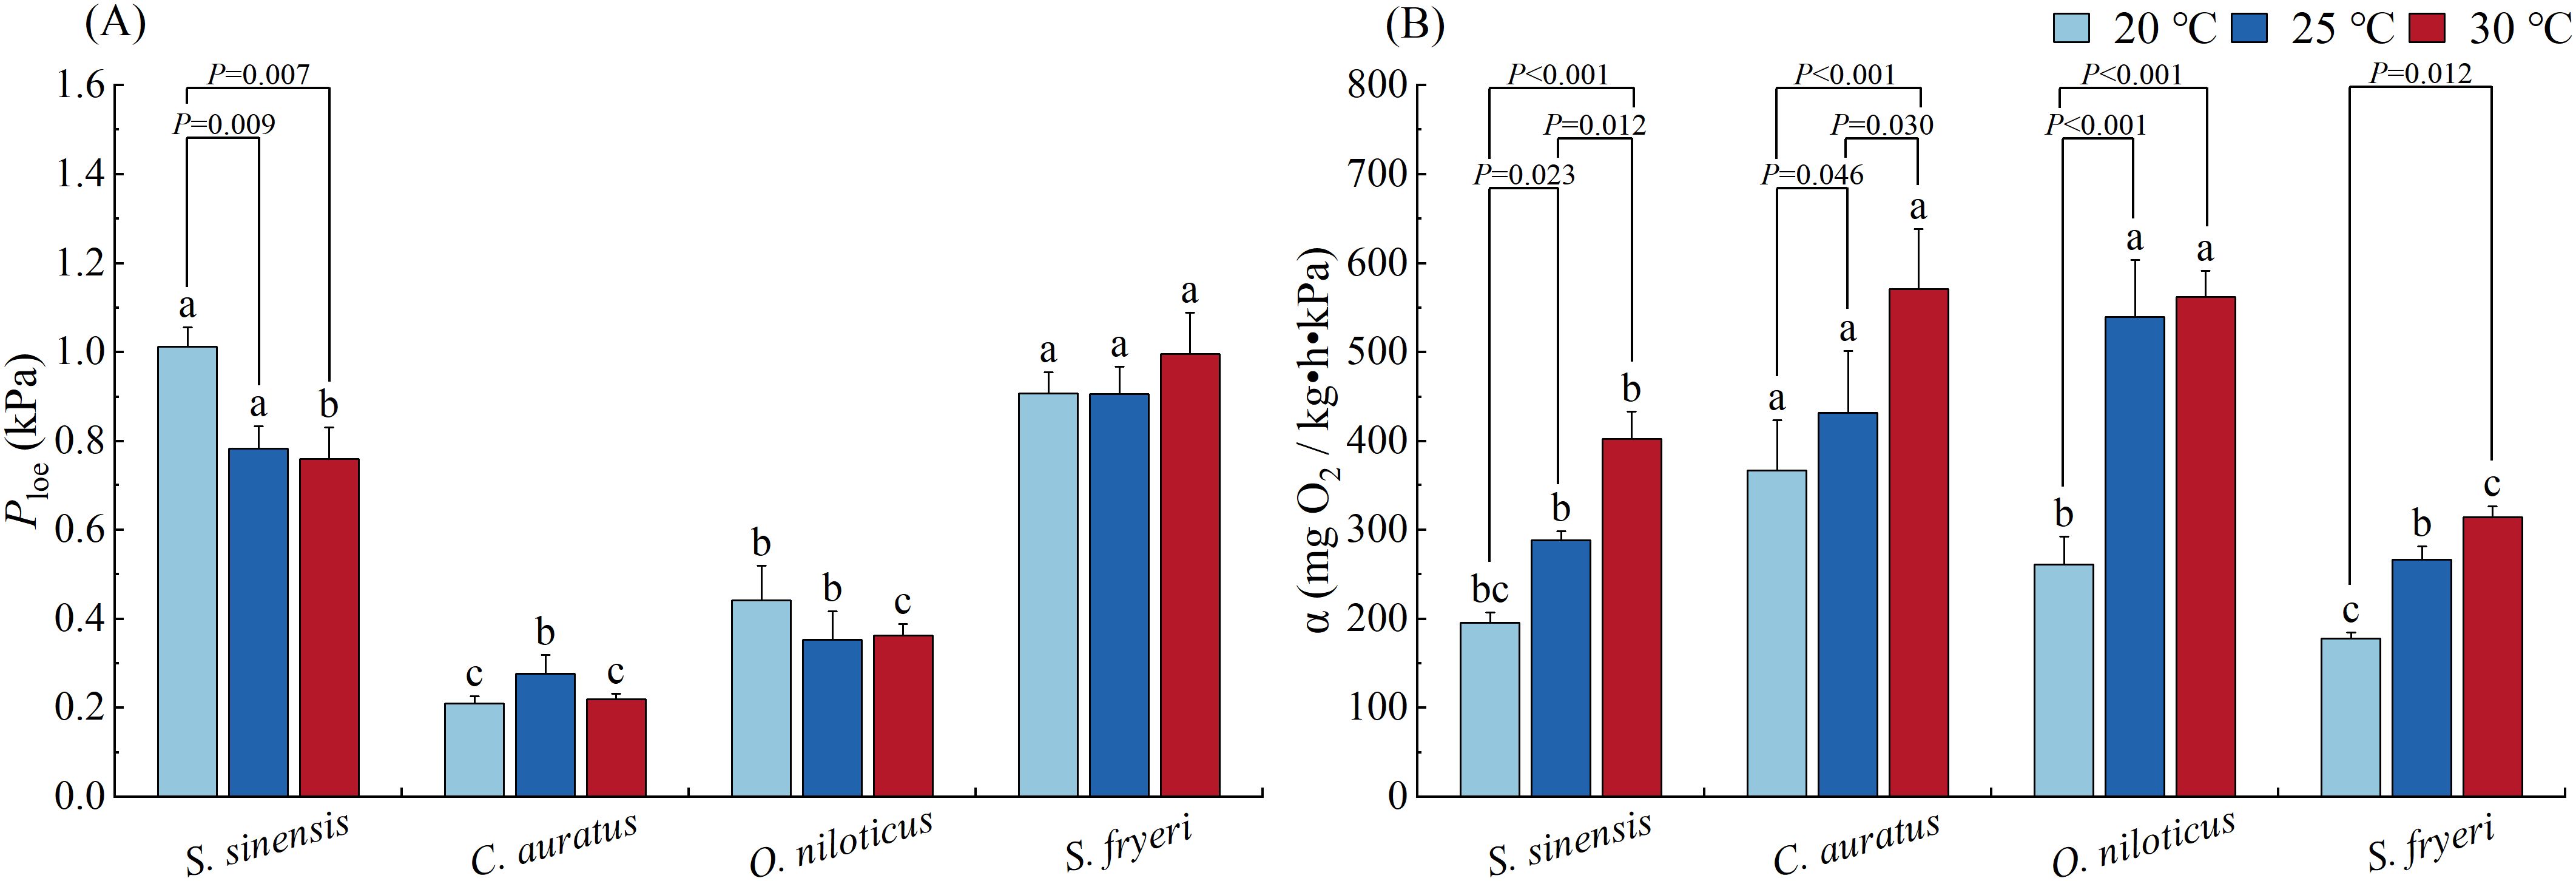
Figure 3. Effect of temperature acclimation on the variables of hypoxia tolerance and oxygen uptake capacity of four fish species (means ± S.E.). (A) Ploe, (B) α. Lowercase letters (a, b, c) indicate significant differences among species under 20 °C, 25 °C or 30 °C temperature condition (P<0.05); The specific P - values indicate significant differences between two temperatures within the same species (P<0.05).
In S. sinensis, Ploe of 20 °C temperature acclimation group was significantly higher than other two temperature groups (P = 0.009, P = 0.007), whereas there was no significant difference among different temperature groups in other three species (Figure 3A).
3.2.2 α
α varied significantly among species (P < 0.001, Table 4). Contrary to Ploe, α of both S. sinensis and S. fryeri were significantly lower than the other two species, except S. sinensis and O. niloticus at 20 °C. When acclimated at 20 °C, α of C. auratus was significantly higher than O. niloticus. When acclimated at 30 °C, α of S. sinensis was also significantly higher than S. fryeri (P < 0.05, Figure 3B).
Furthermore, α increased with increased acclamation temperature in all four species (P < 0.001, Table 4), and there were significant differences between either of two temperature groups within each species (P < 0.05), except for O. niloticus and S. fryeri at high temperature range (i.e. between 25 and 30 °C) and O. niloticus at lower temperature range (i.e., between 20 and 25 °C, Figure 3B).
3.3 Swimming performance and energy metabolism
3.3.1 Ucat
Ucat varied significantly among species (P < 0.001, Table 5). C. auratus showed significantly lower Ucat than other three species at all acclimation temperature, except O. niloticus acclimated at 20 °C (P < 0.05, Figure 4A).
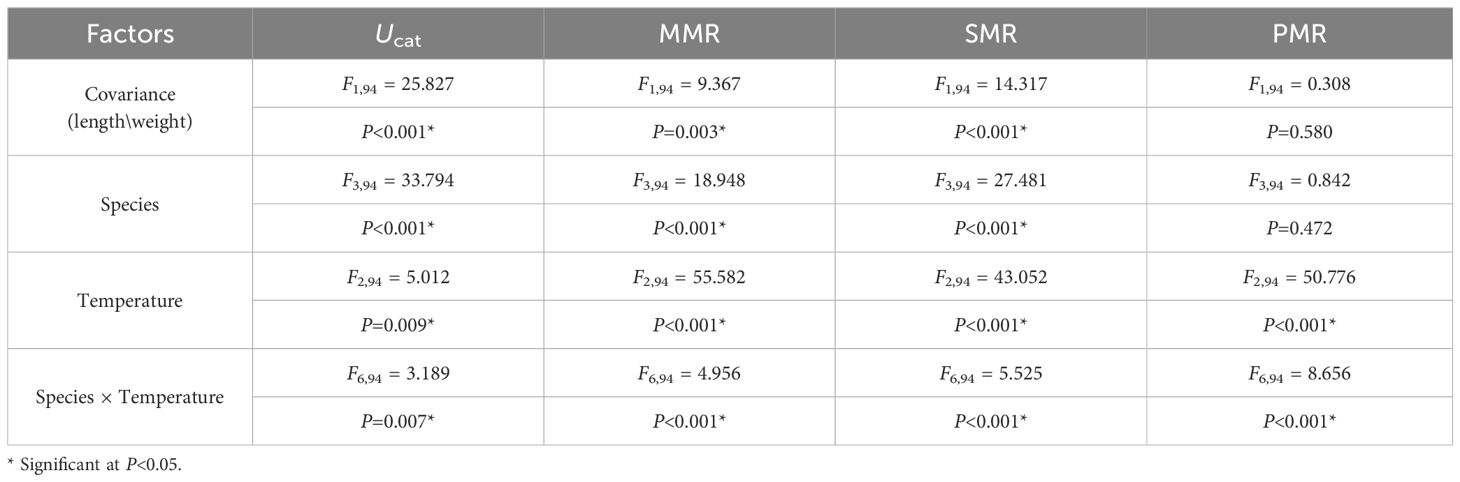
Table 5. Two-way multivariate analysis of covariance (MANCOVA) of species and acclimation temperature on the variables of swimming performance and energy metabolism.
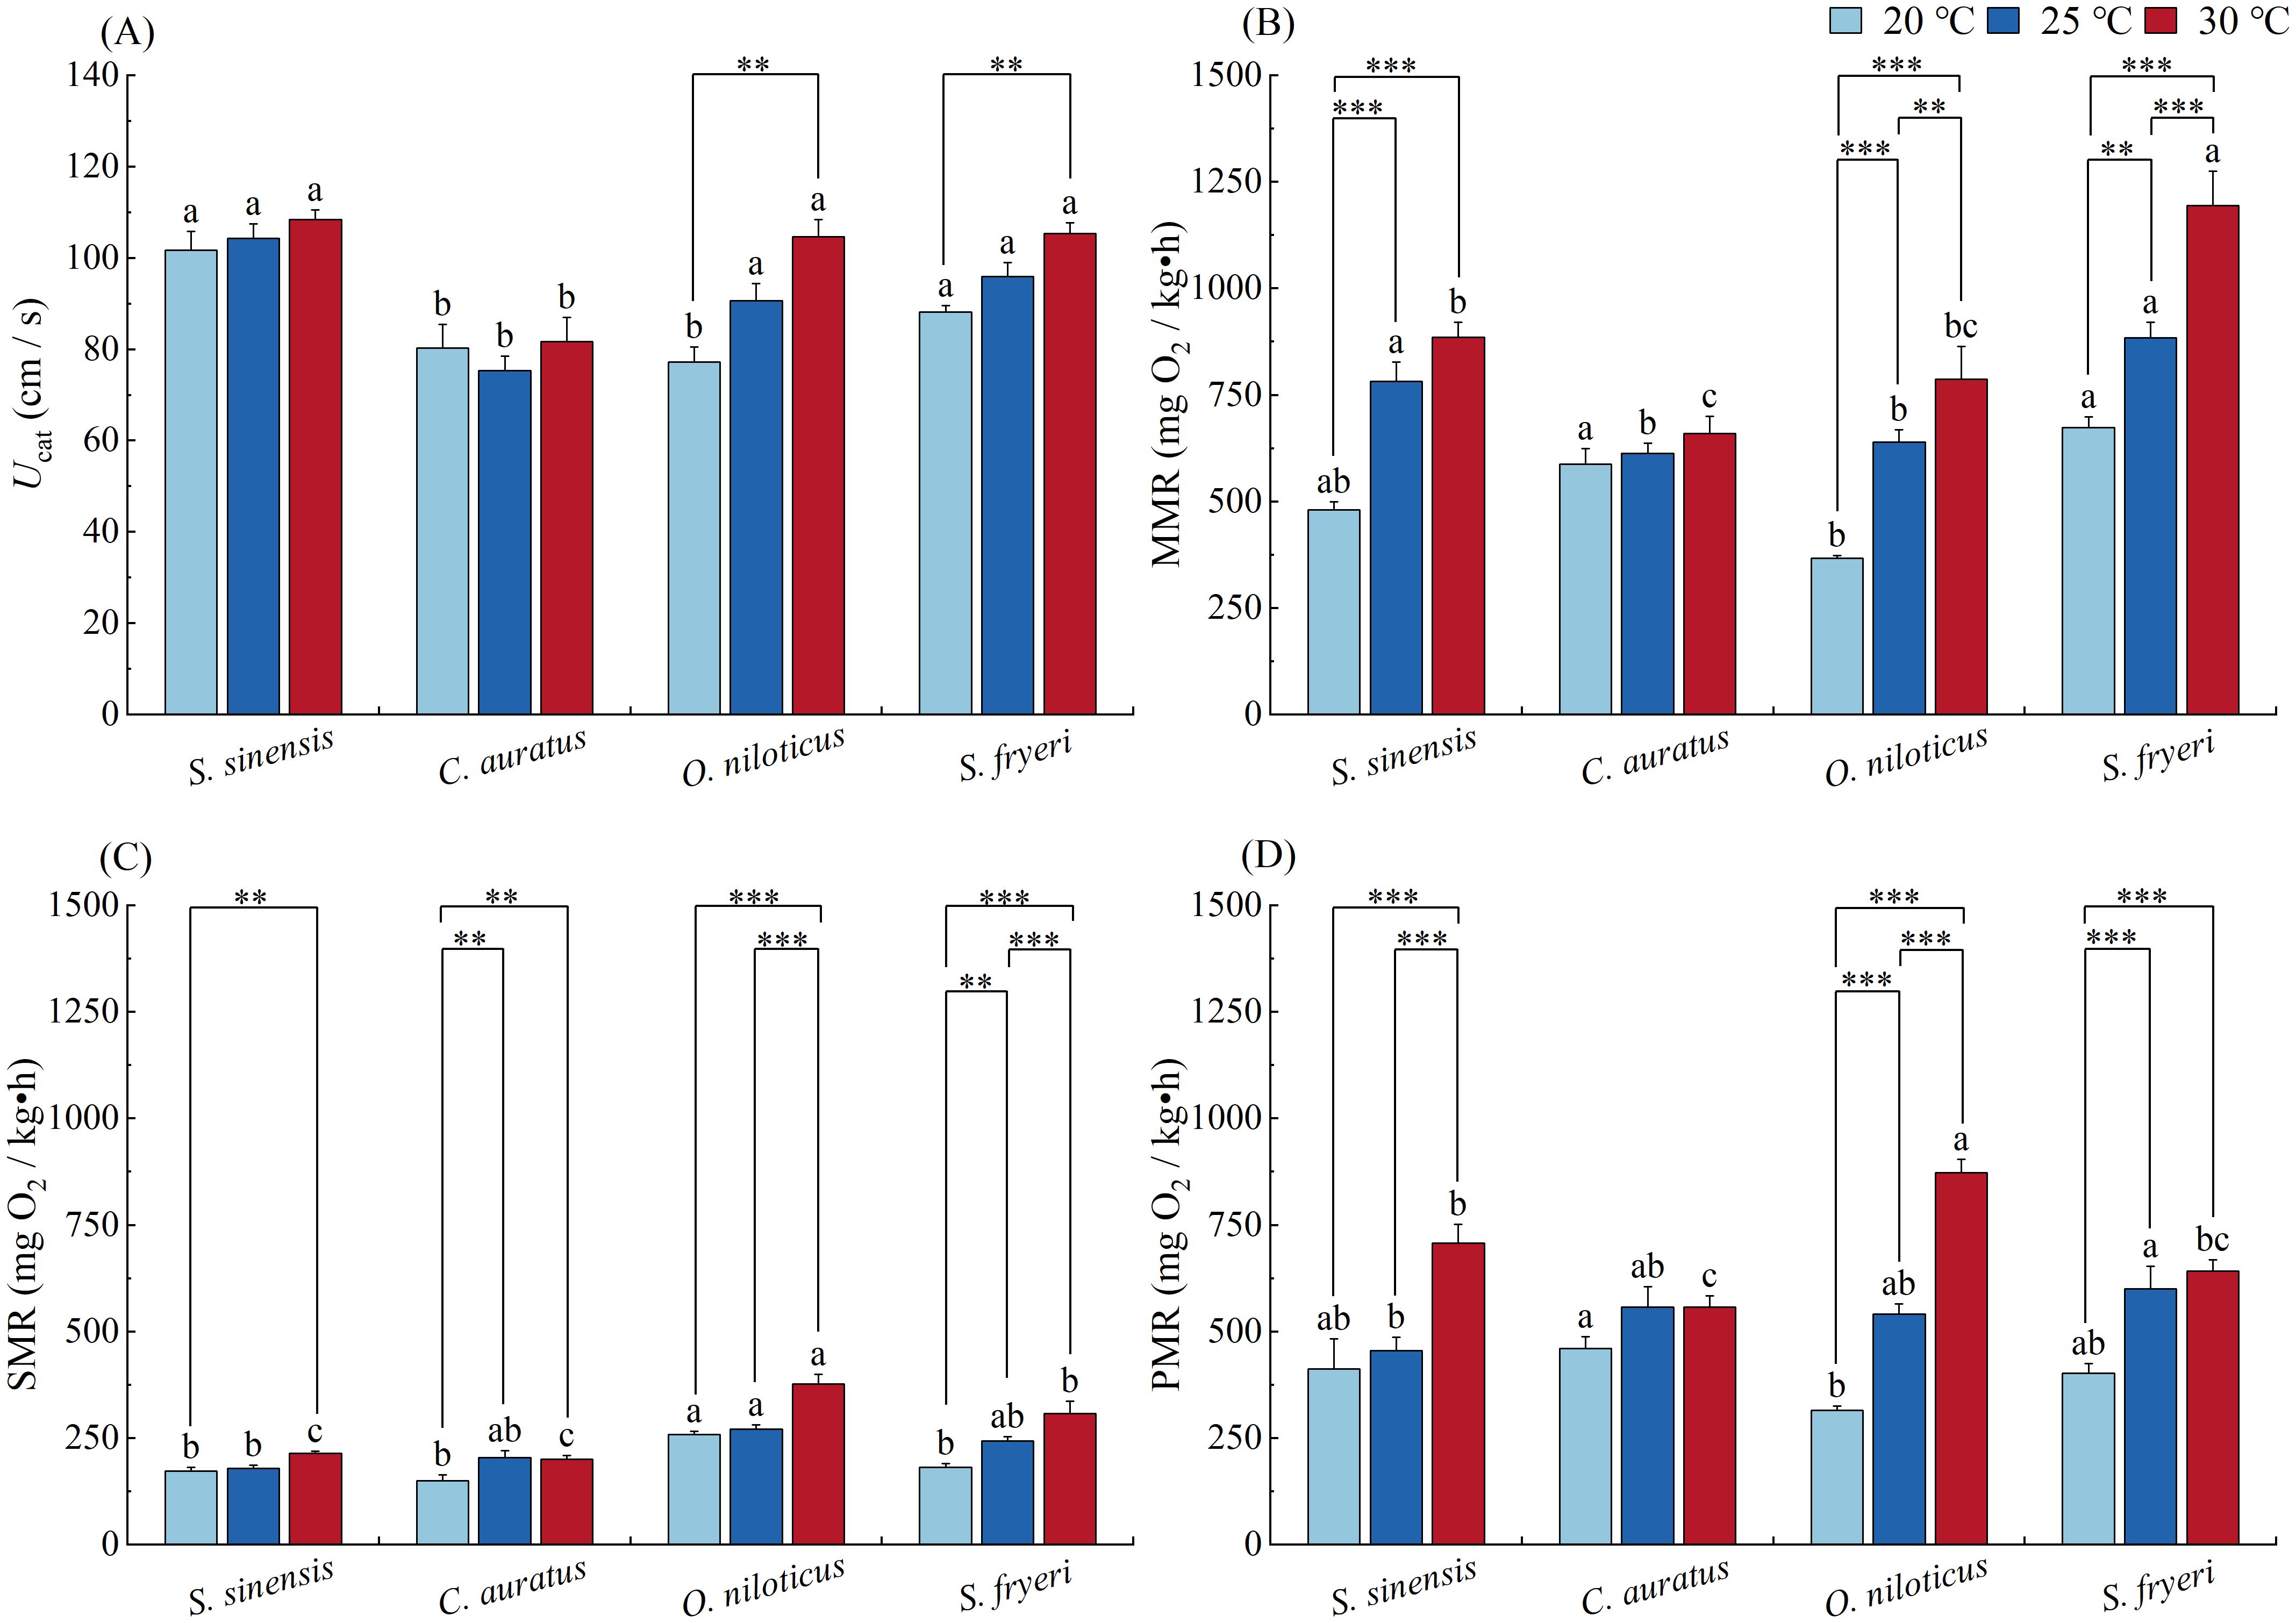
Figure 4. Effect of temperature acclimation on the variables of swimming performance and energy metabolism of four fish species (means ± S.E.). (A) Ucat, (B) MMR, (C) SMR, (D) PMR. Lowercase letters (a, b, c) indicate significant differences among species under 20 °C, 25 °C or 30 °C temperature condition (P<0.05); The specific P - values indicate significant differences between two temperatures within the same species (P<0.05).
Temperature acclimation showed significant effect on two Perciformes (P = 0.009, Table 5). Ucat increased significantly with temperature, and there were significant differences between 20 and 30 °C temperature groups in O. niloticus and S. fryeri (P = 0.003, P = 0.001, Figure 4A).
3.3.2 MMR
MMR varied significantly among species (P < 0.001, Table 5). When acclimated at 20 °C, MMR of C. auratus and S. fryeri were significantly higher than O. niloticus. When acclimated at 25 °C, MMR of S. sinensis and S. fryeri were significantly higher than other two species. When acclimated at 30 °C, MMR of S. fryeri was significantly higher than other three species, whereas MMR of S. sinensis was also higher than that of C. auratus (P < 0.05, Figure 4B).
With increasing acclimation temperature, MMR of two Perciformes increased significantly among whole temperature range (P < 0.001, Table 5), there was significant difference between either two temperature groups (P < 0.01). Furthermore, the MMR of S. sinensis acclimated at 20 °C was significantly lower than those acclimated at 25 and 30 °C (P < 0.001, Table 5, Figure 4B).
3.3.3 SMR
SMR varied significantly among species (P < 0.001, Table 5). When acclimated at 20 °C, SMR of O. niloticus was significantly higher than other three species. When acclimated at 25 °C, SMR of O. niloticus was significantly higher than S. sinensis. When acclimated at 30 °C, SMR of O. niloticus was significantly higher than S. fryeri, whereas the later was significantly higher than S. sinensis and C. auratus (P < 0.05, Figure 4C).
SMR increased with increased acclamation temperature in all four species (P < 0.001, Table 5). In S. sinensis, SMR acclimated at 20 °C was significantly lower than fish acclimated at 30 °C (P = 0.006). In C. auratus, SMR acclimated at 20 °C was significantly lower than fish acclimated at 25 and 30 °C (P = 0.001). In O. niloticus, SMR acclimated at 20 and 25 °C were significantly lower than fish acclimated at 30 °C (P < 0.001). In S. fryeri, there was significant difference between either two temperature groups (P < 0.01, Figure 4C).
3.3.4 PMR
When acclimated at 20 °C, PMR of C. auratus was significantly higher than O. niloticus. With the increase of acclimation temperature, PMR of O. niloticus increased more profoundly than other species (interaction effect: P < 0.001, Table 5). Thus, when acclimated at 30 °C, PMR of O. niloticus was significantly higher than other three species (P < 0.05, Figure 4D).
PMR increased with increased acclamation temperature in all three species except C. auratus (P < 0.001, Table 5; Figure 5). In S. sinensis, PMR acclimated at 20 and 25 °C were significantly lower than fish acclimated at 30 °C (P < 0.001). In O. niloticus, there was significant difference between either two temperature groups (P < 0.001). In S. fryeri, PMR acclimated at 20 °C was significantly lower than fish acclimated at 25 and 30 °C (P < 0.001, Figure 4D).
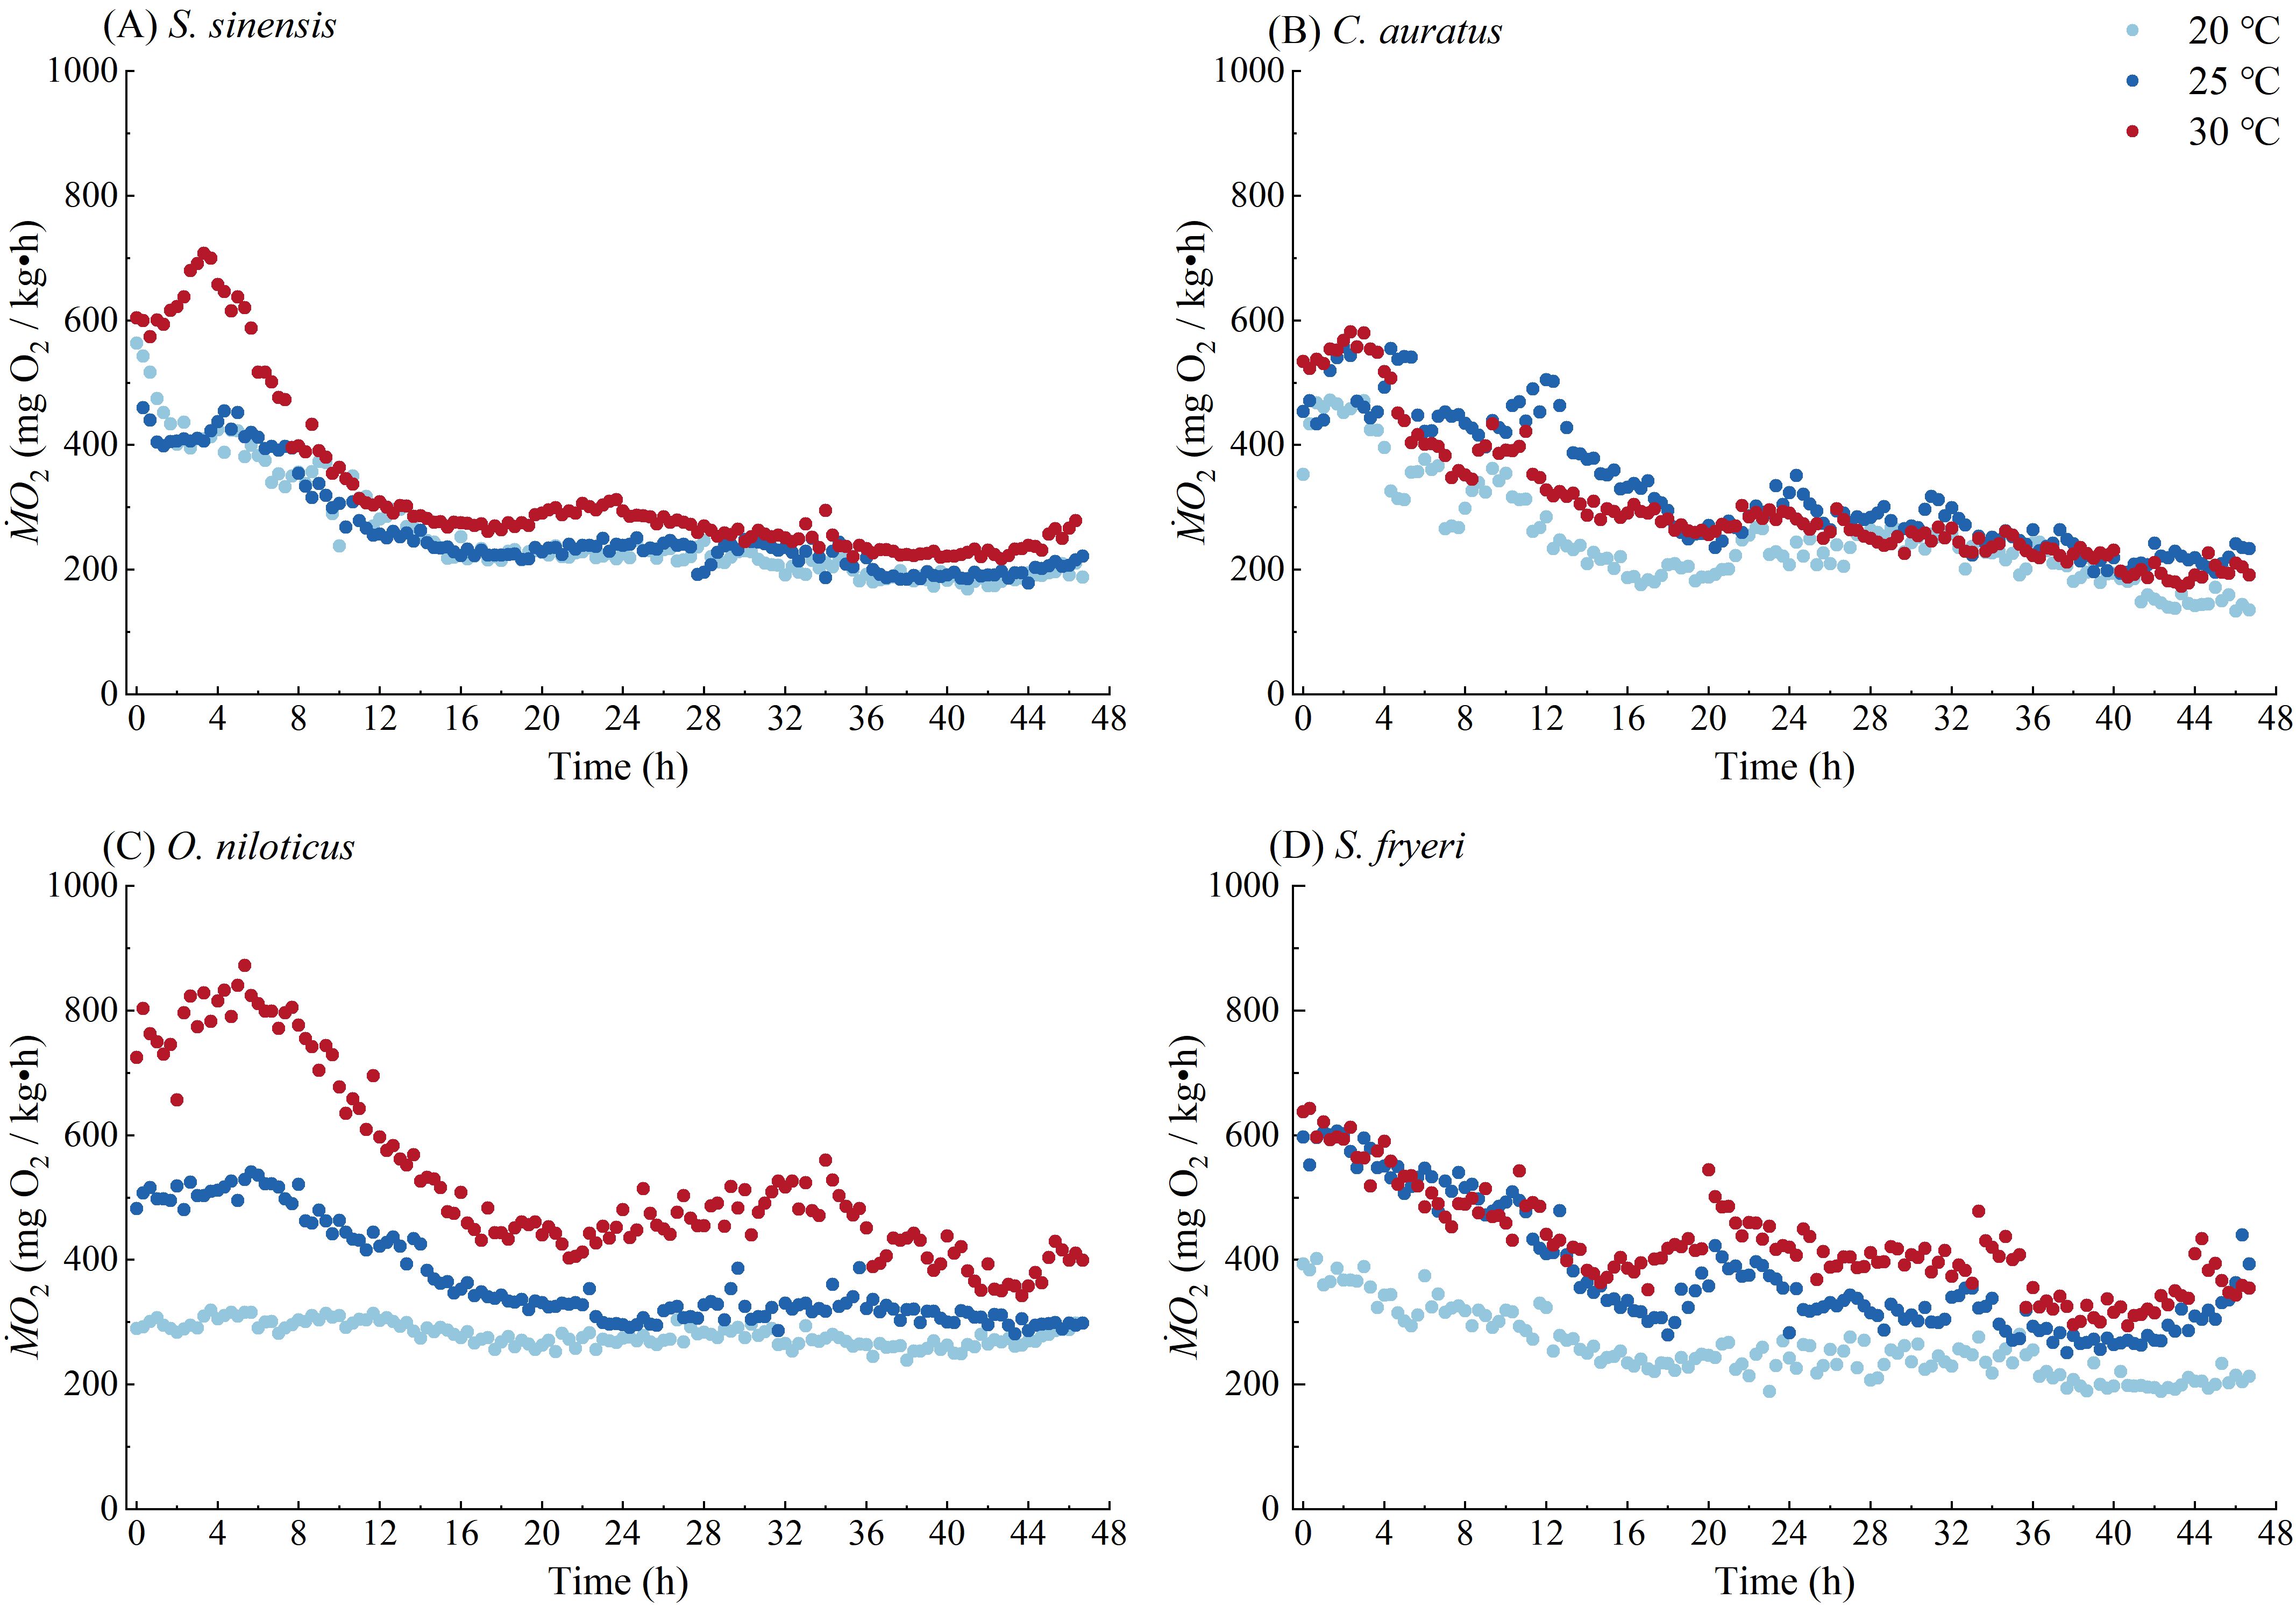
Figure 5. Profiles of ṀO2 with time for four fish species during the measurement of specific dynamic action in the present study. (A) S. sinesis, (B) C. auratus, (C) O. niloticus, (D) S. fryeri. These data are from all the experiment individuals and the sample size is shown in Supplementary Table 2.
4 Discussion
4.1 Thermal tolerance
4.1.1 Inter-species difference
Heat tolerance of four fish species showed large inter-species variation, but not related to thermal history. Previous studies have found that inter-species differences in heat tolerance of fish species are closely related to the flow regimes in their habitats (Zhang et al., 2024). Generally, the heat tolerance of fish species in flowing water habitats is lower than those in stagnant water habitats. As found in this experiment, C. auratus and O. niloticus, which preferred to small and stagnant waterbody habitat, are frequently exposed to extreme high temperatures in their daily survival activities and thus develop stronger heat tolerance. In contrast, S. sinensis and S. fryeri, which preferred to open waterbody, are less exposed to extreme high temperatures, and thus exhibit weaker heat tolerance than the former two species.
Conversely, cold tolerance of four fish species was significantly influenced by thermal history. The tropical fishes O. niloticus and S. fryeri were the least tolerant to low temperatures, followed by the warm-temperate fish S. sinensis, and finally by the broad-temperate widespread fish C. auratus. This agrees with the recently studies suggesting that phylogeny can explain variation in CTmin among different species of ectotherms, and orders originating from cold thermal history exhibiting better cold tolerance than those from warm regions (Leiva et al., 2019; Bennett et al., 2021; Nati et al., 2021). Consequently, the geographical range of fish is also an important factor in the variation of thermal tolerance of fish (Nozzi and Stelzer, 2021; van der Walt et al., 2021), with tropical species generally having lower cold tolerance than temperate ones.
4.1.2 Temperature acclimation effect
Thermal tolerance of all four fish species increased in parallel with increased acclimation temperature, indicating that thermal tolerance of fish species (as aquatic ectotherm) is highly sensitive to temperature acclimation. A meta-analysis also found that changes in thermal tolerance of fish depend not on climatic origin but on experimental acclimation temperature, duration, and life stage (Ruthsatz et al., 2024). Higher acclimation temperatures and longer domestication durations will result in greater thermal tolerance capacity to survival (Ruthsatz et al., 2024).
4.2 Hypoxia tolerance and oxygen uptake capacity
4.2.1 Inter-species difference
C. auratus and O. niloticus. inhabiting small and stagnant waterbody have evolved better hypoxia tolerance, which is related to the high frequency of hypoxia events in their habitats. At the same time, they also evolved better oxygen supply capacity to cope with high-frequency hypoxia stress. Oxygen supply capacity, as a temperature-sensitive specificity constant, reflects the efficiency of oxygen uptake and cascade transport (Timpe and Seibel, 2024). It has been shown that the higher oxygen supply capacity, the higher tolerance to hypoxia (Huang et al., 2024). The present study corroborates previous studies, as two species from small and stagnant waterbody habitat showed higher α and lower Ploe compared to other two species usually occupy the open waterbodies habitat.
4.2.2 Temperature acclimation effect
Unlike the thermal tolerance, Ploe of four fish species is not significant different among three temperatures, suggesting that hypoxia tolerance is not sensitive to temperature acclimation. The aquatic environment condition such as oxygen tension in freshwater habitats often fluctuates dramatically due to its high susceptibility to climate and human social activities (González Vilas et al., 2015; Burbank et al., 2022; Tims and Saupe, 2023). Thus, hypoxia tolerance of freshwater fishes is vital for their survival in nature habitats and quite conservative across acclimation temperature range, helping them to adapt to the complex oxygen and thermal environments in the nature (Huang et al., 2024; Zhang et al., 2024). These findings align well with the experimental evidence reported by Chen et al., demonstrating that hypoxia tolerance in most freshwater fish species remains largely unaffected by thermal acclimation conditions within their optimal thermal range (He et al., 2015; Chen et al., 2019; Zhou et al., 2019). However, the hypoxia tolerance of S. sinensis acclimate at 25 and 30 °C, was significantly higher than 20 °C. This may be related to the relaxed nature selection pressure as S. sinensis lives in open waterbody with abundant oxygen availability (Xu et al., 2021; Fu et al., 2022). Additionally, the improved oxygen supply capacity evolved to meet the increased energy and oxygen requirements with increased acclimation temperature, consequently resulted in higher hypoxia tolerance as by-product (Esbaugh et al., 2021).
4.3 Swimming performance and energy metabolism
4.3.1 Inter-species difference
As anticipated, S. sinensis and S. fryeri in open waterbody showed relatively higher Ucat and MMR (not at 20 °C) than other two species. It is because that higher demanding for swimming performance for fish occupies the open waterbody habitat, thus ensure the success of highly ecological related activities such as foraging and avoiding predators; whereas in small and stagnant waterbody habitat, the high availability of shelters and complicate structure with obstacles favor the evolution of a rapid response and high maneuverability for locomotion (Yan et al., 2013; Fu et al., 2022).
4.3.2 Temperature acclimation effect
The Ucat, MMR, SMR and PMR of two tropical fishes O. niloticus and S. fryeri were more sensitive to temperature acclimation compared to two other temperate fishes. Among the two temperate fishes, one eury-thermal species C. auratus was the least sensitive to temperature acclimation. This difference may be related to variations in the thermoneutral zone or optimal temperature zone of fish physiological functions, as described by the thermal performance curve (TPC, Scheuffele et al., 2021). The TPC is a product not only of the current environment but also of history environments (Xie et al., 2010; Ferreira et al., 2014; Pang et al., 2016; Kellermann et al., 2019). Generally, the thermoneutral zone of tropic species is higher than that of temperate species (Xu et al., 2012). In the present study, the temperature range of 20 to 30 °C might be the thermoneutral zone of two temperate species. Thus, two tropical fishes O. niloticus and S. fryeri were more sensitive to the change of acclimation temperature. Furthermore, phylogeny might also contribute to the difference, as both tropical species belong to perciform, while the other two temperate species are cypriniforms. The previous findings that the reaction norms of physiological function to environment conditions are phylogenetically linked (Huang et al., 2024).
Interestingly, S. sinensis showed neglectable improvement in PMR but a significant increase in MMR within the 20 - 25°C acclimate temperature range, whereas it was vice versa within the 25 - 30°C. This suggests that, at 20 - 25°C, S. sinensis allocated energy mainly to physiological function such as swimming, whereas at higher temperature range, its energy allocation might shift more towards digestion and growth. It was confirmed by a profound increase in meal size between 25 and 30°C in S. sinensis, compared to other species with the same temperature range or conspecies responses between 20 and 25°C (Table 1). The underlying physiological mechanism and ecological consequence need further investigation. It might due to the adaptive evolution to both annual temperature change in the natural habitats and characteristic of life cycle of this species (Polverino et al., 2018).
Overall, the present study suggests that the differences of stress tolerance and other physiological function, as well as their sensitivity to acclimation temperature, are shaped by both thermal history and habitat conditions. The adaptive evolution of fish in response to environmental temperature fluctuations is vital for the survival in their natural habitats. Understanding the reaction norms, underlying mechanisms, and ecological relevance provides important references for the conservation of fish species and the advancement of aquaculture technology.
Data availability statement
The raw data supporting the conclusions of this article will be made available by the authors, without undue reservation.
Ethics statement
The animal study was approved by the Animal Care and Use Committee of the Chongqing Key Laboratory of Conservation and Utilization of Freshwater Fishes (permit number CKLCUFF-20221022-01) and performed in strict accordance with the recommendations of the Guide for the Care and Use of Animals at the Chongqing Key Laboratory of Conservation and Utilization of Freshwater Fishes, China. The study was conducted in accordance with the local legislation and institutional requirements.
Author contributions
YZ: Writing – review & editing, Investigation, Methodology, Formal analysis, Software, Writing – original draft, Visualization, Data curation. PX: Investigation, Writing – review & editing, Formal analysis. SF: Supervision, Writing – original draft, Writing – review & editing, Formal analysis, Methodology.
Funding
The author(s) declare that financial support was received for the research and/or publication of this article. This work was funded by the National Natural Science Foundation of China (32370509)
Conflict of interest
The authors declare that the research was conducted in the absence of any commercial or financial relationships that could be construed as a potential conflict of interest.
Generative AI statement
The author(s) declare that no Generative AI was used in the creation of this manuscript.
Publisher’s note
All claims expressed in this article are solely those of the authors and do not necessarily represent those of their affiliated organizations, or those of the publisher, the editors and the reviewers. Any product that may be evaluated in this article, or claim that may be made by its manufacturer, is not guaranteed or endorsed by the publisher.
Supplementary material
The Supplementary Material for this article can be found online at: https://www.frontiersin.org/articles/10.3389/fmars.2025.1593656/full#supplementary-material
References
Becker C. D. and Genoway R. G. (1979). Evaluation of the critical thermal maximum for determining thermal tolerance of freshwater fish. Environ. Biol. Fishes 4, 245–256. doi: 10.1007/BF00005481
Bennett J. M., Sunday J. M., Calosi P., Villalobos F., Martínez B., Molina-Venegas R., et al. (2021). The evolution of critical thermal limits of life on Earth. Nat. Commun. 12, 4168. doi: 10.1038/s41467-021-21263-8
Benz S., Irvine D. J., Rau G. C., Bayer P., Menberg K., Blum P., et al. (2024). Global groundwater warming due to climate change. Nat. Geosci. 17, 545–551. doi: 10.1038/s41561-024-01453-x
Burbank J., Drake D. A. R., and Power M. (2022). Use of stable isotopes for assessing urbanization impacts on freshwater fishes. Front. Environ. Sci. 10. doi: 10.3389/fenvs.2022.963693
Cai L., Huang Y., Johnson D., Li M., Liu R., Hu W., et al. (2023). Swimming ability of cyprinid species (subfamily Schizothoracinae) at high altitude. Front. Physiol. 14. doi: 10.3389/fphys.2023.1152697
Chabot D., Koenker R., and Farrell A. P. (2016). The measurement of specific dynamic action in fishes. J. Fish Biol. 88, 152–172. doi: 10.1111/jfb.12836
Chen B. J., Fu S. J., Cao Z. D., and Wang Y. X. (2019). Effect of temperature on critical oxygen tension (Pcrit) and gill morphology in six cyprinids in the Yangtze River, China. Aquaculture 508, 137–146. doi: 10.1016/j.aquaculture.2019.04.057
Claussen D. L. (1977). Thermal acclimation in ambystomatid salamanders. Comp. Biochem. Physiol. A. 58, 333–340. doi: 10.1016/0300-9629(77)90150-5
D’Amato G. and Akdiş C. A. (2020). Global warming, climate change, air pollution and allergies. Allergy 75, 2158–2160. doi: 10.1111/all.14527
Desforges J. E., Birnie-Gauvin K., Jutfelt F., Gilmour K. M., Eliason E. J., Dressler T., et al. (2023). The ecological relevance of critical thermal maxima methodology for fishes. J. Fish Biol. 102, 1000–1016. doi: 10.1111/jfb.15368
Deutsch C., Ferrel A., Seibel B. A., Pörtner H. O., and Huey R. B. (2015). Climate change tightens a metabolic constraint on marine habitats. Science 348, 1132–1135. doi: 10.1126/science.aaa1605
Ekström A., Sundell E., Morgenroth D., McArley T., Gårdmark A., Huss M., et al. (2021). Cardiorespiratory adjustments to chronic environmental warming improve hypoxia tolerance in European perch (Perca fluviatilis). J. Exp. Biol. 224, jeb241554. doi: 10.1242/jeb.241554
Esbaugh A. J., Ackerly K. L., Dichiera A. M., and Negrete B. (2021). Is hypoxia vulnerability in fishes a by-product of maximum metabolic rate? J. Exp. Biol. 224, jeb232520. doi: 10.1242/jeb.232520
Ferreira E. O., Anttila K., and Farrell A. P. (2014). Thermal optima and tolerance in the eurythermic goldfish (Carassius auratus): relationships between whole-animal aerobic capacity and maximum heart rate. Physiol. Biochem. Zool. 87, 599–611. doi: 10.1086/677317
Fu S. J., Dong Y. W., and Killen S. S. (2022). Aerobic scope in fishes with different lifestyles and across habitats: Trade-offs among hypoxia tolerance, swimming performance and digestion. Comp. Biochem. Physiol. A Mol. Integr. Physiol. 272, 111277. doi: 10.1016/j.cbpa.2022.111277
González Vilas L., Guisande C., Vari R. P., Pelayo-Villamil P., Manjarrés-Hernández A., García-Roselló E., et al. (2015). Geospatial data of freshwater habitats for macroecological studies: an example with freshwater fishes. Int. J. Geogr. Inf. Sci 30, 126–141. doi: 10.1080/13658816.2015.1072629
He W. L., Cao Z. D., and Fu S. J. (2015). Effect of temperature on hypoxia tolerance and its underlying biochemical mechanism in two juvenile cyprinids exhibiting distinct hypoxia sensitivities. Comp. Biochem. Physiol. A Mol. Integr. Physiol. 187, 232–241. doi: 10.1016/j.cbpa.2014.05.004
Huang K. R., Liu Q. Y., Zhang Y. F., Luo Y. L., Fu C., Pang X., et al. (2024). Whether hypoxia tolerance improved after short-term fasting is closely related to phylogeny but not to foraging mode in freshwater fish species. J. Comp. Physiol. B. 194, 843–853. doi: 10.1007/s00360-024-01588-8
Jarić I., Lennox R. J., Kalinkat G., Cvijanović G., and Radinger J. (2018). Susceptibility of European freshwater fish to climate change: Species profiling based on life-history and environmental characteristics. Glob. Change Biol. 25, 448–458. doi: 10.1111/gcb.14518
Kellermann V., Chown S. L., Schou M. F., Aitkenhead I. J., Janion-Scheepers C., Clemson A. S., et al. (2019). Comparing thermal performance curves across traits: how consistent are they? J. Exp. Biol. 222, jeb193433. doi: 10.1242/jeb.193433
Larios-Soriano E., Re-Araujo A. D., Díaz F., López-Galindo L., Rosas C., and Ibarra-Castro L. (2021). Effects of recent thermal history on thermal behavior, thermal tolerance and oxygen uptake of Yellowtail Kingfish (Seriola lalandi) juveniles. J. Therm. Biol. 99, 103023. doi: 10.1016/j.jtherbio.2021.103023
Lefevre S., Wang T., and McKenzie D. (2021). The role of mechanistic physiology in investigating impacts of global warming on fishes. J. Exp. Biol. 224 , jeb238840. doi: 10.1242/jeb.238840
Leiva F. P., Calosi P., and Verberk W. C. E. P. (2019). Scaling of thermal tolerance with body mass and genome size in ectotherms: a comparison between water- and air-breathers. Philos. Trans. R. Soc B 374, 20190035. doi: 10.1098/rstb.2019.0035
Lindmark M., Ohlberger J., and Gårdmark A. (2022). Optimum growth temperature declines with body size within fish species. Glob. Change Biol. 28, 2259–2271. doi: 10.1111/gcb.16067
Lutterschmidt W. I. and Hutchison V. H. (1997). The critical thermal maximum: History and critique. Can. J. Zool. 75, 1561–1574. doi: 10.1139/z97-783
Miranda L. E., Coppola G., and Boxrucker J. (2020). Reservoir fish habitats: A perspective on coping with climate change. Rev. Fish. Sci. Aquac. 28, 478–498. doi: 10.1080/23308249.2020.1767035
Molina A. N., Carter M. J., and Rezende E. L. (2024). Plasticity cannot fully compensate evolutionary differences in heat tolerance across fish species. Evolution 78, 1949–1957. doi: 10.1093/evolut/qpae126
Morgan R., Andreassen A. H., Åsheim E. R., Finnøen M. H., Dresler G., Brembu T., et al. (2022). Reduced physiological plasticity in a fish adapted to stable temperatures. Proc. Natl. Acad. Sci. U.S.A. 119, e2201919119. doi: 10.1073/pnas.2201919119
Nati J. J. H., Svendsen M. B. S., Marras S., Killen S. S., Steffensen J. F., McKenzie D., et al. (2021). Intraspecific variation in thermal tolerance differs between tropical and temperate fishes. Sci. Rep. 11, 21272. doi: 10.1038/s41598-021-00695-8
Nozzi N. and Stelzer R. S. (2021). Responses of fish communities to longitudinal thermal gradients in coldwater, lake outflow streams. Environ. Biol. Fishes 104, 1235–1249. doi: 10.1007/s10641-021-01149-w
Olsen T., Shelton J. M., and Dallas H. F. (2021). Does thermal history influence thermal tolerance of the freshwater fish Galaxias zebratus in a global biodiversity hotspot? J. Therm. Biol. 97, 102890. doi: 10.1016/j.jtherbio.2021.102890
Pang X., Fu S. J., Cao Z. D., and Zhang Y. G. (2016). The effects of fasting and acclimation temperature on resting metabolism and swimming performance in qingbo (Spinibarbus sinensis). Acta Ecol. Sin. 36, 1–10. doi: 10.5846/stxb201409281918
Polverino G., Santostefano F., Díaz-Gil C., and Mehner T. (2018). Ecological conditions drive pace-of-life syndromes by shaping relationships between life history, physiology and behavior in two populations of Eastern mosquitofish. Sci. Rep. 8, 14673. doi: 10.1038/s41598-018-33047-0
Richards J. G. (2010). Metabolic rate suppression as a mechanism for surviving environmental challenge in fish. Prog. Mol. Subcell. Biol. 49, 113–139. doi: 10.1007/978-3-642-02421-4_6
Richards J. G. (2011). Physiological, behavioral and biochemical adaptations of intertidal fishes to hypoxia. J. Exp. Biol. 214, 191–199. doi: 10.1242/jeb.047951
Riesch R., Martin R. A., Diamond S. E., Jourdan J., Plath M., and Langerhans R. B. (2018). Thermal regime drives a latitudinal gradient in morphology and life history in a live bearing fish. Biol. J. Linn. Soc 125, 126–141. doi: 10.1093/biolinnean/bly095
Ruthsatz K., Dahlke F., Alter K., Wohlrab S., Eterovick P. C., Lyra M., et al. (2024). Acclimation capacity to global warming of amphibians and freshwater fishes: Drivers, patterns, and data limitations. Glob. Change Biol. 30, e17318. doi: 10.1111/gcb.17318
Scherer L., Boom H. A., Barbarossa V., and van Bodegom P. M. (2023). Climate change threats to the global functional diversity of freshwater fish. Glob. Change Biol. 29, 3781–3793. doi: 10.1111/gcb.16723
Scheuffele H., Rubio-Gracia F., and Clark T. D. (2021). Thermal performance curves for aerobic scope in a tropical fish (Lates calcarifer): flexible in amplitude but not breadth. J. Exp. Biol. 224, jeb243504. doi: 10.1242/jeb.243504
Seibel B. A., Andres A., Birk M. A., Burns A. L., Shaw C. T., Timpe A. W., et al. (2021). Oxygen supply capacity breathes new life into critical oxygen partial pressure (Pcrit). J. Exp. Biol. 224, jeb242210. doi: 10.1242/jeb.242210
Tien N. S. H., de Leeuw J. J., van Rijssel J. C., van der Hammen T., and Volwater J. (2024). Temperature-related increase in growth rate in four freshwater lake fish species. J. Fish Biol. 104, 2044–2055. doi: 10.1111/jfb.15745
Timpe A. W. and Seibel B. A. (2024). A method for correcting systematic error in PO2 measurement to improve measures of oxygen supply capacity. Comp. Biochem. Physiol. A Mol. Integr. Physiol. 298, 111737. doi: 10.1101/2024.02.25.581970
Tims A. R. and Saupe E. E. (2023). Forecasting climate-driven habitat changes for Australian freshwater fishes. Divers. Distrib. 29, 641–653. doi: 10.1111/ddi.13686
van der Walt K. A., Porri F., Potts W. M., Duncan M. I., and James N. C. (2021). Thermal tolerance, safety margins and vulnerability of coastal species: Projected impact of climate change induced cold water variability in a temperate African region. Mar. Environ. Res. 169, 105346. doi: 10.1016/j.marenvres.2021.105346
Varela R., Castro M., Dias J. M., and Gómez–Gesteira M. (2023). Coastal warming under climate change: Global, faster and heterogeneous. Sci. Total Environ. 886, 164029. doi: 10.1016/j.scitotenv.2023.164029
Wang J. W., Cao Z. D., and Fu S. J. (2016). A comparison of constant acceleration swimming speeds when acceleration rates are different with critical swimming speeds in Chinese bream under two oxygen tensions. Fish Physiol. Biochem. 42, 1453–1461. doi: 10.1007/s10695-016-0232-4
Xie S. Q., Zheng K. Z., Chen J., Zhang Z., Zhu X. M., and Yang Y. X. (2010). Effect of water temperature on energy budget of Nile tilapia, Oreochromis niloticus. Aquac. Nutr. 17, e683–e690. doi: 10.1111/j.1365-2095.2010.00827.x
Xu P. L., Pu D. Y., Xia D. Y., Liu X. H., Ding S. L., Li Y., et al. (2021). Individual variation in metabolic rate, locomotion capacity and hypoxia tolerance and their relationships in juveniles of three freshwater fish species. J. Comp. Physiol. B 191, 755–764. doi: 10.1007/s00360-021-01382-w
Xu P. L., Yuan X. B., Cao Z. D., and Fu S. J. (2012). The effects of temperature and exercise training on swimming performance in juvenile qingbo (Spinibarbus sinensis). J. Comp. Physiol. B 183, 99–108. doi: 10.1007/s00360-012-0690-7
Yan G. J., He X. K., Cao Z. D., and Fu S. J. (2013). An interspecific comparison between morphology and swimming performance in cyprinids. J. Evol. Biol. 26, 1802–1815. doi: 10.1111/jeb.12182
Yanar M., Erdoğan E., and Kumlu M. (2019). Thermal tolerance of thirteen popular ornamental fish species. Aquaculture 501, 382–386. doi: 10.1016/j.aquaculture.2018.11.041
Zhang Y. F., Luo Y. L., Huang K. R., Liu Q. Y., Fu C., Pang X., et al. (2024). Constraints of digestion on swimming performance and stress tolerance vary with habitat in freshwater fish species. Integr. Zool. 20, 88–107. doi: 10.1111/1749-4877.12807
Zhang Y. L., Zhou W. Q., Fu S. J., Nadler L. E., Killen S. S., Zhou K. Y., et al. (2025). Social conditions alter the growth, metabolic rate, behavioral traits, and food-shelter preferences in the juvenile qingbo Spinibarbus sinensis. Behav. Ecol. Sociobiol. 79, 44. doi: 10.1007/s00265-025-03588-2
Keywords: reaction norm, thermal tolerance, hypoxia tolerance, locomotion, digestion, temperature acclimation
Citation: Zhang Y-F, Xiang P and Fu S-J (2025) The responses of stress tolerance, physiological performance and energy metabolism to acclimation temperature between tropical and temperate fish species. Front. Mar. Sci. 12:1593656. doi: 10.3389/fmars.2025.1593656
Received: 14 March 2025; Accepted: 28 April 2025;
Published: 21 May 2025.
Edited by:
Lu Cai, Ministry of Water Resources and Chinese Academy of Sciences, ChinaReviewed by:
Minne Li, China Three Gorges University, ChinaMin Fang, Yellow River Liaocheng Bureau, China
Copyright © 2025 Zhang, Xiang and Fu. This is an open-access article distributed under the terms of the Creative Commons Attribution License (CC BY). The use, distribution or reproduction in other forums is permitted, provided the original author(s) and the copyright owner(s) are credited and that the original publication in this journal is cited, in accordance with accepted academic practice. No use, distribution or reproduction is permitted which does not comply with these terms.
*Correspondence: Shi-Jian Fu, c2hpamlhbmZ1OUBjcW51LmVkdS5jbg==
†ORCID: Ping Xiang, orcid.org/0009-0001-2772-0919