 Naoki Saito
 Travis W. Washburn
 Masayuki Nagao2
 Atsushi Suzuki
- 1Integrated Research Center for Nature Positive Technology, National Institute of Advanced Industrial Science and Technology (AIST), Tsukuba, Japan
- 2Geological Survey of Japan, National Institute of Advanced Industrial Science and Technology (AIST), Tsukuba, Japan
- 3Department of Physical and Environmental Science, Texas A&M University - Corpus Christi, Corpus Christi, TX, United States
- 4Japan Organization for Metals and Energy Security (JOGMEC), Tokyo, Japan
Deep-sea mining at seamounts can generate large amounts of suspended particles, or sediment plumes, which have the potential to cause environmental impacts. The physical oceanography at seamounts, including internal tides, is expected to complicate plume behavior. However, research incorporating numerical simulations to evaluate this influence is virtually nonexistent. In this study, we conducted hydrodynamic modeling and simulated dispersal and deposition of plumes across the entire seamount summit. The simulations were based on a crust excavation test conducted in 2020 and targeted suspended particles of ≥30 μm, which accounted for the majority of the plume volume. The modeled near-bottom tidal currents at the summit were ≤7 times stronger than those outside the seamount, indicating the occurrence of internal tides, with tidal current strength varying spatially across the summit. The deposition distances of plumes varied by a factor of ≤6.5 (~120–800 m), depending on the discharge location. Plumes tended to be deposited farther and in a thinner layer around sites with stronger tidal currents, whereas they were deposited closer and thicker around sites with weaker tidal currents. This study suggests that the spatial variability in tidal current strength, driven by internal tides, can alter the extent of plume dispersal and deposition by several-fold depending on the mining site. Understanding oceanographic heterogeneity within seamount summits can be crucial for assessing and mitigating the environmental impacts of mining.
1 Introduction
The deep-sea seamounts of the Northwest Pacific are covered with cobalt-rich crusts (“crusts”), which are potential mineral resources and expected to be the setting for future mining. Thick crusts typically form on seamount summits at ~800–2500 m depth (Hein et al., 2009, 2013). To be economically feasible, approximately 260 km2 of seafloor per seamount may need to be mined over a period of up to 20 years (Hein et al., 2009, 2013). The International Seabed Authority (ISA) is currently working on developing Regional Environmental Management Plans (REMPs) in waters beyond national jurisdiction in anticipation of deep-sea mining. However, a major challenge to proper management is that the environmental impacts of mining have not been adequately studied (Smith et al., 2020; Amon et al., 2022; Blanchard et al., 2023).
One of the particular concerns in deep-sea mining is the environmental impact of large quantities of suspended particles, or sediment plumes. These plumes are expected to result from the movement of mining machines, excavation of crusts, and discharge of unwanted collected sediments (Drazen et al., 2020; Spearman et al., 2020; Peacock and Ouillon, 2023). Once released, the plumes can be dispersed and deposited near mining areas or farther away (Drazen et al., 2020; Spearman et al., 2020; Peacock and Ouillon, 2023). Plumes may affect biodiversity and ecosystem functions, in addition to other potential stressors such as direct habitat removal, noise, and cumulative impacts involving other human activities (Glover and Smith, 2003; Washburn et al., 2019; Amon et al., 2022).
Although there is an urgent need to accumulate environmental impact estimates prior to the start of mining, data on plumes generated by crust mining are extremely limited. No publicly available commercial excavator designs or operational plans exist for crust mining, making it difficult to predict the physical properties of plumes (Weaver et al., 2022; Peacock and Ouillon, 2023). A small-scale excavation test conducted at Takuyo-Daigo Seamount in 2020 is the only published case study of crust excavation (Saito et al., 2023; Washburn et al., 2023). Washburn et al. (2023) compared areas where the plume from excavation was likely deposited with areas where it was likely not and reported that densities of mobile organisms such as fish and sea cucumbers were depressed in the deposition area one year after the excavation. Spearman et al. (2020) is the only simulated case of plumes at seamounts to our knowledge, and they estimated the physical properties of the crust plume particles based on field disturbance experiments and dredging of weak, weathered rocks. Most existing studies of plumes produced by deep-sea mining focus on the mining of manganese nodules (“nodules”) in the abyssal plains of the eastern Pacific (i.e., Clarion-Clipperton Zone) (Rolinski et al., 2001; Aleynik et al., 2017; Gillard et al., 2019; Purkiani et al., 2021; Muñoz-Royo et al., 2022; Gazis et al., 2025), with limited attention to crust mining at seamounts. Simulations in these studies have shown the influence of relatively stable flows in the abyssal plains, generally with velocities on the order of 1 cm/s (Aleynik et al., 2017), on plume dispersion and deposition.
Despite a dearth of evidence, there has been speculation of the importance of complex flow fields at seamounts on plume behavior. Seamounts act as obstacles to passing flows, disturbing the ocean interior. As a result, seamounts cause spatial variations in the flow field, both locally and globally, ranging from turbulent scales to scales of tens of kilometers or more (Garrett, 2003; Baines, 2007; Lavelle and Mohn, 2010). Thus, the relationship between flow and plume behavior in seamount mining is expected to be much more complex than that in nodule mining in the relatively flat abyssal plains (Spearman et al., 2020; Peacock and Ouillon, 2023).
Internal tides may be a particularly important physical oceanographic feature influencing the transport of suspended sediments at seamounts. Seamounts impede the progress of tidal waves and convert some of the tidal energy into oscillations of internal isopycnal surfaces, or internal tides (Garrett, 2003; Baines, 2007; Lavelle and Mohn, 2010). Internal tides strengthen tidal currents on seamount summits several times more than those in the open ocean, and velocities can be on the order of 10 cm/s (Genin et al., 1989; Eriksen, 1991). The only previous plume simulation conducted at a seamount (Spearman et al., 2020) found that internal tides may have a dominant effect on the direction and distance of plume dispersion. However, in that simulation, the plume was discharged from only one location on the seamount. Crust mining is expected to cover approximately 20% (~260 km2) of the average surface area of seamounts shallower than 2500 m depth (Hein et al., 2009). Thus, simulations over a wide area of the seamount summit are needed to understand the interaction of the plume with the physical oceanography of the entire seamount.
This study explored the potential effects of internal tides on plume dispersion and deposition across the entire summit of a seamount. The target seamount, Scripps Guyot, is considered a potential mining site (International Seabed Authority, 2024). Hydrodynamic modeling was conducted to characterize the tidal currents around the seamount. The model was validated using in situ flow observations from three sites. Based on this model, plume discharges from different points across the seamount summit were simulated. Plume properties and mining operations were set based on measurements from small-scale crust excavation test conducted in 2020 (Saito et al., 2023; Washburn et al., 2023). This study focuses on plume dynamics during the phase being passively transported by ocean currents, after moving away from the immediate vicinity of the excavator (Peacock and Ouillon, 2023). The purpose of this study is to fill a fundamental gap in physical oceanographic knowledge concerning sediment plumes and to contribute to the development of environmental management plans at seamounts.
2 Materials and methods
2.1 Study area
The Scripps Guyot has a nearly flat top at a depth of ~1200–1500 m and rises approximately 4000 m above the surrounding abyssal plain (Figures 1A, B). The summit extends 40 km in the north-south direction and 25 km in the east-west direction. The Japan Organization for Metals and Energy Security (JOGMEC) was issued an exploration contract for the area by the ISA (International Seabed Authority, 2024). In this study, the seamount summit was defined as the seafloor at a depth of ≤1500 m with a slope of less than 2°, as calculated using QGIS (Supplementary Figure S1).
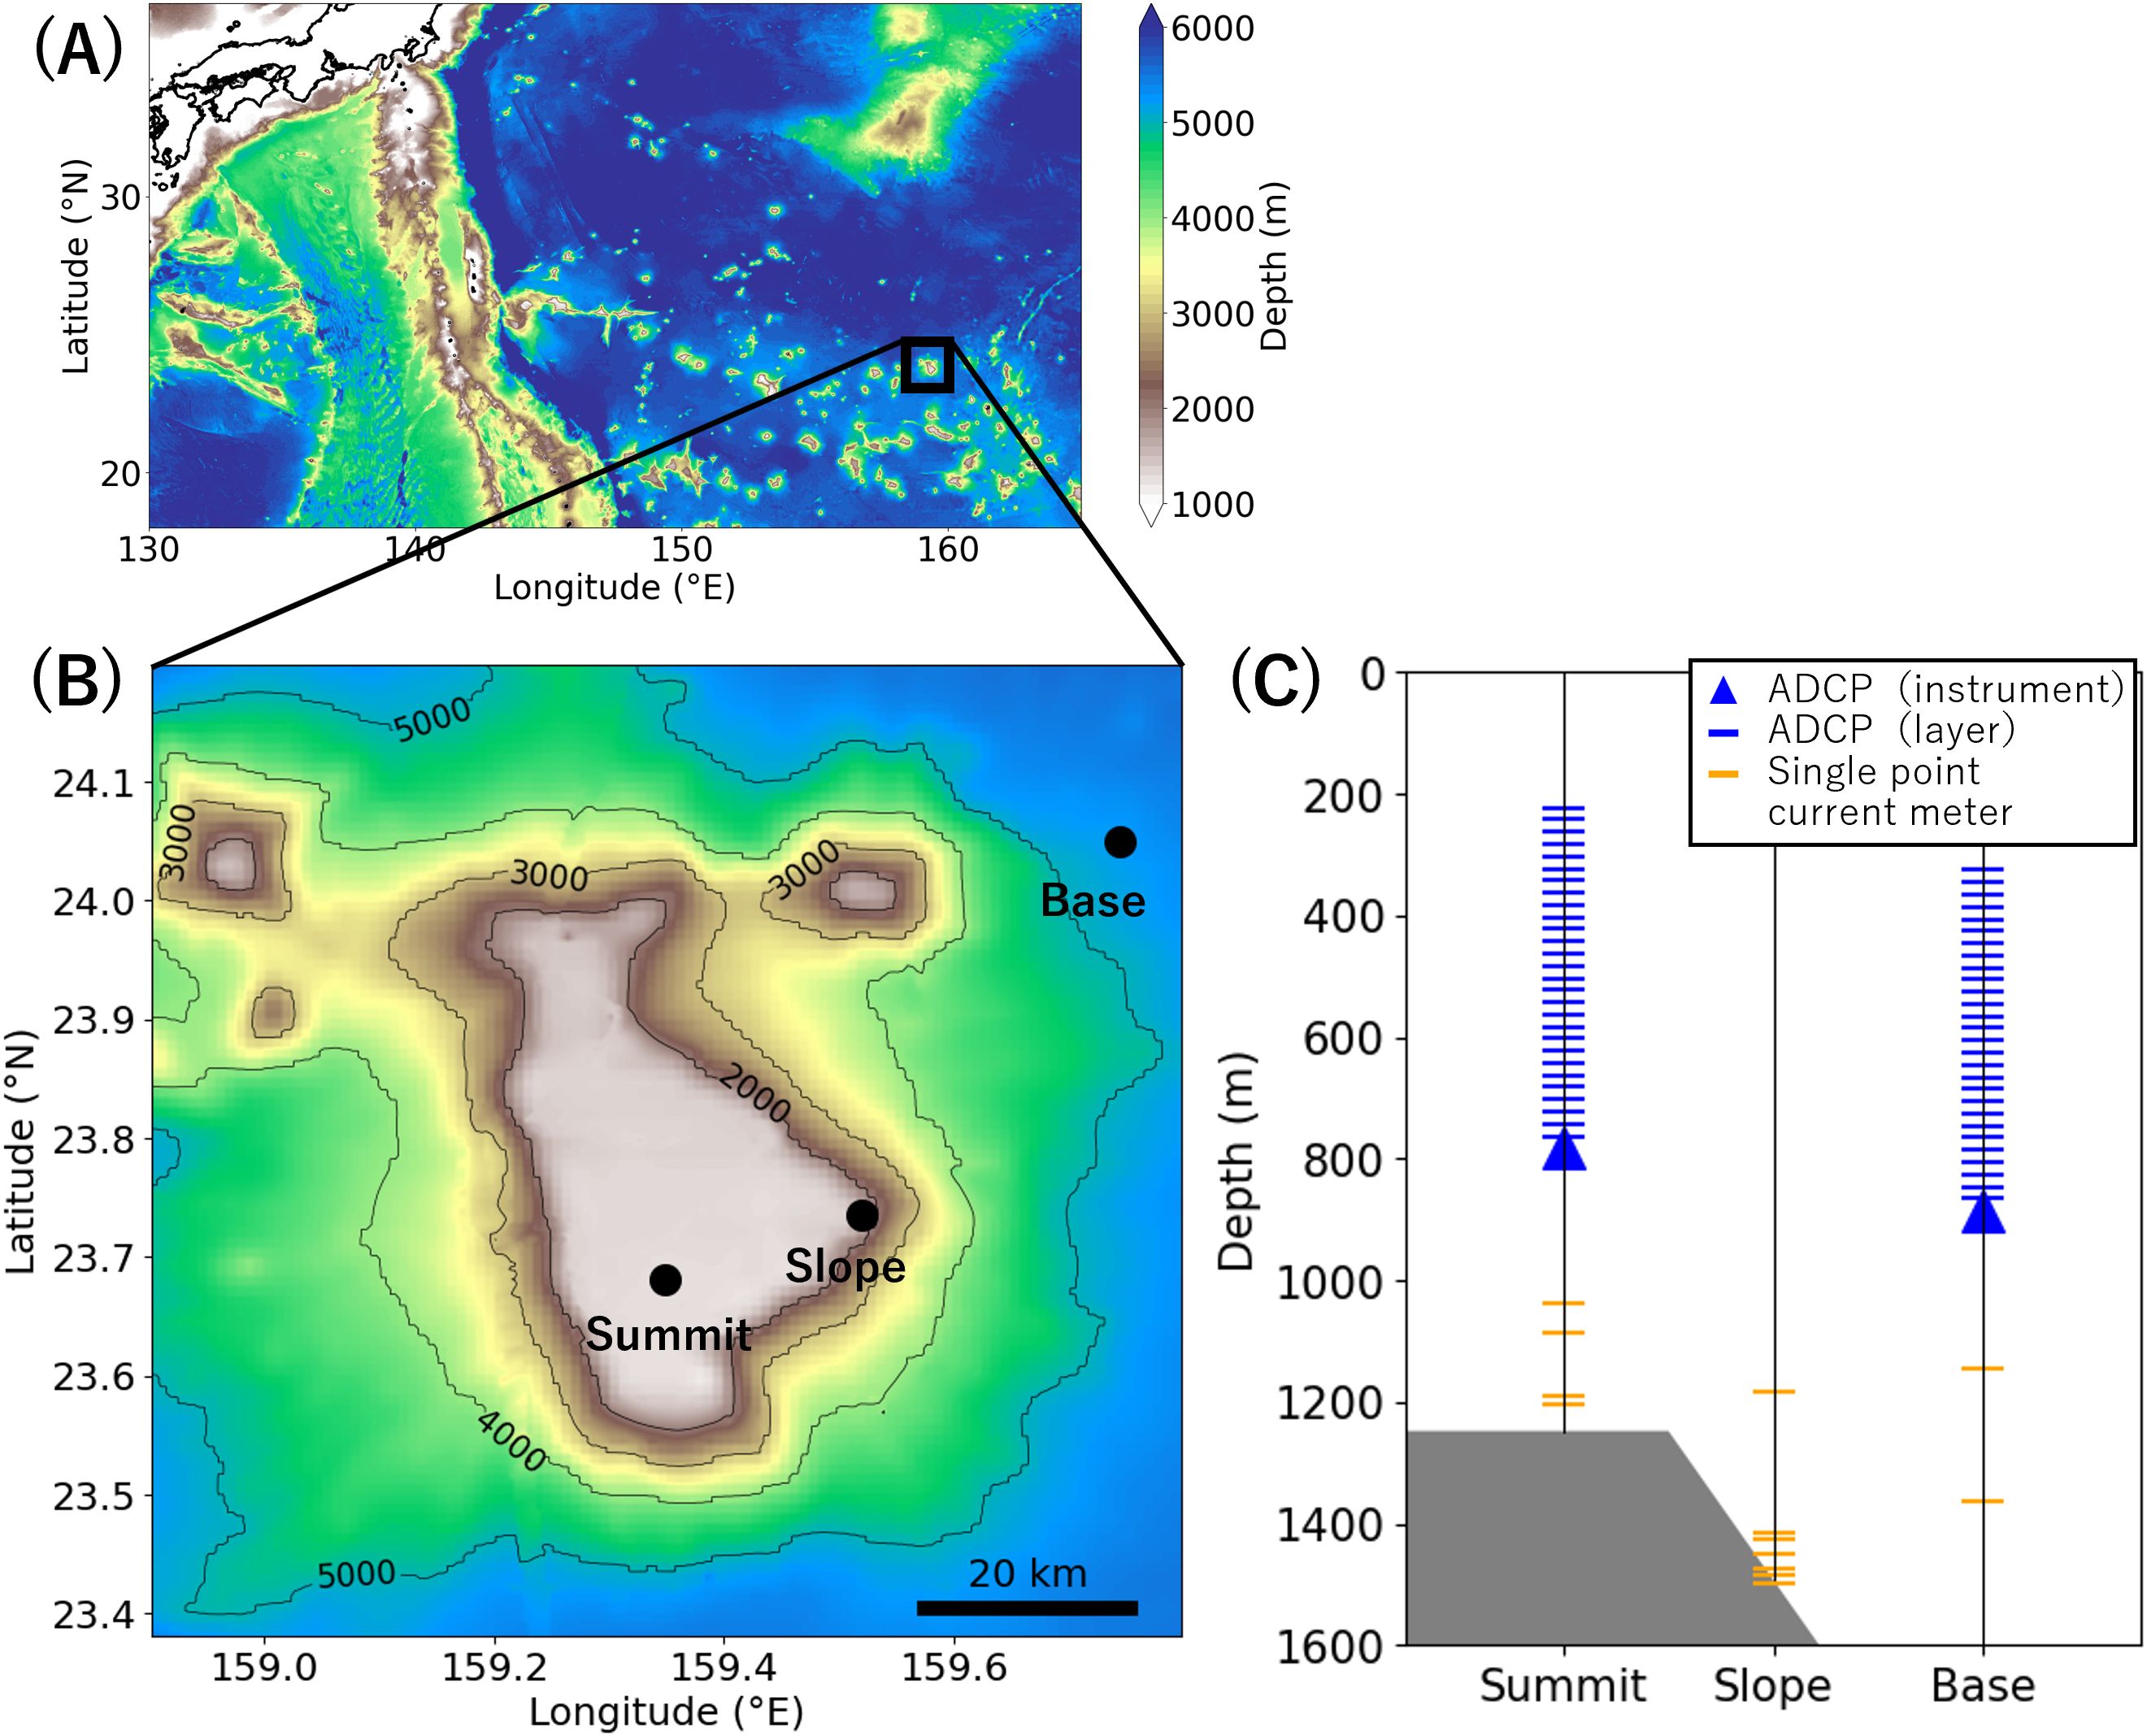
Figure 1. Study area. (A, B) show the map of the Scripps Guyot. In (B), black points indicate observation sites. (C) shows observation depth at each site. In (C), orange bars indicate single point current meters, blue triangles indicate ADCPs, and blue bars indicate ADCP observation layers.
2.2 Hydrodynamic modeling
Modeling around the seamount was carried out using the numerical model Delft3D (Deltares, 2022). The mathematical principle of Delft3D is to solve the Reynolds-averaged Navier-Stokes equations for incompressible fluids using finite difference methods. The model was set to be three-dimensional and hydrostatic. Turbulent processes were modeled based on eddy viscosity. The vertical eddy viscosity and eddy diffusion coefficients were calculated using the k-ϵ model, a method that derives turbulent kinetic energy k and turbulent kinetic energy dissipation rate ϵ obtained from the transport equations (Deltares, 2022).
The model area was 4.2° × 4.4° (157.3–161.5° E, 21.6–26.0° N) and the area near the seamount (158.6–160.0° E, 23.15–24.4° N) was increased in resolution by two-way nesting (Supplementary Figure S2). The horizontal resolution was set to = = 1/50° (≈ 2.2 km) in the outer region and = = 1/250° (≈ 0.44 km) in the inner region. The vertical resolution was set at 36 layers in the Z-coordinate system, extending from the surface to the abyssal plain of 5500 m depth (see Supplementary Figure S3 for details). The finest vertical resolution was = 27.5 m directly above the summit seafloor and the coarsest resolution was = 440 m directly above the abyssal plain. The calculation target period spanned 15 days, from December 1 to December 15, 2019. The time step was set at 0.6 minutes. The target period was preceded by a 10-day spin-up period, resulting in a total calculation period from November 21 to December 15, 2019.
The model focused on tidal currents, with the main forcing provided by the tides at the open boundaries. Note that this model does not include the effects of background baroclinic currents and mesoscale eddies. To avoid model complexity, tidal components were calculated only for M2 (semi-diurnal) and K1 (diurnal), which are more dominant than inertial oscillation components in field flow measurements at the summit (Supplementary Figure S4, see below for observation details). The tidal levels for the open boundary conditions were taken from the tidal model TPXO9-atlas (1/30° resolution) (Egbert and Erofeeva, 2002). In addition, Delft3D was configured to include tide generating forces at open boundaries, incorporating the contribution of gravitational forces to the motion of large water masses in the deep sea (Deltares, 2022). The direction of tidal waves propagating over the model area was predominantly from west-northwest to east-southeast (Supplementary Figure S5). To weaken the reflection of waves propagating from the inside of the model to the boundary, a reflection parameter was set at the western and southern lateral boundaries, where T is the time it takes for a free surface wave to travel from one open boundary to the boundary in the opposite direction, H is the water depth, and g is the gravitational acceleration. Multiplying by the time derivative of the Riemann invariant and adding it to the water level resulted in the water surface boundary condition . That is, , where is the free surface elevation above the still water level, and U is the horizontal velocity (Deltares, 2022).
Water temperature and salinity for initial and open boundary conditions were taken from in situ CTD data at the base observation site (Figure 1B). CTD profiles, from the surface to a depth of ~5200 m, were obtained from 7:00 to 12:00 on October 24, 2019, by vertically deploying an SBE 911 plus (Sea-Bird Scientific) from the research vessel, with a measurement interval of 1 m. Meteorological conditions, i.e., air temperature, relative humidity, fraction cloud coverage, and net solar radiation, were obtained from the meteorological reanalysis data NCEP/NCAR Reanalysis 1 (2.5° resolution) (Kalnay et al., 1996) and used to calculate heat fluxes between the atmosphere and sea surface. Topographic data were obtained from the GEBCO 2022 Grid (1/240° resolution) (GEBCO Compilation Group, 2022). In order to focus specifically on the interaction between the topography of Scripps Guyot and flow, convex topography was removed from the model domain outside Scripps Guyot and two small adjacent seamounts (Figure 1B). Topography was smoothed by a moving average of 10 neighboring cells.
Modeled tidal currents were validated by comparison of modeled results with in situ flow observations from mooring systems at three sites: the summit, slope, and base (Figure 1B). A total of 13 single point current meters (DW-Aquadopp, Nortek AS) and two 75 kHz acoustic Doppler current profilers (ADCPs) (WorkHorse, Teledyne RD Instruments) were installed. The instruments and observed depths for each site are illustrated in Figure 1C. The observation period was from October 21, 2019 to August 11, 2020. The measurement interval was one hour for both instruments. There were 30 observation layers for ADCPs, each with a thickness of 20 m. The accuracies of both instruments were ± 0.5 cm/s. For more details on field flow observations, see Saito et al. (2024). In the observations and model results, the tidal ellipses, which represent the amplitudes and directions of the tidal currents by their magnitude and orientation, were determined by the analysis package UTide for Python (Codiga, 2011).
2.3 Plume simulation
The physical properties of the plume from modeled mining operations were set based on a small-scale crust excavation test at Takuyo-Daigo Seamount in 2020 (Saito et al., 2023; Washburn et al., 2023). In the test, the excavator was equipped with a drum cutter head and a cyclone tank for material collection. Crusts, with accompanying rocks and sediments, were collected from an area of ~100 m2. During excavation, ore and seawater were separated inside the cyclone tank, and seawater was discharged through the outlet 3.75 m above the seafloor. Fine particles, primarily composed of crustal material, were released along with seawater, forming sediment plumes near the seafloor. The discharge rate of the crust particles was estimated to be 0.022 m3/h. Seawater containing the plume was collected using Niskin bottles attached to the ROV, and the size distribution and settling velocity of the particles in the plume was determined (Suzuki et al., in preparation). For more details on observations of the excavation test, see Saito et al. (2023) and Washburn et al. (2023). The discharge height, discharge speed, and particle size distribution of the plume in the excavation test were used as settings in the simulation.
The simulation focused on the dispersion and deposition of plume particles in the vicinity of the mining site. The modeled plume consisted of particles larger than 30 μm in diameter that accounted for 81% of the plume volume in samples collected during the crust excavation test (Table 1). Finer particles (i.e., less than 30 μm), which were excluded from this study, are expected to remain suspended for longer periods and to disperse over a wider area at very low concentrations (Rolinski et al., 2001; Gillard et al., 2019; Spearman et al., 2020), making them difficult to observe and model. This study focused on relatively high concentrations of particles, which are of particular concern for the ecological impacts (Glover and Smith, 2003; Washburn et al., 2019; Amon et al., 2022). Four particle sizes were used for simulated discharges: 30 μm, 50 μm, 90 μm, and 230 μm (Table 1), which were representative sizes of the sediment plume measured in the excavation test. Settling velocities ranged from 0.954 mm/s for 30 μm particles to 56.1 mm/s for 230 μm particles (Table 1). Particles were discharged from 3.75 m above the seafloor, the location of the cyclone tank outlet. Particles were assumed to have been deposited when they settled 3.75 m below the discharge height. The effects of resuspension and of terrain features smaller than the model’s spatial resolution were not considered. With the above setup, particles of all four sizes were always deposited within 1.09 hours of discharge. This simulation was targeted for the flat-top with slopes of 2° or less, and the process of sliding downslope was not included. Note that these simplifying assumptions may lead to underestimation of the spatial extent of deposit thickness.
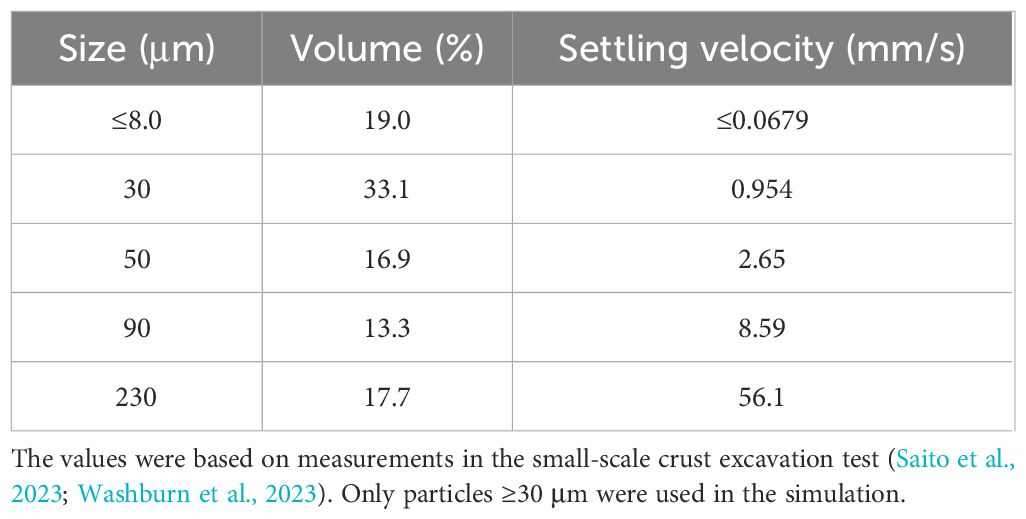
Table 1. Physical properties of plume particles from crust excavation.
The simulations were performed by Lagrangian particle tracking analysis and used the Python package Parcels (Delandmeter and van Sebille, 2019). The trajectories of the particles were calculated by the following equation: where X is the position of the particle, is the three-dimensional velocity field at that location, and is a change in vertical position due to settlement. The velocity field was obtained from a hydrodynamic model, with linear interpolation applied for values finer than the model’s spatial and temporal resolution. The focus was on particle advection, so random diffusion due to turbulence or thermal motion was not considered. The calculation time step was 1 minute. At the seamount summit, particles were discharged from a total of 604 locations spaced at 880 m intervals. Particles representing the four particle sizes were emitted from all emission points, one per hour. The simulation period was set to one week, from December 1 to December 7, 2019, covering a tidal cycle from spring tide to neap tide (Supplementary Figure S6). Thus, a total of 672 particles were calculated for each site and 405,888 particles across all sites. As the hydrodynamic model was primarily driven by tidal forcing, the simulation results were expected to exhibit periodicity and to be free from statistical noise (see also the Results section).
The “deposition distance” was defined as the distance from the discharge point to the farthest deposited particle. The deposition thickness T for each 50 m × 50 m area was calculated using the following equation: where s is the particle size, is the volume of deposited particles of size s, and A is the area of 50 m × 50 m. The volume of particles of each size released per hour, , was determined by: , where v is the plume emission rate of 0.022 m3/h from the excavation test (Saito et al., 2023; Washburn et al., 2023), and is the percentage of the plume volume for each particle size. For example, particles of 30 μm, which accounted for 33.1% of the plume volume, had a calculated emission rate of = 0.0073 m3/h.
3 Results
3.1 Characteristics of tidal currents
Modeled tidal currents were stronger over the seamount summit compared to the surrounding area (Figure 2), indicating the occurrence of internal tides (Baines, 2007; Lavelle and Mohn, 2010) here. At 3.75 m above the seafloor, which corresponds to the plume discharge depth, the tidal currents at the summit were ≤7 times stronger than those outside the seamount.
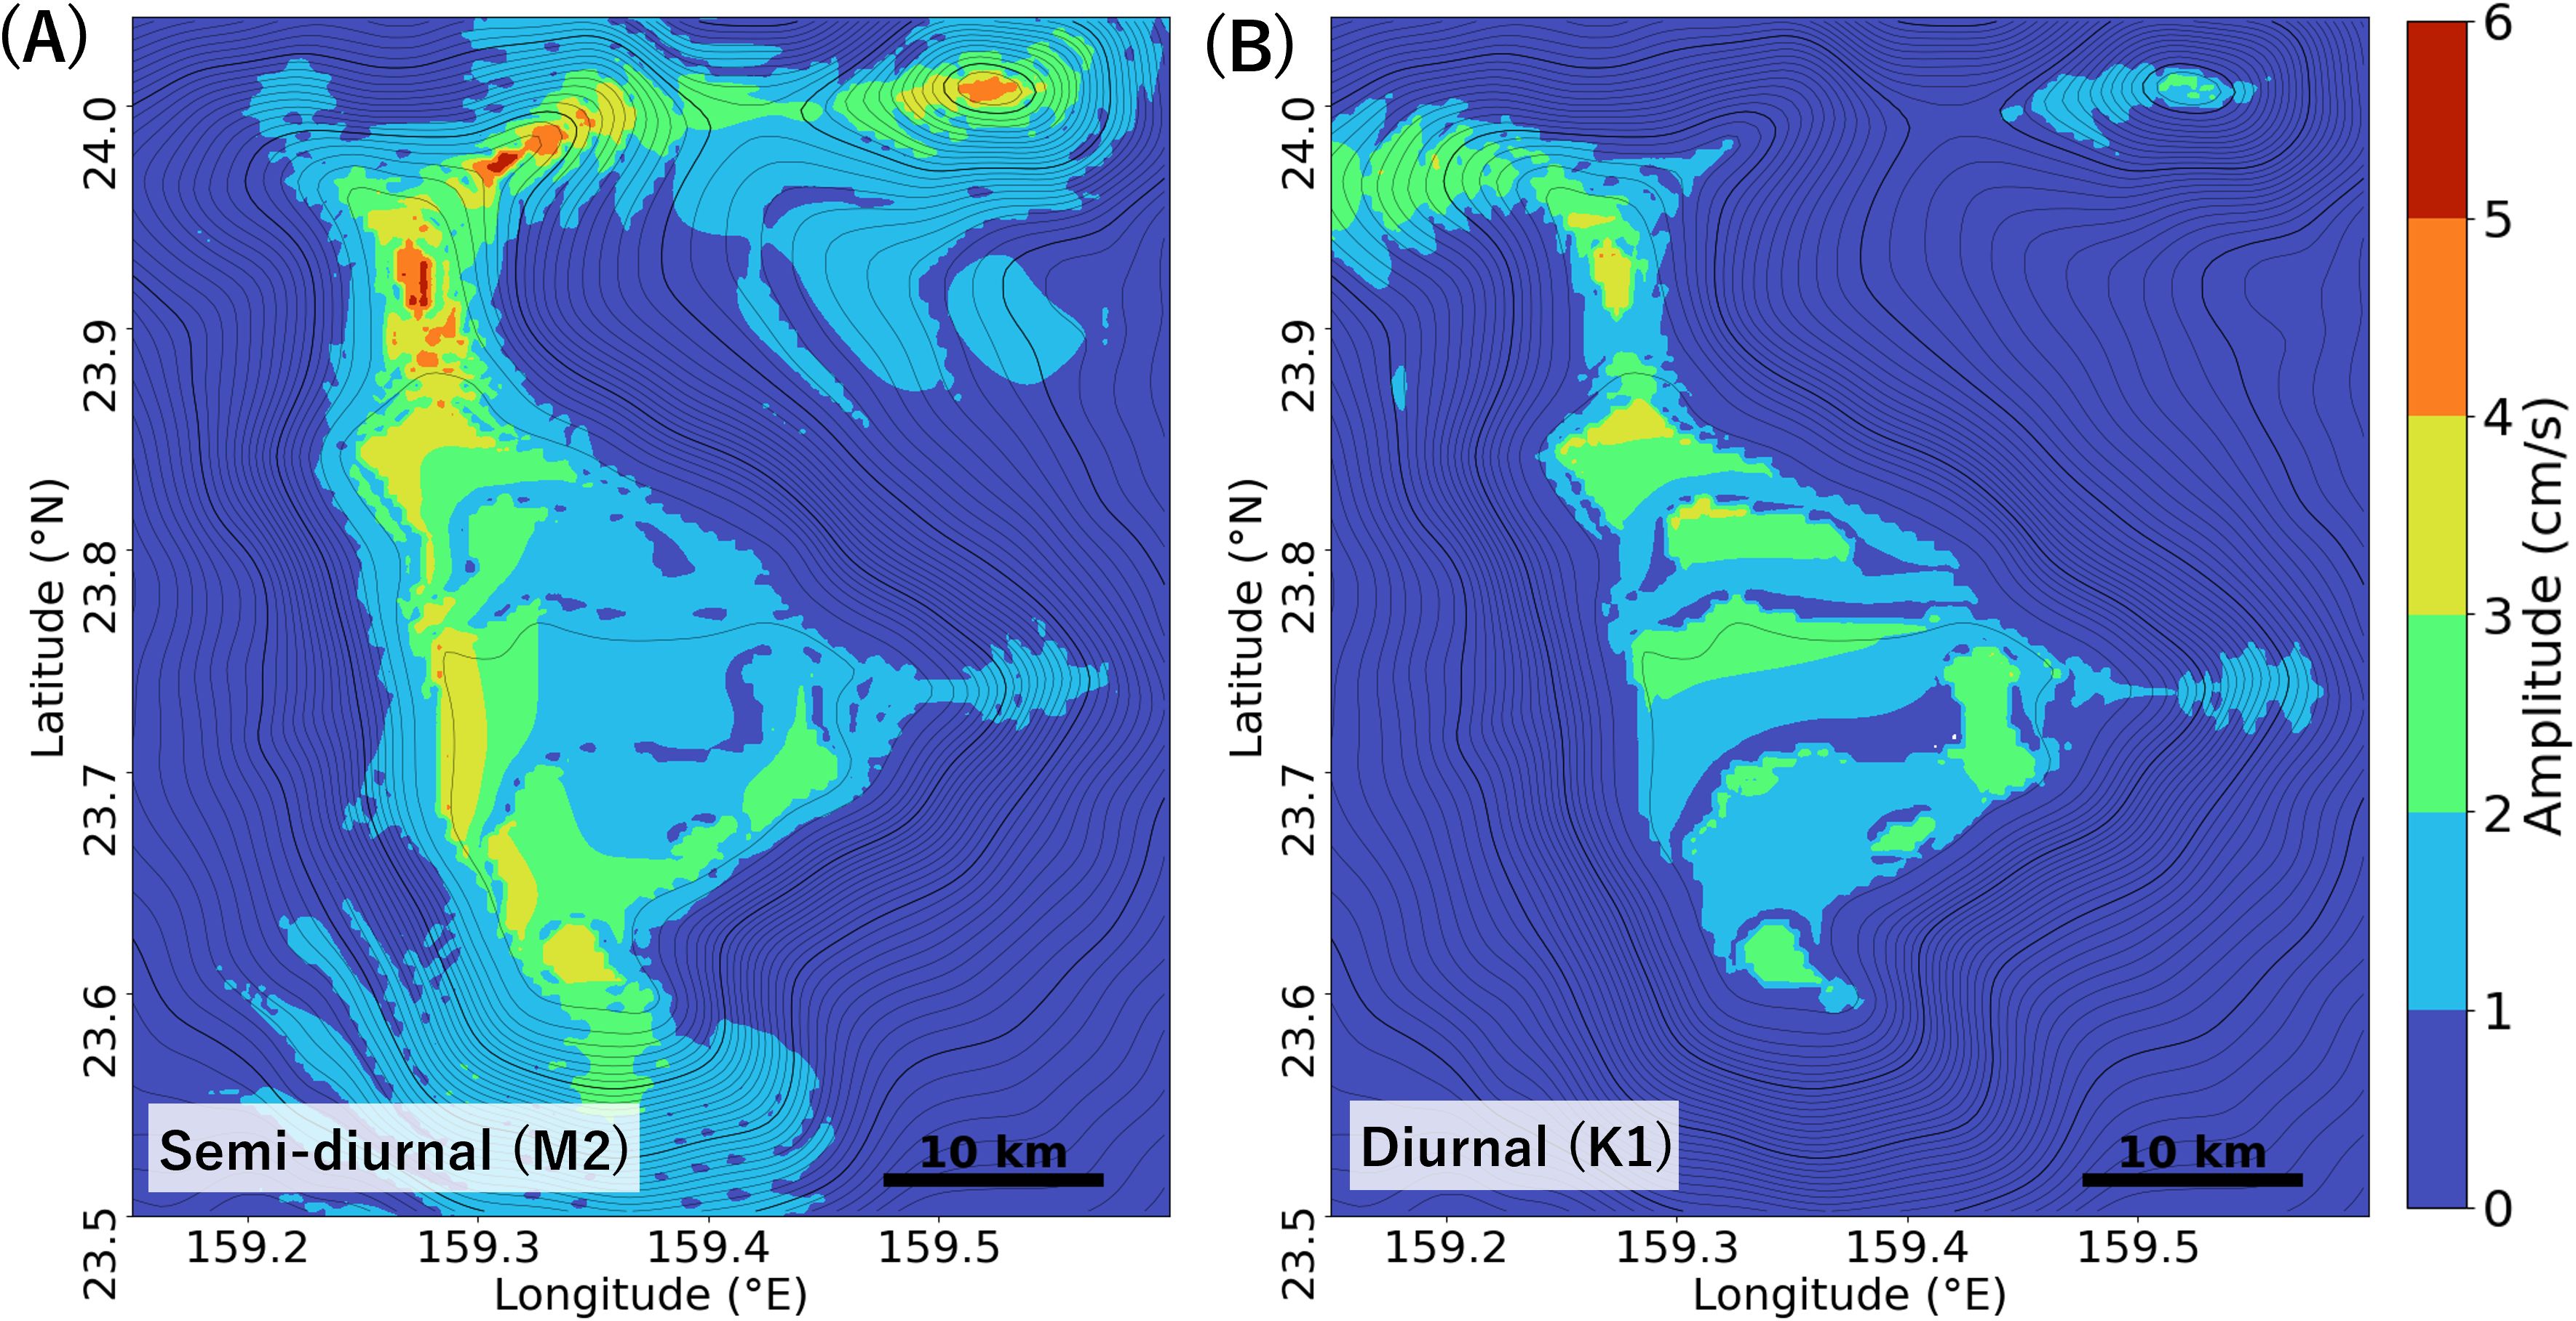
Figure 2. Modeled tidal current strengths over the seamount summit. Colors indicate the amplitude of the tidal current at 3.75 m above the seafloor, corresponding to the plume discharge depth. (A) shows the semi-diurnal M2 component and (B) shows the diurnal K1 component. Topographic contours are at intervals of 1000 m for thick lines and 100 m for thin lines.
Tidal current strengths were uneven across the summit. At 3.75 m above the seafloor, the amplitude of M2 tidal currents varied by ≤9.6 times (ranging from 0.5 cm/s to 4.8 cm/s), while the amplitude of the K1 tidal currents varied by ≤8.0 times (ranging from 0.4 cm/s to 3.6 cm/s) within the summit. The tidal currents were strongest at the northern tip of the summit for both M2 and K1. The distribution patterns of the tidal current strength differed between M2 and K1. The M2 tidal currents were relatively stronger (>3 cm/s) at the western edge of the summit, whereas K1 tidal currents were relatively stronger (>2 cm/s) at the center of the summit.
The modeled tidal currents were validated by comparing them with field observations. For both M2 and K1 tidal components, field observations showed that the tidal currents were ≤4.1 times stronger at ≤200 m above the seafloor at the summit than in other areas, and the model was able to reproduce this trend (Figure 3). At 1100 m depth, the difference in tidal current amplitude between the model and observations was less than 1.0 cm/s for both the M2 and K1 (Supplementary Tables S1, S2). The modeled M2 amplitude (2.2 ± 0.06 cm/s, ± indicates 95% confidence interval) was 0.1 cm/s larger than the field observation value (2.1 ± 0.1 cm/s), while the modeled K1 amplitude (2.2 ± 0.1 cm/s) exceeded the field observation value (1.4 ± 0.1 cm/s) by 0.8 cm/s. The difference between the model and the field observations for the direction of the maximum tidal current was within ~30° for both M2 and K1. The difference was 5.7°for M2 (model: 169.9 ± 2.6°, observation: 164.2 ± 7.1°) and 31.1°for K1 (model: 47.8 ± 9.1°, observation: 16.7 ± 65.2°).
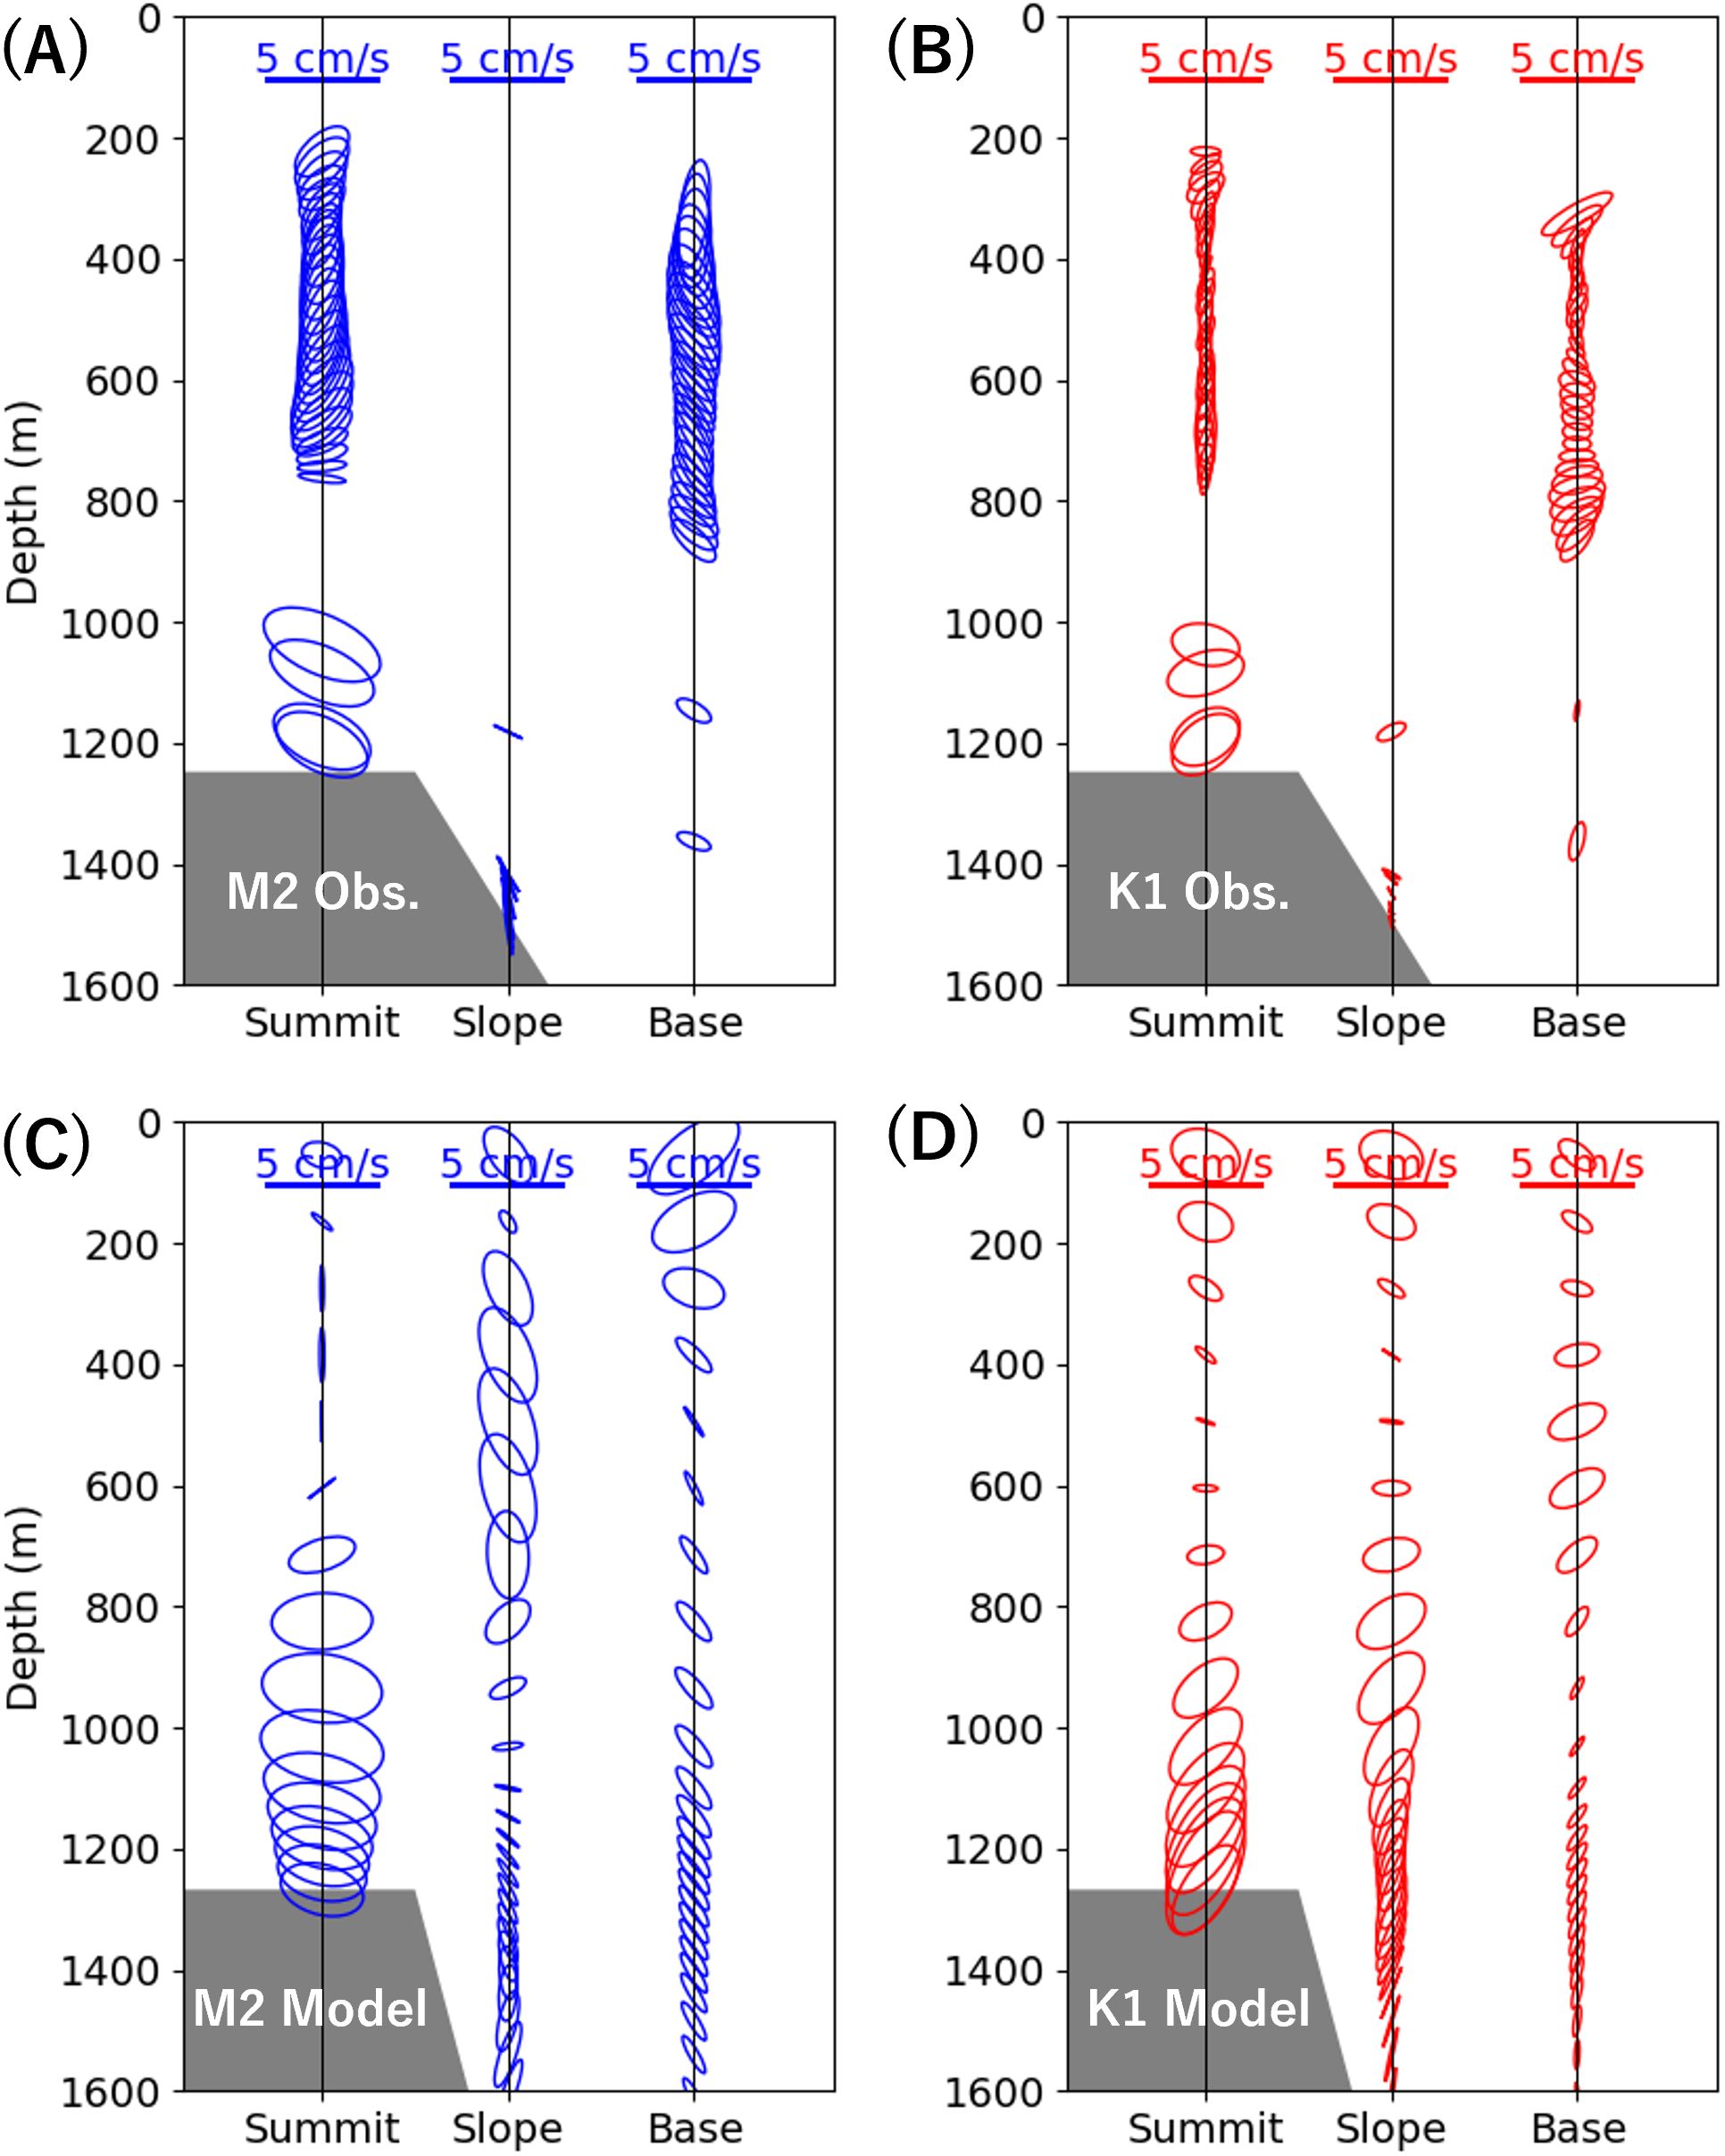
Figure 3. Comparison of tidal currents between the model and in situ observations. Tidal current ellipses are shown for each site and depth, where the size represents tidal current strength, and the orientation represents current direction. (A, B) show semi-diurnal M2 and diurnal K1 components from in situ observations, and (C, D) show the corresponding model results. See Figure 1B for locations of summit, slope, and base observation sites.
3.2 Plume dispersal and deposition
Deposition distances varied by a factor of ≤6.5 depending on the particle discharge points, ranging from 122 m to 798 m (Figures 4, 5). The average deposition distance among all the discharge points was 346 m, with a standard deviation (SD) of 121 m. The median was nearly identical at 347 m. The deposition distances corresponded to the tidal current strength at the discharge points. Longer deposition distances occurred at the northern tip, where both M2 and K1 were strong (Figure 2). Short deposition distances occurred predominantly from the eastern margin, where both M2 and K1 were weak (Figure 2). The deposition distances were highly correlated with M2 (R = 0.77; p < 0.001) and K1 (R = 0.66; p < 0.001) amplitudes. Due to the periodicity of the tidal currents, particles were deposited in an elliptical region centered on each discharge point (Figure 5), with no particles deposited at exceptionally distant locations that could introduce statistical noise.
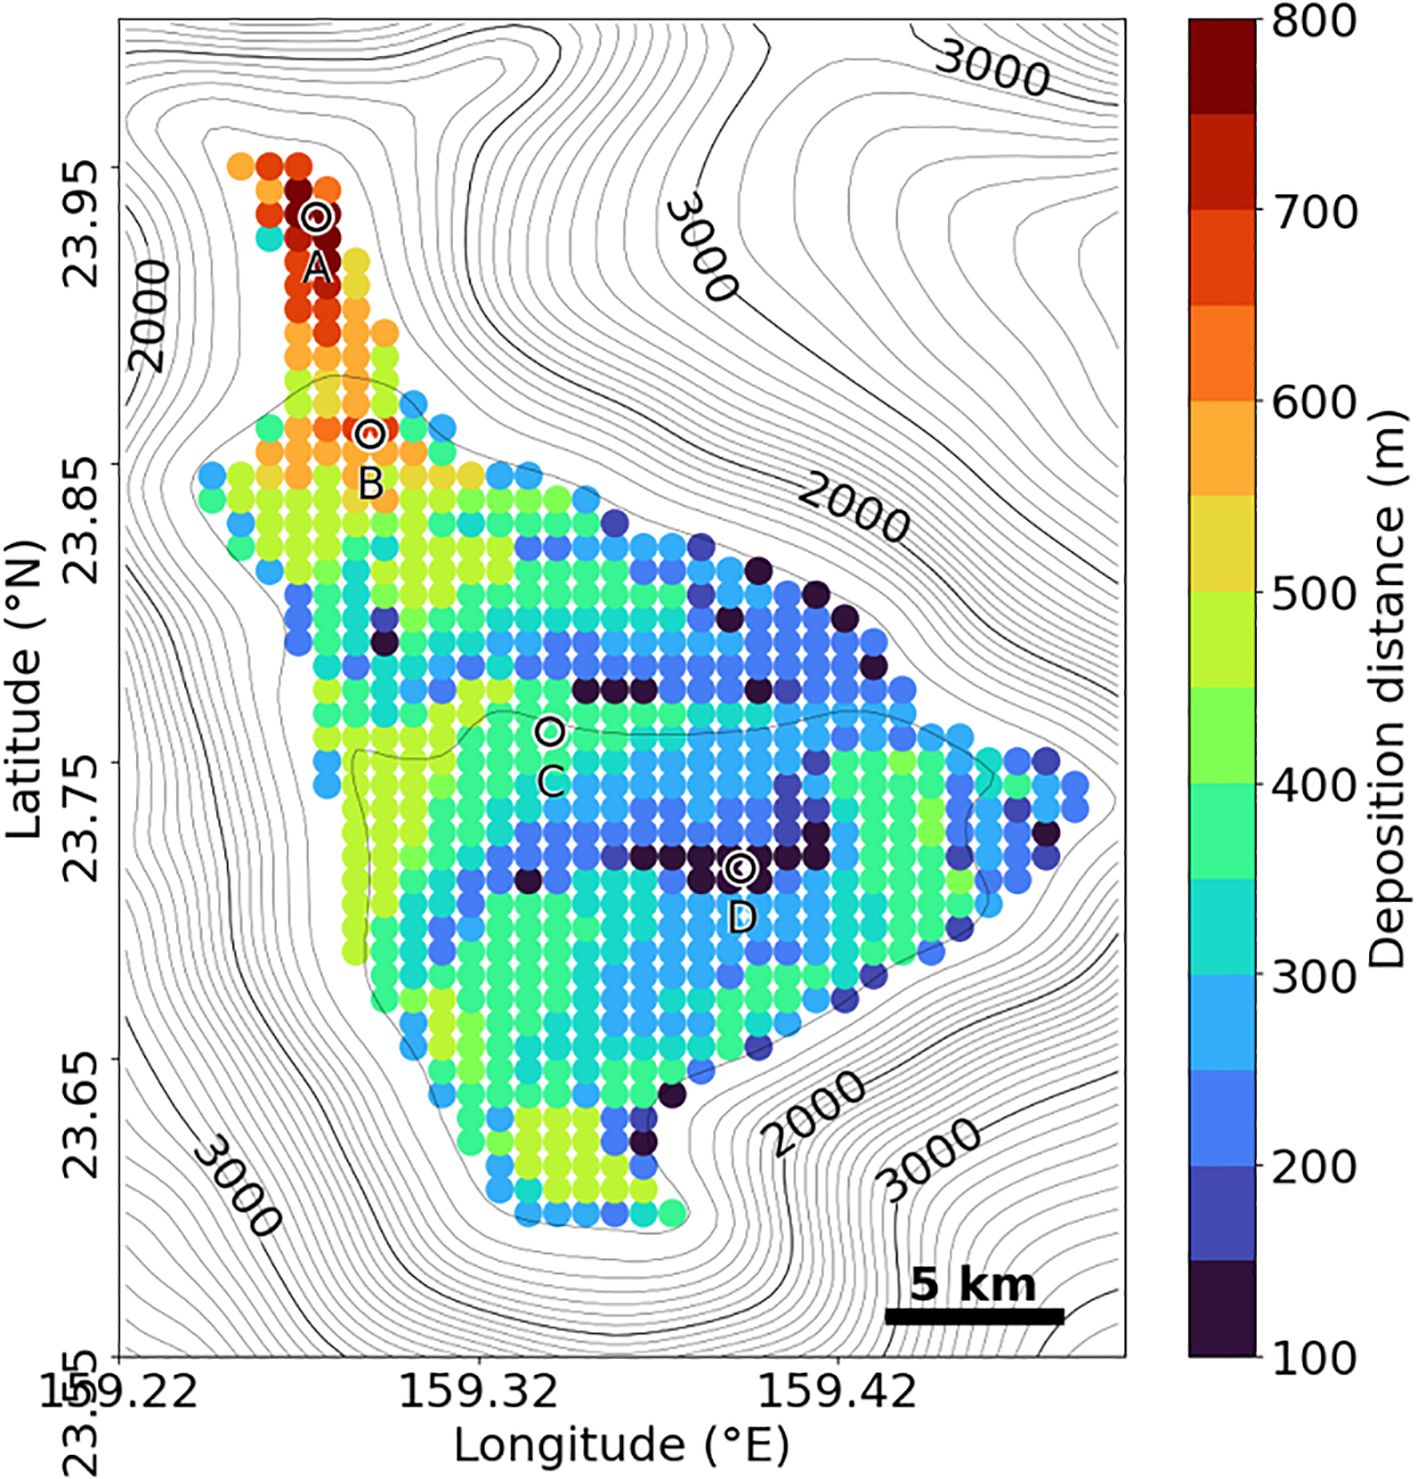
Figure 4. The distance of the farthest deposited plume particles from each discharge location. Each point represents one of the 604 discharge locations across the summit, with colors indicating the deposition distance. Redder colors indicate a greater distance of deposition for the particles released at that location. Sites (A–D) represent the locations illustrated in Figures 5 and 6.
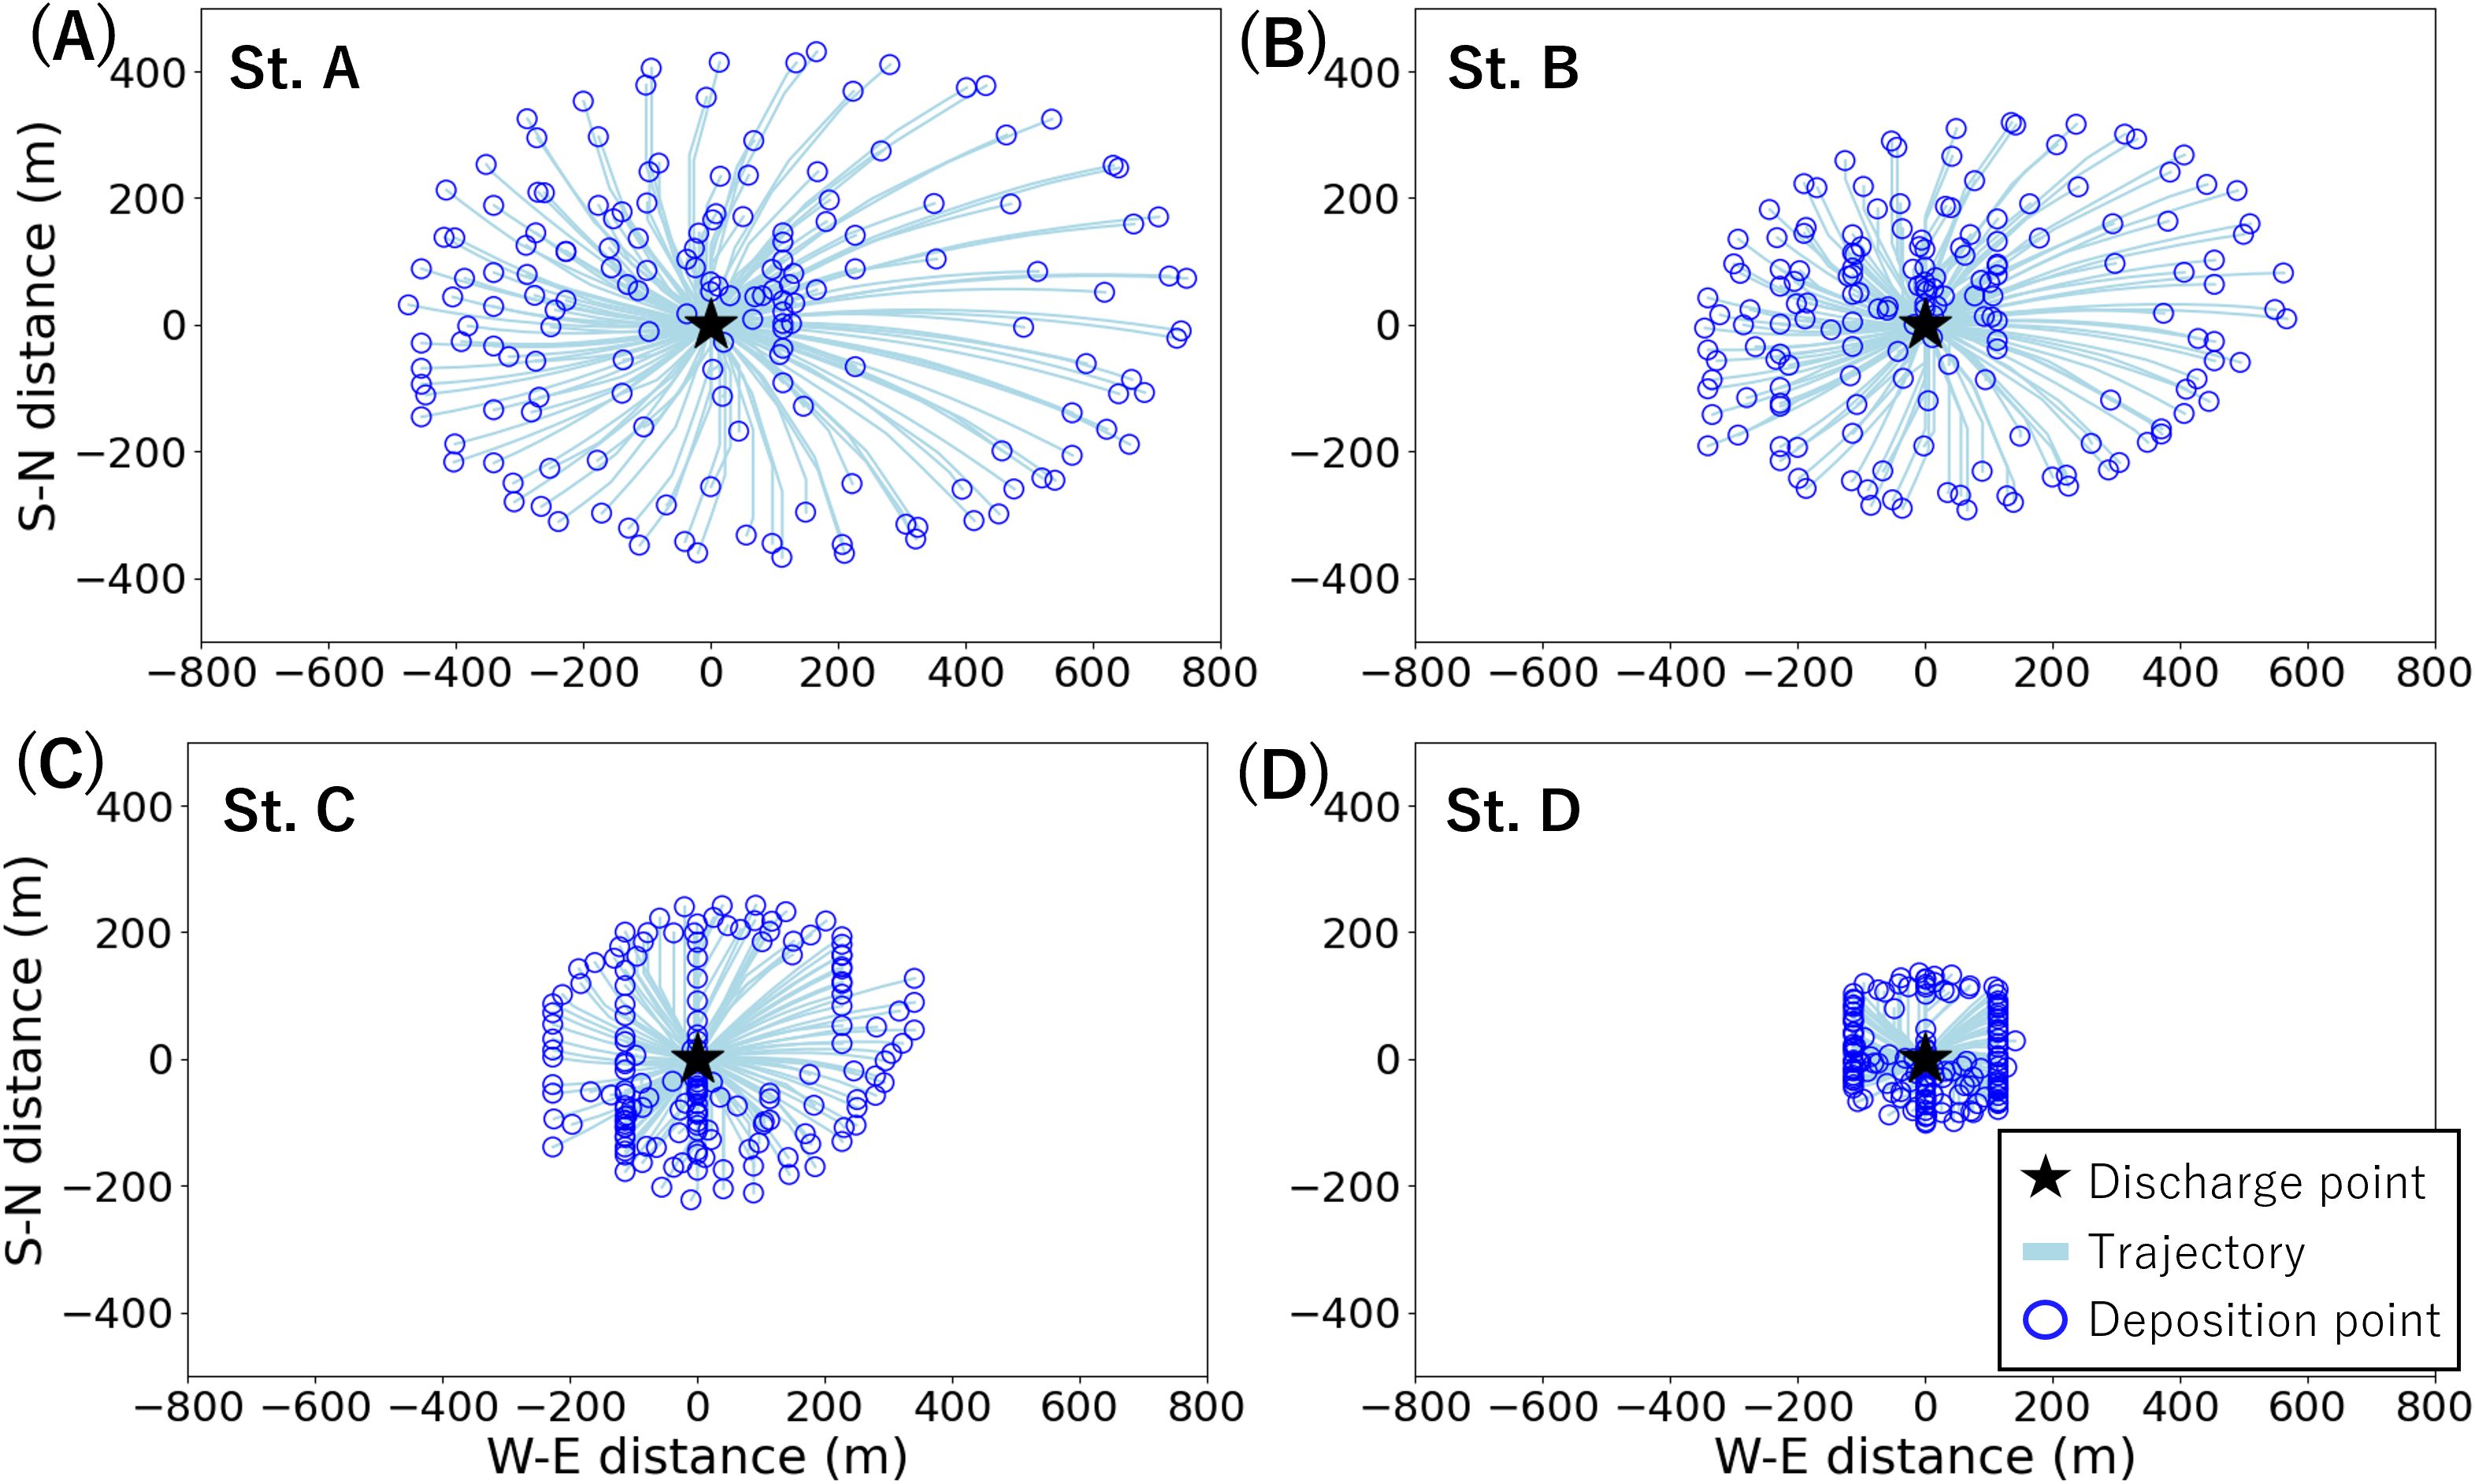
Figure 5. Examples of simulated dispersion trajectories of plume particles. Results are shown for the smallest particle size in the simulation, 30 μm. Each panel shows the results for sites (A–D) in Figure 4. Black stars indicate plume discharge points, light blue lines indicate dispersion trajectories, and blue circles indicate deposition points.
Plumes dispersed farther and resulted in thinner depositional layers at discharge points with stronger tidal currents, while being closer and thicker at discharge points with weaker tidal currents (Figure 6). At the site with the maximum tidal currents (Figure 6A), the depositional thickness was ≤0.31 mm within 50 m from the plume discharge points, ≤0.045 mm at 50–150 m, and ≤0.0087 mm beyond 150 m. In contrast, at the site with the weakest tidal currents (Figure 6D), the depositional thickness nearly doubled, with ≤0.57 mm within 50 m from the discharge points, ≤0.074 mm at 50–150 m, and no deposition occurred beyond 119 m.
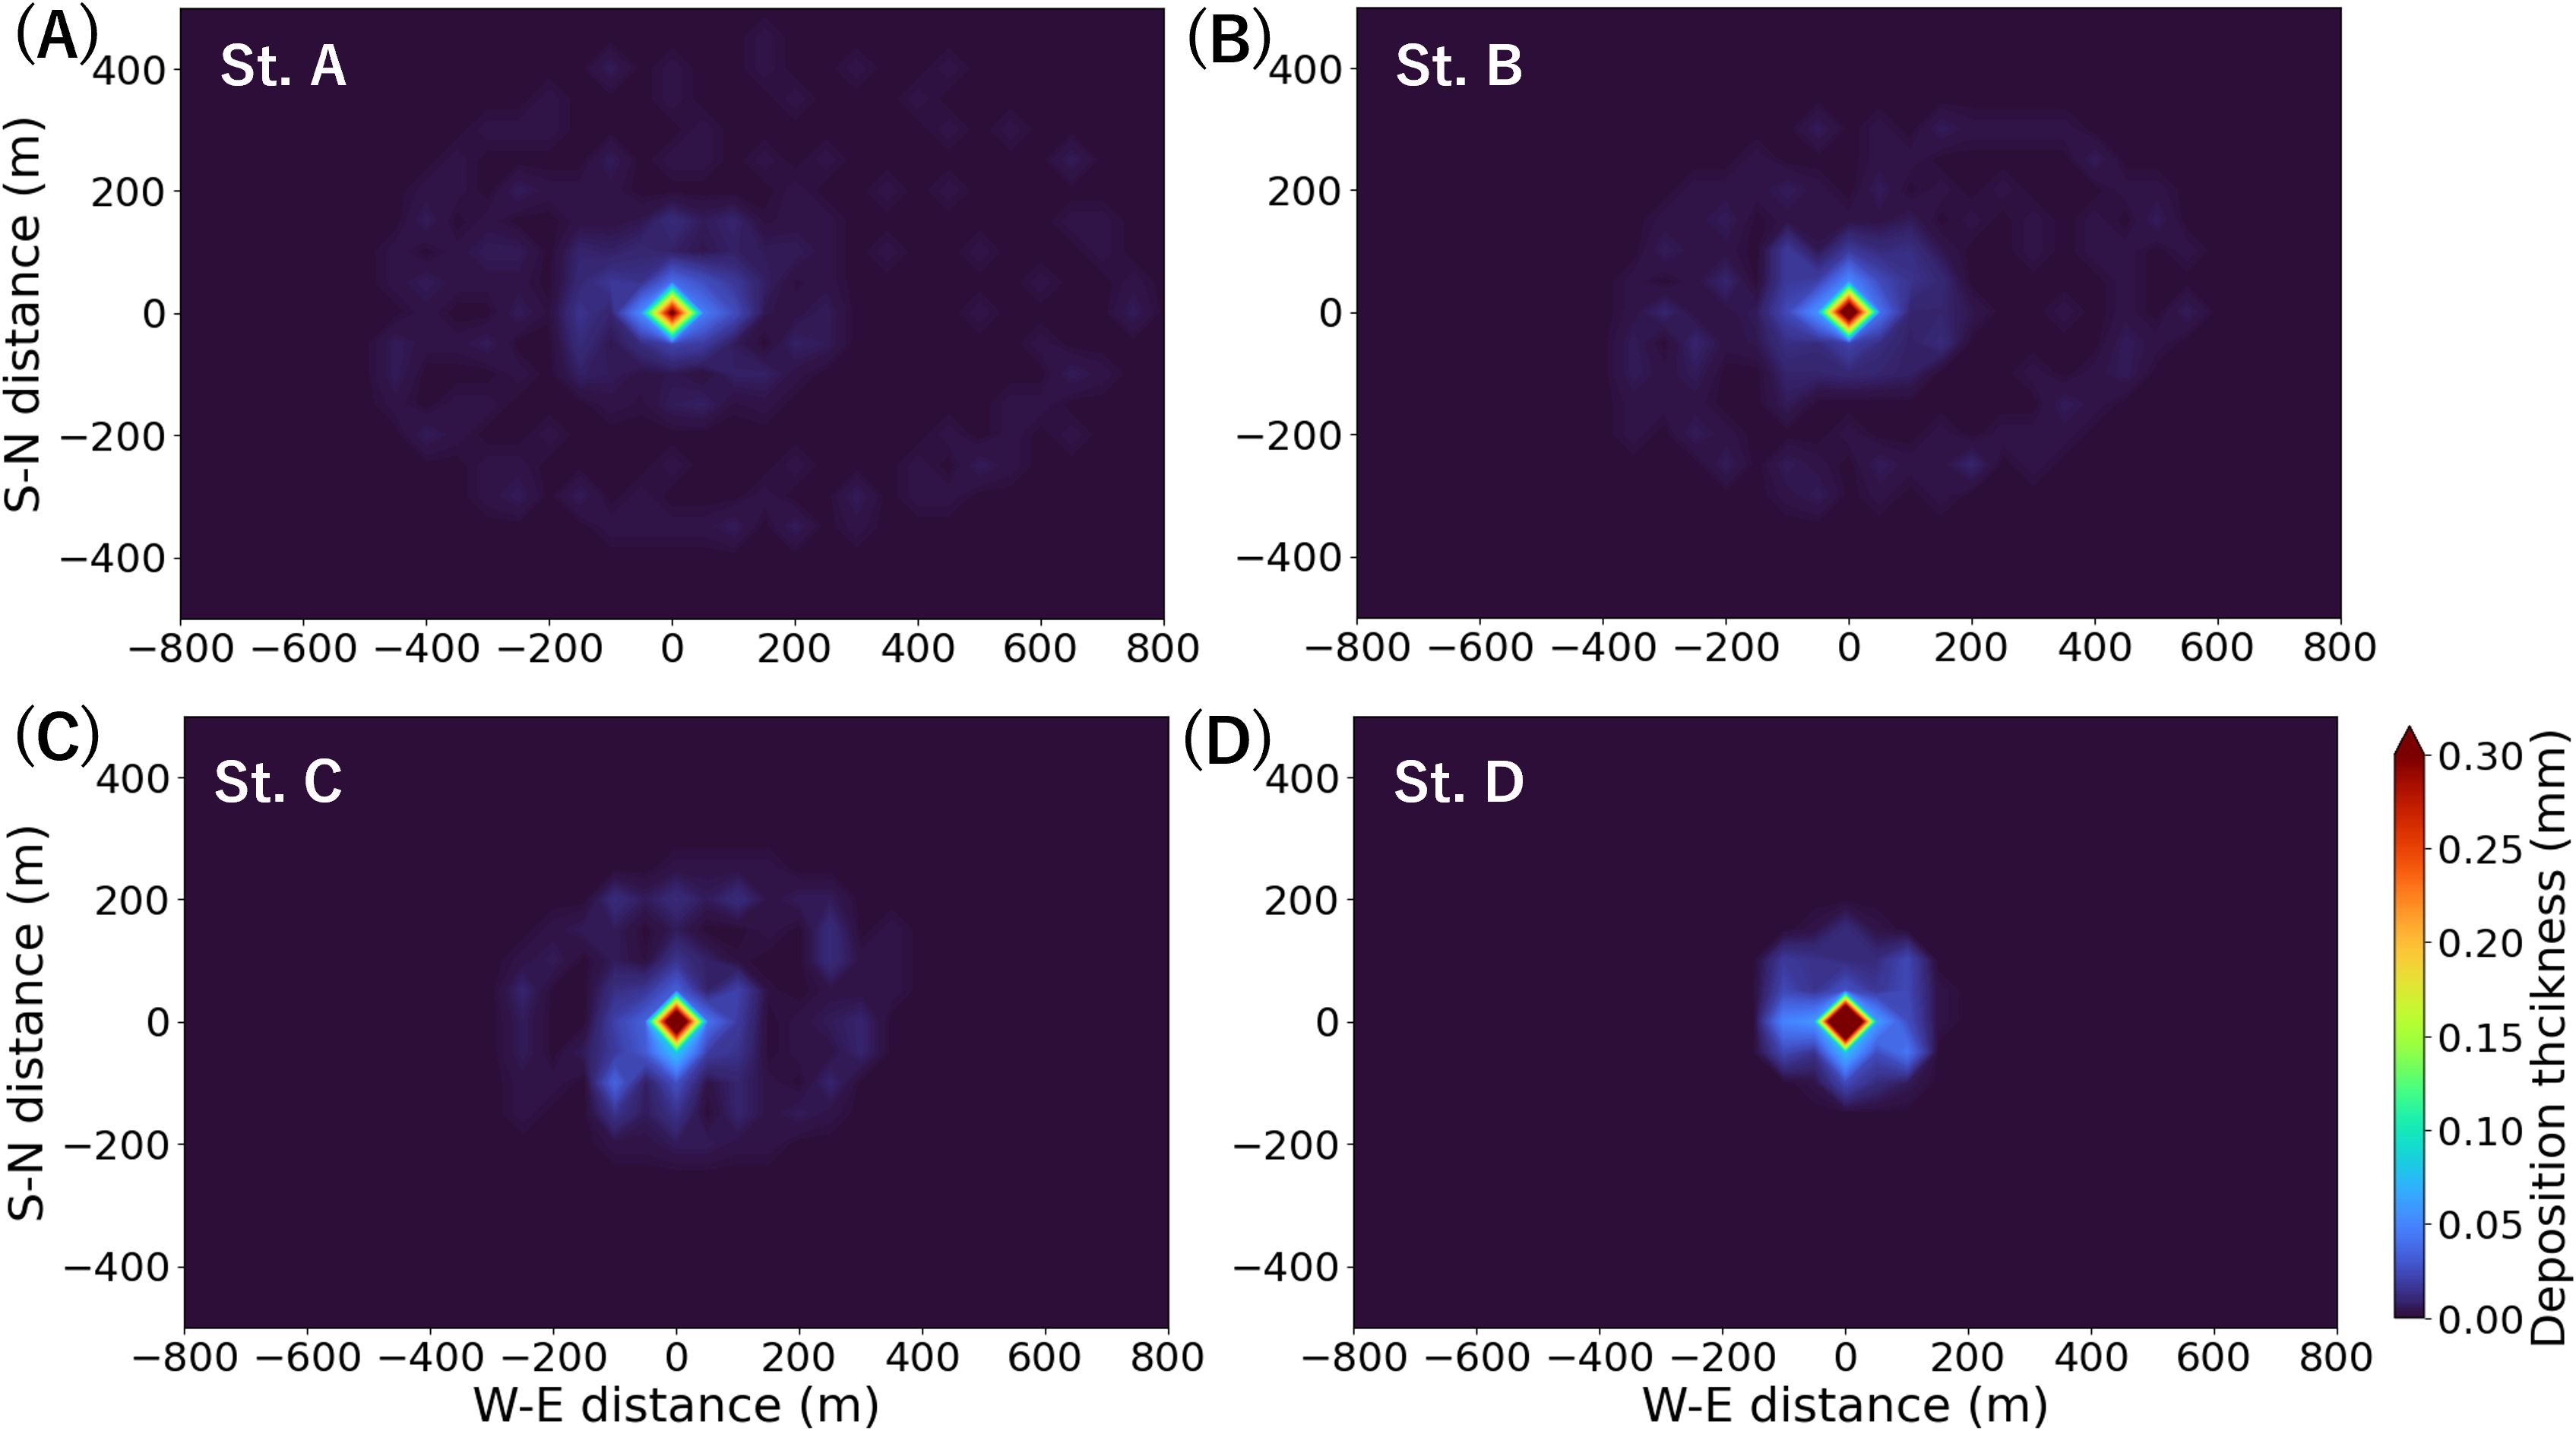
Figure 6. Examples of simulated deposition thickness of plume particles. The center of each panel is the plume discharge point. Redder colors indicate thicker deposition in that area. Each panel shows the results for sites (A–D) in Figure 4.
Relatively coarse particles (≥90 μm) were deposited within ~7 minutes (Table 1), forming thicker sediment layers (≥0.3 mm) within ~50 m of all discharge points. The finer the particles, the longer they remained in suspension, leading to greater variation in deposition distances among the discharge points (Supplementary Figure S7). For 230 μm particles, the difference between maximum and minimum deposition was 30 m, whereas for 30 μm particles, it was 676 m (Supplementary Table S3). The SD of deposition distance was only 5 m for 230 μm particles but 121 m for 30 μm particles. The average deposition distances per particle size were 15 m for the 230 μm particles, 47 m (SD = 16 m) for the 90 μm particles, 131 m (SD = 44 m) for the 50 μm particles, and 346 m for the 30 μm particles.
4 Discussions
The modeled tidal currents at the seamount summit were ≤7 times stronger than those in other areas (Figure 2), indicating the occurrence of internal tides (Baines, 2007; Lavelle and Mohn, 2010). The tidal current strengths exhibited spatial variability across the summit (Figure 2). Model validation against field observations showed a difference of less than 1.0 cm/s in tidal current amplitude (Figure 3, Supplementary Tables S1, S2). The deposition distance of simulated plumes varied by a factor of ≤6.5 among discharge points (Figure 4) and was positively correlated with tidal current strengths. At sites with stronger tidal currents, the plume was deposited farther (up to 800 m) as thinner layers, while at sites with weaker tidal currents, deposition occurred closer (as little as 120 m) and thicker (Figures 5, 6). These results suggest that the extent of plume dispersion and deposition at seamounts may vary by several times, depending on the local tidal current strength at the mining site.
Spatial variability of flows on relatively small scales, a few to tens of kilometers, has received little attention in previous studies of deep-sea mining plumes. This is partly because much of the previous research concentrated on nodule mining in the abyssal plains, considered the first deep-sea mineral resource to be exploited (Amon et al., 2022; Blanchard et al., 2023). In these environments, flow patterns are relatively homogenous over large spatial scales (hundreds of kilometers) compared to seamounts (Aleynik et al., 2017; Peacock and Ouillon, 2023). Previous studies of nodule mining plumes focused on regional or global physical oceanographic processes, such as those associated with El Niño and La Niña (Rolinski et al., 2001) and mesoscale eddies (Aleynik et al., 2017; Gillard et al., 2019). On the other hand, our findings emphasize that physical oceanographic processes with smaller spatial scales, including internal tides, can also be important for crust mining. Thus, to properly assess and predict the environmental impacts of the plumes generated by crust mining, it is likely insufficient to simply extrapolate from knowledge of nodule mining plumes.
Differences in plume dispersal and deposition between sites may warrant consideration when assessing the habitats affected by crust mining. Seamounts are heterogeneous habitats where benthic organisms are patchily distributed at scales of ~100 m (McClain et al., 2010; Shen et al., 2021). Therefore, differences in plume deposition distances of a few hundred meters, as shown in this study (Figure 4), can alter the affected communities and species composition. The environmental impact assessment of the small-scale crust excavation test (Washburn et al., 2023) reported a decline in organisms within and near the plume deposition area over scales of 10 to 100 m, underscoring the importance of survey design for proper assessment. Based on this study, the area examined for environmental impact assessments may need to be larger at mining sites with relatively strong tidal currents. Very little is currently known about the threshold for the suspended concentrations and deposition thicknesses of plume at which deep-sea organisms are damaged (Stenvers et al., 2023). However, given the naturally low levels of suspended solids concentrations and slow sedimentation rates on the deep-sea floor, even small increases in them may impact organisms (Glover and Smith, 2003; Washburn et al., 2019; Amon et al., 2022). The plumes simulated in this study were deposited on the order of 0.1 mm per week in areas >50 m from the discharge sites (Figure 6), which is tens to thousands of times faster than the natural sedimentation rate at seamount summits in the Northwest Pacific (11.4 ± 7.9 mm/kyr) (Ota et al., 2022).
The role of internal tides in material transport at seamount summits has also been highlighted in previous oceanographic and sedimentological studies. It has been suggested that the heterogeneous distribution of sediments over seamount summits reflects active nondeposition, erosion, and resuspension driven by strong tidal currents associated with internal tides (Turnewitsch et al., 2008, 2013). Although direct comparisons between plume behavior and sediment distribution are difficult, the sedimentological field data are consistent with our finding that internal tides occurring at seamounts largely determine mass transport patterns across the entire summit of the seamount. The modeled distribution of tidal current amplitude differed between the semi-diurnal M2 component and the diurnal K1 component (Figure 2). These distributions were consistent with previous modeling studies of flat-topped seamounts (Lavelle, 2006; Vlasenko et al., 2018). The flow components that can have major influences at seamounts include tidal currents and impinging steady currents (Lavelle and Mohn, 2010). Between these, impinging steady currents are not included in this model, and investigating their influence on plume behavior is a future issue. However, in this study, the annual mean velocity of 0.7 cm/s observed just above the seafloor at the seamount summit (1190 m depth), which may be attributed to impinging steady currents, was much smaller than the velocities attributed to tidal currents there (M2 amplitude was 2.1 cm/s and K1 was 1.4 cm/s). This suggested that, as with field observations at other seamounts (Genin et al., 1989; Eriksen, 1991), tidal currents may have a much larger influence on local current strength than impinging steady currents at the seamount summit targeted in this study.
Given the current uncertainty regarding the details involved with commercial mining of crusts, this study should be interpreted as a preliminary examination of the influence of physical oceanography on plume behavior at seamounts. Plume behavior is dependent on particle size, discharge speed, and discharge height, among other things, and these parameters are determined in large part by the mining machine design and mining operations (Weaver et al., 2022; Peacock and Ouillon, 2023). Currently, there are no publicly available crust mining plans, so their simulation must involve a certain degree of uncertainty. The simulation in this study used field measurements from small-scale excavation test (Saito et al., 2023; Washburn et al., 2023) as the best available data, but plume release rates and resulting sediment deposition in commercial mining may differ substantially. For more realistic simulations, more field data on crust mining are needed, for example, data on the numerous in situ tests in the abyssal plains simulating nodule mining (e.g., Jones et al., 2017; Muñoz-Royo et al., 2022; Gazis et al., 2025). Accumulating such field data would also facilitate the simulation of plume dynamics on finer scales, accounting for turbulence in the immediate vicinity of excavators (Muñoz-Royo et al., 2022; Peacock and Ouillon, 2023). However, despite the above limitations, the basic trends in plume deposition in this study are consistent with previous studies. In this study, the majority of the volume of plume particles was deposited in the vicinity (≤50 m) of the mining site. Similar trends were observed during the small-scale crust excavation test (Washburn et al., 2023), as well as in the only previous numerical simulation on crust mining (Spearman et al., 2020), and multiple nodule mining simulations (Rolinski et al., 2001; Gillard et al., 2019; Purkiani et al., 2021).
Investigating the influence of strong tidal currents driven by internal tides may be crucial for developing best practices in deep-sea mining that mitigate environmental impacts at seamounts. Efforts to reduce the environmental impacts of deep-sea mining have been addressed primarily through excavator design (Weaver et al., 2022; Peacock and Ouillon, 2023) and designation of environmental conservation areas (Wedding et al., 2013, 2015; Dunn et al., 2018). However, the variation in plume dispersal and deposition areas shown in this study suggests that careful consideration of environmental conditions may help in choosing mining sites that minimize the spatial extent of environmental impacts. Mining in areas with weak tidal currents could limit plume dispersal and deposition to a relatively smaller area compared to mining in locations with strong tidal currents. In contrast, if a primary goal is to ensure a limited thickness of deposited sediments, then areas with especially weak tidal currents may need to be avoided. The results of our study also support spatial planning of mining operations to avoid ecologically sensitive zones, especially under the framework of ISA’s REMP development. This study underscores the importance of understanding oceanographic variability within seamount summits to effectively assess and mitigate the environmental impacts of deep-sea mining.
Data availability statement
The raw data supporting the conclusions of this article will be made available by the authors, without undue reservation.
Author contributions
NS: Conceptualization, Formal Analysis, Methodology, Writing – original draft. TW: Writing – review & editing. MN: Data curation, Writing – review & editing. HK: Project administration, Writing – review & editing. AS: Data curation, Project administration, Writing – review & editing.
Funding
The author(s) declare that financial support was received for the research and/or publication of this article. This project was commissioned by Japan's Ministry of Economy, Trade and Industry. This study was also supported by Integrated Research Center for Nature Positive Technology at AIST.
Acknowledgments
We would like to thank Professor Shinichiro Yano (Kyushu University) for guidance.
Conflict of interest
The authors declare that the research was conducted in the absence of any commercial or financial relationships that could be construed as a potential conflict of interest.
Generative AI statement
The author(s) declare that no Generative AI was used in the creation of this manuscript.
Any alternative text (alt text) provided alongside figures in this article has been generated by Frontiers with the support of artificial intelligence and reasonable efforts have been made to ensure accuracy, including review by the authors wherever possible. If you identify any issues, please contact us.
Publisher’s note
All claims expressed in this article are solely those of the authors and do not necessarily represent those of their affiliated organizations, or those of the publisher, the editors and the reviewers. Any product that may be evaluated in this article, or claim that may be made by its manufacturer, is not guaranteed or endorsed by the publisher.
Supplementary material
The Supplementary Material for this article can be found online at: https://www.frontiersin.org/articles/10.3389/fmars.2025.1603902/full#supplementary-material
References
Aleynik D., Inall M. E., Dale A., and Vink A. (2017). Impact of remotely generated eddies on plume dispersion at abyssal mining sites in the Pacific. Sci. Rep. 7, 16959. doi: 10.1038/s41598-017-16912-2
Amon D. J., Gollner S., Morato T., Smith C. R., Chen C., Christiansen S., et al. (2022). Assessment of scientific gaps related to the effective environmental management of deep-seabed mining. Mar. Policy 138, 105006. doi: 10.1016/j.marpol.2022.105006
Baines P. G. (2007). Internal tide generation by seamounts. Deep-Sea Res. I: Oceanogr. Res. Pap. 54, 1486–1508. doi: 10.1016/j.dsr.2007.05.009
Blanchard C., Harrould-Kolieb E., Jones E., and Taylor M. L. (2023). The current status of deep-sea mining governance at the International Seabed Authority. Mar. Policy 147, 105396. doi: 10.1016/j.marpol.2022.105396
Codiga D. L. (2011). Unified Tidal Analysis and Prediction Using the UTide Matlab Functions (Narragansett, RI, United States: University of Rhode Island). Technical Report 2011-01.
Delandmeter P. and van Sebille E. (2019). The Parcels v2.0 Lagrangian framework: new field interpolation schemes. Geosci. Model. Dev. 12, 3571–3584. doi: 10.5194/gmd-12-3571-2019
Deltares (2022). Delft3D-FLOW users’ manual; simulation of multi-dimensional hydrodynamic flows and transport phenomena, including sediments. version: 4.05.
Drazen J. C., Smith C. R., Gjerde K. M., Haddock S. H. D., Carter G. S., Choy C. A., et al. (2020). Midwater ecosystems must be considered when evaluating environmental risks of deep-sea mining. Proc. Natl. Acad. Sci. 117, 17455–17460. doi: 10.1073/pnas.2011914117
Dunn D. C., Van Dover C. L., Etter R. J., Smith C. R., Levin L. A., Morato T., et al. (2018). A strategy for the conservation of biodiversity on mid-ocean ridges from deep-sea mining. Sci. Adv. 4, eaar4313. doi: 10.1126/sciadv.aar4313
Egbert G. D. and Erofeeva S. YT. (2002). Efficient inverse modeling of barotropic ocean tides. J. Atmos. Ocean. Technol. 19, 183–204. doi: https://doi.org/10.1175/1520-0426(2002)019<0183:EIMOBO>2.0.CO;2
Eriksen C. C. (1991). Observations of amplified flows atop a large seamount. J. Geophys. Res. Oceans 96, 15227–15236. doi: 10.1029/91jc01176
Garrett C. (2003). Internal tides and ocean mixing. Science 301, 1858–1859. doi: 10.1126/science.1090002
Gazis I., De Stigter H., Mohrmann J., Heger K., Diaz M., Gillard B., et al. (2025). Monitoring benthic plumes, sediment redeposition and seafloor imprints caused by deep-sea polymetallic nodule mining. Nat. Commun. 16, 1229. doi: 10.1038/s41467-025-56311-0
Genin A., Noble M., and Lonsdale P. F. (1989). Tidal currents and anticyclonic motions on two North Pacific seamounts. Deep-Sea Res. a. Oceanogr. Res. Pap. 36, 1803–1815 doi: 10.1016/0198-0149(89)90113-1
Gillard B., Purkiani K., Chatzievangelou D., Vink A., Iversen M. H., and Thomsen L. (2019). Physical and hydrodynamic properties of deep sea mining-generated, abyssal sediment plumes in the Clarion Clipperton Fracture Zone (eastern-central Pacific). Elem. Sci. Anth. 7. doi: 10.1525/elementa.343
Glover A. G. and Smith C. R. (2003). The deep-sea floor ecosystem: current status and prospects of anthropogenic change by the year 2025. Environ. Conserv. 30, 219–241. doi: 10.1017/s0376892903000225
Hein J. R., Conrad T. A., and Dunham R. E. (2009). Seamount Characteristics and Mine-Site model applied to Exploration- and Mining-Lease-Block selection for Cobalt-Rich Ferromanganese crusts. Mar. Georesources Geotechnol. 27, 160–176. doi: 10.1080/10641190902852485
Hein J. R., Mizell K., Koschinsky A., and Conrad T. A. (2013). Deep-ocean mineral deposits as a source of critical metals for high- and green-technology applications: Comparison with land-based resources. Ore Geol. Rev. 51, 1–14. doi: 10.1016/j.oregeorev.2012.12.001
International Seabed Authority (2024). Report on the relinquishment of two thirds of the area allocated to the Japan Oil, Gas and Metals National Corporation under the contract for exploration for cobalt-rich ferromanganese crusts signed with the International Seabed Authority. ISBA/29/C/18.
Jones D. O. B., Kaiser S., Sweetman A. K., Smith C. R., Menot L., Vink A., et al. (2017). Biological responses to disturbance from simulated deep-sea polymetallic nodule mining. PloS One 12, e0171750. doi: 10.1371/journal.pone.0171750
Kalnay E., Kanamitsu M., Kistler R., Collins W., Deaven D., Gandin L., et al. (1996). The NCEP/NCAR 40-year reanalysis project. Bull. Am. Meteor. Soc 77, 437–471. doi: 10.1175/1520-0477(1996)077
Lavelle J. W. (2006). Flow, hydrography, turbulent mixing, and dissipation at Fieberling Guyot examined with a primitive equation model. J. Geophys. Res. Oceans 111. doi: 10.1029/2005jc003224
Lavelle J. W. and Mohn C. (2010). Motion, commotion, and biophysical connections at Deep Ocean Seamounts. Oceanography 23, 90–103. doi: 10.5670/oceanog.2010.64
McClain C. R., Lundsten L., Barry J., and DeVogelaere A. (2010). Assemblage structure, but not diversity or density, change with depth on a northeast Pacific seamount. Mar. Ecol. 31, 14–25. doi: 10.1111/j.1439-0485.2010.00367.x
Muñoz-Royo C., Ouillon R., Mousadik S. E., Alford M. H., and Peacock T. (2022). An in situ study of abyssal turbidity-current sediment plumes generated by a deep seabed polymetallic nodule mining preprototype collector vehicle. Sci. Adv. 8, eabn1219. doi: 10.1126/sciadv.abn1219
Ota Y., Suzumura M., Tsukasaki A., Suzuki A., Seike K., and Minatoya J. (2022). Sediment accumulation rates and particle mixing at northwestern Pacific seamounts. J. Mar. Syst. 229, 103719. doi: 10.1016/j.jmarsys.2022.103719
Peacock T. and Ouillon R. (2023). The fluid mechanics of deep-sea mining. Annu. Rev. Fluid Mech. 55, 403–430. doi: 10.1146/annurev-fluid-031822-010257
Purkiani K., Gillard B., Paul A., Haeckel M., Haalboom S., Greinert J., et al. (2021). Numerical simulation of Deep-Sea sediment transport induced by a dredge experiment in the northeastern Pacific Ocean. Front. Mar. Sci. 8. doi: 10.3389/fmars.2021.719463
Rolinski S., Segschneider J., and Sündermann J. (2001). Long-term propagation of tailings from deep-sea mining under variable conditions by means of numerical simulations. Deep-Sea Res. II: Top. Stud. Oceanogr. 48, 3469–3485. doi: 10.1016/s0967-0645(01)00053-4
Saito N., Nagao M., Suzuki A., and Kamoshida H. (2024). “Observation and modeling of flow in a deep-sea seamount for environmental assessment of cobalt-rich crusts mining,” in Proceedings of the 34th (2024) International Ocean and Polar Engineering Conference, Rhodes, Greece (International Society of Offshore and Polar Engineers (ISOPE)). 402–405.
Saito N., Washburn T. W., Yano S., and Suzuki A. (2023). Using deep learning to assess temporal changes of suspended particles in the deep sea. Front. Mar. Sci. 10. doi: 10.3389/fmars.2023.1132500
Shen C., Lu B., Li Z., Zhang R., Chen W., Xu P., et al. (2021). Community structure of benthic megafauna on a seamount with cobalt-rich ferromanganese crusts in the northwestern Pacific Ocean. Deep-Sea Res. I: Oceanogr. Res. Pap 178, 103661. doi: 10.1016/j.dsr.2021.103661
Smith C. R., Tunnicliffe V., Colaço A., Drazen J. C., Gollner S., Levin L. A., et al. (2020). Deep-Sea misconceptions cause underestimation of Seabed-Mining impacts. Trends Ecol. Evol. 35, 853–857. doi: 10.1016/j.tree.2020.07.002
Spearman J., Taylor J., Crossouard N., Cooper A., Turnbull M., Manning A., et al. (2020). Measurement and modelling of deep sea sediment plumes and implications for deep sea mining. Sci. Rep. 10, 5075. doi: 10.1038/s41598-020-61837-y
Stenvers V. I., Hauss H., Bayer T., Havermans C., Hentschel U., Schmittmann L., et al. (2023). Experimental mining plumes and ocean warming trigger stress in a deep pelagic jellyfish. Nat. Commun. 14, 7352. doi: 10.1038/s41467-023-43023-6
Turnewitsch R., Falahat S., Nycander J., Dale A., Scott R. B., and Furnival D. (2013). Deep-sea fluid and sediment dynamics—Influence of hill- to seamount-scale seafloor topography. Earth Sci. Rev. 127, 203–241. doi: 10.1016/j.earscirev.2013.10.005
Turnewitsch R., Reyss J., Nycander J., Waniek J. J., and Lampitt R. S. (2008). Internal tides and sediment dynamics in the deep sea—Evidence from radioactive 234Th/238U disequilibria. Deep-Sea Res. I: Oceanogr. Res. Pap. 55, 1727–1747. doi: 10.1016/j.dsr.2008.07.008
Vlasenko V., Stashchuk N., and Nimmo-Smith W. A. M. (2018). Three-Dimensional dynamics of baroclinic tides over a seamount. J. Geophys. Res. Oceans 123, 1263–1285. doi: 10.1002/2017jc013287
Washburn T. W., Simon-Lledó E., Soong G. Y., and Suzuki A. (2023). Seamount mining test provides evidence of ecological impacts beyond deposition. Curr. Biol. 33, 3065–3071.e3. doi: 10.1016/j.cub.2023.06.032
Washburn T. W., Turner P. J., Durden J. M., Jones D. O., Weaver P., and Van Dover C. L. (2019). Ecological risk assessment for deep-sea mining. Ocean Coast. Manage. 176, 24–39. doi: 10.1016/j.ocecoaman.2019.04.014
Weaver P., Aguzzi J., Boschen-Rose R., Colaço A., De Stigter H., Gollner S., et al. (2022). Assessing plume impacts caused by polymetallic nodule mining vehicles. Mar. Policy 139, 105011. doi: 10.1016/j.marpol.2022.105011
Wedding L. M., Friedlander A. M., Kittinger J. N., Watling L., Gaines S. D., Bennett M., et al. (2013). From principles to practice: a spatial approach to systematic conservation planning in the deep sea. Proc. R. Soc B: Biol. Sci. 280, 20131684. doi: 10.1098/rspb.2013.1684
Keywords: cobalt-rich crust, deep-sea mining, environmental impact assessment, northwest pacific, REMP, sediment plume
Citation: Saito N, Washburn TW, Nagao M, Kamoshida H and Suzuki A (2025) Internal tides drive spatial variation in impact areas of deep-sea mining plumes at seamounts. Front. Mar. Sci. 12:1603902. doi: 10.3389/fmars.2025.1603902
Received: 01 April 2025; Accepted: 31 July 2025;
Published: 20 August 2025.
Edited by:
Elva G. Escobar-Briones, National Autonomous University of Mexico, MexicoReviewed by:
Bo-Shian Wang, National Academy of Marine Research (NAMR), TaiwanDongfeng Xu, Ministry of Natural Resources, China
Copyright © 2025 Saito, Washburn, Nagao, Kamoshida and Suzuki. This is an open-access article distributed under the terms of the Creative Commons Attribution License (CC BY). The use, distribution or reproduction in other forums is permitted, provided the original author(s) and the copyright owner(s) are credited and that the original publication in this journal is cited, in accordance with accepted academic practice. No use, distribution or reproduction is permitted which does not comply with these terms.
*Correspondence: Naoki Saito, bi5zYWl0b0BhaXN0LmdvLmpw