 Mélanie Juza
 Emma Heslop
 Nikolaos D. Zarokanellos
 Joaquín Tintoré
- 1Balearic Islands Coastal Observing and Forecasting System (SOCIB), Palma, Spain
- 2Intergovernmental Oceanographic Commission, UNESCO, Paris, France
- 3Mediterranean Institute for Advanced Studies (IMEDEA) (CSIC-UIB), Esporles, Spain
The increasing capability of multi-platform observing systems has enabled the better understanding of the wide-ranged spatio-temporal ocean variability and its implications for ocean biogeochemistry and marine life. The Ibiza Channel, located in the western Mediterranean Sea, is a well-established hotspot of ocean warming and biodiversity, and where high (sub-)mesoscale variability with impacts on marine ecosystems takes place. In this context, the Balearic Islands Coastal Observing and Forecasting System (SOCIB) has been operating glider missions in the Balearic Channels through a quasi-continuous endurance line called “Canales” since 2011. In this study, the importance of high-resolution monitoring along a sustained observation line at a key choke point has been demonstrated. A glider-adapted methodology has been implemented to compute geostrophic velocities from hydrographic profiles in the Ibiza Channel. Northward and southward transports of the total and water mass flows are then derived across each transect. Their seasonal variability is well captured across the Ibiza Channel with major southward flow in winter-spring and northward flow in late-summer. During the period 2011-2024, high temporal variability is also observed and explained through the analyses of regional circulation and water mass dynamics such as the inflow of recent Atlantic Water or the southward propagation of recently formed Western Intermediate Water and Western Mediterranean Deep Water. Also, 14-year glider data have well captured the regional interannual variability and long-term trends in response to climate change. Warming and salinification have been observed for all water masses from surface to deep layers except for the Atlantic Water of recent origin showing a decreasing salinity trend. Sustainable and high-resolution monitoring of the ocean is crucial to better understand the processes involved in the ocean variability at different spatio-temporal scales, as well as the impact of climate change and human activities particularly in coastal areas and thus to respond to worldwide societal challenges.
1 Introduction
The Balearic Channels are a well-known biodiversity hotspot (Coll et al., 2010) and an adversely climate-change impacted area (Pisano et al., 2020; Garrabou et al., 2022; Juza et al., 2022, 2024). This is also a choke point of the western Mediterranean Sea with complex topography, shelf-slope exchanges and important meridional water mass exchanges (Heslop et al., 2012; Juza et al., 2013, 2019; Barceló-Llull et al., 2019; Vargas-Yáñez et al., 2020, 2021). From the northern sub-basin, the Northern Current (NC) flows southwards along the Spanish coast. Approaching the north of the Ibiza Channel (IC), this current can bifurcate into two branches, one following southward through the IC and the other flowing eastward to form the Balearic Current along the Balearic Islands northern shelf (Pinot et al., 1995). From the southern sub-basin, the fresh Atlantic Water (AW) entering at Gibraltar Strait, circulating in the Alboran Sea and reaching the Algerian sub-basin can also reach the Balearic Channels through diverse circulation patterns including mesoscale structures and join the Balearic Current. The Balearic Front, which is based on AW-related salinity gradients (Barral et al., 2021), plays an important role in the regional biological activity. In addition, the observed short-term variability of the meridional circulation with a time scale of a week and spatial of a few kilometres is closely linked to changes in the vertical distribution of water masses within the water column (Heslop et al., 2012; Heslop, 2015) with very relevant implications on marine ecosystems such as Bluefin tuna spawning (Alemany et al., 2010; Álvarez-Berastegui et al., 2016).
The increasing capability of the multi-platform observing systems through sustainable observational programs (e.g. oceanographic campaigns, remote sensing, fixed moorings and profiling floats) and the deployment of new platforms in the last couple decades (e.g. gliders) has enabled to better understand the spatio-temporal ocean variability in the Mediterranean Sea (Tintoré et al., 2019a) and especially around the Balearic Islands. Through continuous monitoring for several decades, satellite observations have strongly increased the description and understanding of the ocean variability and changes at the surface (Mason and Pascual, 2013; Juza and Tintoré, 2021; Juza et al., 2022). Extending to the water column, the Argo floats network has strongly increased the ocean observational capability by observing ocean variability and changes from surface to subsurface at sub-regional scale (Juza and Tintoré, 2021; Juza et al., 2022; Chevillard et al., 2024). However, its spatio-temporal sampling does not allow the comprehensive observations of the Balearic Channels when only a few floats crossed the IC. Besides, the three-monthly periodicity hydrographic sections collected during the oceanographic campaigns in the Ibiza and Mallorca Channels since 1996 in the frame of the CANALES, CIRBAL and RADMED projects (López-Jurado et al., 2015; Tel et al., 2016) have allowed to resolve the seasonal cycle of water mass properties, to establish climatological distributions of hydrographic properties and their long-term changes (Vargas-Yáñez et al., 2020, 2021, 2025). Approaching the coast, fixed moorings enable observation of the coastal ocean which responds differently than the open ocean to climate change and extreme events (Juza et al., 2022, 2024).
The high-resolution and long-term monitoring of water mass properties and transports from open ocean to shelf-slope areas is of worldwide interest to better understand drivers and mechanisms involved in ocean variability, marine life and climate change (Ayoub et al., 2024; Rudnick et al., 2017). Indeed, it allows us to address key science processes at various spatial and temporal scales including water mass exchanges at choke points, coastal shelf-open sea water mass formation and variability, ocean circulation and variability, (sub-)mesoscale structures, deep convection processes, changes in marine ecosystem activity, and ocean response to climate change (Heslop et al., 2012; Heslop, 2015; Bosse et al., 2015, 2021; Testor et al., 2018; Cotroneo et al., 2019; Aulicino et al., 2021). Also, monitoring small scale dynamic features enables us to better estimate and understand the ocean variability and long-term variations (Houpert et al., 2016; Chevillard et al., 2024). Such a multi-scale monitoring is being made possible through sustainable glider observing systems at national and regional scales (for instance, Schaeffer et al., 2016, along the South-eastern Australia; Rudnick et al., 2017, in the California Current System; Tintoré et al., 2019a; Coppola et al., 2019, in the western Mediterranean Sea; Testor et al., 2019). Ocean gliders can sample scales of kilometres and hours and have been used for intense oceanographic campaigns as well as seasonal to yearly endurance allowing resolving ocean processes from extreme events to long-term variability (Todd et al., 2011; Zaba and Rudnick, 2016; Rudnick et al., 2017; Zarokanellos et al., 2022). In this context, the Balearic Islands Coastal Observing and Forecasting System (SOCIB), which is a regional marine research infrastructure, contributes to monitor the ocean using a multi-platform integrated observing and forecasting network focused on the western Mediterranean, and provides free, open data and resources (Tintoré et al., 2013, 2019a). In particular, since 2011, more than 70 glider missions have been successfully performed by SOCIB in the Balearic Channels - the Mallorca and Ibiza Channels (MC and IC, respectively; Figure 1) - through the long-term monitoring program called “Canales”, with the aim to observe this biodiversity hotspot from surface to bottom, from continental shelf to the deep waters (down to 950 m in the middle of the IC). Most north-south water mass exchanges of the western Mediterranean occur in the IC (Astraldi et al., 1999; Millot, 1999; Pinot et al., 2002; Juza et al., 2013, 2020, 2021; Vargas-Yáñez et al., 2020, 2025) making this channel as the main dynamical connection between the northern and southern sub-basins (Juza et al., 2013; Margirier et al., 2020). The IC is also part of the Cetacean Migration Corridor Specially Protected Area of Mediterranean Importance (Cardona et al., 2025). In this way, while 0, 1 or 2 transects are normally performed in the MC during each Canales mission (Barceló-Llull et al., 2019), the IC is a much more targeted channel with at least 1 and up to 16 transects carried out during each glider mission. In the IC, 76.235 CTD profiles over the period 2011–2024 constitute a comprehensive dataset which provides unprecedented high-resolution observations of the ocean variability from surface to subsurface allowing us to better understand the dynamic processes involved from daily-weekly to interannual scales.
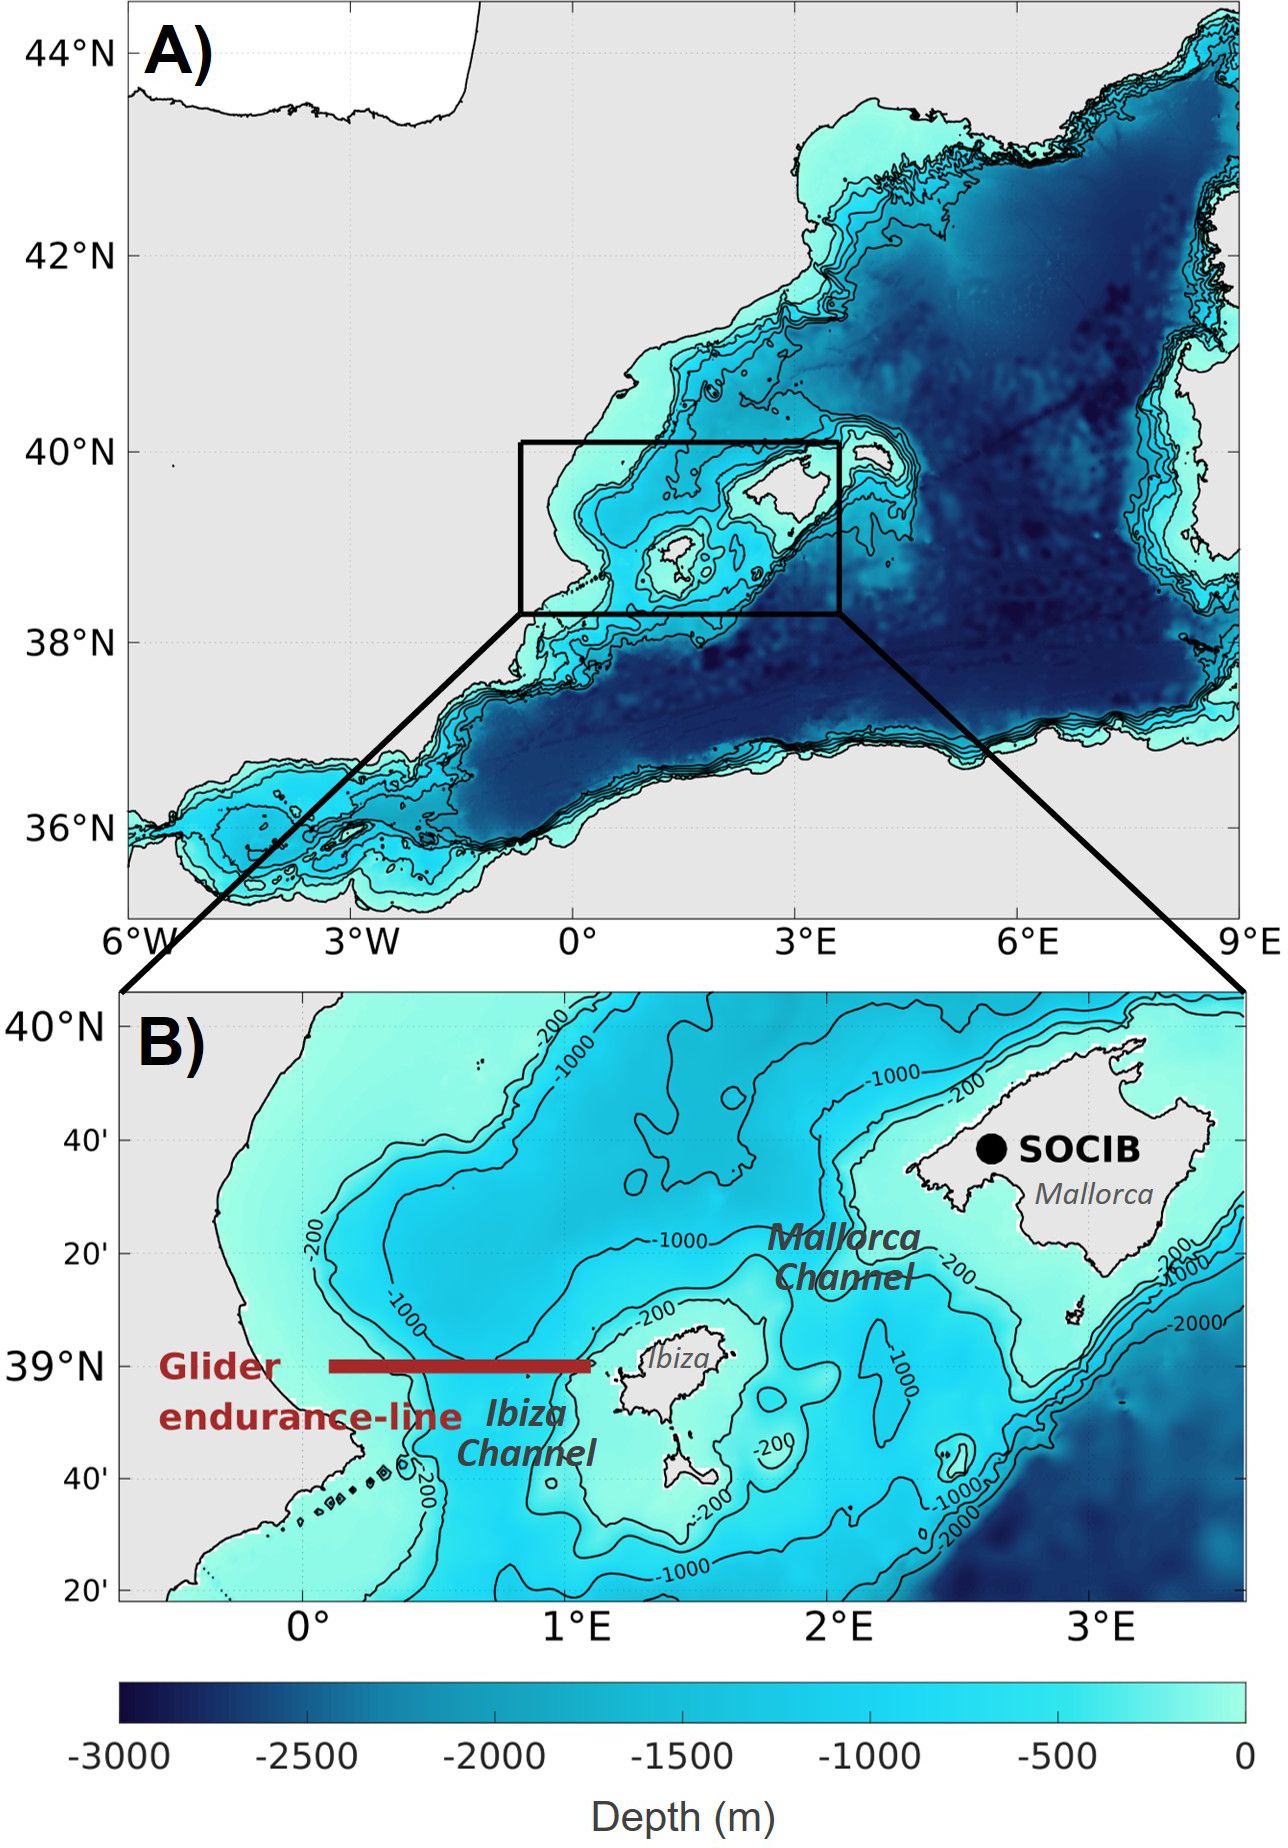
Figure 1. Bathymetry in the western Mediterranean Sea generated using data from Smith and Sandwell (1997) (A). Zoom in the Balearic Channels with SOCIB location and glider endurance line in the IC (B).
In this study, 14-year high-resolution data collected by gliders in the IC have been processed and analysed from 2011 to 2024. A glider-adapted methodology has been implemented to describe, analyse and understand the ocean circulation and variability from large-scale to mesoscale, and estimate water mass transports. This paper is organised as follows: Section 2 describes the glider observations and data processing. Section 3 presents the methodology implemented to compute and analyse water mass geostrophic transports from glider data. Results about the regional circulation and variability as well as the related water mass dynamics are provided in Sections 4 and 5, respectively, while remarkable events and trends are addressed in Section 6. Finally, discussion and conclusions are given in Section 7.
2 Glider data
2.1 Endurance line in the Ibiza Channel
In the Balearic Channels, gliders operated by SOCIB have been deployed in the IC following a semi-continuous endurance line since January 2011 (Heslop et al., 2012; Tintoré et al., 2013; Juza et al., 2019; Figure 1; Supplementary Material A). The targeted transect line corresponds to the section at 39°N with a length of approximately 90 km between the Ibiza Island and the Spanish peninsular coast. Every mission corresponds to the deployment of one glider which monitors several transects in the IC, one crossing lasting approximately 3–4 days. The duration of each glider mission varies over the years due to technical and operational limitations as illustrated in Figure 2. During the period 2011-2024, 70 missions were carried out (between 3 and 7 per year) providing 447 complete transects in the IC (varying between 16 and 59 transects per year) corresponding to 1988 days (varying between 71 and 252 days per year collecting 1818 to 11084 profiles per year) (Figure 2). The majority of the missions were undertaken using Teledyne Webb Research Inc.’s Deep Slocum gliders (G1, G2 and G3; Supplementary Material A). Deep Slocum gliders provide high-resolution in situ hydrographic data between depths of 10 and 950 m with a horizontal resolution of approximately 2 km when profiling to full depth. Temperature, pressure and conductivity are measured to 950 m depth for all missions while fluorescence, chlorophyll, oxygen and turbidity are collected to 200 m depth for some missions. This study uses the delayed-time L1 product of temperature and salinity (Heslop et al., 2012; Troupin et al., 2015; Tintoré et al., 2019b), which is generated by the SOCIB glider toolbox1 from raw glider data and distributed in the SOCIB catalogue2 in a format ready for scientific use. The L1 level refers to measurements along the glider trajectory, with interpolated position coordinates to match the times of measurement, and with unit conversions and filters applied. Derived variables (e.g. salinity and potential temperature) and corrected variables (e.g. salinity corrected for thermal lag) can also be produced (Troupin et al., 2015). The early gliders (Slocum Deep G1, Seaglider) were fitted with unpumped CTD sensors while the following ones (Slocum Deep G2 and G3) carry pumped CTDs (Supplementary Material A). Considering the instrument accuracy and stability in conductivity and temperature, as well as the calibration frequency, which is every two years at the latest for the SOCIB glider CTD units, the temperature and salinity accuracies are estimated around ±0.004°C and ±0.01, respectively (Heslop, 2015; Wong et al., 2020). This instrument calibration error has no impact on the transport estimations presented in this study. Such a semi-continuous time series of glider observations across the IC allows monitoring the variability of the ocean properties and circulation from daily-weekly to interannual time scales at this choke point of the western Mediterranean Sea.
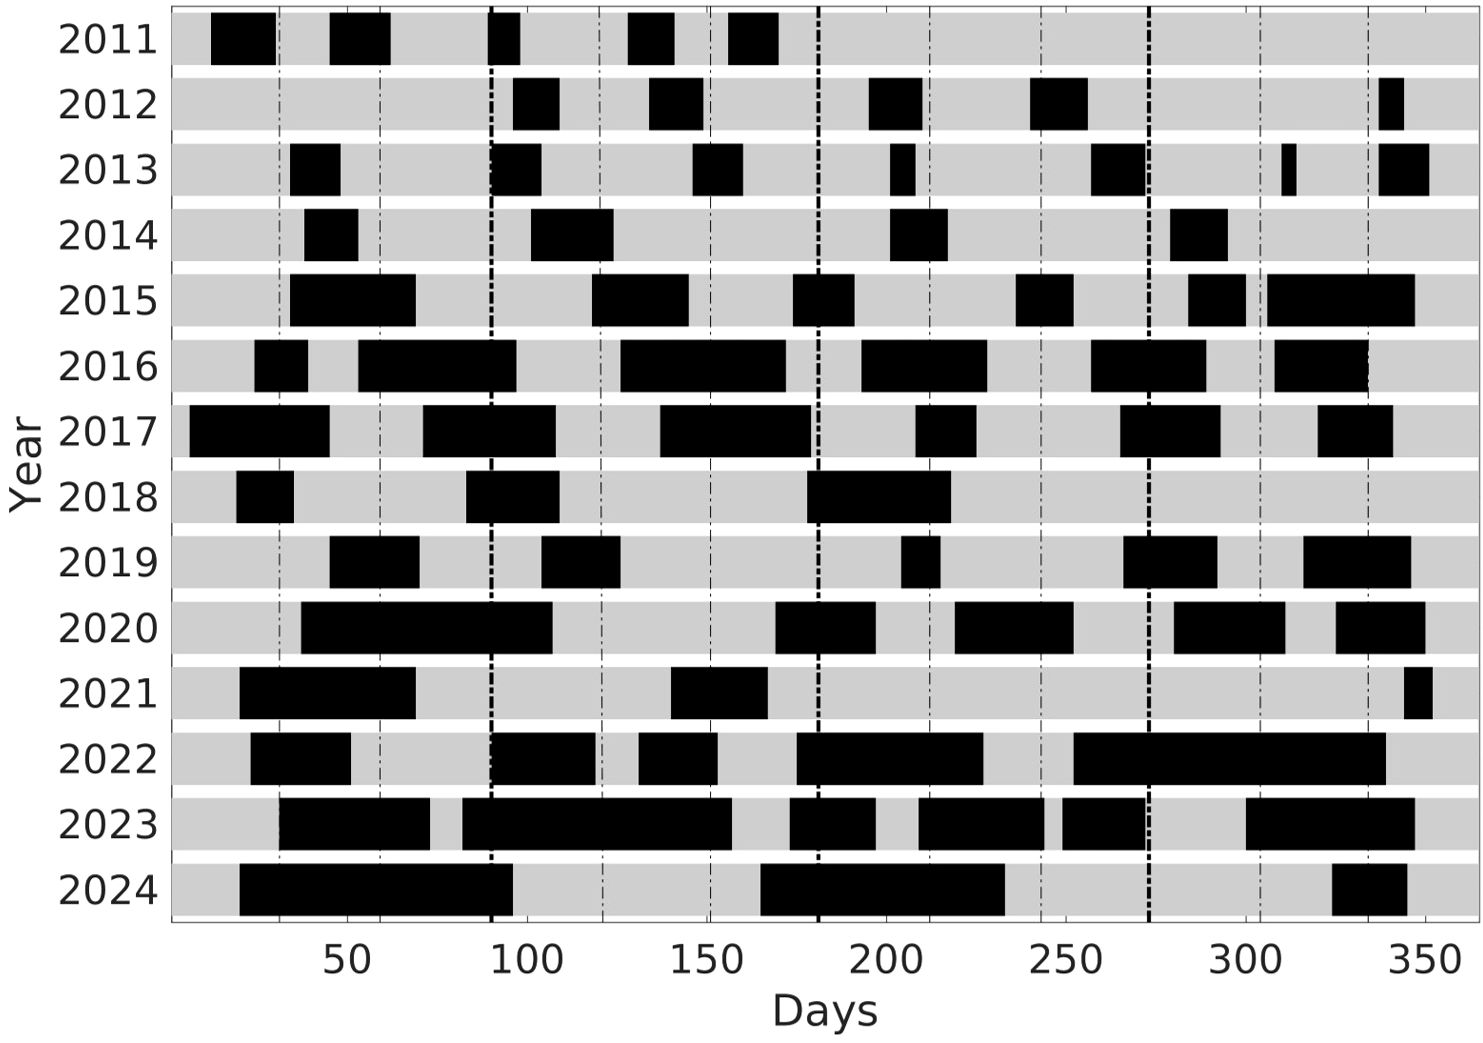
Figure 2. Glider sampling days of successful missions in the IC from 2011 to 2024.
2.2 Glider data processing
The data from the L1 delayed-time glider products have been subjected to rigorous processing methodology to establish a reliable horizontally and vertically interpolated product to then compute geostrophic velocity (GV) and derived transports. First, the following sampling criteria are applied to each individual profile: minimum of 10 measurements along the profile, data gap less than five dbar between two consecutive measurements and profile length exceeding 20 dbar. Besides, the international standard data processing applied to generate the L1 product including the thermal lag correction of salinity data from unpumped CTD sensors (Garau et al., 2011), glider CTD data was cross-calibrated using seasonal ship-based CTD data in the IC since 2013, when they are available (Heslop, 2015; Allen et al., 2020; referred to as L1corr product in Supplementary Material A). Also, additional quality-control is applied to remove potential temperature (θ) and salinity (S) spikes as well as suspicious profiles. Then, a linear interpolation into a vertical grid of 1 m depth resolution, which corresponds approximately to the glider sampling, is applied to each retained downcast and upcast profile, from surface to maximum operational depth of our study area, with the spatial and temporal profile position corresponding to the mean data positions along the profile. Since the glider trajectory is not perfectly rectilinear due to ocean conditions and technical issues, the longitude and latitude are projected on a fitted line at 39°N latitude. Profiles located more than 15 km from the line and those which do not follow monotone longitude are removed. Then, θ and S profiles are binned to 5 m in the vertical and 2 km in the horizontal, and then linearly interpolated to a standard grid of data points. These bins sizes allow removing some small scale variability in the vertical and providing an even set of profiles at a resolution approximately equivalent to the spacing of the glider profiles in the deep channel (Heslop, 2015). At this stage, a quality-controlled L2 product is generated for the study, with the spatial positions of the θ/S profiles varying with time.
Individual transects are then identified and sorted by increasing longitudes, from west to east, to facilitate their analyses. In addition, only the fully monitored transects are kept to be compared between themselves. More precisely, a transect is considered complete when glider profiles cover the IC between 0.1 and 1.13°E longitudes after having fulfilled all above-mentioned sampling conditions.
Finally, the upper 0–10 m layer has not been considered to use a homogeneous dataset considering all profiles since the glider inflection depth is located at 10 m depth. Indeed, considering only surface profiles would lead to smoother GV fields. Moreover, not filling the surface gaps allows avoiding errors that would be introduced by horizontal interpolation and extrapolation. Finally, that allows rejecting erroneous surface data from surfacing profiles. Indeed, unrealistic jumps in temperature and salinity raw data have been detected in the upper 10 m due to the contamination of conductivity cells from the ingestion of material on the sea surface (e.g. microorganisms, oils and debris) by glider surfacing (Wong et al., 2020). The bottom layer being more stable (Chevillard et al., 2024), the channel bottom is filled by extrapolation.
3 Methodology
3.1 Geostrophic transport computations
A horizontal smoothing through moving average filter is then applied to the interpolated θ and S data to compute GVs. The smoothing parameter (filter length scale) was initially fixed at 6 km (Heslop et al., 2012, 2017). In this study, we use and recommend the 24 km value to better consider the geostrophic signal excluding the signal smaller than the internal Rossby radius, which is approximately 10–15 km in this region (Send et al., 1999; Beuvier et al., 2012). The inertial period in the IC is approximately 20 hours, with geostrophy being valid at time scales larger than inertial. The spatial smoothing at 24 km indirectly performs this low-pass temporal filtering for these glider mission characteristics. This value is also based on sensitivity tests and analyses about the presence of small structures at the surface. Compared to other observations and literature in the region, the GV field shows unrealistic patterns with very high velocity reaching 0.6 m/s in the surface layer. After discarding the impact of profile characteristics (positions and inclinations) on these small structures, their occurrences in GV sections have been visually and qualitatively examined for each transect and every mission in the IC. Well-marked small dipoles with strong northern and southern velocities appear in the thermocline in most of the sections in summer (July, August, September), and slight structures at the surface in more than 50% of the sections in spring (April, May, June). These results allow to establish the correlation with seasonal characteristics and relationship with thermocline. These unrealistic small structures of 5–10 km size in the longitudinal direction in the thermocline in summer time are probably due to the partial capture of small ocean processes due to the glider sampling (Rudnick and Cole, 2011).
From the interpolated and smoothed θ and S fields, GVs across the IC are calculated assuming a zero velocity at the reference level which is considered as the sea bottom (Vargas-Yáñez et al., 2025). Estimates of GVs and transports are similar whether using a deep reference level with no motion or the actual bottom reference (Vargas-Yáñez et al., 2025). The depth-averaged velocity (DAV) is not used in this study. Earlier research has shown potential errors in estimating glider DAV and demonstrated large errors in the compass heading measurements from the gliders (Merckelbach et al., 2008; Heslop, 2015). In addition, Heslop (2015) also showed that the GV estimate captures much of the signal, with the mean difference between DAVs calculated from the glider and from GV being within the level of calculation error (Merckelbach et al., 2008).
3.2 Water mass identification
The typical water masses of the western Mediterranean Sea are identified (Schoroeder et al., 2024). The surface layer is occupied by the Atlantic Water (AW) of recent origin (hereafter, AWr) and/or modified in the Mediterranean Sea (hereafter, AWm). Below, the Western Intermediate Water (WIW) can be formed during severe winters in the Gulf of Lion and/or the Balearic Sea (Juza et al., 2013, 2019) and is easily identified by its temperature minimum above the Levantine Intermediate Water (LIW). This latter is formed in the eastern Mediterranean and its core is generally found around 400 m depth in the western Mediterranean (Millot, 2013). Eastern Intermediate Water (EIW) is a general term for intermediate waters formed in the eastern Mediterranean. EIW combines LIW and Cretan Intermediate Water which are not distinguishable west of the Sicily Strait. Although Schroeder et al. (2024). have recommended the use of EIW in the western Mediterranean, LIW is still used in this study for historical reasons. In the deep layer, the Western Mediterranean Deep Water (WMDW) is formed by deep convection in the Gulf of Lion (Salat et al., 2010; Testor et al., 2018). In this study, the geometry-based method developed by Juza et al. (2019) has been applied to better detect WIW. Indeed, given the rapid ocean warming spreading along the water column in the Mediterranean Sea, the authors have shown the hard detection of WIW by conventional fixed-range criterion in θ and S, and the necessity to use this adaptive method enabling WIW detection in case of temporal and regional changes in temperature and salinity properties. The capability of this method has been also demonstrated through its application to observational data from seasonal oceanographic campaigns in the Balearic Sea (Vargas-Yáñez et al., 2020, 2021). More precisely, WIW is detected through the geometry-based detection method using the same parameters as in Juza et al. (2019). Then, AW is identified as surface water with S smaller than 38.35. When S is fresher than 37.5, AW is considered as recent (AWr). LIW and WMDW correspond to water masses with S saltier than 38.35 at depth shallower and deeper than 750 m, respectively.
3.3 Statistics on time series
3.3.1 Monthly and seasonal climatologies
The general circulation and hydrographic features can be characterized through monthly and seasonal climatologies. Given the uneven temporal sampling of the IC sections between months and between years (Figure 2), monthly means of vertical sections have been firstly computed for θ, S, potential density () and GV as well as for the derived geostrophic transports over the period of study. Then, monthly and seasonal climatologies have been established from the monthly mean time series, thus reducing the impact of the irregular sub-monthly sampling on the estimations. The seasons are defined as follows: winter (January, February, March), spring (April, May, June), summer (July, August, September) and autumn (October, November, December). The reference period 2011–2022 has been chosen for climatologies. Although longer timeseries are available, the year 2023 has been excluded for being particularly anomalous in terms of circulation in the IC with an exceptional inflow of recent AW in autumn (discussed in section 6.1). Indeed, the monthly mean climatology and associated standard deviation of the net geostrophic transports over 2011–2023 differ, particularly in autumn, from the climatologies built over 2011-2020, 2011–2021 and 2011-2022 (Figure 3). Similar estimations of monthly net transports for climatologies over these three shorter periods (as reflected by the means, standard deviations, minimum and maximum values in Table 1) also justify the choice of the reference period taking the longest timeseries which does not introduce strong anomalous transports.
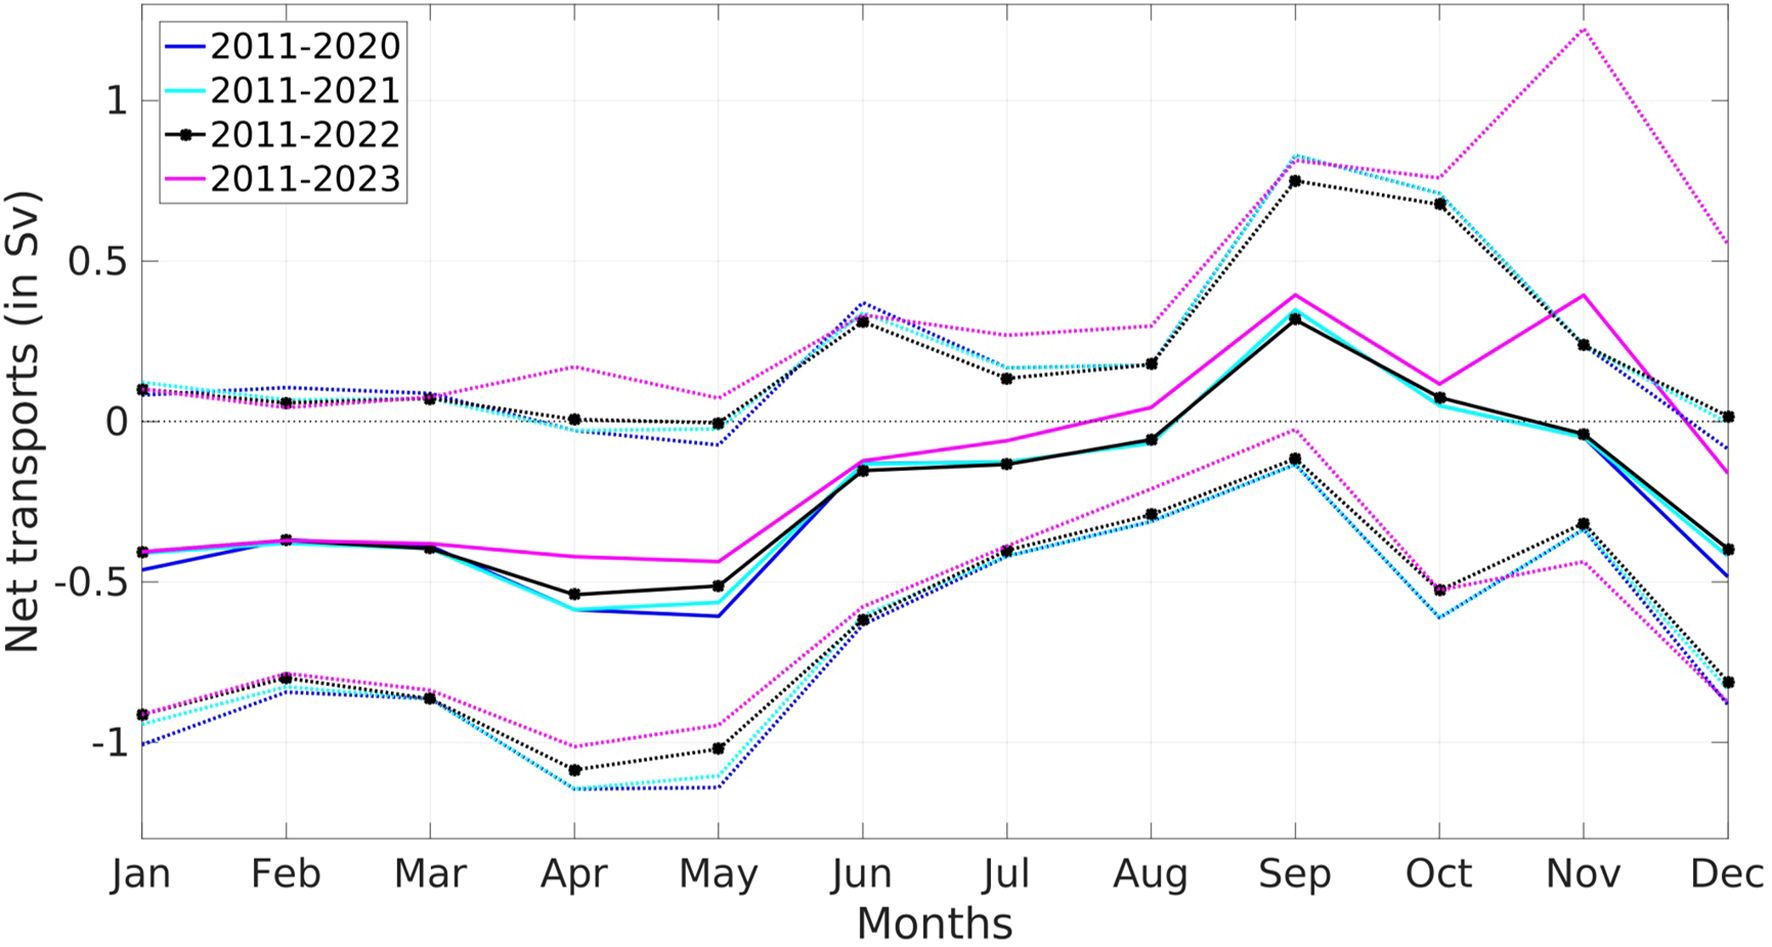
Figure 3. Monthly mean climatology (solid line) and standard deviation (dashed line) of the net total transports (in Sv) derived from the glider sections in the IC over the periods 2011-2020, 2011-2021, 2011–2022 and 2011-2023.
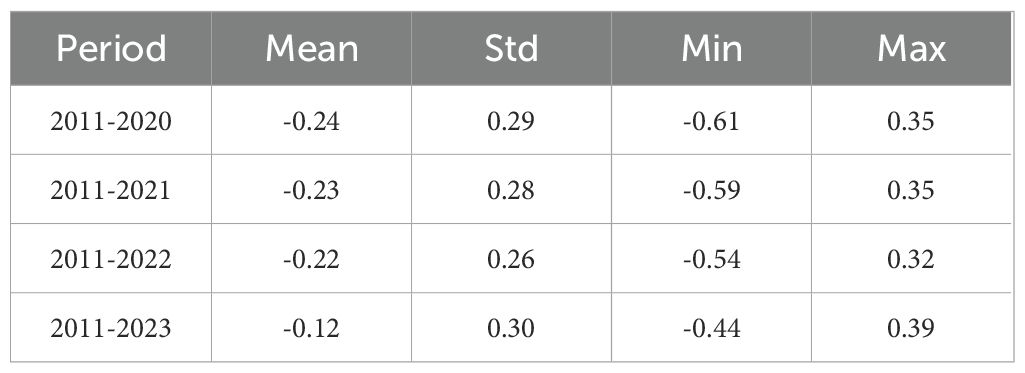
Table 1. Mean, standard deviation, minimum and maximum values of the monthly climatology of net transports (in Sv) built over the periods 2011-2020, 2011-2021, 2011–2022 and 2011-2023.
3.3.2 Medians and trends
When displaying timeseries to assess the temporal evolution of water mass characteristics (θ, S, ), each point corresponds to the median of the distribution of the studied variables over the transect. This approach is more appropriate than using the mean since the distributions of the ocean hydrographic properties are not Gaussian (Vargas-Yáñez et al., 2020; Juza and Tintoré, 2021). Then, classical statistics are computed such as the mean and standard deviation.
Finally, linear trends are estimated from a weekly timeseries of water mass properties over the period 2011–2024 with 95% confidence level according to the methodology from Chelton (1983).
3.4 Post-processed data and graphical information
The transport estimations from 2011 to 2024 and the derived monthly climatology over the period 2011-2022, as computed following the methodology described in Sections 2 and 3, are in open access (Juza et al., 2025a, 2025b). Moreover, all images generated and used for this study are accessible through the visualisation tool “Ocean gliders in the Ibiza Channel” (https://apps.socib.es/gliders-ibiza-channel/; Juza et al., 2025c), which has been implemented by SOCIB to give access to all information. In particular, vertical sections of θ, S and GV, as well as θ/S diagrams, are displayed for each fully-sampled transect. Also, timeseries of total and water mass geostrophic transports are also displayed over the period 2011–2024 and will be regularly updated. Finally, monthly climatologies for vertical sections and transports are provided over the reference period 2011–2022 used in this paper.
4 General circulation
4.1 Seasonal properties
In the upper layer, the seasonal variability of the thermohaline characteristics and circulation is more marked than in the deeper layer in the IC (Figures 4, 5). Surface θ follows a strong seasonal cycle with mean values ranging from 14.22°C in winter to 25.47°C in summer. The upper layer S shows higher seasonal values mean in winter and spring in the western part of the IC, which are associated with the southward flow of the NC, as observed in the GV sections. Conversely, the lowest surface S occurs in autumn, with a seasonal mean of 37.42 in the eastern part of the channel, reflecting the inflow of recent AW as indicated by the northward GV. Seasonal variations of in the upper layer are primarily driven by the θ variations, with the lowest seasonal mean values observed in summer and the highest in winter. The seasonal GVs allow illustrating the general circulation in the IC as shown in previous studies (Pinot et al., 2002; Heslop et al., 2012; Vargas-Yáñez et al., 2020). In winter and spring, the circulation is dominated by the southward NC in the western part of the channel extending to 400–500 m, with inflows in the surface in the east of the channel extending to 100–200 m. The NC intensifies in winter by the cold windy weather and weakens in summer and autumn (Pinot et al., 2002; Birol et al., 2010). This weakening allows the broader and more intense inflow of fresh water, particularly in the eastern part of the IC. In the subsurface, the seasonal variability of the thermohaline characteristics and circulation are more stable. In the intermediate layer, the signature of LIW is well-marked through a S maximum at depths of approximately 400–500 m.
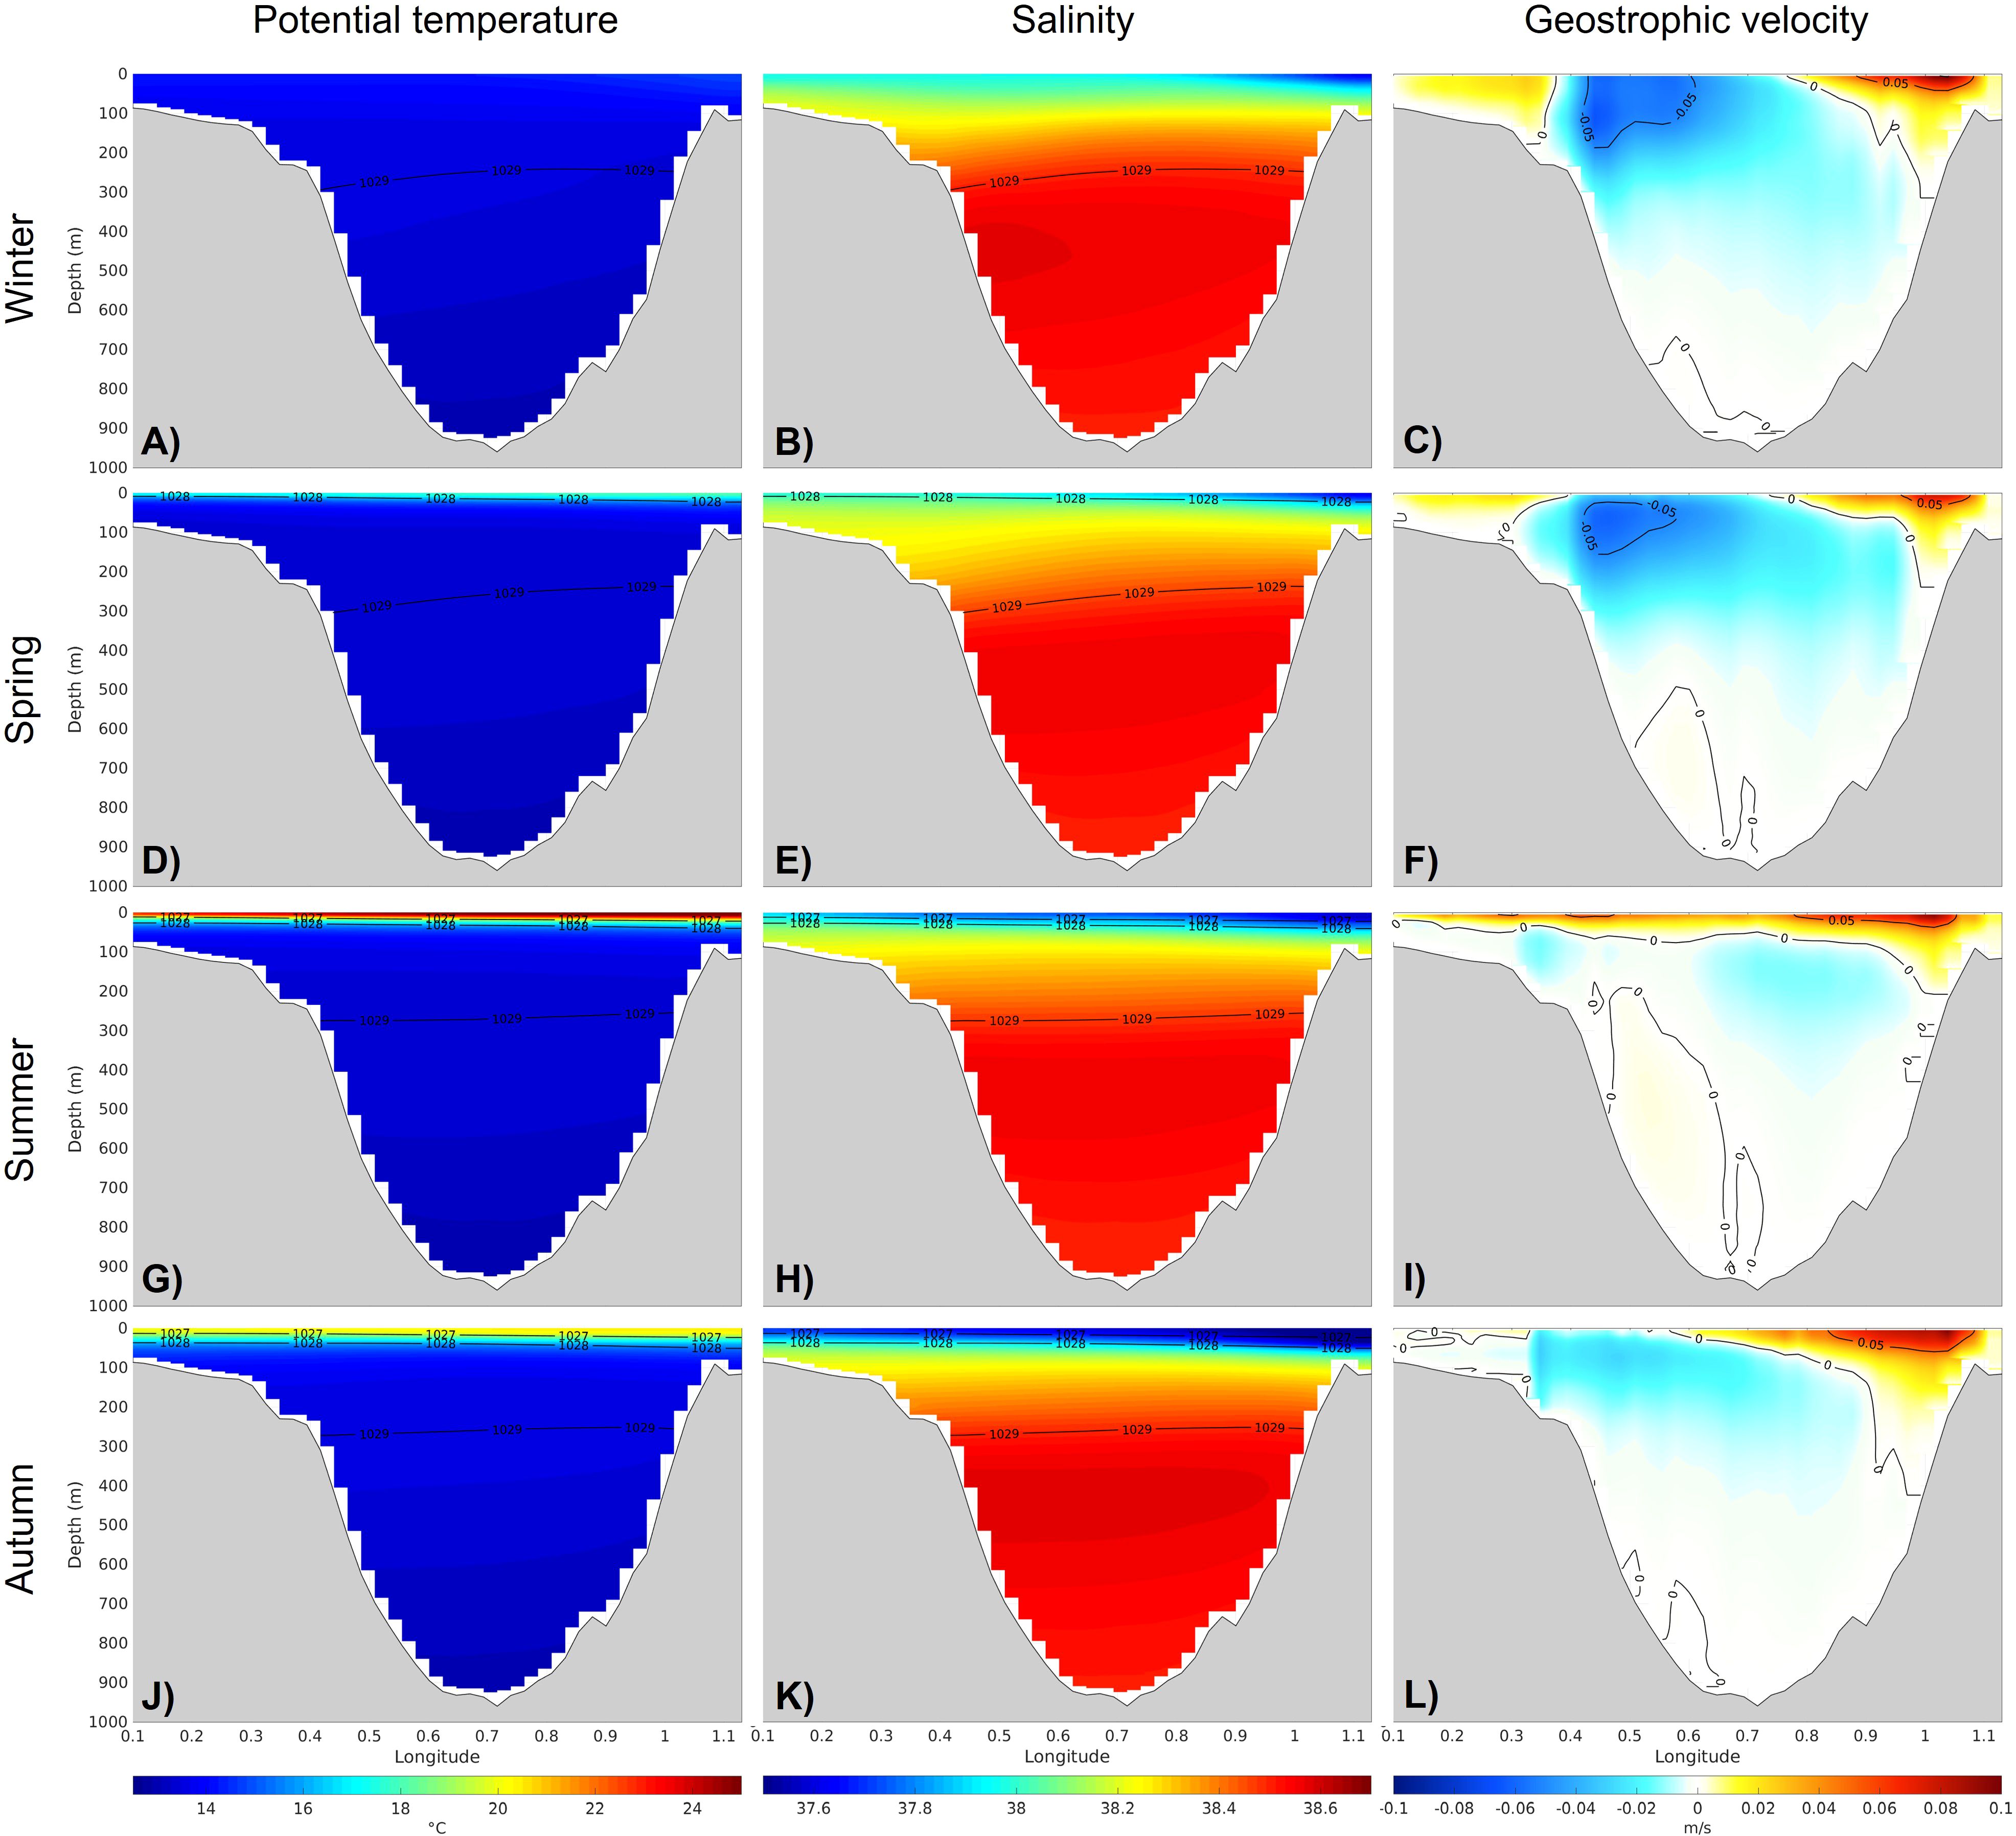
Figure 4. Winter (A-C), spring (D-F), summer (G-I) and autumn (J-L) climatologies of θ (A, D, G, J), S (B, E, H, K) and GV (C, F, I, L) from glider observations in the IC over the period 2011-2022. contours are indicated in the θ and S sections.
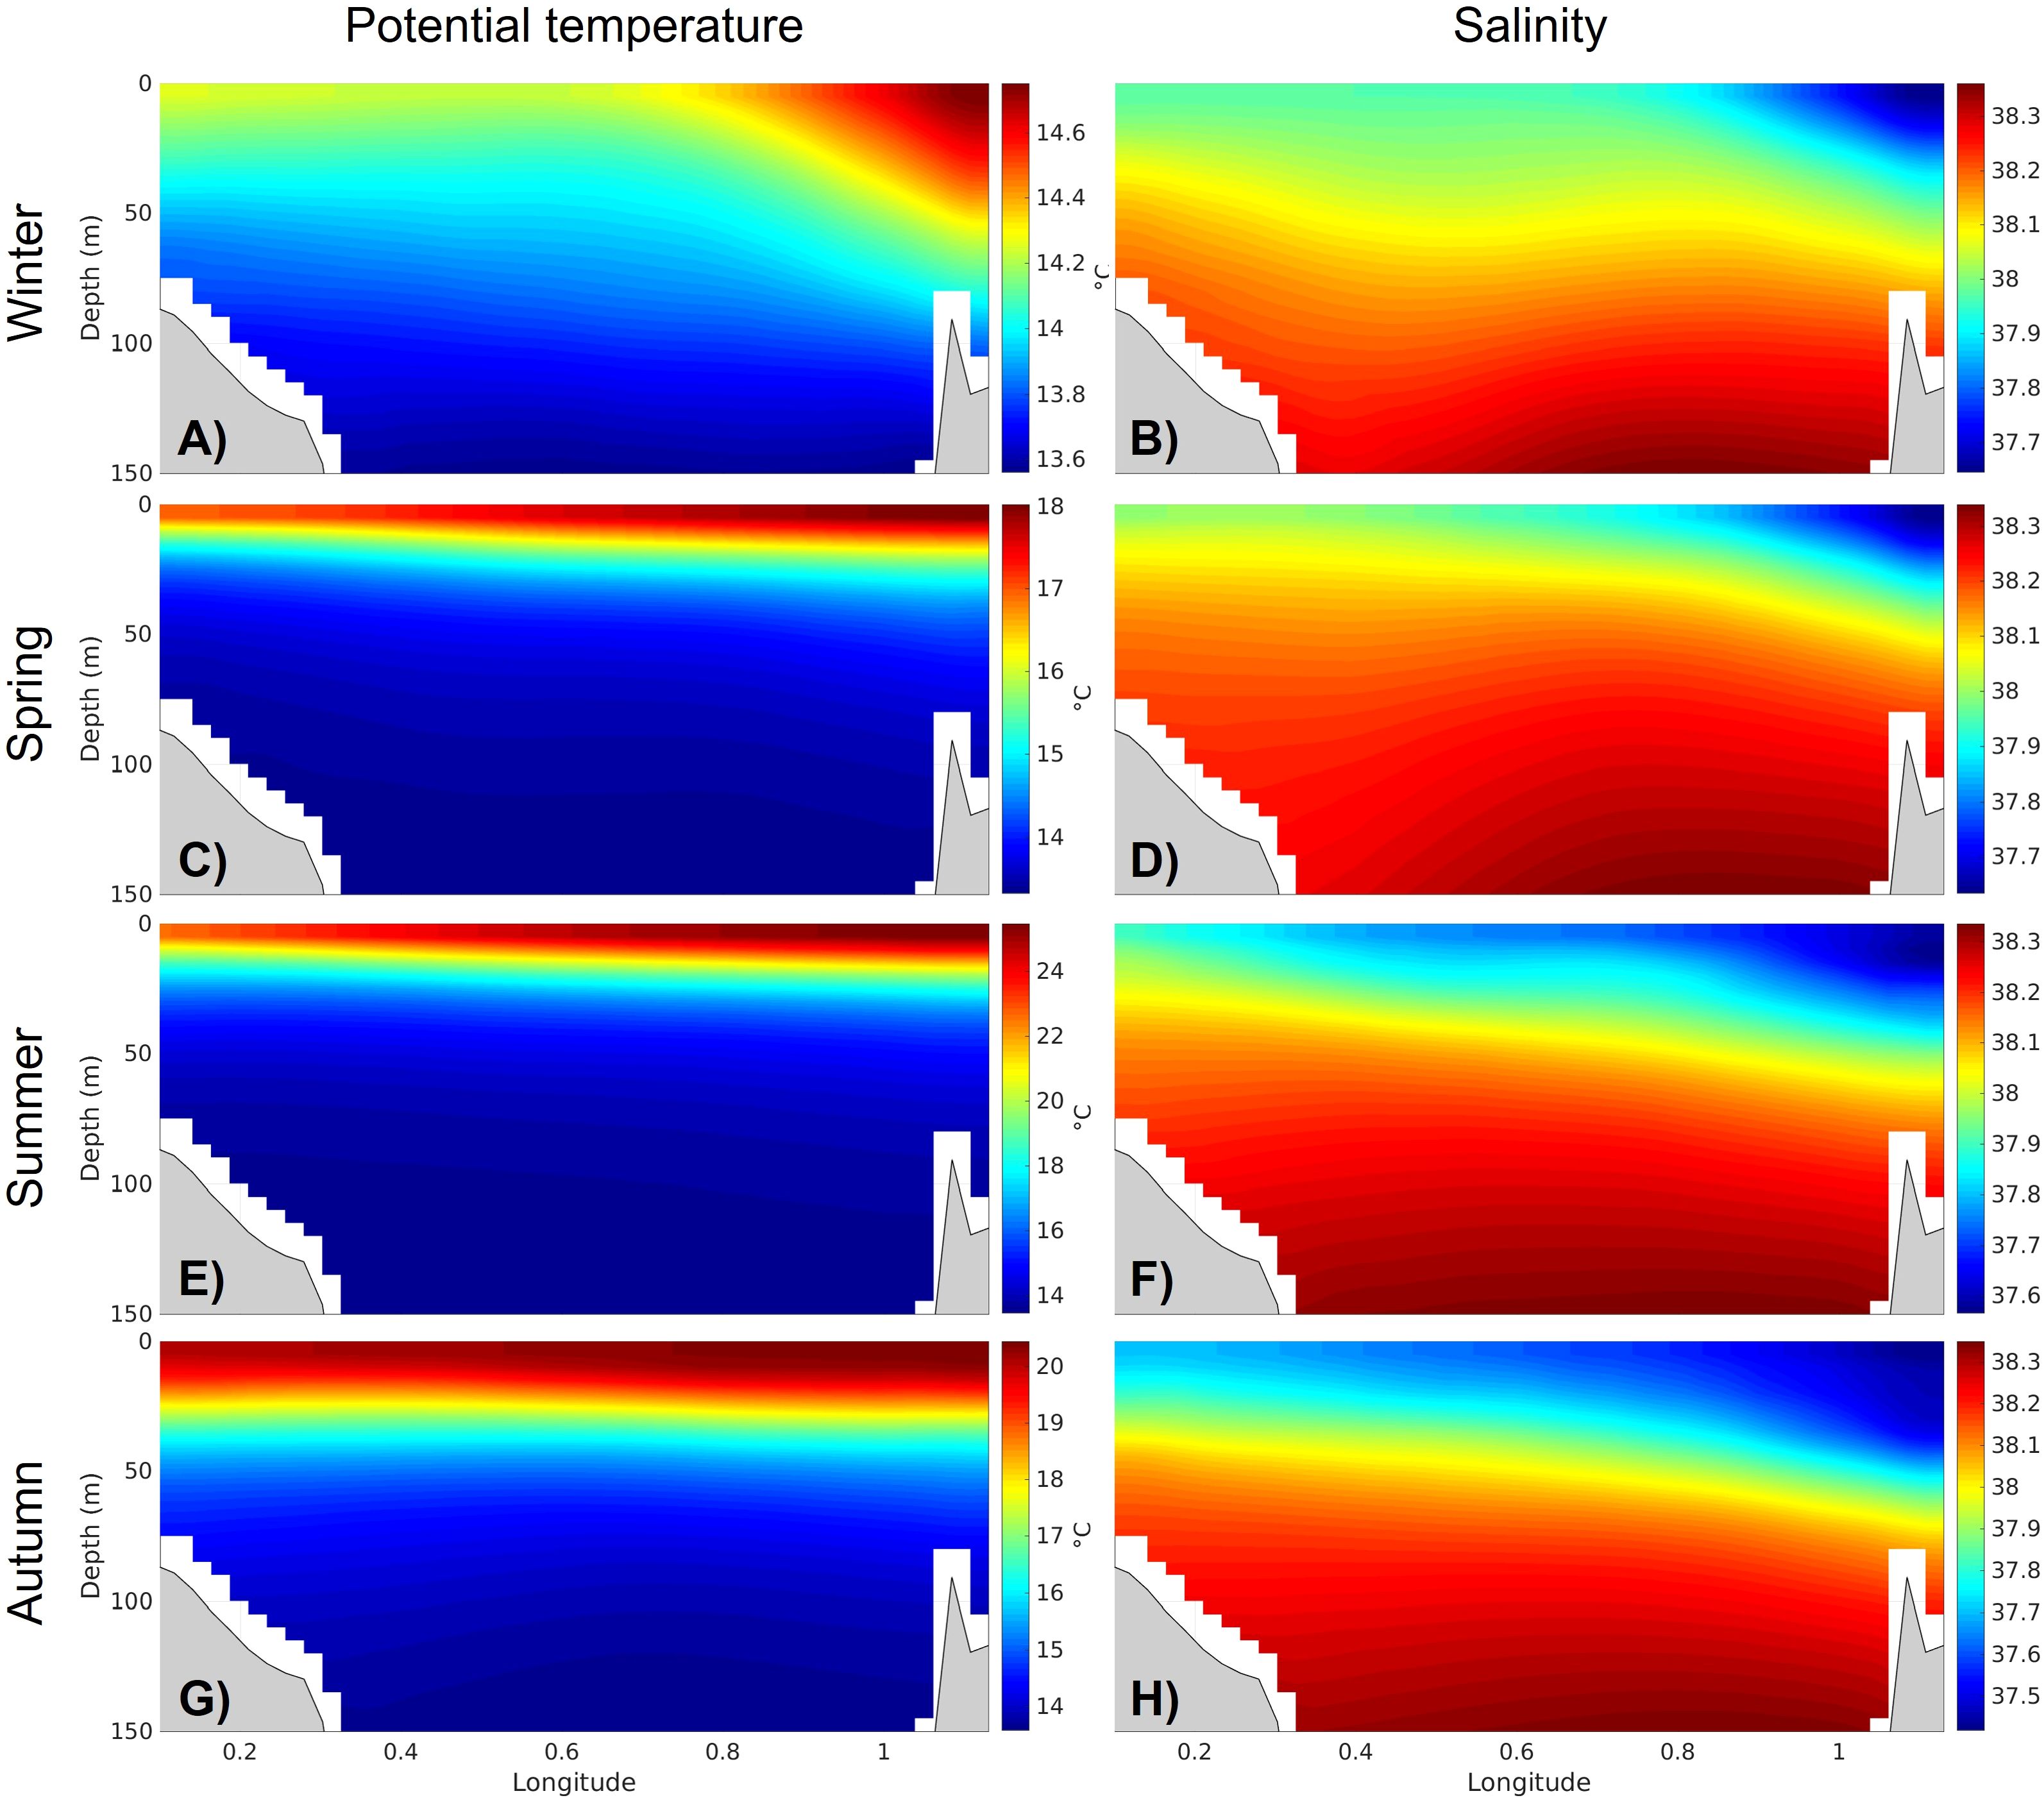
Figure 5. Same as Figure 4 for θ (A, C, E, G) and S (B, D, F, H) in the upper 0–150 m layer.
4.2 Total transports
Geostrophic transports are calculated from the GV estimations in the IC. Both northward and southward transports were computed for each transect from 2011 to 2024. The monthly climatology of total transports was also for the period 2011-2022 (Figure 6A). Orange bars show positive (northwards) transports calculated for the whole water column, whereas blue bars correspond to negative (southwards) transports. Solid black line is the net transport. Figure 6A shows significant monthly variability with values ranging from 0.24 Sv in May and July to 0.57 Sv in September for the northward transports, while the southward transport oscillates between -0.26 Sv in September and -0.88 Sv in January. The net flow shows a well-marked seasonal cycle with a minimum of -0.54 Sv in April when the circulation is dominated by the strong southward NC, and a maximum of 0.32 Sv in September when the weakening of the NC enables northward inflows across the IC. The monthly net flow is dominated by the southwards flows from November to August and by the northward flow in September-October over the period 2011-2022. The seasonal mean values for the net flow over the period 2011–2022 are -0.39, -0.40, 0.13 and -0.36 Sv for winter, spring, summer and autumn, respectively. These values differ particularly in spring, summer and autumn from those reported by Vargas-Yáñez et al. (2020; 2025). who presented seasonal values of -0.41, -0.25, -0.25, and -0.10 Sv over 1996–2019 and -0.44, -0.18, -0.10 and -0.25 Sv over 1996-2022, respectively. The discrepancy arises not only from the different period used (1996–2019 and 1996–2022 versus 2011-2022) but also from the use of coarser temporal resolution data in the earlier study, which relied on ship-based seasonal casts which could have missed transient events, such as the northward AWr inflow in late-summer or strong southward NC events in early-spring.
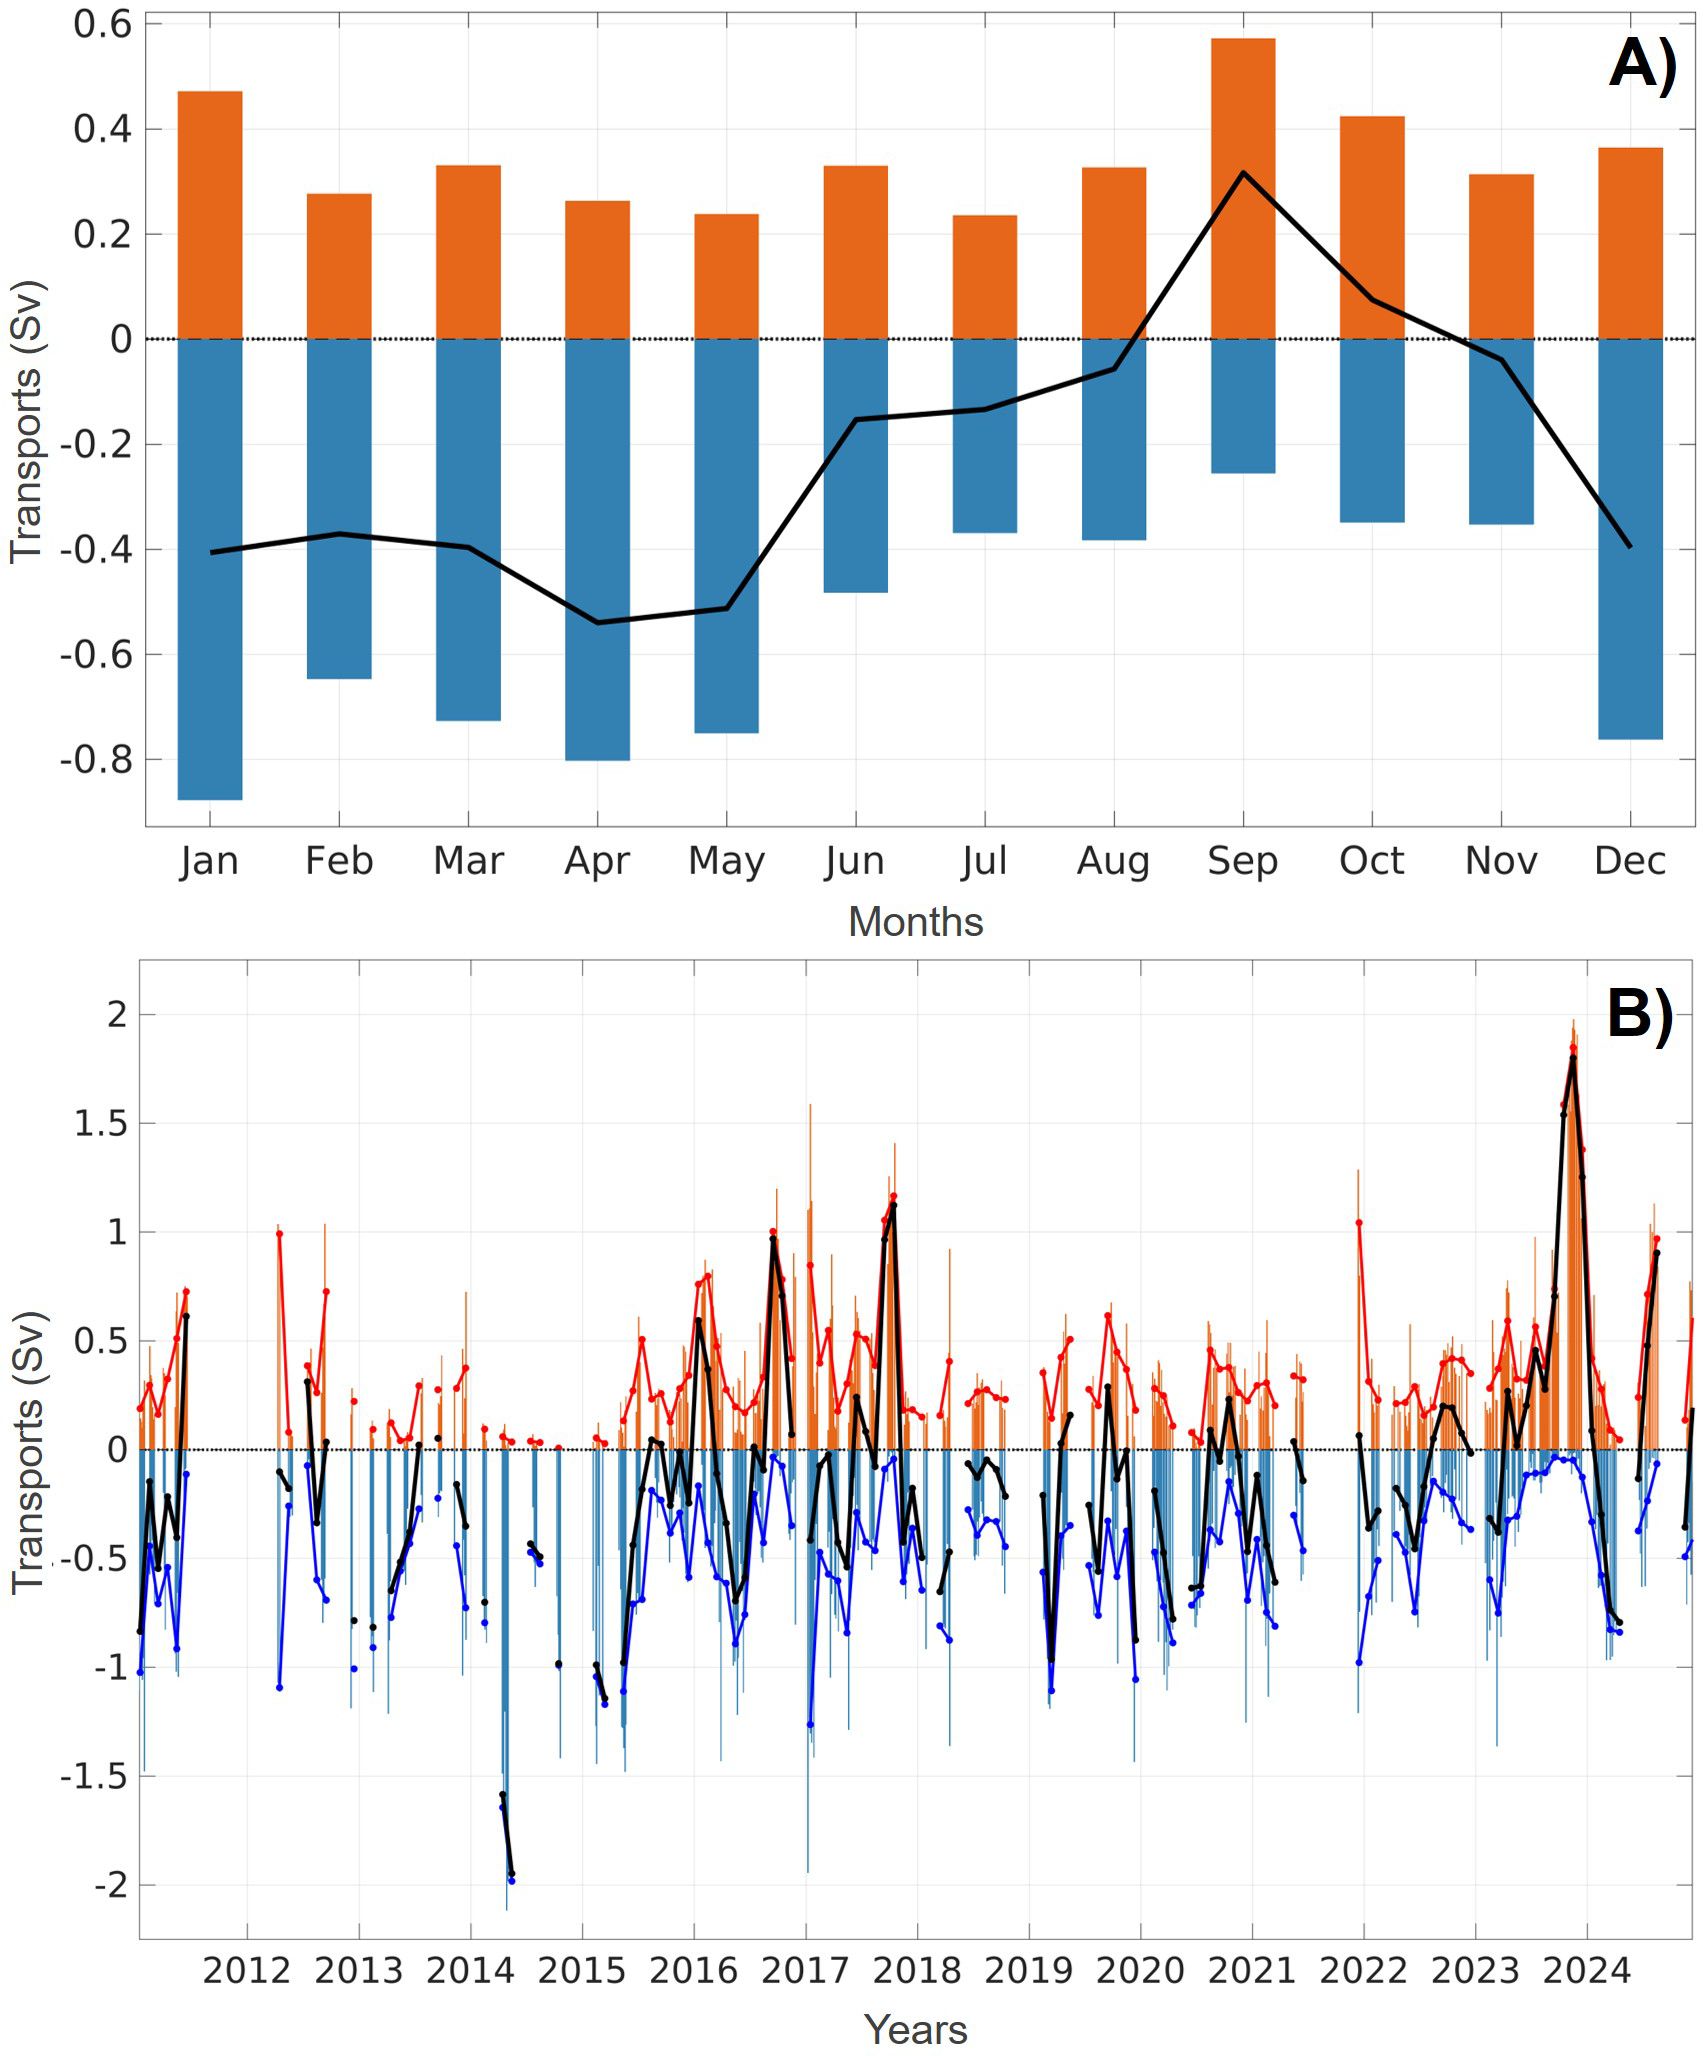
Figure 6. Monthly climatology of the net (in black), northward (positive, in orange) and southward (negative, in blue) total transports (in Sv) derived from the glider sections over the period 2011-2022 (A). Net, northward and southward total transports for each glider transect in the IC from January 2011 to December 2024 (B).
The total transports for each individual transect from 2011 to 2024 highlight the high temporal variability across days and weeks to interannual scales (Figure 6B). The standard deviation of total transport has the same order of magnitude as the mean. On average (Table 2), the southward transport shows both higher magnitude and temporal variability (-0.52+/-0.38 Sv) compared to the northward transport (0.39+/-0.35 Sv), resulting in a negative net transport with considerable variability (-0-13+/-0.59 Sv). From 2011 to 2024, the northward transport ranges from 0.001 to out of ordinary peak of 1.98 Sv in November 2023. This particularly high value, lasting several weeks, was observed by the glider from 29 October to 12 December 2023 coinciding with periods of strong westerly wind conditions in Spain. Concerning the southward transport, it oscillates between 0.006 and 2.12 Sv, this exceptional maximum being recorded in April 2014.
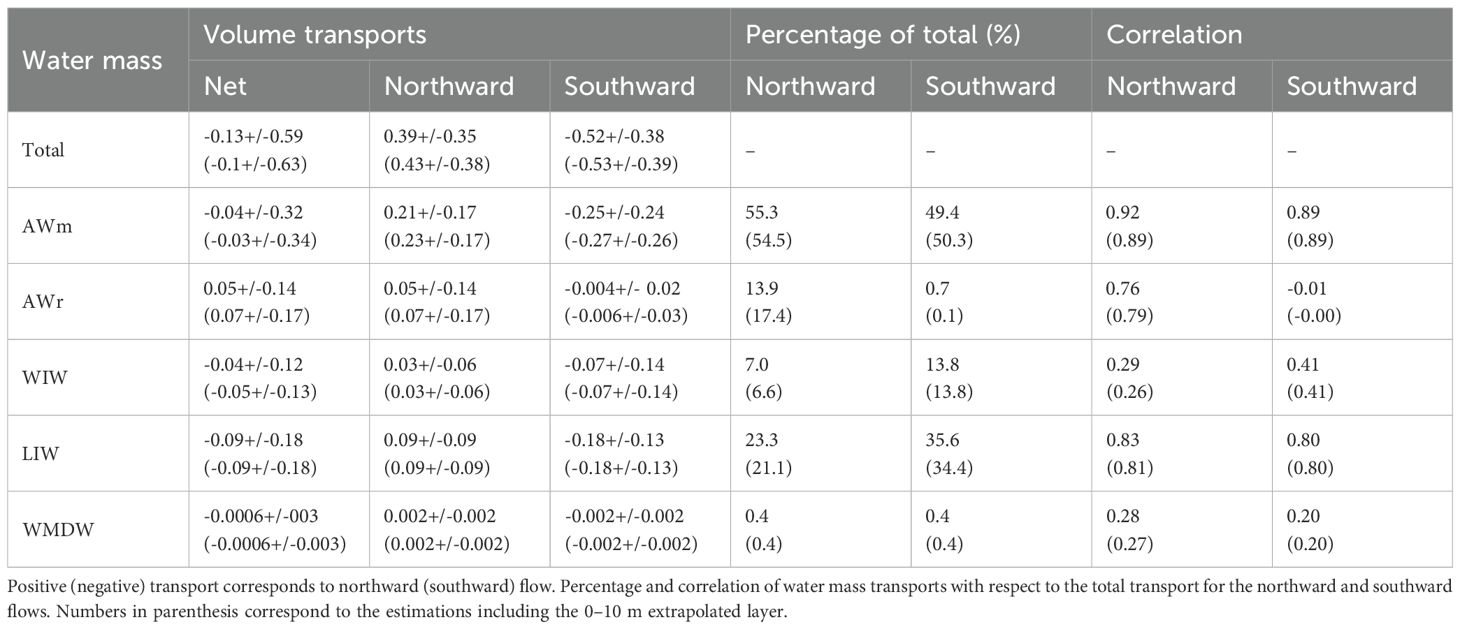
Table 2. Mean +/- standard deviation of the total and water mass volume transports for the northward, southward and net components over the period 2011-2024.
In the IC, the transport volumes of water show variations from high frequency (days-weeks) to seasonal and interannual time scales. This wide-range variability has not been observed previously and can be explained by changes in dynamics, being related to the presence of water masses and the ocean circulation in the area (Heslop et al., 2012; Juza et al., 2013, 2019; Juza and Tintoré, 2021). To better understand this variability, water mass properties and associated transports will be analysed in the following section.
5 Water mass dynamics
5.1 Water mass properties
The observed θ/S diagrams for the four seasons over the period 2011-2024 (Figure 7) show the presence of typical water masses of the western Mediterranean Sea: the recent and modified AW (AWr and AWm, respectively) in the upper layer with smaller S and higher θ than below, LIW in the intermediate layer with its θ and S maxima (Millot, 2013), and the dense WMDW in the bottom layer (Salat et al., 2010). Also, the presence of WIW, which is formed in the Gulf of Lion and the Balearic Sea (Juza et al., 2013, 2019), is highlighted by its well-marked θ minimum in winter and spring.
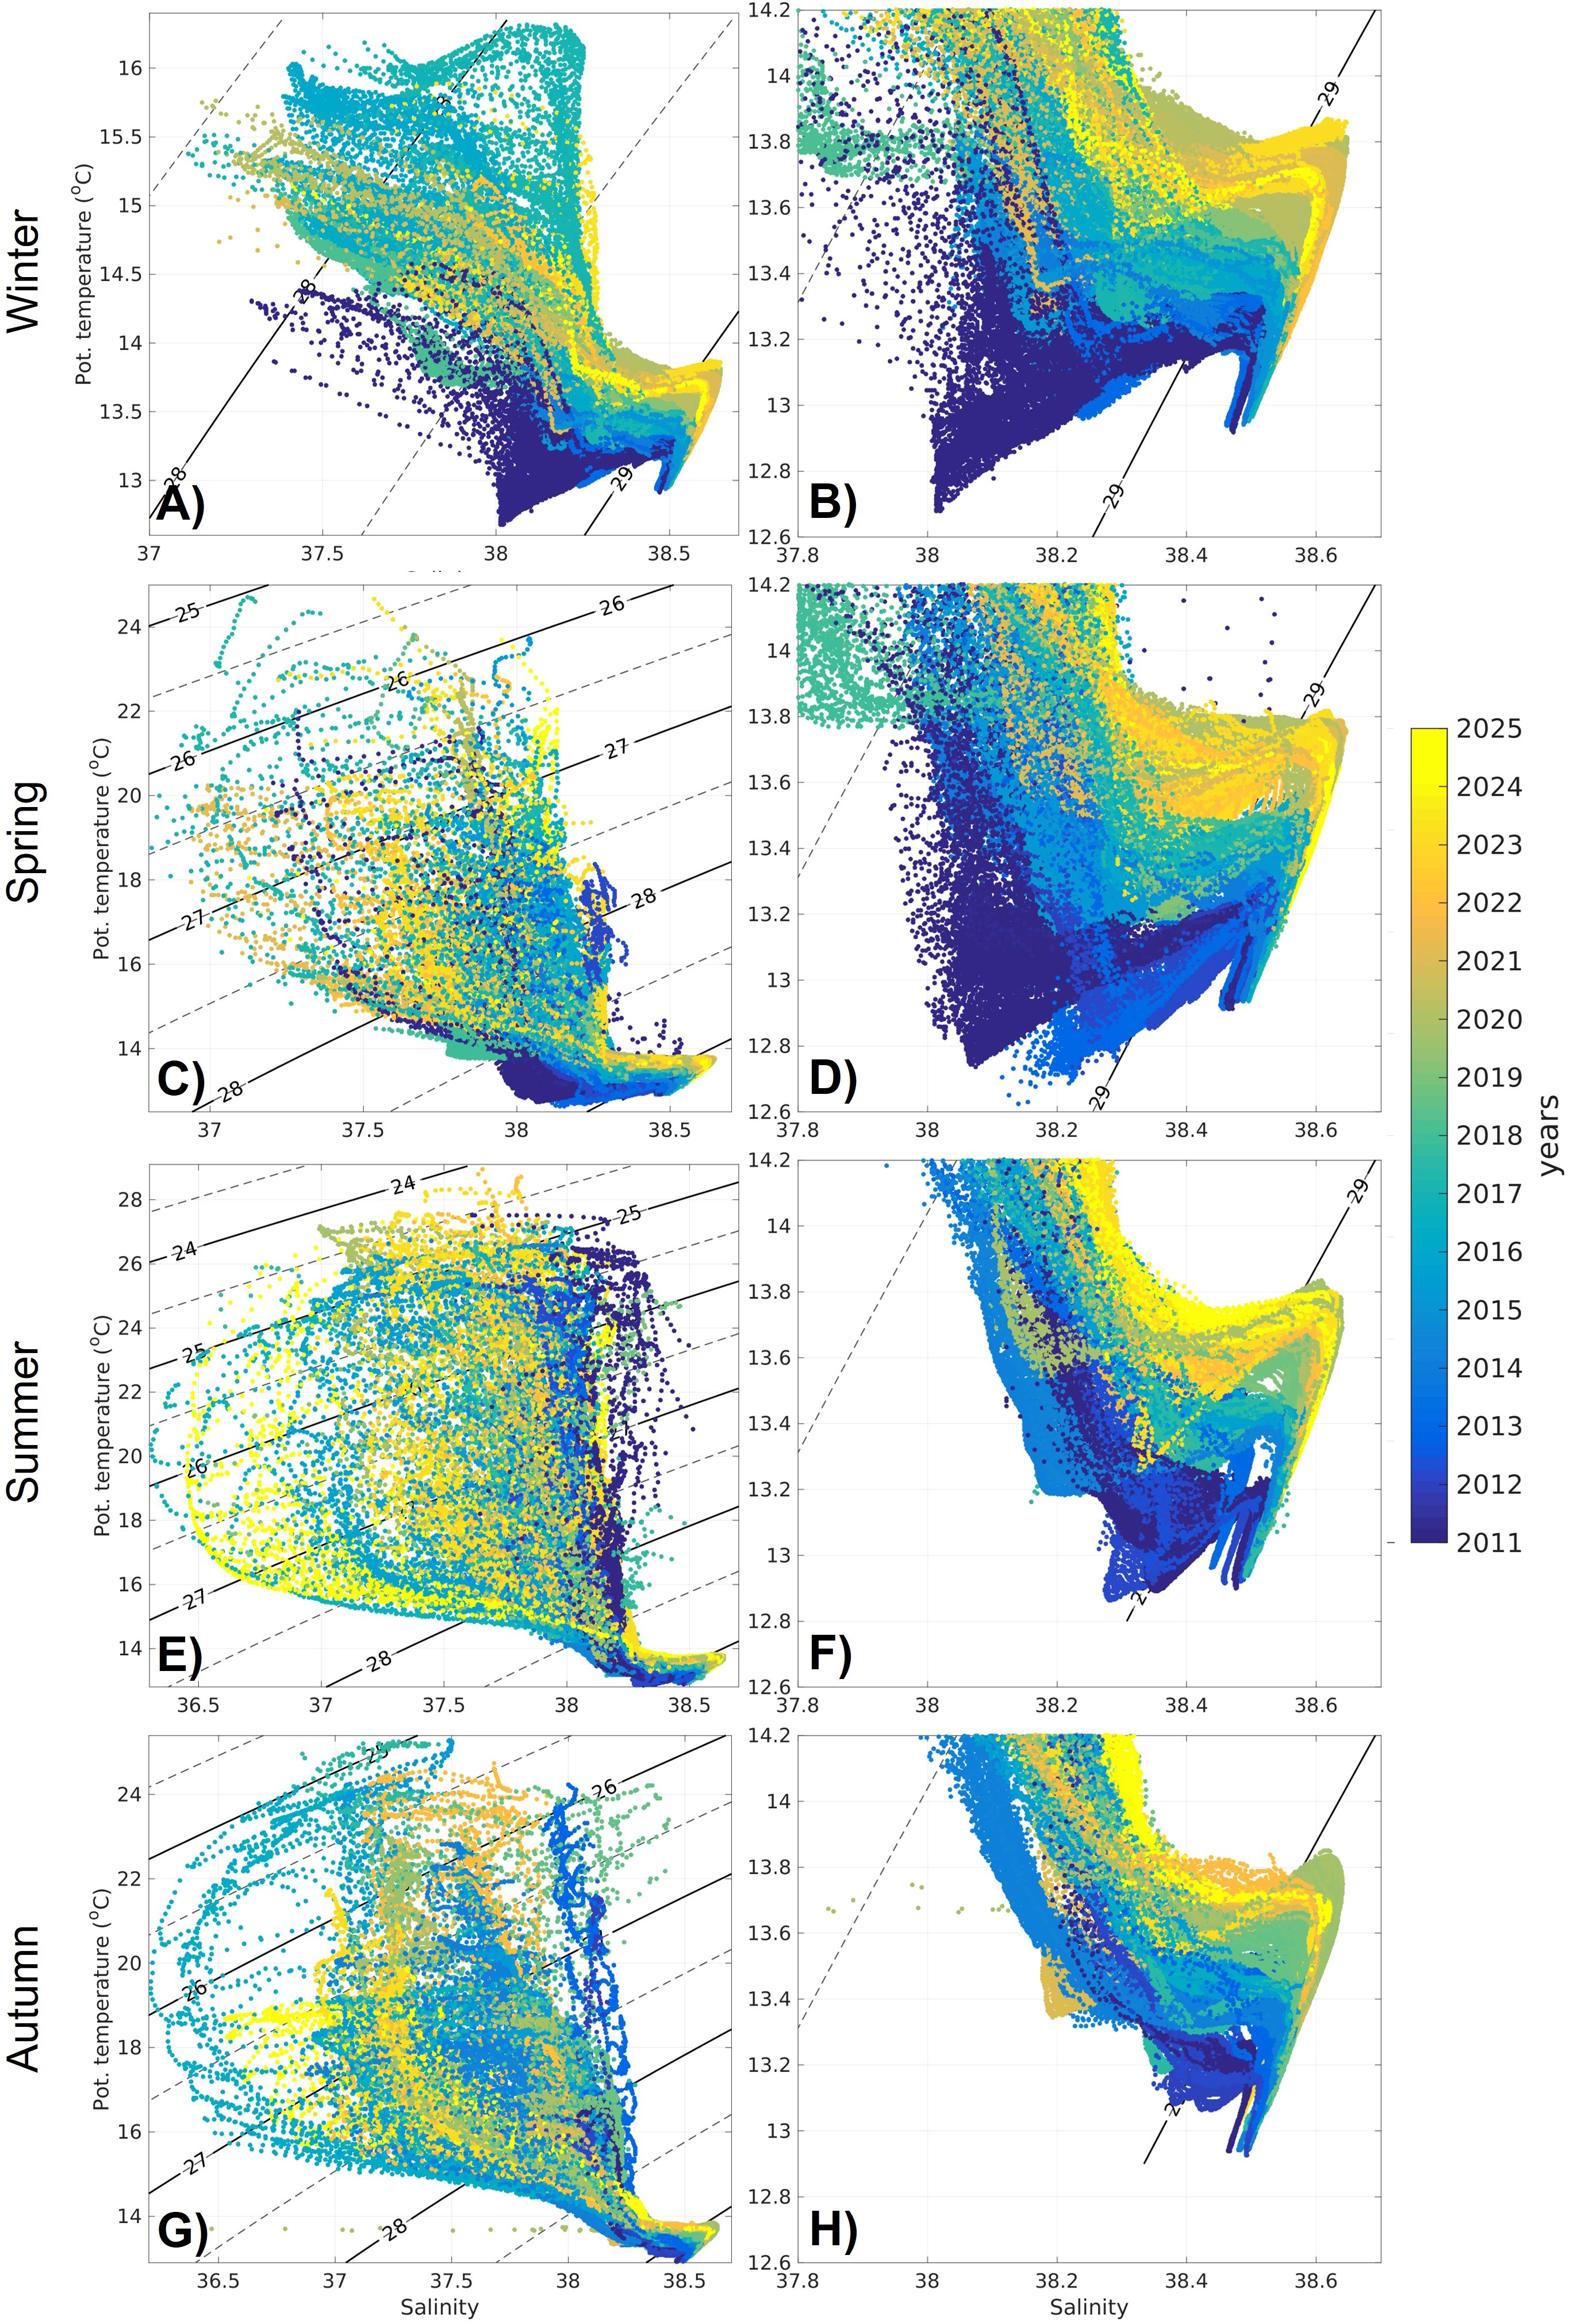
Figure 7. Seasonal θ/S diagrams from glider observations in the IC over the period 2011-2024 (A, C, E, G) and associated zooms in the intermediate and deep layers (B, D, F, H) for winter (A, B), spring (C, D), summer (E, F) and autumn (G, H).
The observed θ and S cover a large range of values varying from 12.59 to 29.05 °C and from 36.21 to 38.65, respectively, over the period of study. The seasonal θ/S diagrams show the largest ranges of θ from spring to autumn due to high θ at the surface. Also, the lowest θ are observed in winter and spring, with minimum values of 12.68 and 12.59 °C, respectively, which are associated with the presence of WIW. The S ranges show strong variability particularly in the upper layer. The seasonal S values extend towards lower values than 37 in summer and autumn corresponding to the entrance of AWr. The S maximum associated with LIW in the intermediate layer is relatively stable throughout the seasons. In deep layer, the densest waters with colder θ and fresher S than LIW are found corresponding to WMDW with S saltier than 38.4.
The seasonal θ/S diagrams highlight seasonal features related to the presence of water masses and regional circulation. Also, they show high variability in the upper layer and trends in the intermediate and deep layers that will be discussed in Section 6.
5.2 Monthly water mass transports
The seasonal circulation highlighted through the analysis of seasonal climatology of θ, S and GV (section 4.1) can also be reflected in geostrophic transports of water masses across the IC. Water mass transports are estimated from hydrographic properties and derived geostrophic velocities. As for the total transports for this study, both northward (positive) and southward (negative) water mass transports were computed for each transect from 2011 to 2024. The monthly climatology of water mass transports over the period 2011-2022 (Figure 8A where water masses are indicated in colors) shows significant seasonal variations in both the direction and magnitude of water mass exchanges in the IC. Southward flow is generally higher than the northward flow (as discussed in Section 4.2 and shown in Figure 6), particularly in winter, when the NC intensifies. The seasonal variability indicates the dynamic interplay of circulation and thermohaline characteristics in the IC. Both the northward and southward flows are mainly composed of AWm and LIW. The AWm transport ranges from 0.11-0.31 Sv northwards and 0.14-0.54 Sv southwards, contributing significantly to the overall transports, respectively. The largest southward transport of AWm occurs in December and January, coinciding with the intensification of the circulation during winter. Similarly, LIW is primarily observed in the southward flow, where it reaches the maximum transports of 0.28 and 0.29 Sv occurring in March and April, respectively. Northward flow is strongly influenced by the intrusion of recent AW, which reaches its peak in September and October with values of 0.14 and 0.17 Sv, respectively. Being formed in the Balearic Sea and Gulf of Lion in winter, WIW crosses the IC flowing southwards and is mainly present in late-winter and early-spring with maximum monthly values of 0.17 and 0.25 Sv found in the southward flow in April and May, respectively. Also, recirculated WIW is occasionally found in the northward transport, indicating its potential redistribution in the region.
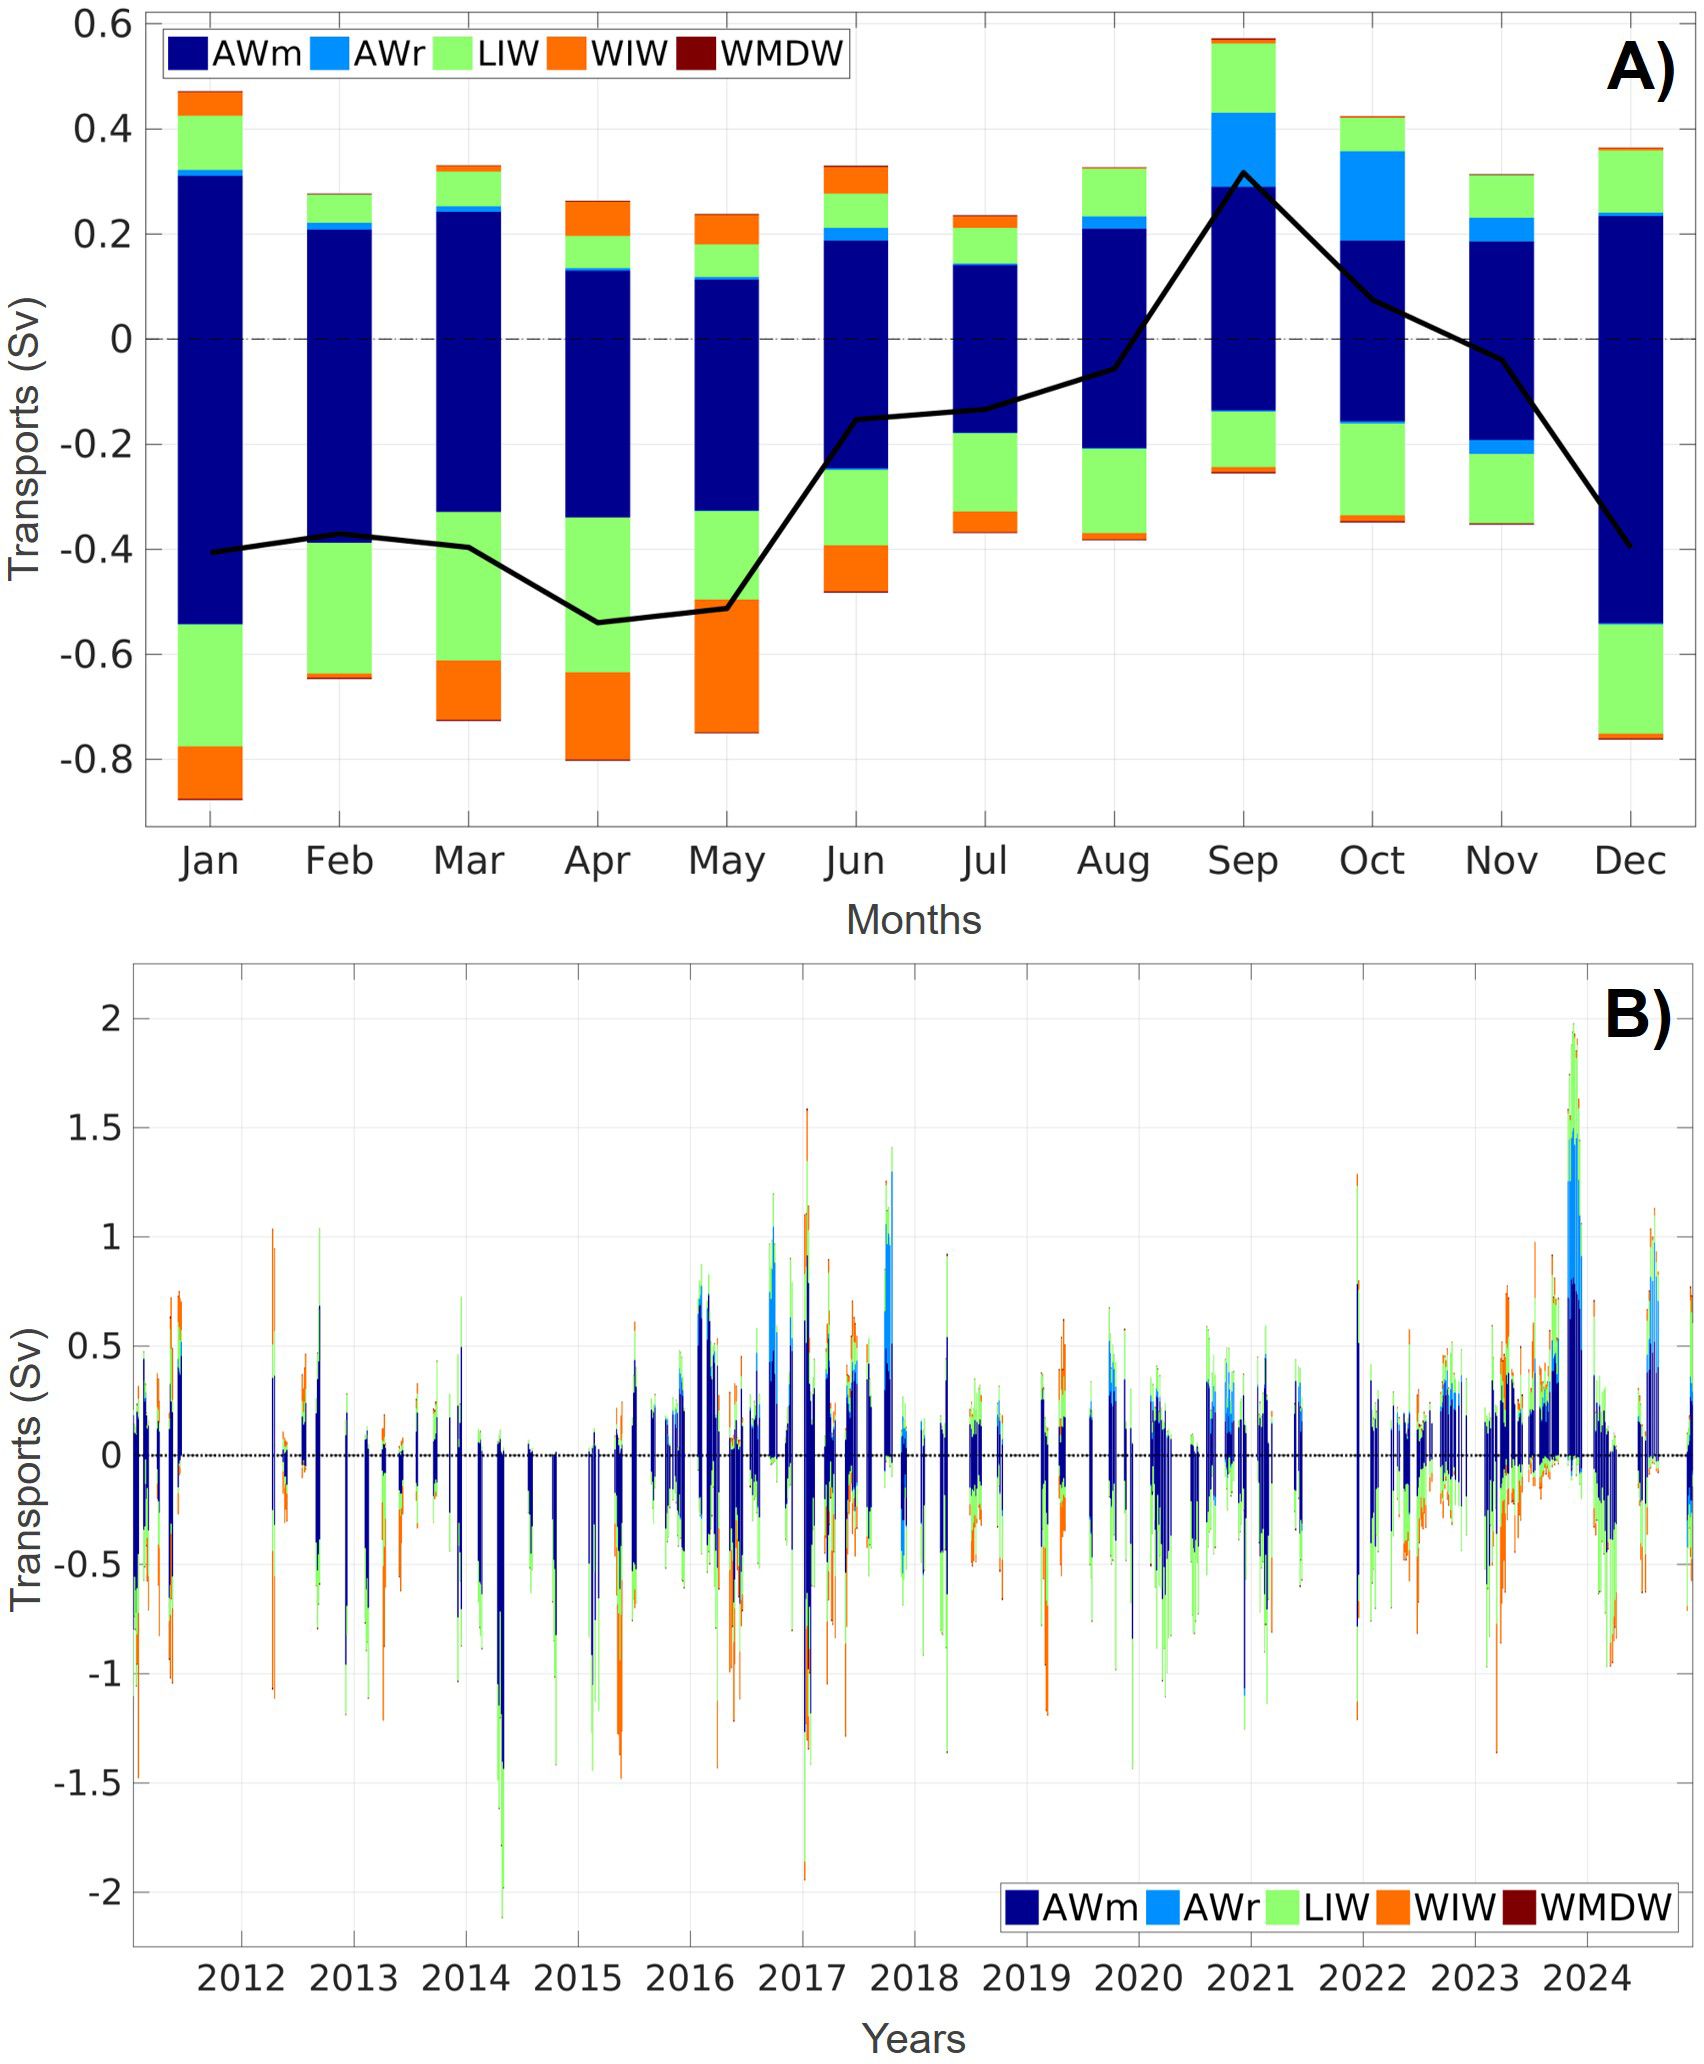
Figure 8. (A, B) Same as Figure 6 for water mass transports (in Sv). Colours are associated with water masses as identified in Section 3.2: AWm (dark blue), AWr (blue), WIW (orange), LIW (green) and WMDW (dark red).
5.3 High-frequency variability
Time series of water mass transports as observed from 2011 to 2024 show high-frequency variability in water mass presence and amount in the IC (Figure 8B) that can be explained by the regional circulation variability, mesoscale activity and events. The southward and northward flows are mainly composed of AWm which represents 49 and 55% of the total transports with mean values of -0.25+/-0.24 and 0.21+/-0.17 Sv, respectively (Table 2). The associated maxima of -1.44 and 0.92 Sv have been reached in April 2014 and January 2017, respectively. Important amounts of LIW are also found representing 36 and 23% of the southward and northward transports, respectively, with mean values of -0.18+/-0.13 and 0.09+/-0.09 Sv. High maxima in LIW transports are also reached with values of -0.72 Sv for southward flow and 0.49 Sv for northward flow. The variability of northward and southward flows is mainly driven by the AWm and LIW transports across the channel with high correlation coefficients with the total transport between 0.80 and 0.92 (Table 2). The presence of AWr and WIW and their north-south exchanges through the IC are smaller than those observed for AWm and LIW because of their intermittent nature. However, they represent non-negligible amounts. While 14% of the northward flow is composed of AWr with a mean value of 0.05+/-0.14 Sv and a maximum of 0.79 Sv, 14% of the southward flow comprised WIW with a mean value of -0.07+/-0.14 Sv and a maximum reaching 0.76 Sv. The observed WMDW represents less than 0.5% of the total flow in the IC for both northward and southward components.
Regional-scale events are observed through the presence, amount and transports of water masses in the IC such as strong inflows with important intrusion of AWr (e.g. in autumns 2016, 2017 and 2023, and summer 2024), strong outflows associated with strong NC bringing AWm and LIW from north to south (e.g. in winter-spring 2014 and winter 2017) or WIW formation through intermediate convection in the Balearic Sea and/or Gulf of Lion propagating in the IC during several winters and springs from 2011 to 2024 (Figures 8, 9). Most specific events are now addressed in the following section.
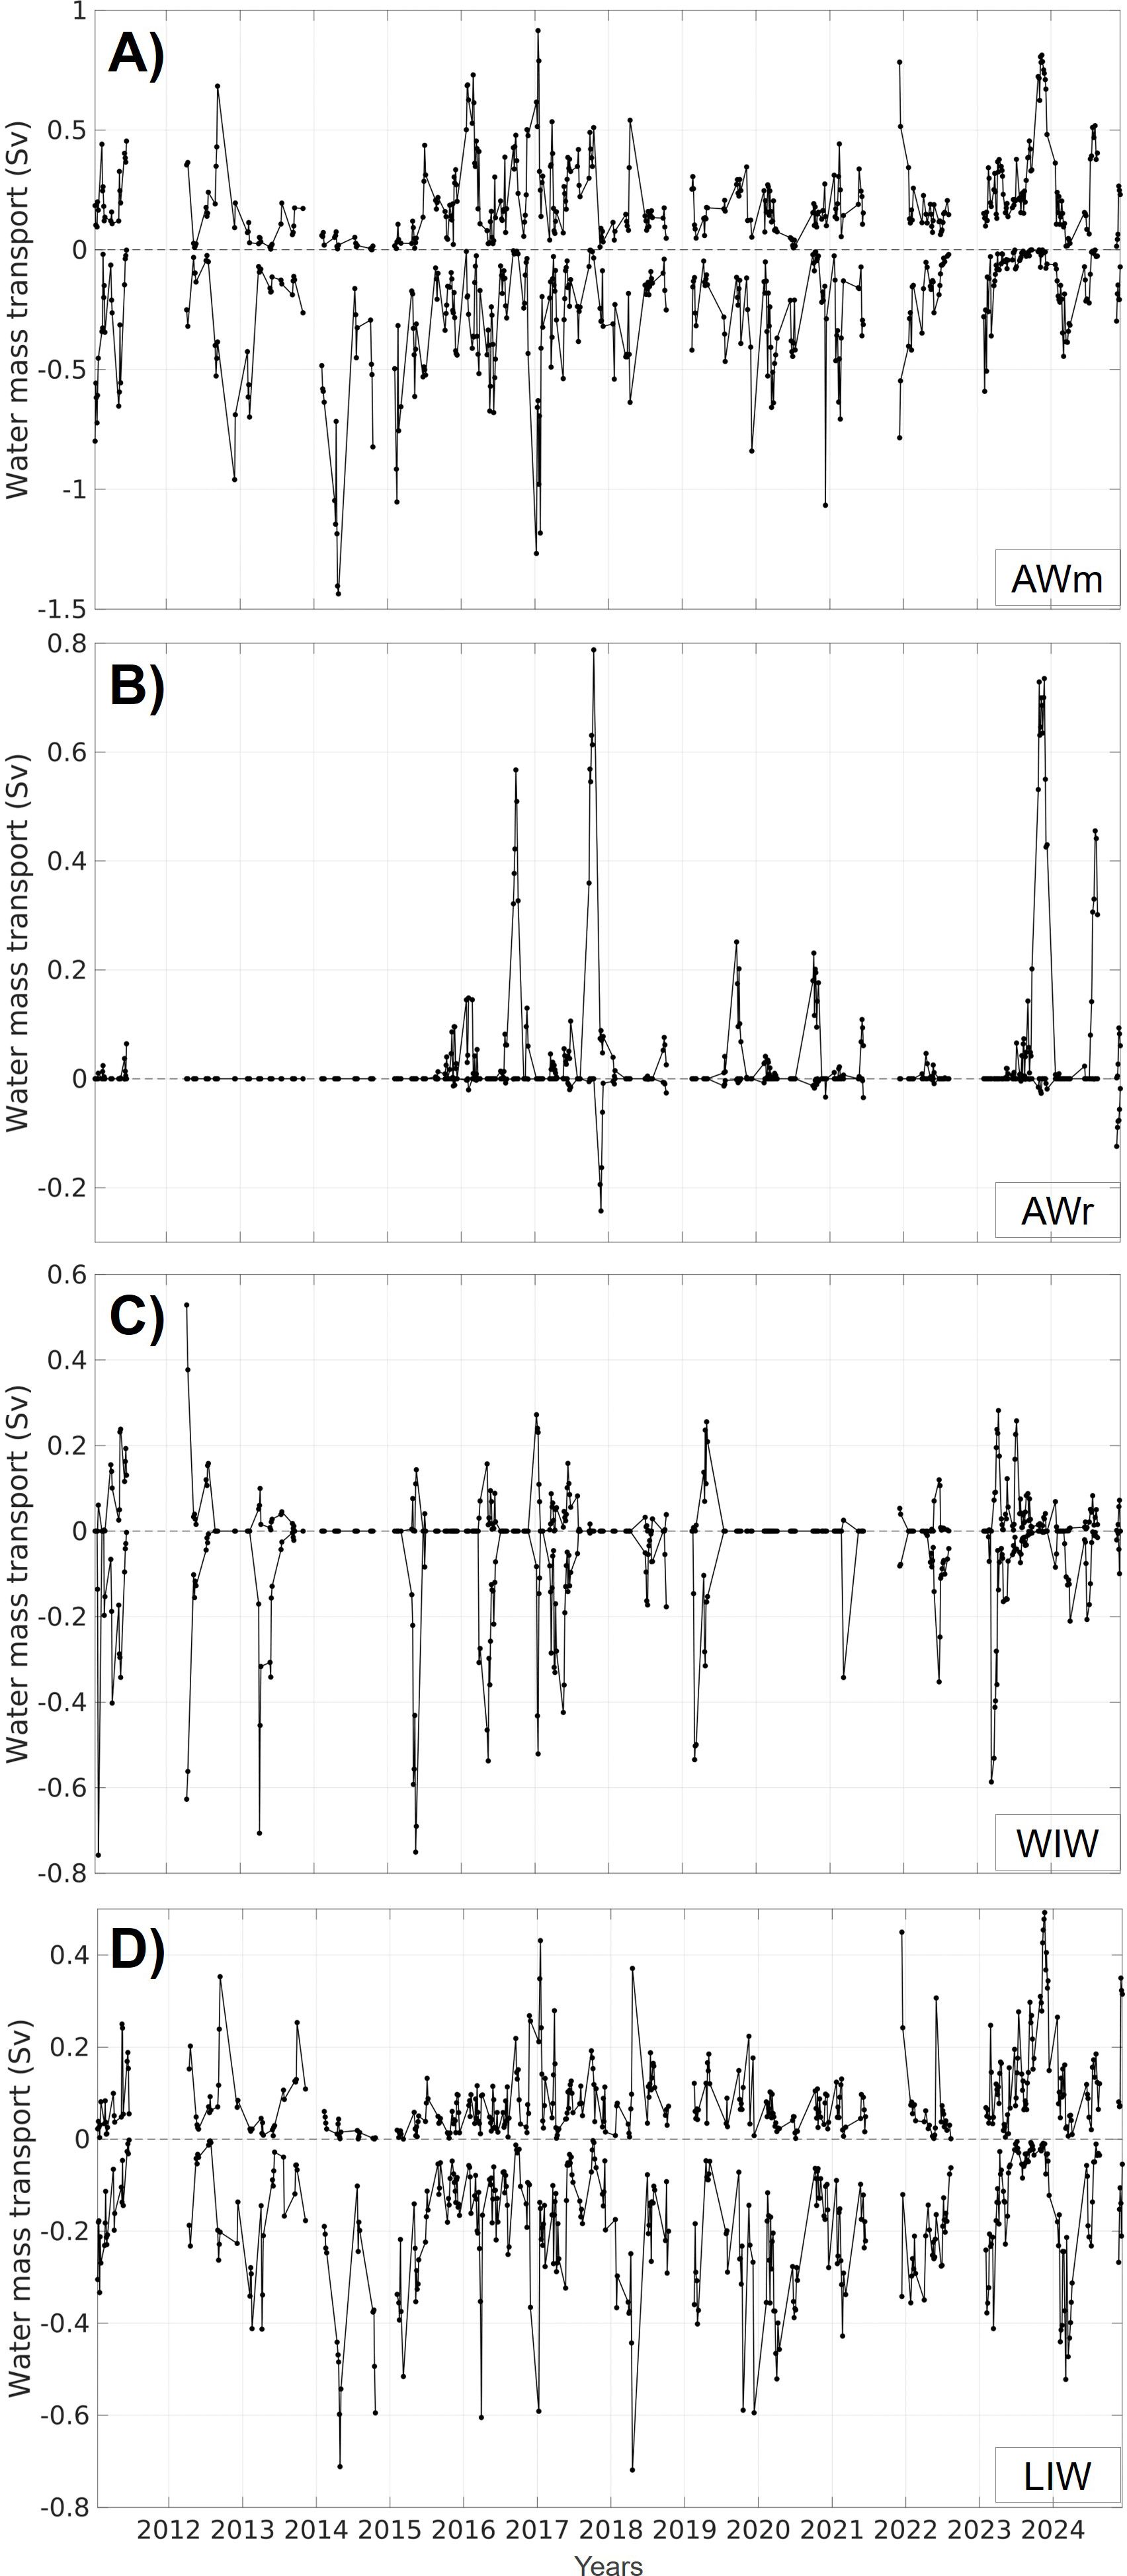
Figure 9. Water mass northward (positive) and southward (negative) transports for each glider transect in the IC from January 2011 to December 2024 for AWm (A), AWr (B), WIW (C) and LIW (D).
6 From short to long-term changes
6.1 Specific events
Short-term changes related to the sub-basin scale circulation, mesoscale activity and events, may explain the high-frequency variations of water mass transports across the IC. In this section, remarkable events are investigated during the period 2011–2024 to better understand the transport variability in the channel (Figures 8, 9).
6.1.1 AWr inflows
At the surface, strong inflows of AWr entering the Balearic Sea occurred some years in autumn time. In particular, northward AWr transports with values higher than 0.5 Sv and representing more than 30% of the total northward flow have been observed during the autumns 2016, 2017 and 2023. The anomalous inflow of AWr can be explained by the weakening of the NC making possible the entrance of this water mass from the Alboran Sea through the Balearic Channels (Pascual et al., 2002). Also, the presence of an anticyclonic eddy in the northern Balearic Sea may alter general cyclonic circulation of the sub-basin. Aguiar et al. (2019) stated that intense Mistral wind jets could be responsible for the coastal detachment of the NC which would favour the AWr coastal intrusion and would increase negative vorticity.
Over the period 2011-2024, gliders captured strong AWr inflows from 15 September to 09 October 2016 and from 25 September to 18 October 2017, with maxima of 0.57 Sv on 27 September 2016 and 0.79 Sv on 18 October 2017, respectively. During these two autumnal missions, the inflow of AWr represented 30 and 42% of the total northward flow and a large amount of the total net transport (49% in 2016 and 61% in 2017) leading to an unusual and strong positive net inflow. These two AWr inflow events coincided with the presence of an anticyclonic eddy north Mallorca (Aguiar et al., 2019, 2022, for the long-live eddy from September 2017 to February 2018) and an anticyclonic eddy south Ibiza (Figure 10). When the former eddy has a blocking effect on the southward NC, the latter one may benefit the northward flow to reach the IC. Such water mass changes in the IC significantly affect the heat, salt and nutrient distributions in the area. The advection of AWr into the study area is also visible in the θ/S diagrams in Figure 7. Moreover, the chlorophyll-a concentration, which is transported by this water mass, could be enhanced. Previous studies indicated that AWr can be nutrient-rich as they enter the Gibraltar strait and further enrich through upwelling events in the northern Alboran Sea (Sanchez-Garrido and Nadal, 2022). Signatures of elevated chlorophyll-a concentration can be detected occasionally in the Balearic Sea due to lateral advection of AWr into the Balearic Sea, as illustrated through chlorophyll-a concentration maps in Figure 10B, D.
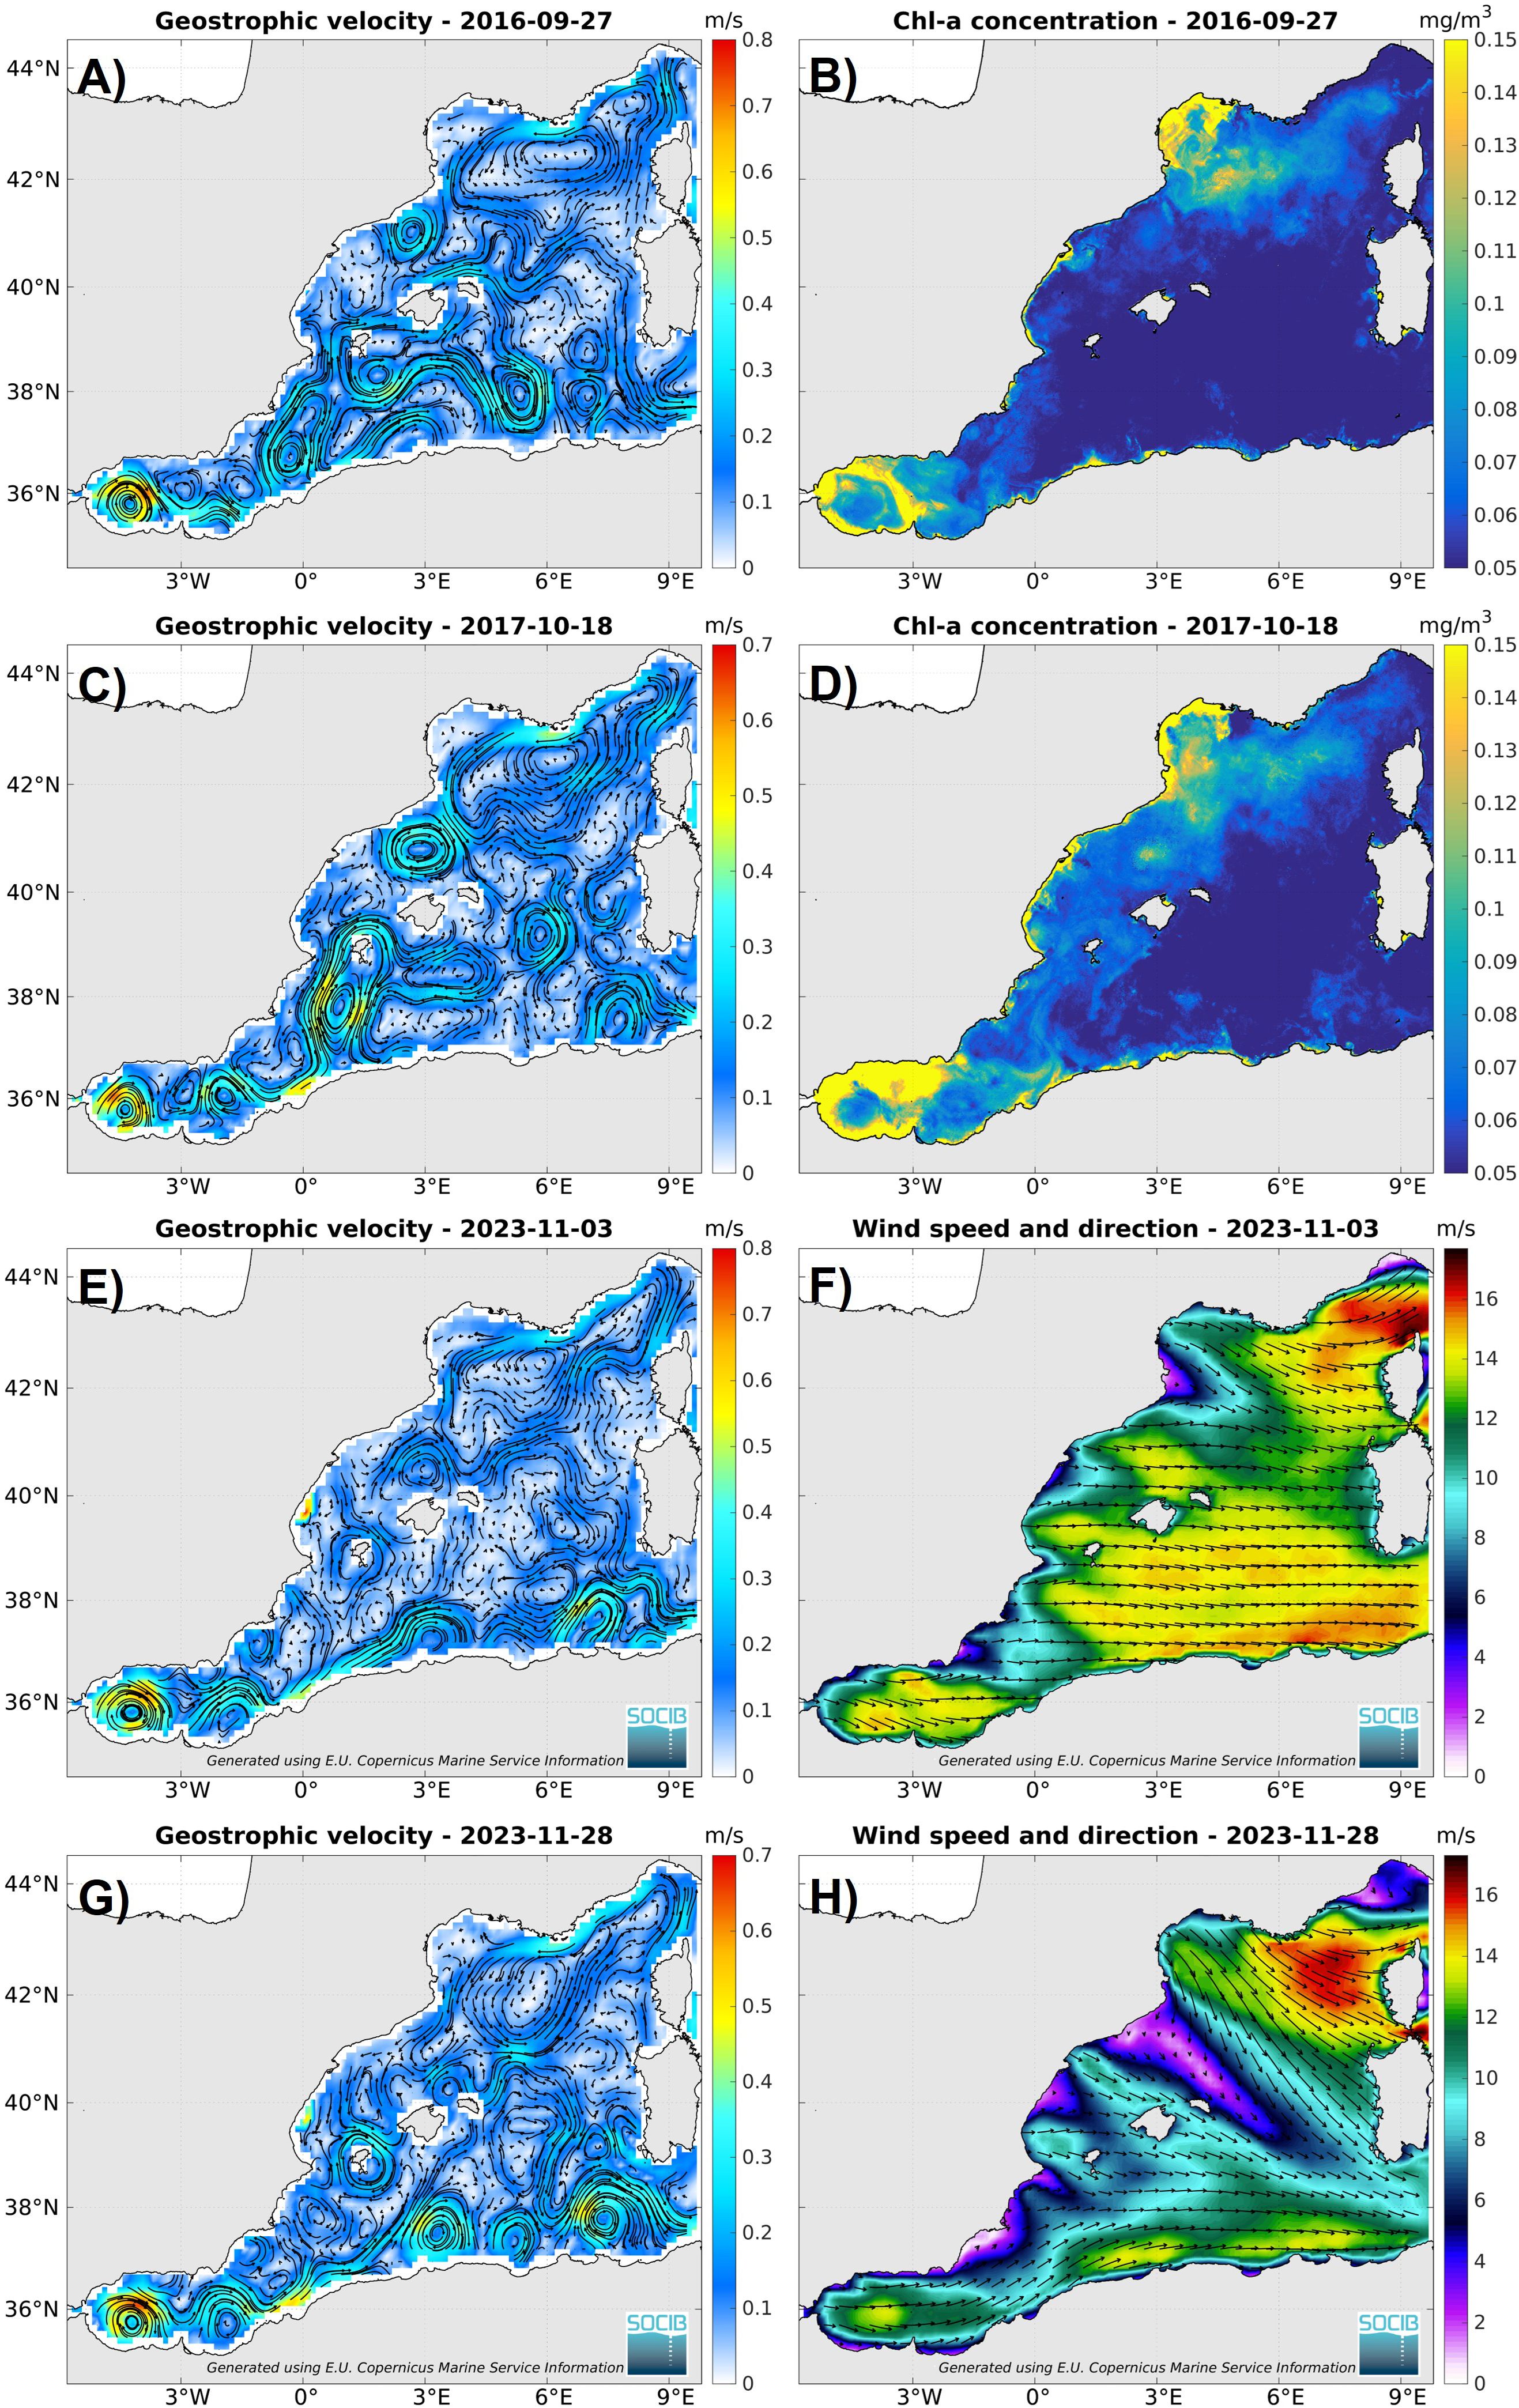
Figure 10. Maps of GV in the western Mediterranean Sea on 27 September 2016 (A), 18 October 2017 (C), 03 and 28 November 2023 (E, G). Associated maps of chlorophyll-a concentration for the two first dates (B, D) and of wind speed and direction for the two latter (F, H).
Also, very strong AWr inflows were captured by the glider from 29 October to 12 December 2023 with maxima observed by gliders of 0.73 and 0.74 Sv observed on 03 and 28 November 2023, corresponding to 38 and 39% of the total northward flow, respectively. This unusually long event in autumn 2023 coincided with a prolonged period of strong westerly winds from the Spanish coast (illustrated Figure 10F, H).
Finally, it is worth mentioning that the important volume of AWr never coincides with the strong amount of WIW nor of AWm and LIW (Figure 10) since it occurs when the southward flow is weak, and vice versa.
6.1.2 WIW propagation
WIW is formed in the Gulf of Lion and Balearic Sea through intermediate convection when heat losses in winter are important but not large enough to produce deep water (Juza et al., 2013). Then, it circulates southwards following five main pathways. Among them, WIW propagates southwards across the IC advected by the NC (Juza et al., 2013, 2019) as captured by gliders in most years from 2011 to 2024 (Figures 8, 9). Southward transports of WIW with values higher than 0.5 Sv were observed by gliders many years between 2011 and 2024. The most important events, which counted with the largest amount of observed southward WIW representing 35-51% of the total southward transport, occurred in January 2011, April 2012, April 2013, May 2015, May 2016, January 2017, March 2019 and March 2023 with maximum values of -0.76 Sv (29 January 2011, 51%), -0.63Sv (10 April 2012, 42%), -0.71 Sv (06 April 2013, 48%), -0.75 Sv (20 May 2015, 51%), -0.54 Sv (13 May 2016, 36%), -0.52 Sv (15 January 2017, 35%), -0.53 Sv (02 March 2019, 36%) and -0.59 Sv (11 March 2023, 40%), respectively. The event in May 2015 is in agreement with the observed intermediate convection commented by Juza et al. (2019) using glider data and by Chevillard et al. (2024) with Argo profiling floats. Juza et al. (2019) also showed using a regional numerical simulation over the period 2011–2017 that the large amount of WIW, which crossed the IC in 2011, 2013 and 2015, was recently formed in the Balearic Sea. In 2012, WIW was mainly formed along the continental shelf of the Gulf of Lion and northern Catalan coast, reaching the IC with approximately 1–2 month delay (in agreement with Margirier et al., 2020). In 2014, WIW was formed in the Ligurian Sea and did not reach the IC. Although WIW was not observed or did not cross the IC in 2014 and 2020, the 14-year time series of glider observations have shown the presence of WIW most years in the IC.
6.1.3 Strong Northern Current
The southward NC is mainly composed of AWm and LIW, as well as of WIW when formed. During the period 2011-2024, the gliders captured two strong events with total southward transport values higher than 1.5 Sv: from 18 April to 03 May 2014 with values ranging from -1.62 Sv to -2.12 Sv, the maximum being reached on 28 April 2014, and on 07 January 2017 with a section value of -1.95 Sv (Figure 8B). These transport values are associated with the intensified NC in the north-western Mediterranean advecting large amounts of both AWm and LIW across the IC (Figure 9A, D).
6.2 Trends
In this section, the linear trends of hydrographic properties (θ, S, ) are estimated for each water mass (Table 3) from the timeseries of the medians distributions per transect in the IC over the period 2011–2024 as displayed in Figure 11. The trends provide critical insight about the impact of climatic change on the western Mediterranean Sea and align with the regional and global ocean signals of increasing temperature and salinity. All water masses (AWm, AWr, WIW, LIW and WMDW) as observed by the gliders in the IC show warming and salinification trends from surface to deep layers, except for the AWr S, in agreement with previous studies using multi-platform observations and numerical simulation in the western Mediterranean or sub-regions of this sub-basin (Schroeder et al., 2017; von Schuckmann et al., 2020; Vargas-Yáñez et al., 2021; Fedele et al., 2022; Kubin et al., 2023; Chevillard et al., 2024; Skliris et al., 2024). The warming trends in the upper layer are related to the intensification of heat fluxes (Skliris et al., 2024) being a consequence of global warming and increased number of heatwaves events (Jézéquel et al., 2025), as also illustrated in Juza and Tintoré (2021) and Juza et al. (2022). The increase of the upper S induced by the increase of evaporation in the eastern Mediterranean (Skliris et al., 2024) explains the increasing S of LIW. The saltier LIW then propagates in the western Mediterranean and across the IC. Also, when LIW is convected to form WMDW, saltier intermediate water propagates into the deep ocean and contributes to the WMDW salinification. The warming and salinification trends in the intermediate and deep layers are also visually remarkable in the θ/S diagrams (Figure 7B, D, F, H).
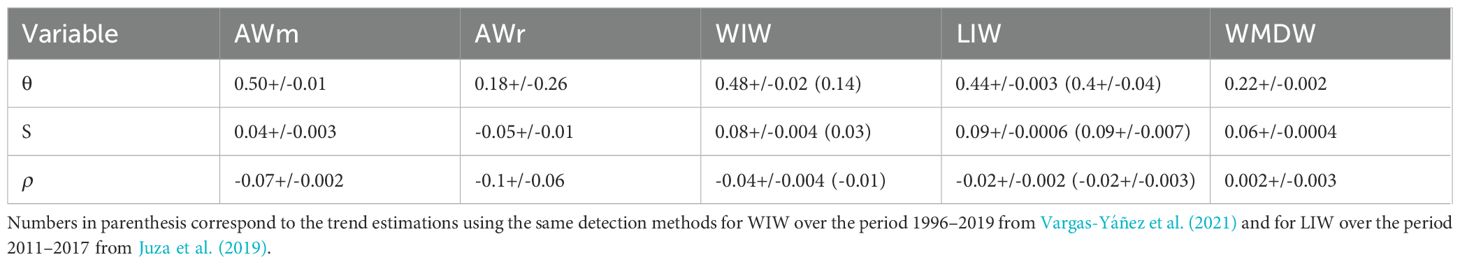
Table 3. Linear trends with associated confidence intervals at 95% for θ (in °C/decade), S (in psu/decade) and (in kg/m3/decade) for the different water masses (AWm, AWr, WIW, LIW and WMDW) over the period 2011–2024 in the IC.
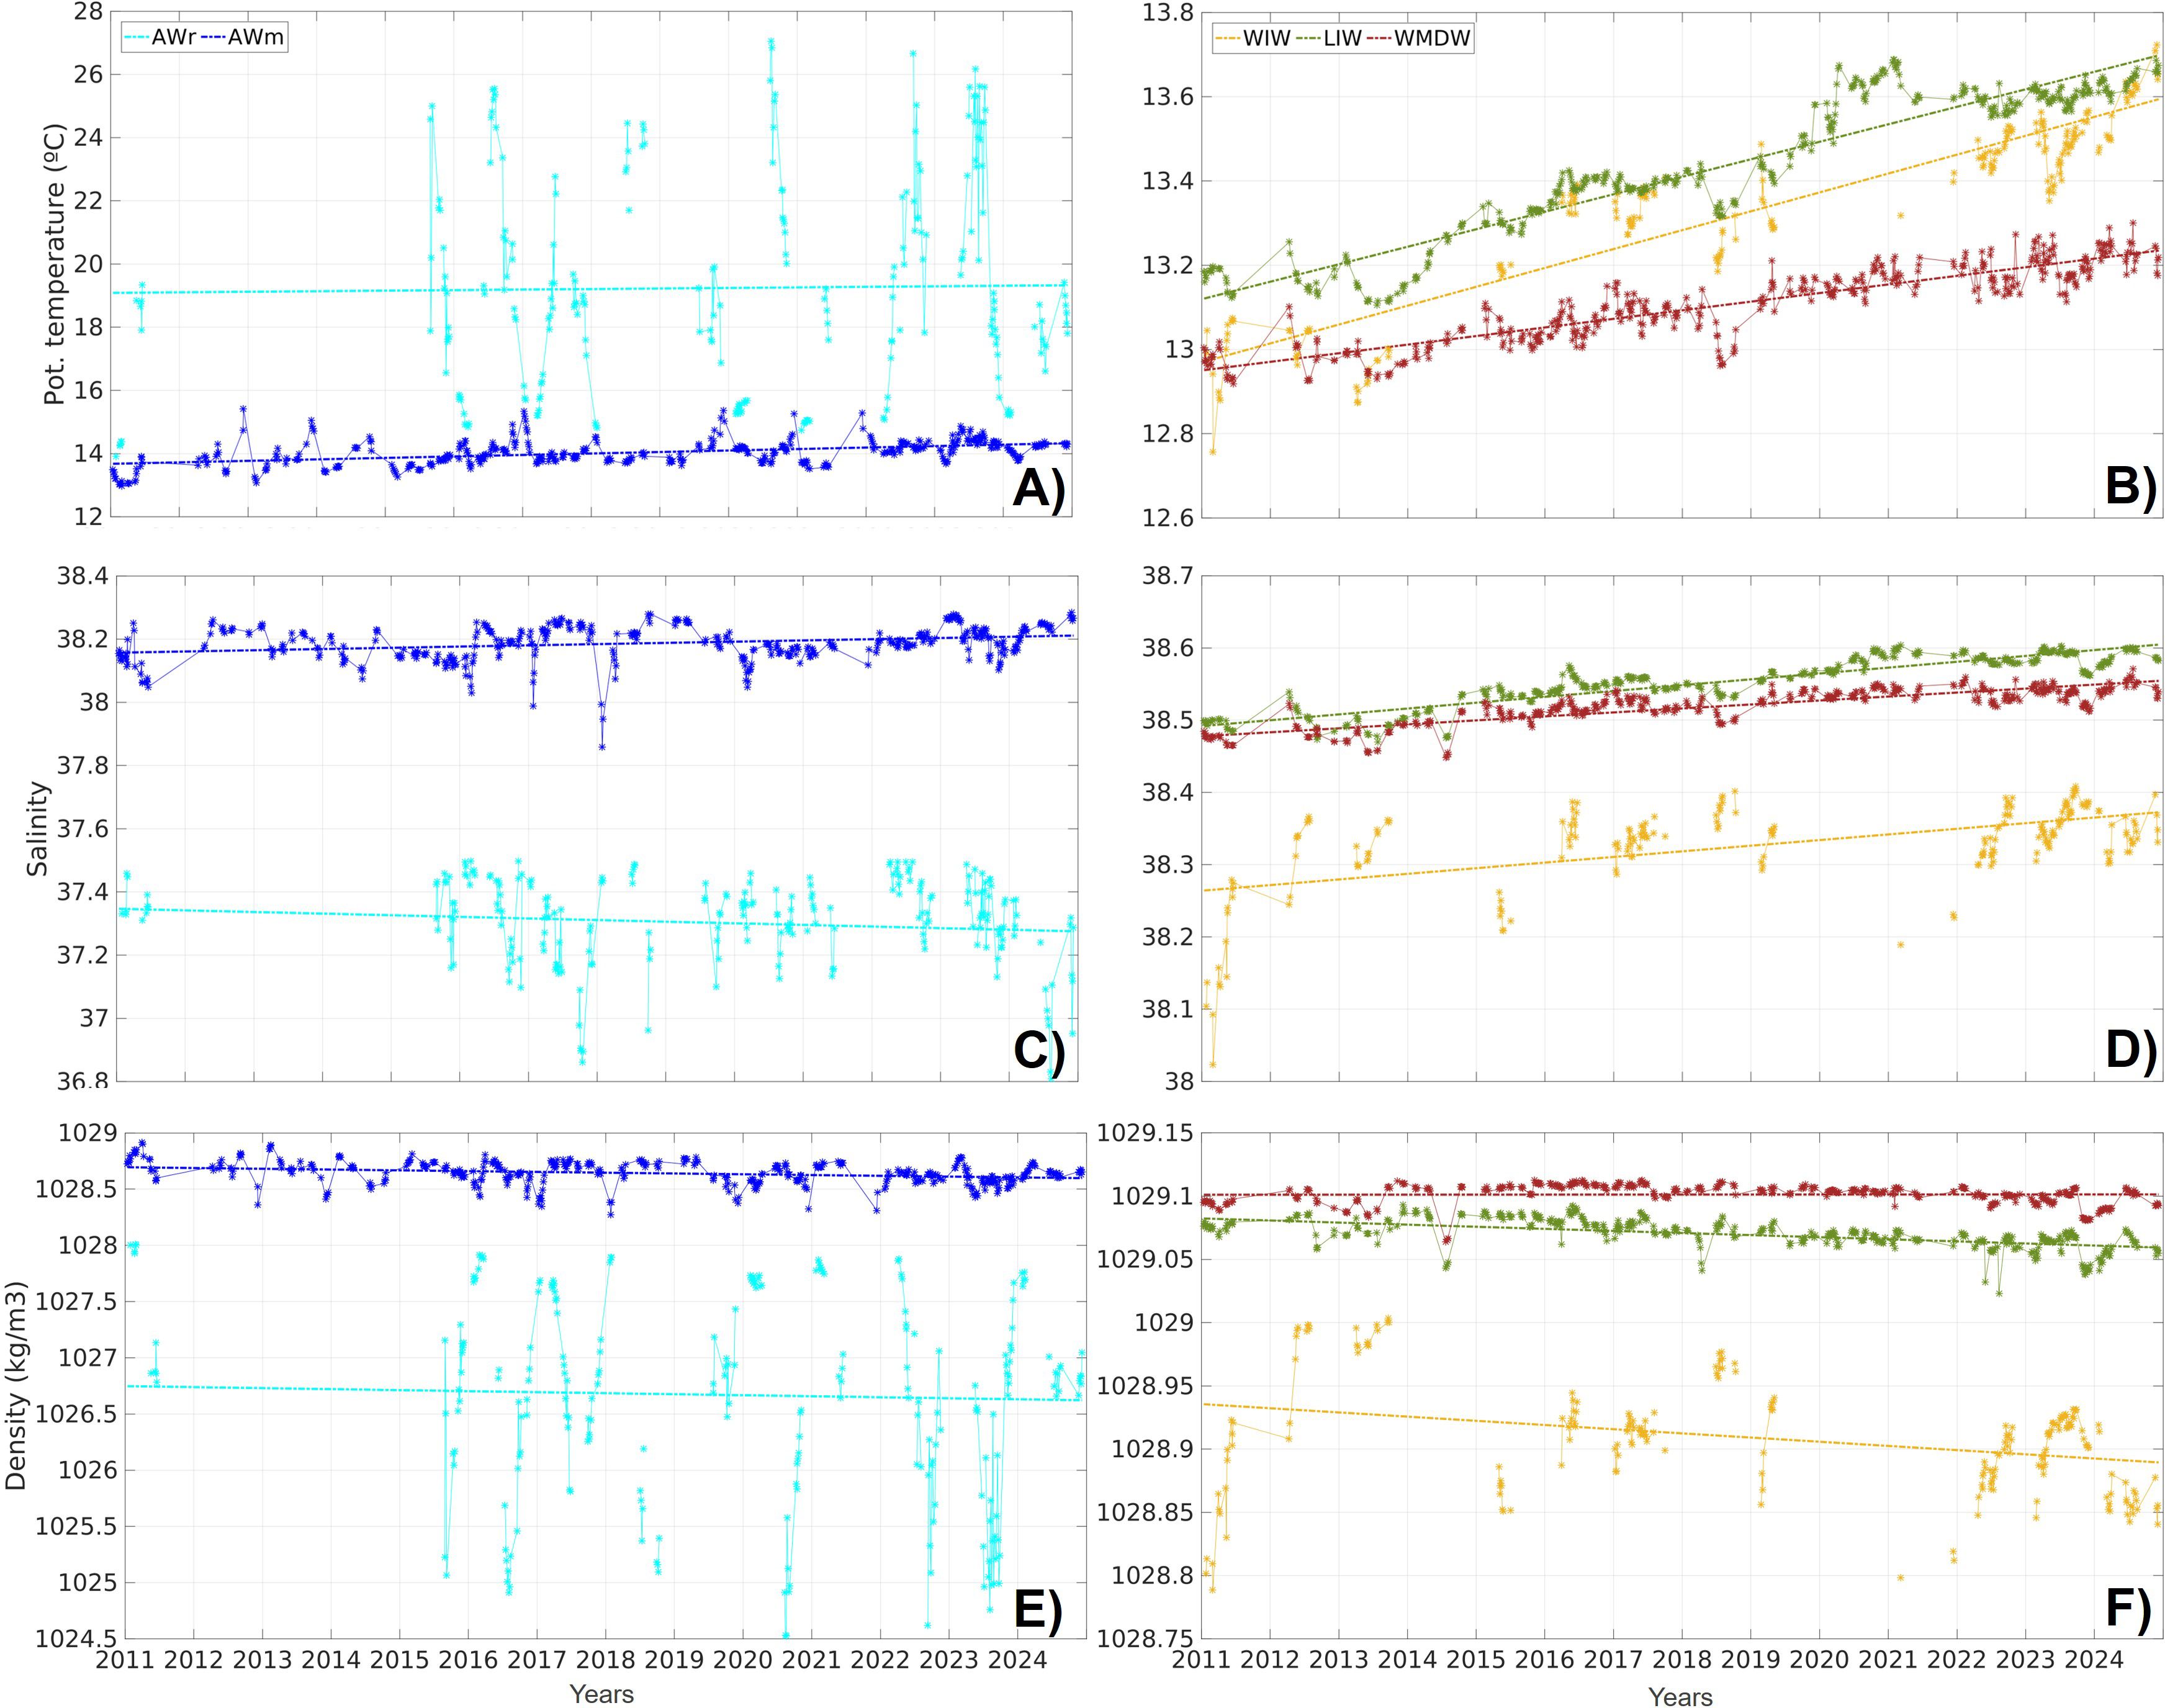
Figure 11. Medians of the (A, B), S (C, D) and (E, F) distributions for AWm (blue), AWr (cyan), WIW (yellow), LIW (green) and WMDW (red) at each glider transect in the IC (dots) and associated linear trends over the period 2011-2024 (lines).
More precisely, in the upper layer, the warming trend estimations from glider observations for AWm and AWr have values of 0.50+/-0.01 and 0.18+/-0.26 °C/decade, respectively. Although they are different from other published estimates due to the area delimitation, period and/or depth level considered, such results are in agreement with previous studies. Chevillard et al. (2024) estimated at 0.33+/-0.1 °C/decade the trend within the 10–150 m layer of the Balearic Sea over the period 2013–2022 using profiling floats. Also, the sea surface temperature trend, computed from satellite observations (as in Juza and Tintoré, 2021) over the period 2011-2024, has a value of 0.77+/-0.11 °C/decade in the IC area. Vargas-Yáñez et al. (2021) found within the 0–100 m layer of the IC a smaller trend estimation of 0.11 °C/decade over the period 1996–2019 that can be explained by the longer period used excluding recent years (Chevillard et al., 2024). The S trends for AWm and AWr observed by gliders are estimated with opposite signs at 0.04+/-0.003 and -0.08+/-0.004 psu/decade, respectively. S trends estimated over recent periods from Argo profiling floats in the upper 150 m layer were not found significant in Chevillard et al. (2024) over 2013–2022 and in Skliris et al. (2024) over 2004–2023 in the western Mediterranean Sea. The S trend for AWm from gliders has the same order of magnitude of the statistically significant trends in S within the upper layer observed over longer periods (Vargas-Yáñez et al., 2021, over 1996-2019; Skliris et al., 2024, over 1979-2023; Aydogdu et al., 2023, over 1993-2019).
In the intermediate layer, the θ trends for WIW and LIW as captured by the gliders in the IC have values of 0.48+/-0.02 and 0.44+/-0.003 °C/decade, respectively. Again, the results are in agreement with Chevillard et al. (2024) who estimated at 0.49+/-0.02 °C/decade the trend for θ integrated within the layer 150–700 m of the Balearic Sea. The difference may be explained by the different sub-regions considered as well as the WIW occupation layer that can be shallower than 150 m when recently formed. Indeed, such a water mass with θ minima is not included in the intermediate layer trend estimations. Also, the θ trend for WIW using the same detection method over the period 1996-2019 (Vargas-Yáñez et al., 2021) has been estimated at 0.14 °C/decade in the IC. This difference could be explained by the seasonal sampling that may not capture the presence of WIW as well as the different periods used given the accelerated warming in recent years. This latter argument also explains why the θ trend for LIW estimated using the same data and method was smaller over 2011-2017 (0.4+/-0.04 °C/decade, Juza et al., 2019) than over 2011-2024 (0.44+/-0.003 °C/decade, in this study). Concerning the S trends for WIW and LIW, the values estimated from glider data are 0.08+/-0.004 and 0.09+/-0.0006 psu/decade, respectively. Compared to previous studies, LIW estimations are similar from those estimated from Chevillard et al. (2024) in the Balearic Sea (0.11+/-0.004 psu/decade within the 150–700 m layer over 2013-2022) and from Juza et al. (2019) for LIW in the IC (0.09+/-0.007 psu/decade over 2011-2017). For WIW, as for the θ trend, the S trend is higher than the one estimated by Vargas-Yáñez et al. (2021) with a value of 0.03 psu/decade.
In the deep layer, the θ and S trends for WMDW observed by the gliders in the IC over the period 2011–2024 are estimated at 0.22+/-0.002 °C/decade and 0.06+/-0.0004 psu/decade, respectively. These values are aligned again with the trend values of 0.19+/-0.01 °C/decade and 0.05+/-0.003 psu/decade, respectively, from Chevillard et al. (2024) in the deep layer 700–1500 m of the Balearic Sea.
In the IC, as observed by the gliders over the last decade, the warming rates are higher for WIW and LIW than for AWm, in agreement with previous studies in the western Mediterranean (Chevillard et al., 2024; Schroeder et al., 2016). WMDW has the lowest warming trend. Regarding the salinification rates, they are higher for WIW and LIW than for AWm and WMDW, while AWr has a decreasing S trend. Changes in θ and S modify the water mass density. In the upper and intermediate layers, the trends for AWm, AWr, WIW and LIW are negative with values of -0.07+/-0.002, -0.1+/-0.06, -0.04+/-0.004 and -0.02+/-0.002 °C/decade, respectively. This means that the S increase does not compensate for the θ increase as also shown by Juza et al. (2022) during marine heatwave events in the western Mediterranean, leading to an enhancement in the stratification and reduction of the vertical mixing that could potentially limit the nutrient availability and affect marine ecosystems. Also, the decreasing trends being higher for AWm and AWr than for WIW and LIW would increase the decoupling between the upper and intermediate layers.
7 Discussion and conclusions
7.1 Glider observing capability
Through the exploration and analysis of 14-year glider observations in the Ibiza Channel (IC), this study demonstrates the importance of a high-resolution, semi-continuous and sustainable monitoring from daily and weekly to decadal scales at this key choke point of the western Mediterranean Sea. The multi-scale variability in the IC is related to ocean processes from both the southern and northern adjacent sub-basins (e.g. AWr inflows, convection events, blocking or favourable eddies). Such a glider endurance line allows addressing three-dimensional dynamics from mesoscale to large scale and its environmental, societal and economic implications.
In this study, monthly and seasonal climatologies built over the period 2011–2022 show that the seasonal variability of hydrographic properties and derived geostrophic transports in the IC have been well captured by the glider observations when compared to previous studies based on different observational platforms (e.g. satellites, R/V campaigns and profiling floats). The high-resolution glider observations resolve spatial and temporal scales that other platforms are unable to resolve by capturing the pathways of intermediate water masses such as WIW and LIW in the western Mediterranean Sea. Glider observations are also able to resolve the sub-seasonal scale and the multi-scale variability of water mass properties and geostrophic transports in the IC from daily and weekly to seasonal and interannual scales. Typical water masses of the western Mediterranean Sea are observed, including the intermittent ones such as the northward AWr or those recently formed through convection events in the Balearic Sea and Gulf of Lion (WIW and WMDW) and propagating southwards. Timeseries of geostrophic transports from 2011 to 2024 highlight the high variability of the ocean circulation and water mass amounts in the channel which has not been observed previously over such a long period. In addition, linear trends have been also computed over the period 2011–2024 to estimate changes in water mass properties over the last decade. In agreement with previous studies in the western Mediterranean, the warming and salinification increases have been captured for all water masses (AWm, AWr, WIW, LIW and WMDW) except for AWr showing a decreasing S trend. Trends estimated over 2011–2024 from gliders in the IC show similar values than the trends estimated over 2013–2022 from Argo profiling floats in the Balearic Sea where warming and salinification of the intermediate and deep waters are ones of the highest regional trends over the whole Mediterranean (Chevillard et al., 2024). It is worth mentioning that, in the deep layers, the S trends have to be taken with caution since the SeaBird CTD has an accuracy of 0.003 psu in S with a potential drift of 0.003 psu/year (Allen et al., 2020). Finally, this study also supports the needs of monitoring sub-seasonal ocean processes which account for interannual variability (Houpert et al., 2016; Chevillard et al., 2024). Hence, glider observations contribute to better understanding the impact of climatic change at key choke points of the western Mediterranean and worldwide.
7.2 Methodology’s sensitivity
The impact of glider sampling and data processing on geostrophic transport estimations have been investigated through sensitivity tests and intercomparison analysis. Results are presented in this section.
7.2.1 Surface layer
When extrapolating the 0–10 m layer, the net transport estimations have the same order of magnitude for the total and water mass flows. The total northward and southward transports are increased by 9 and 2%, respectively, leading to a decrease of the southward net flow by 19% (Table 2). More precisely, the consideration of the 0–10 m layer increases the water mass transports in particular for the northward AWm and AWr by 9 and 29%, respectively, as well as for the southward AWm by 7%.
7.2.2 Smoothing parameter
In this study, the filter length scale applied to the data was fixed at 24 km, while the previous studies in the western Mediterranean used 6 km (Heslop et al., 2012, 2017). Such changes lead to significant diminution of transports, in particular, a decrease by 28 and 18% of northward and southward transports, respectively, associated with the decrease of AW (not shown). Gliders go down and up from surface to 950m and back in 3 hours capturing a possible shift in ocean features such as structures smaller than 3 hours. Applying a larger smoothing window enables to reduce the smearing and aliasing of internal waves or other non-geostrophic processes that may be partially captured by gliders given their sampling (Rudnick and Cole, 2011). In the IC, during some transects and missions, small structures in the geostrophic velocity fields were detected in the upper layer until 30 m depth (not shown) with a seasonal occurrence. In particular, well-marked structures with opposite geostrophic velocities were detected during summer months in the thermocline, when the ocean is more stratified. Such structures were removed by increasing the smoothing filter from 6 to 24 km. This limitation is not considered a serious problem as the dynamics leading to geostrophic balance are more appropriate only at these longer scales.
7.2.3 WIW detection method
The criterion used for the WIW identification has a significant impact on the amount of detected WIW (Juza et al., 2019) and water mass transport results (not shown). The geometry-based method allows detecting more volume of WIW than the conventional fixed-range method based on θ colder than 13°C and S fresher than 38.3 (López-Jurado et al., 1995; Vargas-Yáñez et al., 2012). This additional amount of WIW is compensated by the diminution of the AWm and LIW volumes. The AWr and WMDW identifications are not affected by the method. In the IC, the changes are particularly important. More amounts of WIW were detected in winter-spring 2011, winters 2012 and 2013, and new WIW has been detected since 2015. This newly detected WIW was not captured with the fixed-range method, due to the increase of temperature and salinity of waters in the intermediate layer which are out of classical ranges (Juza et al., 2019; Vargas-Yáñez et al., 2020). The mean southward WIW over the period 2011–2024 would be erroneous and sub-estimated, reducing from -0.07+/-0.14 Sv with the geometry criteria to -0.01+/-0.06 Sv with the fixed-range method. The missing amount of WIW would be detected as AWm or LIW, increasing their mean southward flow from -0.25+/-0.24 to -0.30+/-0.28 Sv or -0.18+/-0.13 to -0.20+/-0.13 Sv, respectively. More precisely, the additional amount of WIW detected with the geometry-based method corresponds to less (mainly southward) AWm in winter-spring 2011, winter 2012, late-winters and springs 2015-2016-2017-2019-2023, and less (mainly southward) LIW particularly in springs 2017 and 2022, and winters 2019 and 2023.
7.3 Perspectives
The geometry of glider sampling allows quantifying properties of water masses moving through the IC from 10 to 950 m depth. Through this study, a methodology has been adapted, operationally implemented and provided in open access to scientifically explore glider observations. Glider sampling, data processing impacts and depth-average currents have also been discussed. In the future, ocean circulation model-based experiments could be performed to quantify uncertainties on transport calculations through model-glider comparisons and between full-sampled and sub-sampled (like gliders) models.
The observed high variability suggests that high-resolution monitoring is essential and the glider observing system should be combined with very high-resolution data from along-track satellite data or high-frequency radar in order to have a complete and improved picture of the IC circulation at the surface. Gliders are also able to capture mesoscale and sub-mesoscale features (e.g. fronts, meanders, eddies and filaments) which play a significant role in redistributing properties such as heat, freshwater and biochemical tracers (e.g. carbon, dissolved oxygen and nutrients) through horizontal motions and vertical exchanges, significantly impacting the ocean’s primary productivity (McGillicuddy et al., 2007; Lévy et al., 2012; Mahadevan, 2014). Gliders primarily have been focused on physical parameters. In the last years, biogeochemical sensors have been integrated, expanding glider measurements to several biogeochemical essential ocean variables. In particular, the SOCIB gliders have also collected data of chlorophyll-a concentration, oxygen concentration and saturation, and turbidity. Combining physical and biogeochemical data would allow addressing the possible impacts of ocean dynamics and stratification changes on marine ecosystems with socio-economic implications (e.g. fishery). Finally, although the Mallorca Channel (MC) has been less targeted than the IC during the “Canales” program, geostrophic transports in the MC are also part of the operational ocean indicators monitoring (Juza and Tintoré, 2020, 2021) and their analysis over the 14-year repeated glider missions could be extended to this channel to better assess the water mass exchanges between the northern and southern parts of the western Mediterranean through the Balearic Channels.
Facilitated by open science principles, the SOCIB glider endurance line observations are very valuable data for operational oceanography supporting the management of the ocean. They provide historical and near real-time data which can be used for giving insight for operations, for implementing key indicators in the area, as well as for satellite calibration (Barceló-Llull et al., 2019) and regional model validation and assimilation (Dobricic et al., 2010; Jones et al., 2012) in order to contribute to model and prediction improvements. Recently, Aydogdu et al. (2025) have demonstrated the value of repeated glider observations collected along endurance lines for regional ocean prediction through data assimilation in the western Mediterranean Sea. In particular, these authors have shown the improvement of simulated state estimates, representation of mesoscale structures, transports and estimates of chlorophyll-a concentration distribution in the upper layer. Semi-permanent glider sections are becoming available in different coastal to ocean areas (e.g. Boundary Ocean Observing Network). Glider data processing and visualisation tools (https://apps.socib.es/subregmed-indicators/, Juza and Tintoré, 2020; https://apps.socib.es/gliders-ibiza-channel/, Juza et al., 2025c) will facilitate understanding the circulation in key coastal ocean areas and its relation to water masses driving these changes that are essential to understand the role of the ocean in climate change (Juza and Tintoré, 2021; Juza et al., 2022).
Finally, the support of sustainable monitoring programs between open and coastal areas is crucial to better understand the impact of climate change on the ocean and of (sub)mesoscale processes on marine ecosystems, as well as to evaluate the environmental impact of human activities in the ocean. Ocean observational platforms like gliders contribute to the Global Ocean Observing System and to the development of regional Digital Twins of the Ocean, particularly in coastal areas, providing necessary data with lower costs and new capabilities.
Data availability statement
The datasets used in this study can be found in online repositories. The names of the repository/repositories and accession number(s) can be found in the article/Supplementary Material.
Author contributions
MJ: Conceptualization, Data curation, Formal analysis, Investigation, Methodology, Software, Visualization, Writing – original draft, Writing – review & editing. EH: Conceptualization, Formal analysis, Investigation, Methodology, Writing – review & editing. NZ: Formal analysis, Investigation, Writing – review & editing. JT: Conceptualization, Formal analysis, Funding acquisition, Investigation, Writing – review & editing.
Funding
The author(s) declare financial support was received for the research and/or publication of this article. Part of this work was supported by the JERICO-S3 and BlueCloud26 projects. These projects have received funding from the European Union’s Horizon 2020 research and innovation programme under grant agreement No 871153 and 101094227, respectively.
Acknowledgments
We gratefully acknowledge the two reviewers for their careful reading and very relevant comments that helped us to improve the manuscript. We also acknowledge the SOCIB team involved over the last 14 years. The success of the glider operations is mainly due to the dedication and commitment of the Glider Facility group. Special thanks go to Marc Torner Tomas, Albert Miralles and Manuel Rubio, among others, for their technical support during the glider operations. The authors are also grateful to Miguel Charcos. The research data are available in open access through the SOCIB portal2. The transport estimations and the derived monthly climatology generated in this study are also freely accessible (Juza et al., 2025a, 2025b). In addition, the source codes are open through the access to the glider transport toolbox (https://github.com/socib/glider-transport-toolbox, https://doi.org/10.25704/RBZS-V023), as well as the code for geometry-based detection of WIW (Supplementary Material B in Juza et al., 2019). Finally, all graphical information generated for this study is accessible through SOCIB applications (https://apps.socib.es/gliders-ibiza-channel, Juza et al., 2025c https://apps.socib.es/subregmed-indicators/transports.htm, Juza and Tintoré, 2020).
Conflict of interest
The authors declare that the research was conducted in the absence of any commercial or financial relationships that could be construed as a potential conflict of interest.
Generative AI statement
The author(s) declare that no Generative AI was used in the creation of this manuscript.
Any alternative text (alt text) provided alongside figures in this article has been generated by Frontiers with the support of artificial intelligence and reasonable efforts have been made to ensure accuracy, including review by the authors wherever possible. If you identify any issues, please contact us.
Publisher’s note
All claims expressed in this article are solely those of the authors and do not necessarily represent those of their affiliated organizations, or those of the publisher, the editors and the reviewers. Any product that may be evaluated in this article, or claim that may be made by its manufacturer, is not guaranteed or endorsed by the publisher.
Supplementary material
The Supplementary Material for this article can be found online at: https://www.frontiersin.org/articles/10.3389/fmars.2025.1604087/full#supplementary-material
Abbreviations
AW, Atlantic Water; AWm, Modified Atlantic Water; AWr, Recent Atlantic Water; CTD, Conductivity Temperature Depth; GV, Geostrophic Velocity; IC, Ibiza Channel; LIW, Levantine Intermediate Water; MC, Mallorca Channel; NC, Northern Current; R/V, Research Vessel; S, Salinity; SOCIB, Balearic Islands Coastal Observing and Forecasting System; θ, Potential temperature; ρ, Potential density; WIW, Western Intermediate Water; WMDW, Western Mediterranean Deep Water.
Footnotes
References
Aguiar E., Juza M., Mourre B., Pascual A., Mason E., Alvera Azcarate A., et al. (2019). Anticyclonic Eddy anomaly: impact on the boundary current and circulation in the western Mediterranean Sea. J. Operat. Oceanogr. 12, S1–S123. doi: 10.1080/1755876X.2019.1633075
Aguiar E., Mourre B., Alvera-Azcárate A., Pascual A., Mason E., and Tintoré J. (2022). Strong long-lived anticyclonic mesoscale eddies in the balearic sea: formation, intensification, and thermal impact. J. Geophys. Res.: Oceans 127. doi: 10.1029/2021JC017589
Alemany F., Quintanilla L., Velez-Belchi P., Garcia A., Cortés D., and Rodriguez (2010). Characterization of the spawning habitat of Atlantic bluefin tuna and related species in the Balearic Sea (western Mediterranean). Prog. Oceanogr. 86, 21–38. doi: 10.1016/j.pocean.2010.04.014
Allen J. T., Munoz C., Gardiner J., Reeve K. A., Alou-Font E., and Zarokanellos N. (2020). Near-automatic routine field calibration/correction of glider salinity data using whitespace maximization image analysis of theta/S data. Front. Mar. Sci. 7. doi: 10.3389/fmars.2020.00398
Álvarez-Berastegui D., Hidalgo M., Tugores M. P., Reglero P., Aparicio-González A., Ciannelli L., et al. (2016). Pelagic seascape ecology for operational fisheries oceanography: modelling and predicting spawning distribution of Atlantic bluefin tuna in Western Mediterranean. ICES J. Mar. Sci. 73, 1851–1862. doi: 10.1093/icesjms/fsw041
Astraldi M., Balopoulos S., Candela J., Font J., Gacic M., Gasparini G. P., et al. (1999). The role of straits and channels in understanding the characteristics of Mediterranean circulation. Prog. Oceanogr. 44, 65–108. doi: 10.1016/S0079-6611(99)00021-X
Aulicino G., Cesarano C., Zerrouki M., Ruiz S., Budillon G., and Cotroneo Y. (2021). On the use of ABACUS high resolution glider observations for the assessment of phytoplankton ocean biomass from CMEMS model products. Ecol. Model. 455, 109619. doi: 10.1016/j.ecolmodel.2021.109619
Aydogdu A., Escudier R., Hernández-Lasheras J., Amadio C., Pistoia J., Zarokanellos N., et al. (2025). Glider observations in the Western Mediterranean Sea: their assimilation and impact assessment using four analysis and forecasting systems. Front. Mar. Sci. 12. doi: 10.3389/fmars.2025.1456463
Aydogdu A., Miraglio P., Escudier R., Clementi E., and Masina S.. (2023). The dynamical role of upper layer salinity in the Mediterranean Sea. State of the Planet 1, 1–9.
Ayoub N. K., Chidichimo M. P., Dever E., Guo X., Kim S. Y., Krug M., et al. (2024). Observing ocean boundary currents: Lessons learned from six regions with mature observational and modeling systems. Oceanogr 37, 82–91. doi: 10.5670/oceanog.2024.504
Barceló-Llull B., Pascual A., Ruiz S., Escudier R., Torner M., and Tintoré J. (2019). Temporal and spatial hydrodynamic variability in the Mallorca channel (western Mediterranean Sea) from 8 years of underwater glider data. J. Geophys. Res. 124, 2769–2786. doi: 10.1029/2018JC014636
Barral Q. B., Zakardjian B., Dumas F., Garreau P., Testor P., and Beuvier J. (2021). Characterization of fronts in the Western Mediterranean with a special focus on the North Balearic Front. Prog. Oceanogr. 197, 102636. doi: 10.1016/j.pocean.2021.102636
Beuvier J., Beranger K., Lebeaupin Brossier C., Somot S., Sevault F., Drillet Y., et al. (2012). Spreading of the western Mediterranean deep water after winter 2005: Time scales and deep cyclone transport. J. Geophys. Res. 117, C07022. doi: 10.1029/2011JC007679
Birol F., Cancet M., and Estournel C. (2010). Aspects of the seasonal variability of the Northern Current (NW Mediterranean Sea) observed by altimetry. J. Mar. Sys. 81, 297–311. doi: 10.1016/j.jmarsys.2010.01.005
Bosse A., Testor P., Damien P., Estournel C., Marsaleix P., Mortier L., et al. (2021). Wind-forced submesoscale symmetric instability around deep convection in the northwestern mediterranean sea. Fluids 6, 123. doi: 10.3390/fluids6030123
Bosse A., Testor P., Mortier L., Prieur L., Taillandier V., d’Ortenzio F., et al. (2015). Spreading of Levantine Intermediate Waters by submesoscale coherent vortices in the northwestern M editerranean S ea as observed with gliders. J. Geophys. Res.: Oceans 120, 1599–1622. doi: 10.1002/2014JC010263
Cardona L., Amigó N., Ouled-Cheikh J., Gazo M., and Chicote C. A. (2025). Cetaceans and sea turtles in the northern region of the Mediterranean Cetacean Migration Corridor: abundance and multi-model habitat suitability analysis. Front. Mar. Sci. 12. doi: 10.3389/fmars.2025.1496039
Chelton D. B. (1983). Effects of sampling errors in statistical estimation. Deep Sea Res. Part A. Oceanogr. Res. Pap. 30, 1083–1103. doi: 10.1016/0198-0149(83)90062-6
Chevillard C., Juza M., Díaz-Barroso L., Reyes E., Escudier R., and Tintoré J. (2024). Capability of the Mediterranean Argo network to monitor sub-regional climate change. Front. Mar. Sci. 11, 1416486. doi: 10.3389/fmars.2024.1416486
Coll M., Piroddi C., Steenbeek J., Kaschner K., Ben Rais Lasram F., Aguzzi J., et al. (2010). The biodiversity of the mediterranean sea: estimates, patterns, and threats. PloS One 5, e11842. doi: 10.1371/journal.pone.0011842
Coppola L., Raimbault P., Mortier L., and Testor P. (2019). Monitoring the environment in the northwestern Mediterranean Sea. Trans. Am. Geophysical Union 100. doi: 10.1029/2019EO125951. Eos.
Cotroneo Y., Aulicino G., Ruiz S., Sánchez Román A., Torner Tomàs M., Pascual A., et al. (2019). Glider data collected during the Algerian basin circulation unmanned survey. Earth Sys. Sci. Data 11, 147–161. doi: 10.5194/essd-11-147-2019
Dobricic S., Pinardi N., Testor P., and Send U. (2010). Impact of data assimilation of glider observations in the Ionian Sea (Eastern Mediterranean). Dynam. Atmos. Ocean. 50, 78–92. doi: 10.1016/j.dynatmoce.2010.01.001
Fedele G., Mauri E., Notarstefano G., and Poulain P. M. (2022). Characterization of the Atlantic Water and Levantine Intermediate Water in the Mediterranean Sea using 20 years of Argo data. Ocean. Sci. 18, 129–142. doi: 10.5194/os-18-129-2022
Garau B., Ruiz S., Zhang W. G., Pascual A., Heslop E., Kerfoot J., et al. (2011). Thermal lag correction on Slocum CTD glider data. J. Atmos. Ocean. Technol. 28, 1065–1071. doi: 10.1175/JTECH-D-10-05030.1
Garrabou J., Gómez-Gras D., Medrano A., Cerrano C., Ponti M., Schlegel R., et al. (2022). Marine heatwaves drive recurrent mass mortalities in the Mediterranean Sea. Global Change Biol. 28, 5708–5725. doi: 10.1111/gcb.16301
Heslop E. (2015). Unravelling high frequency and sub-seasonal variability at key ocean circulation ‘choke’ points: a case study from glider monitoring in the western Mediterranean sea (University of Southampton: Ocean and Earth Science, Doctoral Thesis), 248. Available online at: https://eprints.soton.ac.uk/375360/ (Accessed July 14, 2025).
Heslop E., Ruiz S., Allen J., López-Jurado J. L., Renault L., and Tintoré J. (2012). Autonomous underwater gliders monitoring variability at “choke points” in our ocean system: a case study in the western Mediterranean Sea. Geophys. Res. Lett. 39. doi: 10.1029/2012GL053717
Heslop E. E., Sánchez-Román A., Pascual A., Rodríguez D., Reeve K. A., Faugère Y., et al. (2017). Sentinel-3A views ocean variability more accurately at finer resolution. Geophys. Res. Lett. 44, 12–367. doi: 10.1002/2017GL076244
Houpert L., Durrieu de Madron X., Testor P., Bosse A., d’Ortenzio F., Bouin M. N., et al. (2016). Observations of open-ocean deep convection in the northwestern Mediterranean Sea: Seasonal and interannual variability of mixing and deep water masses for the 2007–2013 Period. J. Geophys. Res.: Oceans 121, 8139–8171. doi: 10.1002/2016JC011857
Jézéquel A., Faranda D., Drobinski P., and Lionello P. (2025). Extreme event attribution in the mediterranean. Int. J. Climatol. 45, e8799. doi: 10.1002/joc.8799
Jones E. M., Oke P. R., Rizwi F., and Murray L. M. (2012). Assimilation of glider and mooring data into a coastal ocean model. Ocean. Model. 47, 1–13. doi: 10.1016/j.ocemod.2011.12.009
Juza M., de Alfonso M., and Fernández-Mora Á. (2024). “Coastal ocean response during the unprecedented marine heatwaves in the western Mediterranean in 2022,” in 8th edition of the Copernicus Ocean State Report (OSR8). Eds. von Schuckmann K., Moreira L., Grégoire M., Marcos M., Staneva J., Brasseur P., Garric G., Lionello P., Karstensen J., and Neukermans G. (Copernicus Publications, State Planet, 4-osr8), 14. doi: 10.5194/sp-4-osr8-14-2024
Juza M., Escudier R., Vargas-Yáñez M., Mourre B., Heslop E., Allen J., et al. (2019). Characterization of changes in Western Intermediate Water properties enabled by an innovative geometry-based detection approach. J. Mar. Syst. 191, 1–12. doi: 10.1016/j.jmarsys.2018.11.003
Juza M., Fernández-Mora A., and Tintoré J. (2022). Sub-regional marine heat waves in the Mediterranean Sea from observations: long-term surface changes, sub-surface and coastal responses. Front. Mar. Sci. 9, 785771. doi: 10.3389/fmars.2022.785771
Juza M., Renault L., Ruiz S., and Tintoré J. (2013). Origin and pathways of Winter Intermediate Water in the North-western Mediterranean Sea using observations and numerical simulation. J. Geophys. Res.: Oceans 118, 6621–6633. doi: 10.1002/2013JC009231
Juza M. and Tintoré J. (2020). Sub-regional Mediterranean Sea Indicators: from event detection to climate change (Balearic Islands Coastal Observing and Forecasting System, SOCIB). Available online at: www.apps.socib.es/subregmed-indicators.
Juza M. and Tintoré J. (2021). Multivariate sub-regional ocean indicators in the Mediterranean Sea: from event detection to climate change estimations. Front. Mar. Sci. 8. doi: 10.3389/fmars.2021.610589
Juza M., Zarokanellos N. D., Heslop E., and Tintoré J. (2025a). Geostrophic transport estimations from SOCIB gliders in the Ibiza Channel from 2011 to 2024 (Version [1.0.0]) [Data set] (Palma, Spain: Balearic Islands Coastal Observing and Forecasting System, SOCIB). doi: 10.25704/DSRT-TY44
Juza M., Zarokanellos N. D., Heslop E., and Tintoré J. (2025b). Monthly climatology of geostrophic transports from SOCIB gliders in the Ibiza Channel over the period 2011-2022 (Version [1.0.0]) [Data set] (Palma, Spain: Balearic Islands Coastal Observing and Forecasting System, SOCIB). doi: 10.25704/8S6S-B637
Juza M., Zarokanellos N. D., and Tintoré J. (2025c). Ocean gliders in the Ibiza Channel: from hydrographic properties to geostrophic transports. [Web app] (Balearic Islands Coastal Observing and Forecasting System, SOCIB). Available online at: https://apps.socib.es/gliders-ibiza-channel.
Kubin E., Menna M., Mauri E., Notarstefano G., Mieruch S., and Poulain P. M. (2023). Heat content and temperature trends in the Mediterranean Sea as derived from Argo float data. Front. Mar. Sci. 10. doi: 10.3389/fmars.2023.1271638
Lévy M., Ferrari R., Franks P. J. S., Martin A. P., and Rivière P. (2012). Bringing physics to life at the submesoscale. Geophys. Res. Lett. 39, 1–13. doi: 10.1029/2012GL052756
López-Jurado J. L., Balbín R., Amengual B., Aparicio-González A., Fernández, de Puelles M. L., et al. (2015). The RADMED monitoring program: towards an ecosystem approach. Ocean. Sci. 11, 645–671. doi: 10.5194/osd-12-645-2015
López-Jurado J. L., García-Lafuente J. M., and Cano-Lucaya N. (1995). Hydrographic conditions of the Ibiza channel during November 1990, March 1991 and July 1992. Oceanol. Acta 18, 235–243.
Mahadevan A. (2014). Ocean science: eddy effects on biogeochemistry. Nature 506, 168–169. doi: 10.1038/nature13048
Margirier F., Testor P., Heslop E., Mallil K., Bosse A., Houpert L., et al. (2020). Abrupt warming and salinification of intermediate waters interplays with decline of deep convection in the Northwestern Mediterranean Sea. Sci. Rep. 10, 1–11. doi: 10.1038/s41598-020-77859-5
Mason E. and Pascual A. (2013). Multiscale variability in the Balearic Sea: An altimetric perspective. J. Geophys. Res.: Oceans 118, 3007–3025. doi: 10.1002/jgrc.20234
McGillicuddy D. J., Anderson L. A., Bates N. R., Bibby T., Buesseler K. O., Carlson C. A., et al. (2007). Eddy/wind interactions stimulate extraordinary mid-ocean plankton blooms. Science 316 (80), 1021–1026. doi: 10.1126/science.1136256
Merckelbach L. M., Briggs R. D., Smeed D. A., and Griffiths G. (2008). “Current measurements from autonomous underwater gliders,” in 2008 IEEE/OES 9th Working Conference on Current Measurement Technology, Charleston, SC, USA pp. 61–67. doi: 10.1109/CCM.2008.4480845
Millot C. (1999). Circulation in the western mediterranean sea. J. Mar. Syst. 20, 423–442. doi: 10.1016/S0924-7963(98)00078-5
Millot C. (2013). Levantine intermediate water characteristics: an astounding general misunderstanding! Sci. Mar. 77, 217–232. doi: 10.3989/scimar.03518.13A
Pascual A., Buongiorno Nardelli B., Larnicol G., Emelianov M., and Gomis D. (2002). A case of an intense anticyclonic eddy in the Balearic Sea (western Mediterranean). J. Geophys. Res.: Oceans 107, 4–1. doi: 10.1029/2001JC000913
Pinot J. M., López-Jurado J. L., and Riera M. (2002). The CANALES experiment, (1996-1998). Interannual, seasonal, and mesoscale variability of the circulation in the Balearic Channels. Prog. Oceanogr. 55, 335–370. doi: 10.1016/S0079-6611(02)00139-8
Pinot J. M., Tintoré J., and Gomis D. (1995). Multivariate analysis of the surface circulation in the Balearic Sea. Prog. Oceanogr. 36, 343–376. doi: 10.1016/0079-6611(96)00003-1
Pisano A., Marullo S., Artale V., Falcini F., Yang C., Leonelli F. E., et al. (2020). New evidence of Mediterranean climate change and variability from sea surface temperature observations. Remote Sens. 12, 132. doi: 10.3390/rs12010132
Rudnick D. L. and Cole S. T. (2011). On sampling the ocean using underwater gliders. J. Geophys. Res.: Oceans 116, C08010. doi: 10.1029/2010JC006849
Rudnick D. L., Zaba K. D., Todd R. E., and Davis R. E. (2017). A climatology of the California Current System from a network of underwater gliders. Prog. Oceanography 154, 64–106. doi: 10.1016/j.pocean.2017.03.002
Salat J., Puig P., and Latasa M. (2010). Violent storms within the Sea: dense water formation episodes in the NW Mediterranean. Adv. Geosci. 26, 53–59. doi: 10.5194/adgeo-26-53-2010
Sanchez-Garrido J. C. and Nadal I. (2022). The Alboran Sea circulation and its biological response: A review. Front. Mar. Sci. 9. doi: 10.3389/fmars.2022.933390
Schaeffer A., Roughan M., Austin T., Everett J. D., Griffin D., Hollings B., et al. (2016). Mean hydrography on the continental shelf from 26 repeat glider deployments along Southeastern Australia. Sci. Data 3, 1–12. doi: 10.1038/sdata.2016.70
Schoroeder K., Ismail S. B., Bensi M., Bosse A., Chiggiato J., Civitarese G., et al. (2024). A consensus-based, revised and comprehensive catalogue for Mediterranean water masses acronyms. Mediterr. Ma. Sci. 25, 783–791. doi: 10.12681/mms.38736
Schroeder K., Chiggiato J., Bryden H. L., Borghini M., and Ben Ismail S. (2016). Abrupt climate shift in the Western Mediterranean Sea. Sci. Rep. 6, 23009. doi: 10.1038/srep23009
Schroeder K., Chiggiato J., Josey S. A., Borghini M., Aracri S., and Sparnocchia S. (2017). Rapid response to climate change in a marginal sea. Sci. Rep. 7, 4065. doi: 10.1038/s41598-017-04455-5
Send U., Font J., Krahmann G., Millot C., Rhein M., and Tintoré J. (1999). Recent advances in observing the physical oceanography of the western Mediterranean Sea. Prog. Oceanogr. 44, 37–64. doi: 10.1016/S0079-6611(99)00020-8
Skliris N., Marsh R., Breedon M., and Josey S. A. (2024). Accelerated warming and salinification of the Mediterranean Sea: Implications for dense water formation. J. Mar. Sci. Eng. 13, 25. doi: 10.3390/jmse13010025
Smith W. H. and Sandwell D. T. (1997). Global sea floor topography from satellite altimetry and ship depth soundings. Science 277, 1956–1962. doi: 10.1126/science.277.5334.1956
Tel E., Balbín R., Cabanas J. M., García M. J., García-Martínez M. C., González-Pola C., et al. (2016). IEOOS: the spanish institute of oceanography observing system. Ocean. Sci. 12, 345–353. doi: 10.5194/os-12-345-2016
Testor P., Bosse A., Houpert L., Margirier F., Mortier L., Legoff H., et al. (2018). Multiscale observations of deep convection in the northwestern Mediterranean Sea during winter 2012–2013 using multiple platforms. J. Geophys. Res.: Oceans 123, 1745–1776. doi: 10.1002/2016JC012671
Testor P., de Young B., Rudnick D. L., Glenn S., Hayes D., Lee C. M., et al. (2019). OceanGliders: a component of the integrated GOOS. Front. Mar. Sci. 6. doi: 10.3389/fmars.2019.00422
Tintoré J., Heslop E., Ruiz S., Muñoz C., and Allen J. (2019b). SOCIB Glider - Canales Endurance Line (Version 1.0) [Data set] (Balearic Islands Coastal Observing and Forecasting System, SOCIB). doi: 10.25704/JD07-SV9 (Accessed July 14, 2025).
Tintoré J., Pinardi N., Álvarez-Fanjul E., Aguiar E., Álvarez-Berastegui D., Bajo M., et al. (2019a). Challenges for sustained observing and forecasting systems in the Mediterranean Sea. Front. Mar. Sci. 6. doi: 10.3389/fmars.2019.00568
Tintoré J., Vizoso G., Casas B., Heslop E., Pascual A., Orfila A., et al. (2013). SOCIB: the Balearic Islands Coastal Ocean Observing and Forecasting System responding to science, technology and society needs. Mar. Techn. Soc J. 47, 101–117. doi: 10.4031/MTSJ.47.1.10
Todd R. E., Rudnick D. L., Davis R. E., and Ohman M. D. (2011). Underwater gliders reveal rapid arrival of El Niño effects off California’s coast. Geophys. Res. Lett. 38, L03609. doi: 10.1029/2010GL046376
Troupin C., Beltran J. P., Heslop E., Torner M., Garau B., Allen J., et al. (2015). A toolbox for glider data processing and management. Methods Oceanogr. 13, 13–23. doi: 10.1016/j.mio.2016.01.001
Vargas-Yáñez M., Juza M., Balbín R., Vélez Belchí P., García-Martínez M. C., Moya F., et al. (2020). Climatological hydrographic properties and water mass transports in the balearic channels from repeated observations Over 1996–2019. Front. Mar. Sci. 7. doi: 10.3389/fmars.2020.568602
Vargas-Yáñez M., Juza M., Garcia-Martinez M., Moya Ruiz F., Balbín R., Ballesteros E., et al. (2021). Long-term changes in the water mass properties and sea level in the Balearic channels over the period 1996-2019. Front. Mar. Sci. 8. doi: 10.3389/fmars.2021.640535
Vargas-Yáñez M., Ouradou M., Moya F., Ballesteros E., Alonso C., Serra M., et al. (2025). A time series of water mass transports through the Balearic Channels using an ocean circulation inverse method: 1996–2022. Prog. Oceanogr. 237, 103525. doi: 10.1016/j.pocean.2025.103525
Vargas-Yáñez M., Zunino P., Schroeder K., López-Jurado J. L., Plaza F., Serra M., et al. (2012). Extreme western intermediate water formation in winter 2010. J. Mar. Syst. 105, 52–59. doi: 10.1016/j.jmarsys.2012.05.010
von Schuckmann K., le Traon P. Y., Smith N., Pascual A., Djavidnia S., Gattuso J. P., et al. (2020). Copernicus marine service ocean state report, issue 4. J. Oper. Oceanogr. 13 (sup1), S1–S172. doi: 10.1080/1755876X.2019.1633075
Wong A. P. S., Wijffels S. E., Riser S. C., Pouliquen S., Hosoda S., Roemmich D., et al. (2020). Argo data 1999–2019: two million temperature-salinity profiles and subsurface velocity observations from a global array of profiling floats. Front. Mar. Sci. 7. doi: 10.3389/fmars.2020.00700
Zaba K. D. and Rudnick D. L. (2016). The 2014–2015 warming anomaly in the Southern California current system observed by underwater gliders. Geophys. Res. Lett. 43, 1241–1248. doi: 10.1002/2015GL067550
Keywords: glider endurance line, high-resolution monitoring, geostrophic transports, water masses, Ibiza Channel
Citation: Juza M, Heslop E, Zarokanellos ND and Tintoré J (2025) Multi-scale ocean variability in the Ibiza Channel over 14-year repeated glider missions. Front. Mar. Sci. 12:1604087. doi: 10.3389/fmars.2025.1604087
Received: 01 April 2025; Accepted: 06 August 2025;
Published: 01 September 2025.
Edited by:
Gilles Reverdin, Centre National de la Recherche Scientifique (CNRS), FranceReviewed by:
Manuel Vargas-Yáñez, Spanish Institute of Oceanography (IEO), SpainAnthony Bosse, Aix-Marseille Université, France
Copyright © 2025 Juza, Heslop, Zarokanellos and Tintoré. This is an open-access article distributed under the terms of the Creative Commons Attribution License (CC BY). The use, distribution or reproduction in other forums is permitted, provided the original author(s) and the copyright owner(s) are credited and that the original publication in this journal is cited, in accordance with accepted academic practice. No use, distribution or reproduction is permitted which does not comply with these terms.
*Correspondence: Mélanie Juza, bWp1emFAc29jaWIuZXM=