 Caroline DeVries
 James Gartland
 Robert J. Latour
- Virginia Institute of Marine Science, William & Mary, Gloucester Point, VA, United States
The spiny dogfish (Squalus acanthias) is a small mesopredatory shark found in temperate and subtropical waters worldwide and is the most abundant shark within the Northwest Atlantic. Coexisting with numerous economically and ecologically important species, spiny dogfish play a key role in the ecosystem, feeding on a variety of prey including Atlantic menhaden (Brevoortia tyrannus), Atlantic herring (Clupea harengus), and longfin inshore squid (Doryteuthis pealeii), among other pelagic and demersal species. Using bottom trawl survey and stomach content data collected by the Northeast Fisheries Science Center and the Northeast Area Monitoring and Assessment Program, vector autoregressive spatiotemporal (VAST) models were applied to estimate seasonal consumption indices of key prey across space and time, with separate models based on sex and maturity status. Additionally, VAST prey species distribution models (SDMs) were constructed using data from the same surveys to calculate annualized indices of seasonal prey abundance and predator-prey overlap. Annualized indices of consumption were then assessed for potential linkages with environmental and biotic covariates using Kendall-Tau correlation coefficient and repeated-median regression. The Atlantic Multidecadal Oscillation showed the most linkages among the environmental covariates considered, particularly for immature females, mature males, and consumption of longfin inshore squid. For the biotic covariates, prey availability was often associated with consumption, with evidence of prey switching between Atlantic menhaden and Atlantic herring. These results provide a clearer understanding of the spiny dogfish’s role as a predator in a diverse and productive ecosystem and contribute to the development of a science-based approach for incorporating ecosystem considerations into management.
1 Introduction
Predator-prey relationships shape the population dynamics of exploited taxa (Essington and Munch, 2014). In many cases, predatory removals match or even exceed those from fishing, and thus significantly impact the maximum sustainable yield of a stock (Tyrrell et al., 2011). In tandem with empirical and theoretical advances in our understanding of predator physiology and predator-prey interactions, there has been a growing appreciation of the need to characterize population dynamics and manage fisheries in an ecological context (Yodzis, 1994; Fulton et al., 2003; Tyrrell et al., 2011; Steele et al., 2013; Stehlik et al., 2021). Small shark and ray species often take the role of mesopredator in oceanic ecosystems, consuming small fish or invertebrates while being predated upon by larger sharks, fish, and marine mammals. Due to this position, the trophic ecology of mesopredatory sharks and rays is frequently of interest to researchers and fisheries stakeholders, given their potential roles in trophic cascades and similar phenomena (Myers et al., 2007).
The spiny dogfish (Squalus acanthias) is a small mesopredatory shark commonly found in temperate waters of the Atlantic and South Pacific oceans (Veríssimo et al., 2010). It is the most abundant shark in the Northwest Atlantic, a highly productive and diverse marine ecosystem (Link et al., 2008; Dell’Apa et al., 2018). Spiny dogfish range from Canada to Florida and support an active fishery along the U.S. east coast (Dell’Apa et al., 2017). Targeted fishing of spiny dogfish in the Northwest Atlantic began in the 1980s, following the collapse of several groundfish fisheries in the region. This resulted in substantially reduced female biomass from the early-mid 1990s through the mid-2000s (Rago et al., 1998; Rago and Sosebee, 2010). The fishery primarily targets mature females (>95%) due to sexual and ontogenetic segregation. Mature females are found inshore relative to male or immature individuals, and females grow larger than males, so mature females are both more accessible and economically desirable (Rago et al., 1998; Haugen et al., 2017). This spatial segregation may result from females seeking relatively warmer temperatures for growth and pup development (Dell’Apa et al., 2014). Alternatively, a male avoidance hypothesis has been suggested, with females avoiding areas with many males due to the energetic loss of engaging in (or rebuffing) copulation, or a combination of the two (Economakis and Lobel, 1998; Sims, 2006; Dell’Apa et al., 2014, 2015).
Spiny dogfish co-occur with several ecologically and economically important teleost species, raising concern about their impact on prey and competitors in the Northwest Atlantic ecosystem, particularly as this system recovers from historical overfishing (Rago and Sosebee, 2010; Bangley and Rulifson, 2014). Once reproductive maturity is reached, spiny dogfish occupy upper trophic levels in this system and share a guild with several large bony fishes. Since the collapse of groundfish populations in the 1990s, spiny dogfish are among the most common piscivores in the Georges Bank fish community (Garrison and Link, 2000; Link and Garrison, 2002). This species preys on pelagic fishes and cephalopods in the region, including Atlantic herring (Clupea harengus), longfin inshore squid (Doryteuthis pealeii), bay anchovy (Anchoa mitchilli), Atlantic mackerel (Scomber scombrus), and Atlantic menhaden (Brevoortia tyrannus) (Overholtz et al., 2000; Overholtz and Link, 2007; Moustahfid et al., 2009a, 2009b; Bangley and Rulifson, 2014). Mature females overwintering off North Carolina primarily feed on teleosts, which also form a large part of the diets of striped bass (Morone saxatilis), bluefish (Pomatomus saltatrix), and spotted seatrout (Cynoscion nebulosus) along the U.S. east coast (Hartman and Brandt, 1995; Overton et al., 2008; Bangley and Rulifson, 2014). Fishery stakeholders have expressed concern that spiny dogfish are hampering recovery of collapsed fish stocks, whether through predation or competition, though this hypothesis lacks empirical support (Fogarty and Murawski, 1998; Link and Garrison, 2002; Myers et al., 2007; Pitchford et al., 2020). Conversely, historical fishing pressure has shaped the population dynamics of spiny dogfish, which very likely has an impact on overall consumptive removals by spiny dogfish (Rago et al., 1998; Rago and Sosebee, 2010). Accordingly, further research is needed to assess the impact of this predator on prey, competitors, and regional fisheries (Bangley and Rulifson, 2014).
Adopting ecosystem-approaches to fisheries management (EAFM) necessitates a well-developed understanding of the underlying mechanisms and interactions between a managed species and the environment, including predator-prey dynamics (Link and Marshak, 2021). Due to sexual and ontogenetic segregation, known ontogenetic shifts in diet, and seasonal migration patterns, spiny dogfish likely assume various predatory roles throughout their life cycle (Koen Alonso et al., 2002). In this context and to support EAFM efforts, the goal of this study is to quantify consumptive removals of key prey species by spiny dogfish in the Northwest Atlantic, considering factors such as sex, maturity stage, and season. We also sought to assess linkages between seasonal consumption estimates and several environmental and biotic covariates.
2 Methods
2.1 Data sources
The primary data sources for this study were the NOAA Northeast Fisheries Science Center (NEFSC) bottom trawl survey (BTS) and the Northeast Area Monitoring and Assessment Program (NEAMAP) nearshore BTS (Figure 1). The NEFSC BTS has been operating since 1963, sampling an area that includes the Western Scotian Shelf of the Gulf of Maine, south to Cape Lookout, North Carolina. This survey currently uses a 3-bridle, 4-seam bottom trawl outfitted with a sweep made of 40.6 cm diameter rubber discs. Annual surveys occur during spring (Mar-May) and fall (Sep-Nov), with approximately 350-400 sampling sites selected following a stratified sampling design. Strata boundaries were chosen based on depth and latitude, with some additional consideration for known species distribution patterns. The NEFSC BTS experienced a gear and vessel change in 2009, so calibrated data were used to facilitate historical comparability (Miller, 2013). For each site, data on tow date/time, location, area-swept (calibrated to a constant 0.0384 km2), sex-specific catch numbers and biomass, catch-at-length bin numbers, individual predator weights, and individual prey weights from predator stomachs were acquired. The NEAMAP BTS began sampling in 2008. The survey utilizes a 3-bridle, 4-seam bottom trawl with a sweep made of 7.6 cm diameter rubber discs that is very similar to the NEFSC BTS sampling gear. Research cruises also regularly occur during spring (Apr – May) and fall (Sep – Nov), with approximately 150 sites chosen randomly according to a region by depth stratified design (Gartland et al., 2023). The same data elements mentioned above were obtained from the NEAMAP BTS, with area-swept being calculated using associated tow distance and net width.
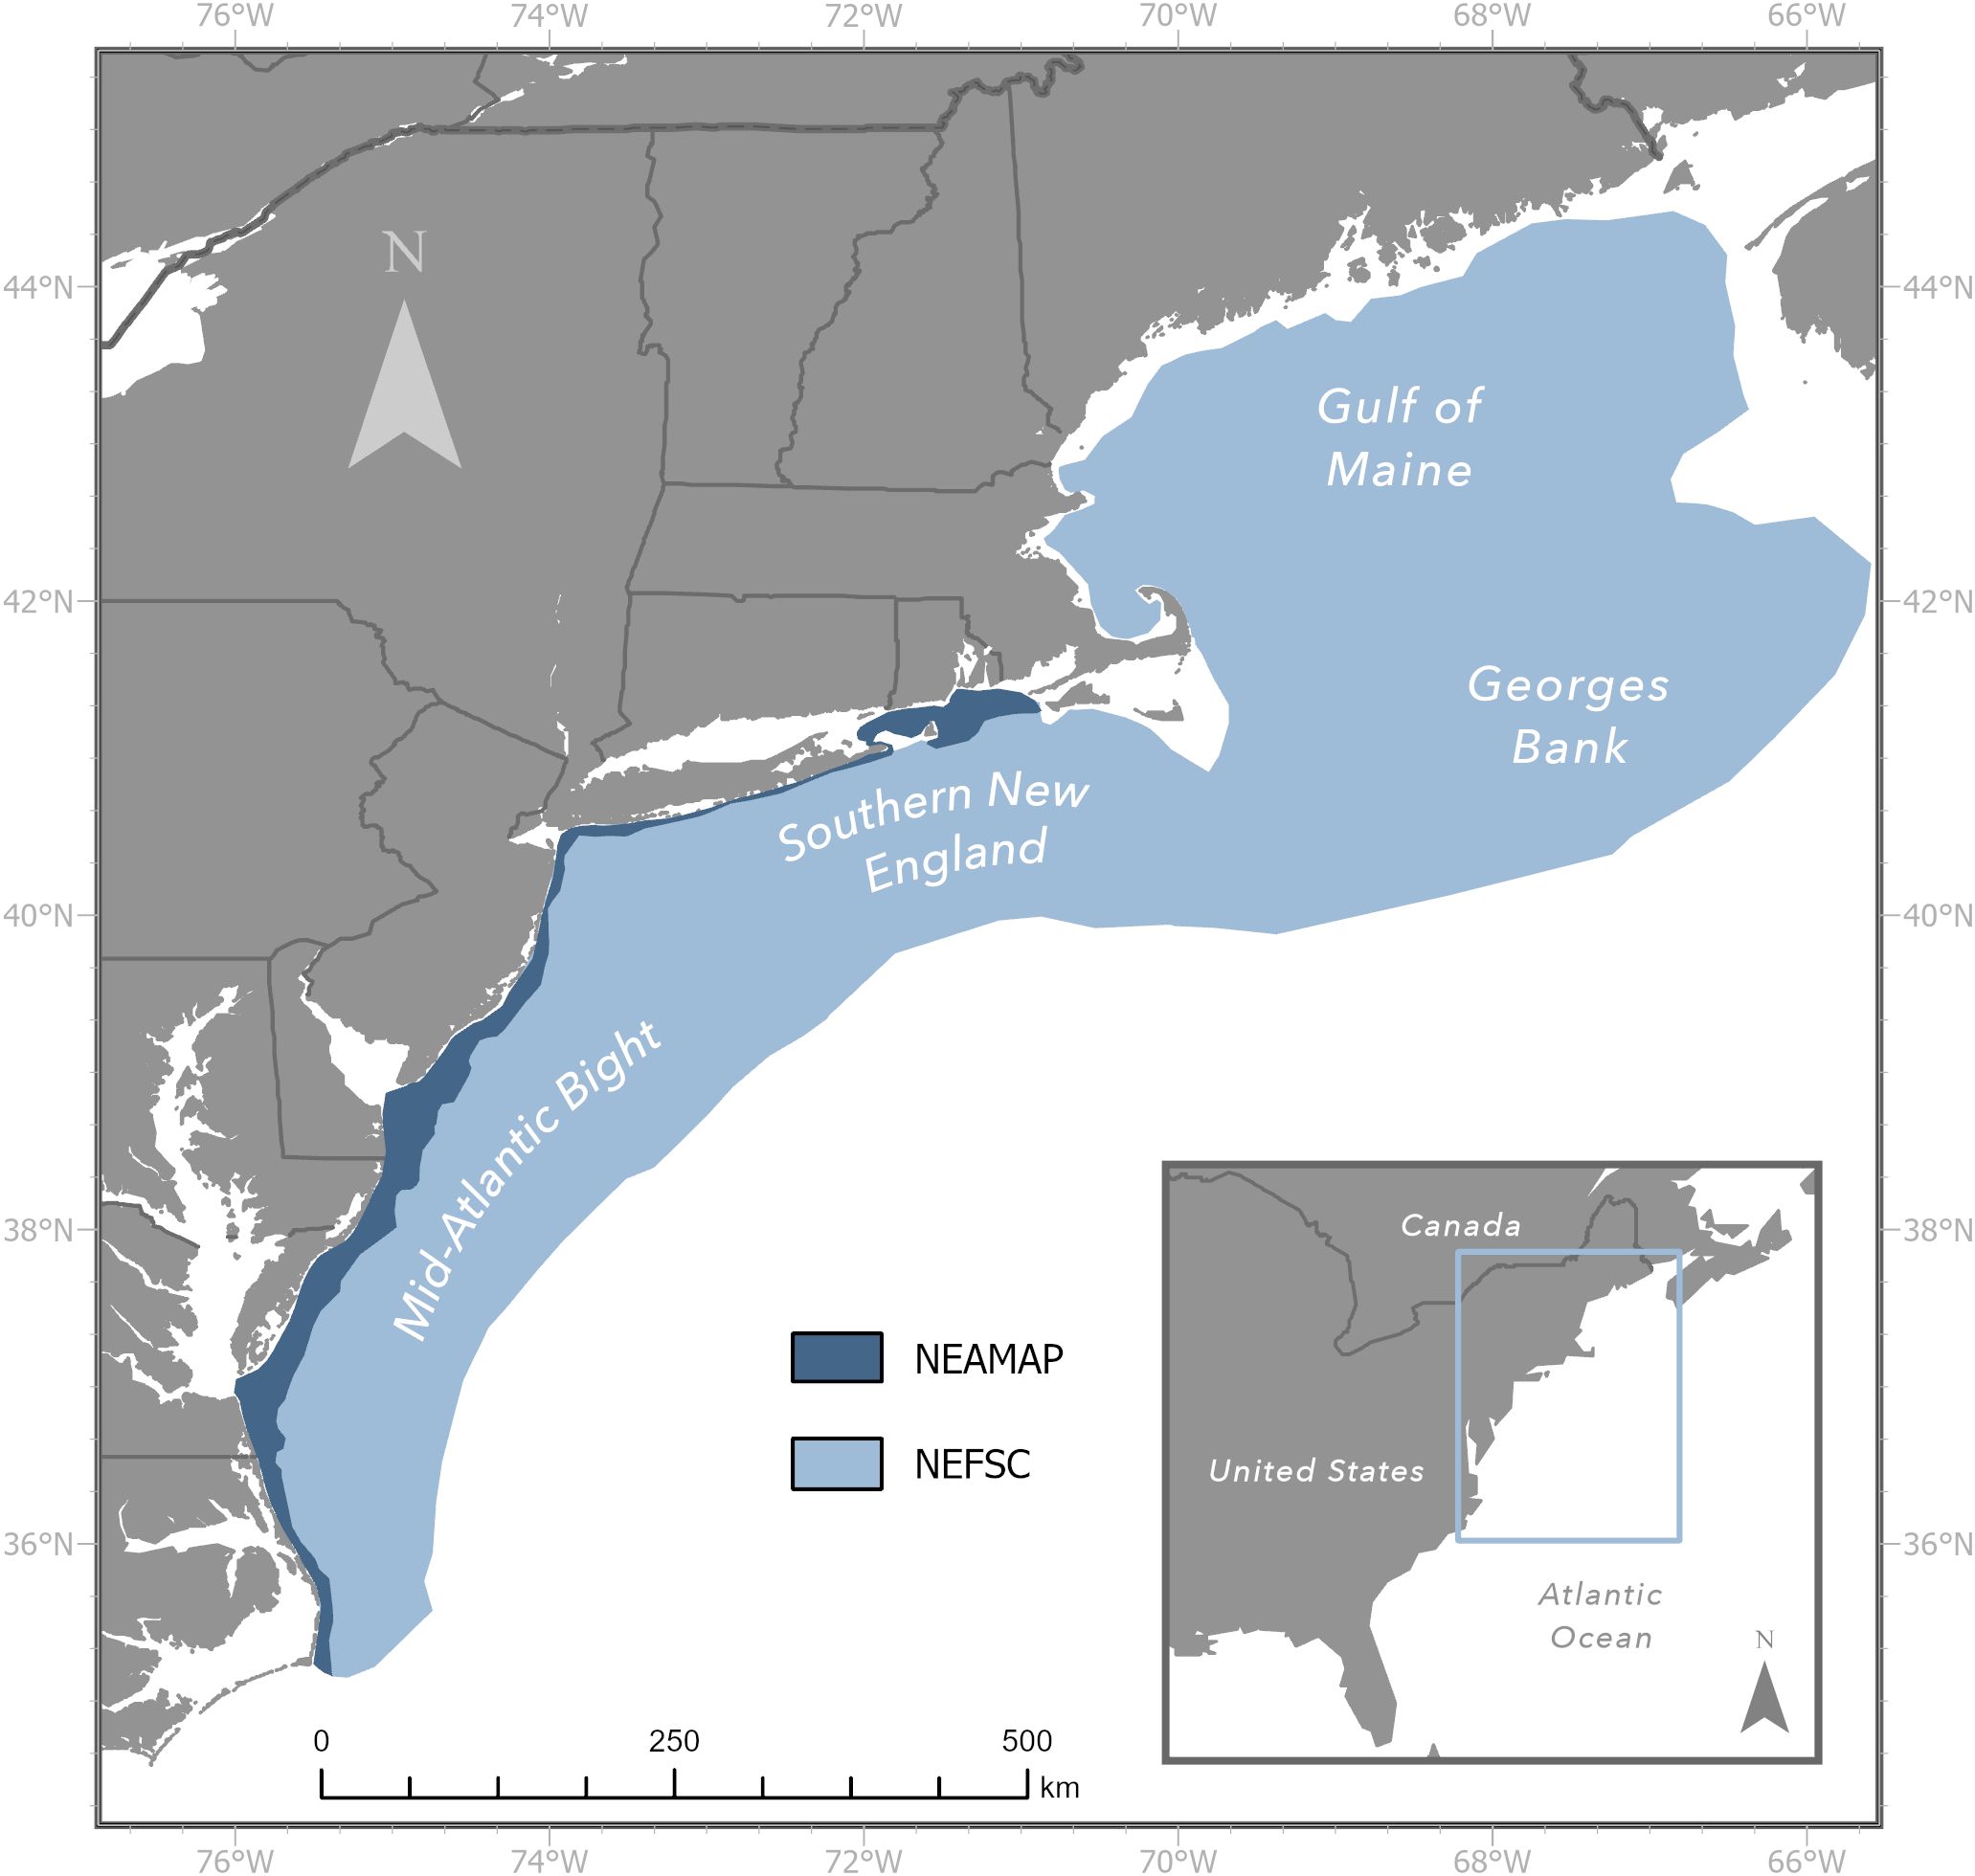
Figure 1. Sampling frames of the Northeast Fisheries Science Center (light blue) and Northeast Area Monitoring and Assessment Program (dark blue) bottom trawl surveys.
The time-series of data for this study were restricted to 1980 – 2019 since the NEFSC BTS did not collect sex-specific catch data for spiny dogfish until 1980 and both surveys were disrupted in 2020 due to the COVID-19 pandemic. Catch data were further divided into immature and mature stages based on total length (TL). The estimated TL at 50% maturity (L50) for female spiny dogfish was historically 80 cm, however, a recent study reported that L50 had decreased to 73 cm (Sosebee, 2022). Accordingly, maturity designations for female individuals captured from 1980 – 2011 were based on L50 = 80 cm, while those collected from 2012 – 2019 were classified using L50 = 73 cm. All male spiny dogfish were classified using L50 = 60 cm. The NEFSC catch processing protocol involves assigning a subsample of the catch to 1 cm TL bins, while NEAMAP collects biological data on a subsample of spiny dogfish that includes measuring pre-caudal length (PCL) and total individual weight (kg). Biomass values associated with each NEFSC length bin were estimated using a weight-at-length relationship and calibrated for vessel and gear by multiplying total biomass at length by the ratio of calibrated total catch to uncalibrated total catch. PCL of spiny dogfish sampled by NEAMAP was converted to TL by dividing by 0.8071 (Dell’Apa et al., 2018).
2.2 Modeling consumption of key prey
Prey items are identified to the lowest possible taxon and weighed (NEAMAP) or converted from volume to wet weight (NEFSC). From the available diet data, three key prey species that are both consumed by spiny dogfish and targeted by commercial fisheries were selected for analysis: longfin inshore squid, Atlantic herring, and Atlantic menhaden. For these prey and an aggregate ‘other’ prey category (all prey combined less the focal three), minimum daily biomass consumed by spiny dogfish of predator group in season s of year was estimated by coupling spiny dogfish catch and stomach content data with a gastric evacuation model (Eggers, 1977; Elliott and Persson, 1978). Specifically, minimum daily consumption () was calculated as:
where is predator biomass density (kg/km2), is per capita prey consumption (kg prey/kg predator) which incorporates gastric evacuation, is area (km2), and indexes the spatial grid cell over which consumption is estimated (Equation 1). Species-specific prey evacuation parameters were obtained from Stehlik et al. (2021), and minimum daily consumption estimates were multiplied by 91.25, the average number of days in a season, to extend to a seasonal timescale. Note that data summaries showed that male spiny dogfish did not consume appreciable amounts of Atlantic menhaden, so this prey was combined with the aggregate ‘other’ group when quantifying male consumption (see Consumption Model Equations in the Supplement; Supplementary Tables S1-S2).
The Vector Autoregressive Spatiotemporal modeling framework and the VAST package in R (Thorson, 2019; R Core Team, 2023) were used to estimate consumption (following the approach of Gartland and Latour, 2024). Briefly, VAST is a two-component delta-type model that can be fitted to multiple georeferenced response variables as separate categories. This allows for modeling zero-heavy data that are often characteristic of survey trawls in a manner similar to encounter rate and catch-rate-given-encounter in a traditional delta model, while relaxing the assumption of independence between the two components (Thorson, 2019). Given that correlation among density measures can often vary directionally in marine ecosystems (i.e. more similar along than across physical depth gradients), separate VAST models were fitted assuming geometric anisotropy and isotropy (see Consumption Model Equations in the Supplement; Supplementary Tables S3-S4).
Final model parameterizations for the four combinations of sex and season (male-spring, male-fall, female-spring, female-fall) were chosen based on a four-stage selection process, where distribution, spatial and spatiotemporal structure, and catchability covariates were separately assessed for empirical support, followed by a final model stage with increased spatial resolution (Gartland and Latour, 2024). Survey and day-of-year were considered as catchability covariates. Immature and mature consumption were modeled as separate categories within each of the four models. In all stages, model parameterizations were excluded if spatial maps of quantile residuals visibly showed a non-random distribution or if spatial maps of predicted biomass density were homogenous (no spatial/spatiotemporal variation). Final models were fitted using restricted maximum likelihood (REML) with 300 knot locations to increase spatial resolution (see Knot Locations in the Supplement; Supplementary Figure S1). Predictions of and were corrected for retransformation bias and uncertainties associated with seasonal consumption estimates were estimated using the delta method (Kass and Steffey, 1989; Thorson and Kristensen, 2016). These models were then used to predict over a spatial grid for the Northwest Atlantic region for each year.
2.3 Ecological linkages
Ten annualized covariates were assessed to explore linkages with consumption. These included broad climatic indices and various metrics related to top-down and bottom-up control on prey availability. Specifically, the covariates evaluated were the Gulf Stream Index (GSI), the North Atlantic Oscillation (NAO), the Atlantic Multidecadal Oscillation (AMO), annual harvest, model-based seasonal biomass densities for three key prey species, and prey-predator overlap for those same species. The GSI measures the position of the northern boundary of the Gulf Stream current, a crucial source of warm water to the Northwest Atlantic region (Taylor and Stephens, 1980). Quarterly values of GSI from Joyce et al. (2019) were averaged for each year. The NAO is a winter index that reflects atmospheric pressure differences between the Azores and Iceland, indicating shifts in air mass between the Arctic and subtropical Atlantic (Hurrell, 1995). Annual NAO values were calculated as the average of January, February, and March of the current year, along with December from the previous year (NOAA, 2024a). The AMO describes a cycle of sea surface temperature variability in the Northwest Atlantic (Enfield et al., 2001). Monthly values were averaged to provide an annual value (NOAA, 2024b). Yearly harvest values for each key prey species were obtained using NOAA’s Fishery’s One Stop Shop (FOSS; NOAA, 2024c).
Model based seasonal prey biomass density estimates were generated using seasonal three-category (Atlantic menhaden, Atlantic herring, longfin inshore squid) VAST models in an identical manner as described above for , based on the NEFSC and NEAMAP bottom trawl survey data. Spring and fall prey densities were modeled separately, with the most supported model parameterization selected using the same multi-stage process as described above for the consumption model. The most supported parameterizations were used in the final spring and fall models, fitted using REML with 300 knots. Grid-cell estimates of biomass density (kg/km2) and total survey-area estimates of bias-corrected prey biomass (kg) were quantified in an identical manner to in the above consumption models.
Estimates of seasonal prey biomass density were also used to calculate an annual overlap index for each combination of predator biomass density (immature/mature female, immature/mature male spiny dogfish). The local index of collocation was selected to quantify overlap, following the criteria outlined by Carroll et al. (2019). This index assesses the strength of the correlation between the predator and prey biomass density relative to their total respective biomasses, with values near 0 indicating low encounter rates and values near 1 indicating high encounter rates (Pianka, 1973). Only overlap indices that matched same predator group and season were considered as covariates of consumption.
Relationships between covariates and annual estimates of seasonal consumption were assessed by calculating the Kendall-tau rank correlation coefficient , using the Kendall package in R (Kendall, 1955; McLeod, 2022). The Kendall-tau rank correlation is a non-parametric test that produces a statistic ranging between -1 and 1. Values near 1 indicate high similarity in the ordering of variables, values near -1 indicate strong dissimilarity (inverse ordering), and values near 0 indicate weak or no correlation. This approach allowed comparisons of the direction and strength of relationships between consumption estimates and annualized covariates. Statistical significance was assessed through repeated median regression using the mblm package in R (Siegel, 1982). The significance level of 0.05 was adjusted for multiple comparisons using the Hochberg method (Hochberg, 1988; Chen et al., 2017), with separate adjustments for comparisons involving the climate indices and metrics of prey availability.
3 Results
3.1 Data summary
From the NEFSC BTS, catch data from 25,869 sampling sites over a 40-year period (1980-2019) were analyzed. Among these sites, 4,870 (18.83%) contained immature male, 8,864 (34.26%) immature female, 7,703 (29.78%) mature male, and 6,740 (26.05%) mature female spiny dogfish. Additionally, stomach content data were available for 3,477 immature male, 6,454 immature female, 6,223 mature male, and 4,997 mature female spiny dogfish.
From the NEAMAP BTS, catch data from 3,499 sampling sites over 11 years were included. Of these, 148 (4.23%) sites encountered immature male, 689 (19.7%) immature female, 210 (6.00%) mature male spiny dogfish, and 1,034 (29.55%) mature female spiny dogfish. Gut contents data were available for 148 immature male, 148 immature female, 210 mature male, and 1,034 mature female spiny dogfish.
3.2 Model selection
In the model selection process applied to the four consumption models, the delta-lognormal distribution was the most supported in the first stage, outperforming the delta-gamma and generalized gamma distributions. Incorporating anisotropy was consistently supported across all four models. Empirical support for catchability covariates varied by sex and season, with survey and day-of-year in both linear predictors for the female spring model, survey in the second predictor and day-of-year in both linear predictors for the female fall model, day-of-year in both linear predictors for the male spring model, and day-of-year in the second predictor for male fall model (see Model Selection in the Supplement; Supplementary Tables S5-S8).
For the seasonal prey biomass models, the delta-gamma distribution was most supported for the spring data, whereas the delta-generalized gamma distribution was favored for the fall data. Incorporating anisotropy improved model fit in both cases, and both models included catchability covariates for survey (which was allowed to vary between separate prey categories) and day-of-year in their final model parameterizations (see Model Selection in the Supplement; S9-S11).
3.3 Model predictions
Spiny dogfish predator groups were encountered during spring throughout the Mid-Atlantic Bight (MAB), Southern New England (SNE), Georges Bank (GB), and the Gulf of Maine (GOM; Figure 2). Estimated densities of male spiny dogfish were notably lower in nearshore locations, particularly for immature males and to a lesser extent for mature males. For the focal prey, longfin inshore squid densities were highest in the MAB and SNE, and secondarily near GB. Atlantic menhaden densities were largely confined to the nearshore waters of the MAB and SNE, while Atlantic herring densities were highest in SNE, followed by the MAB and the southern areas of the GOM and GB. Per-capita consumption of focal prey by the spiny dogfish groups generally mirrored prey distributions. Longfin inshore squid were predominately consumed in the offshore waters of the MAB and SNE by all groups, and on GB by immature males. Estimation of per-capita consumption of Atlantic menhaden was limited to female spiny dogfish due to sparse stomach contents data for males, but predicted consumption was highest in the MAB, followed by SNE for mature females. Atlantic herring consumption was widespread among all groups, with the highest densities in the offshore waters of SNE.
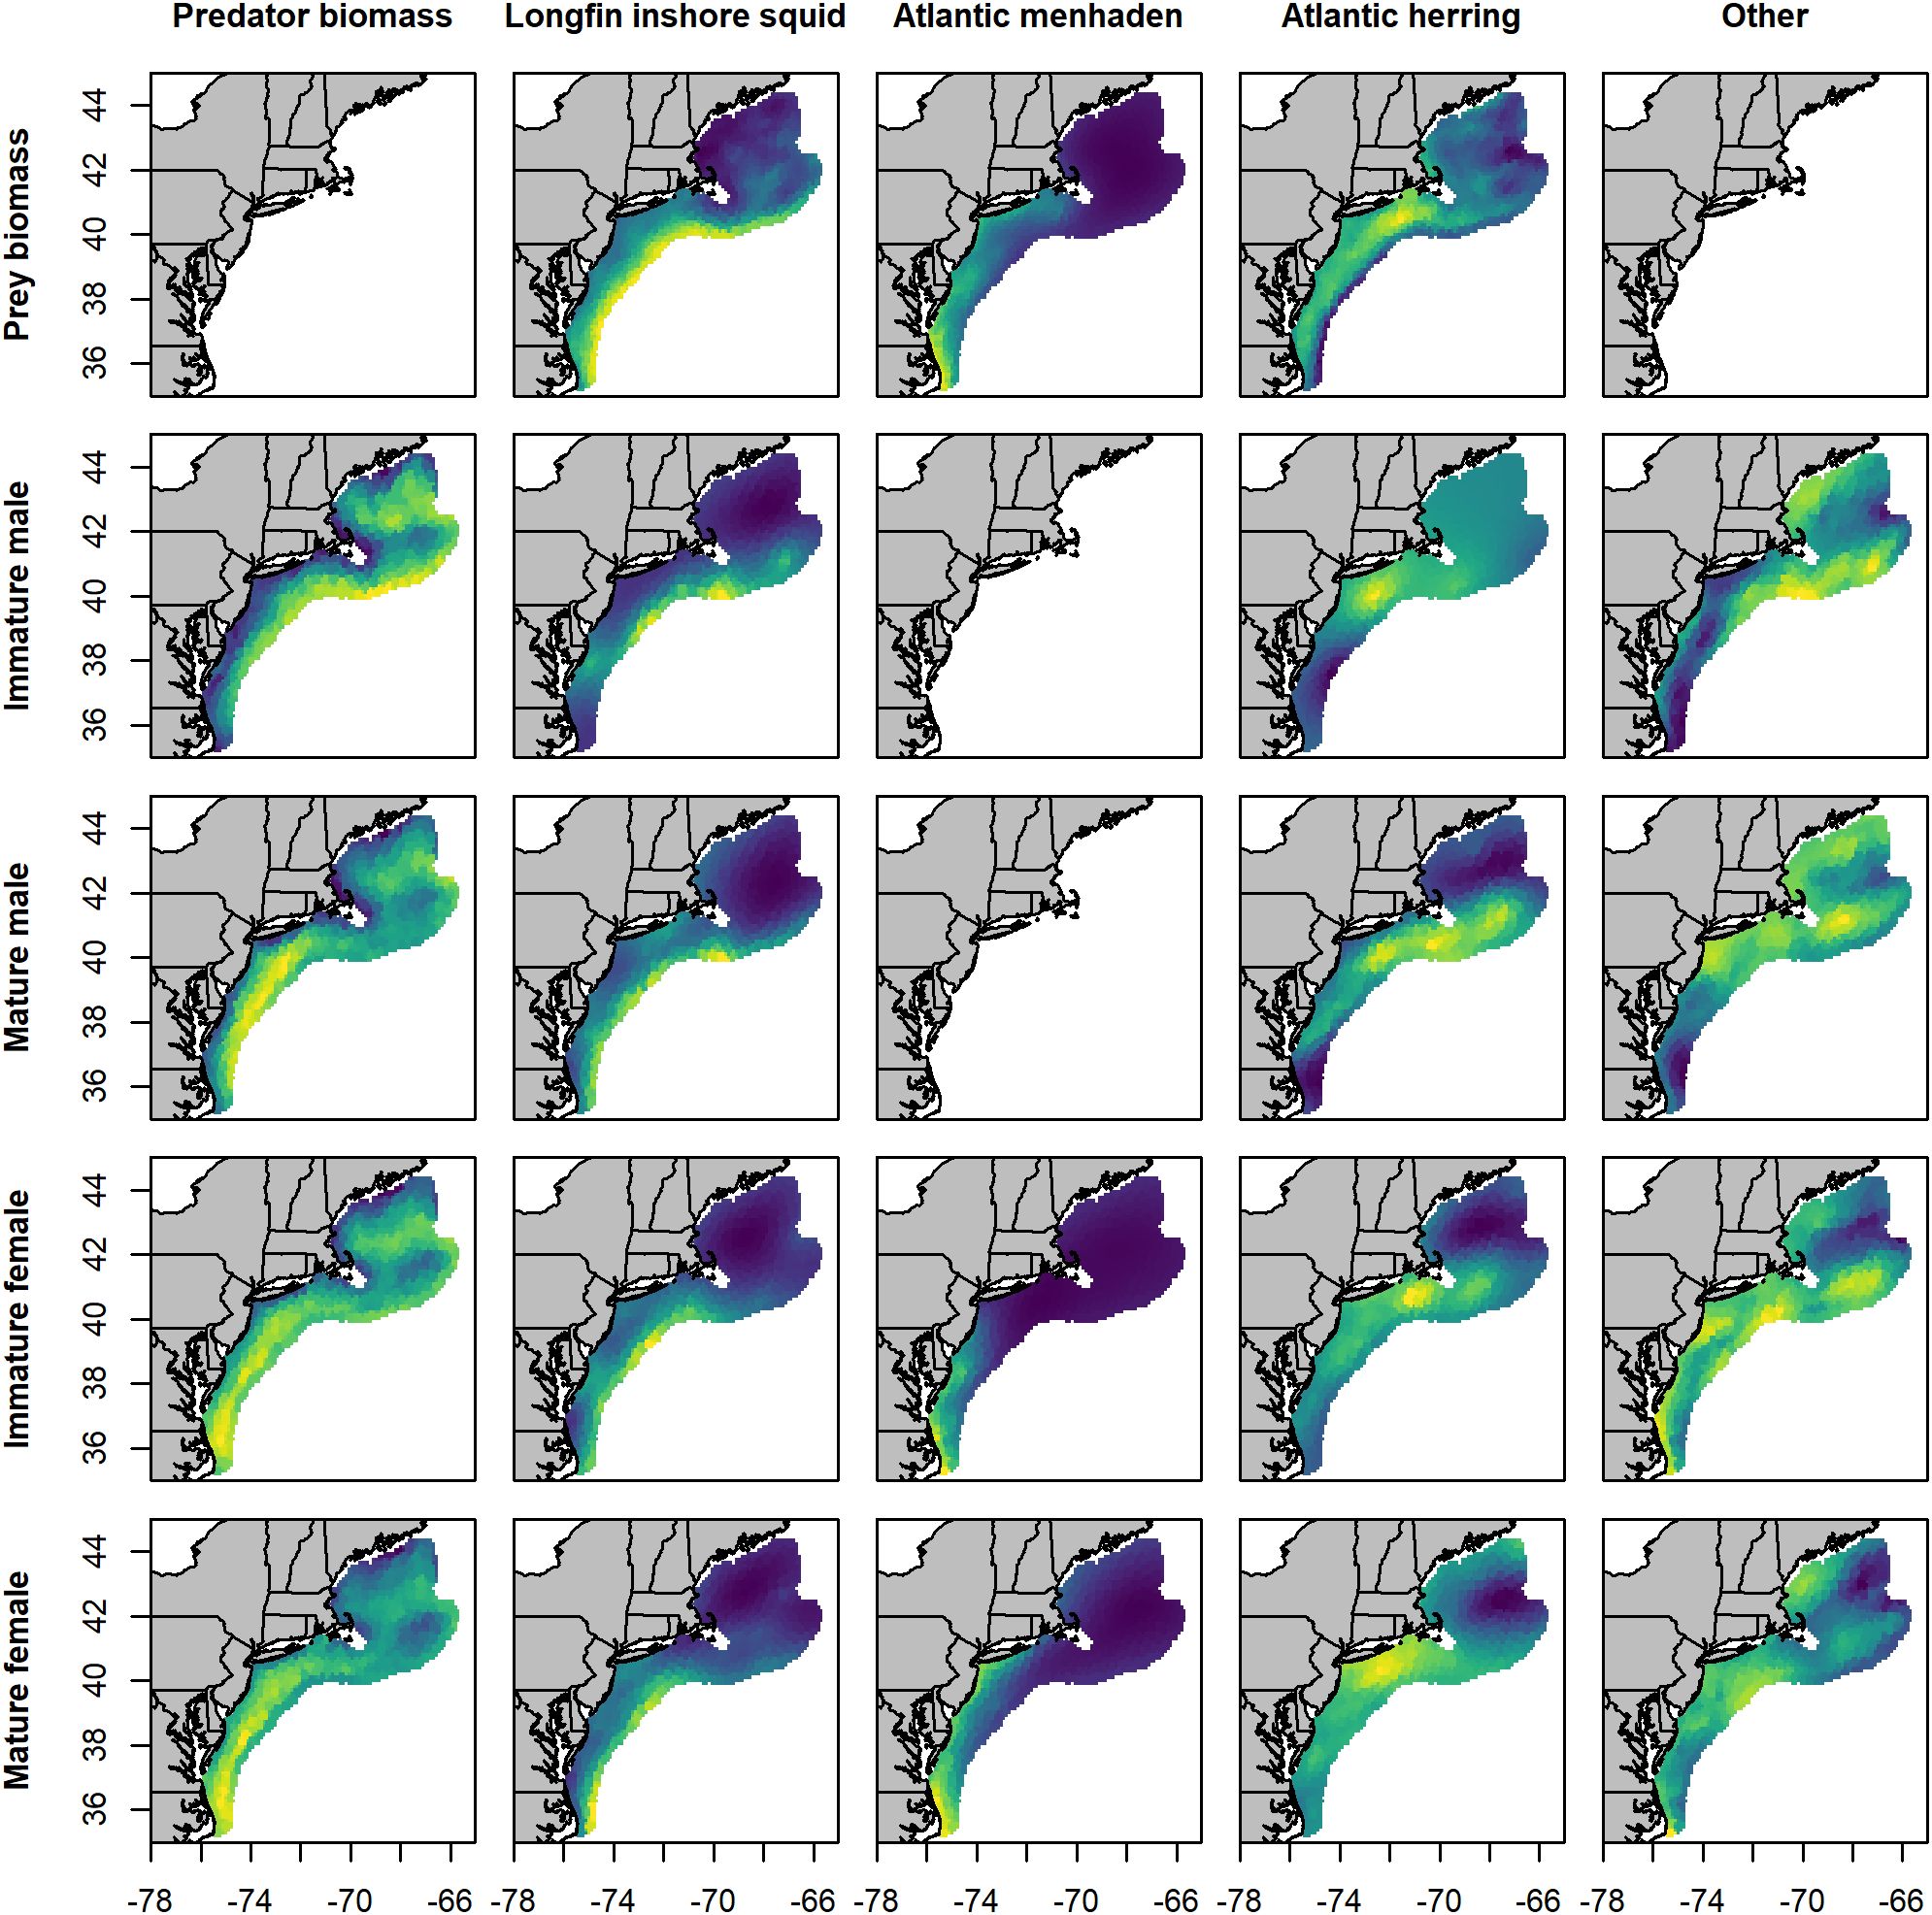
Figure 2. Maps of mean spring predicted biomass density for predator groups and prey species (kg·km-2), and per capita consumption (prey kg · predator kg-1) across the study area. Values were averaged across years (1980 - 2019). Subplots are organized by prey species from left to right, and by predator type from top to bottom. Yellow locations indicate areas of high density, blue locations indicate areas of low density, and green values indicate intermediate values. Color scales were calculated independently for each map and are not directly comparable between maps.
Densities of all spiny dogfish groups during fall were high throughout the middle and northern areas of the study region, showing a marked shift from the spring distribution toward the northern reaches of SNE, the GOM, and GB (Figure 3). Both mature males and mature females had notably reduced densities in the eastern regions of GB compared to spring. Longfin inshore squid were more prevalent inshore and to the north, extending across much of the MAB, SNE, and GB. Atlantic menhaden remained inshore but extended from the MAB to the coastal waters GOM. Atlantic herring showed the highest predicted density in the GOM and on GB, with low presence in the MAB and SNE. As in spring, predicted consumption patterns largely mirrored prey distributions, though with additional variability.
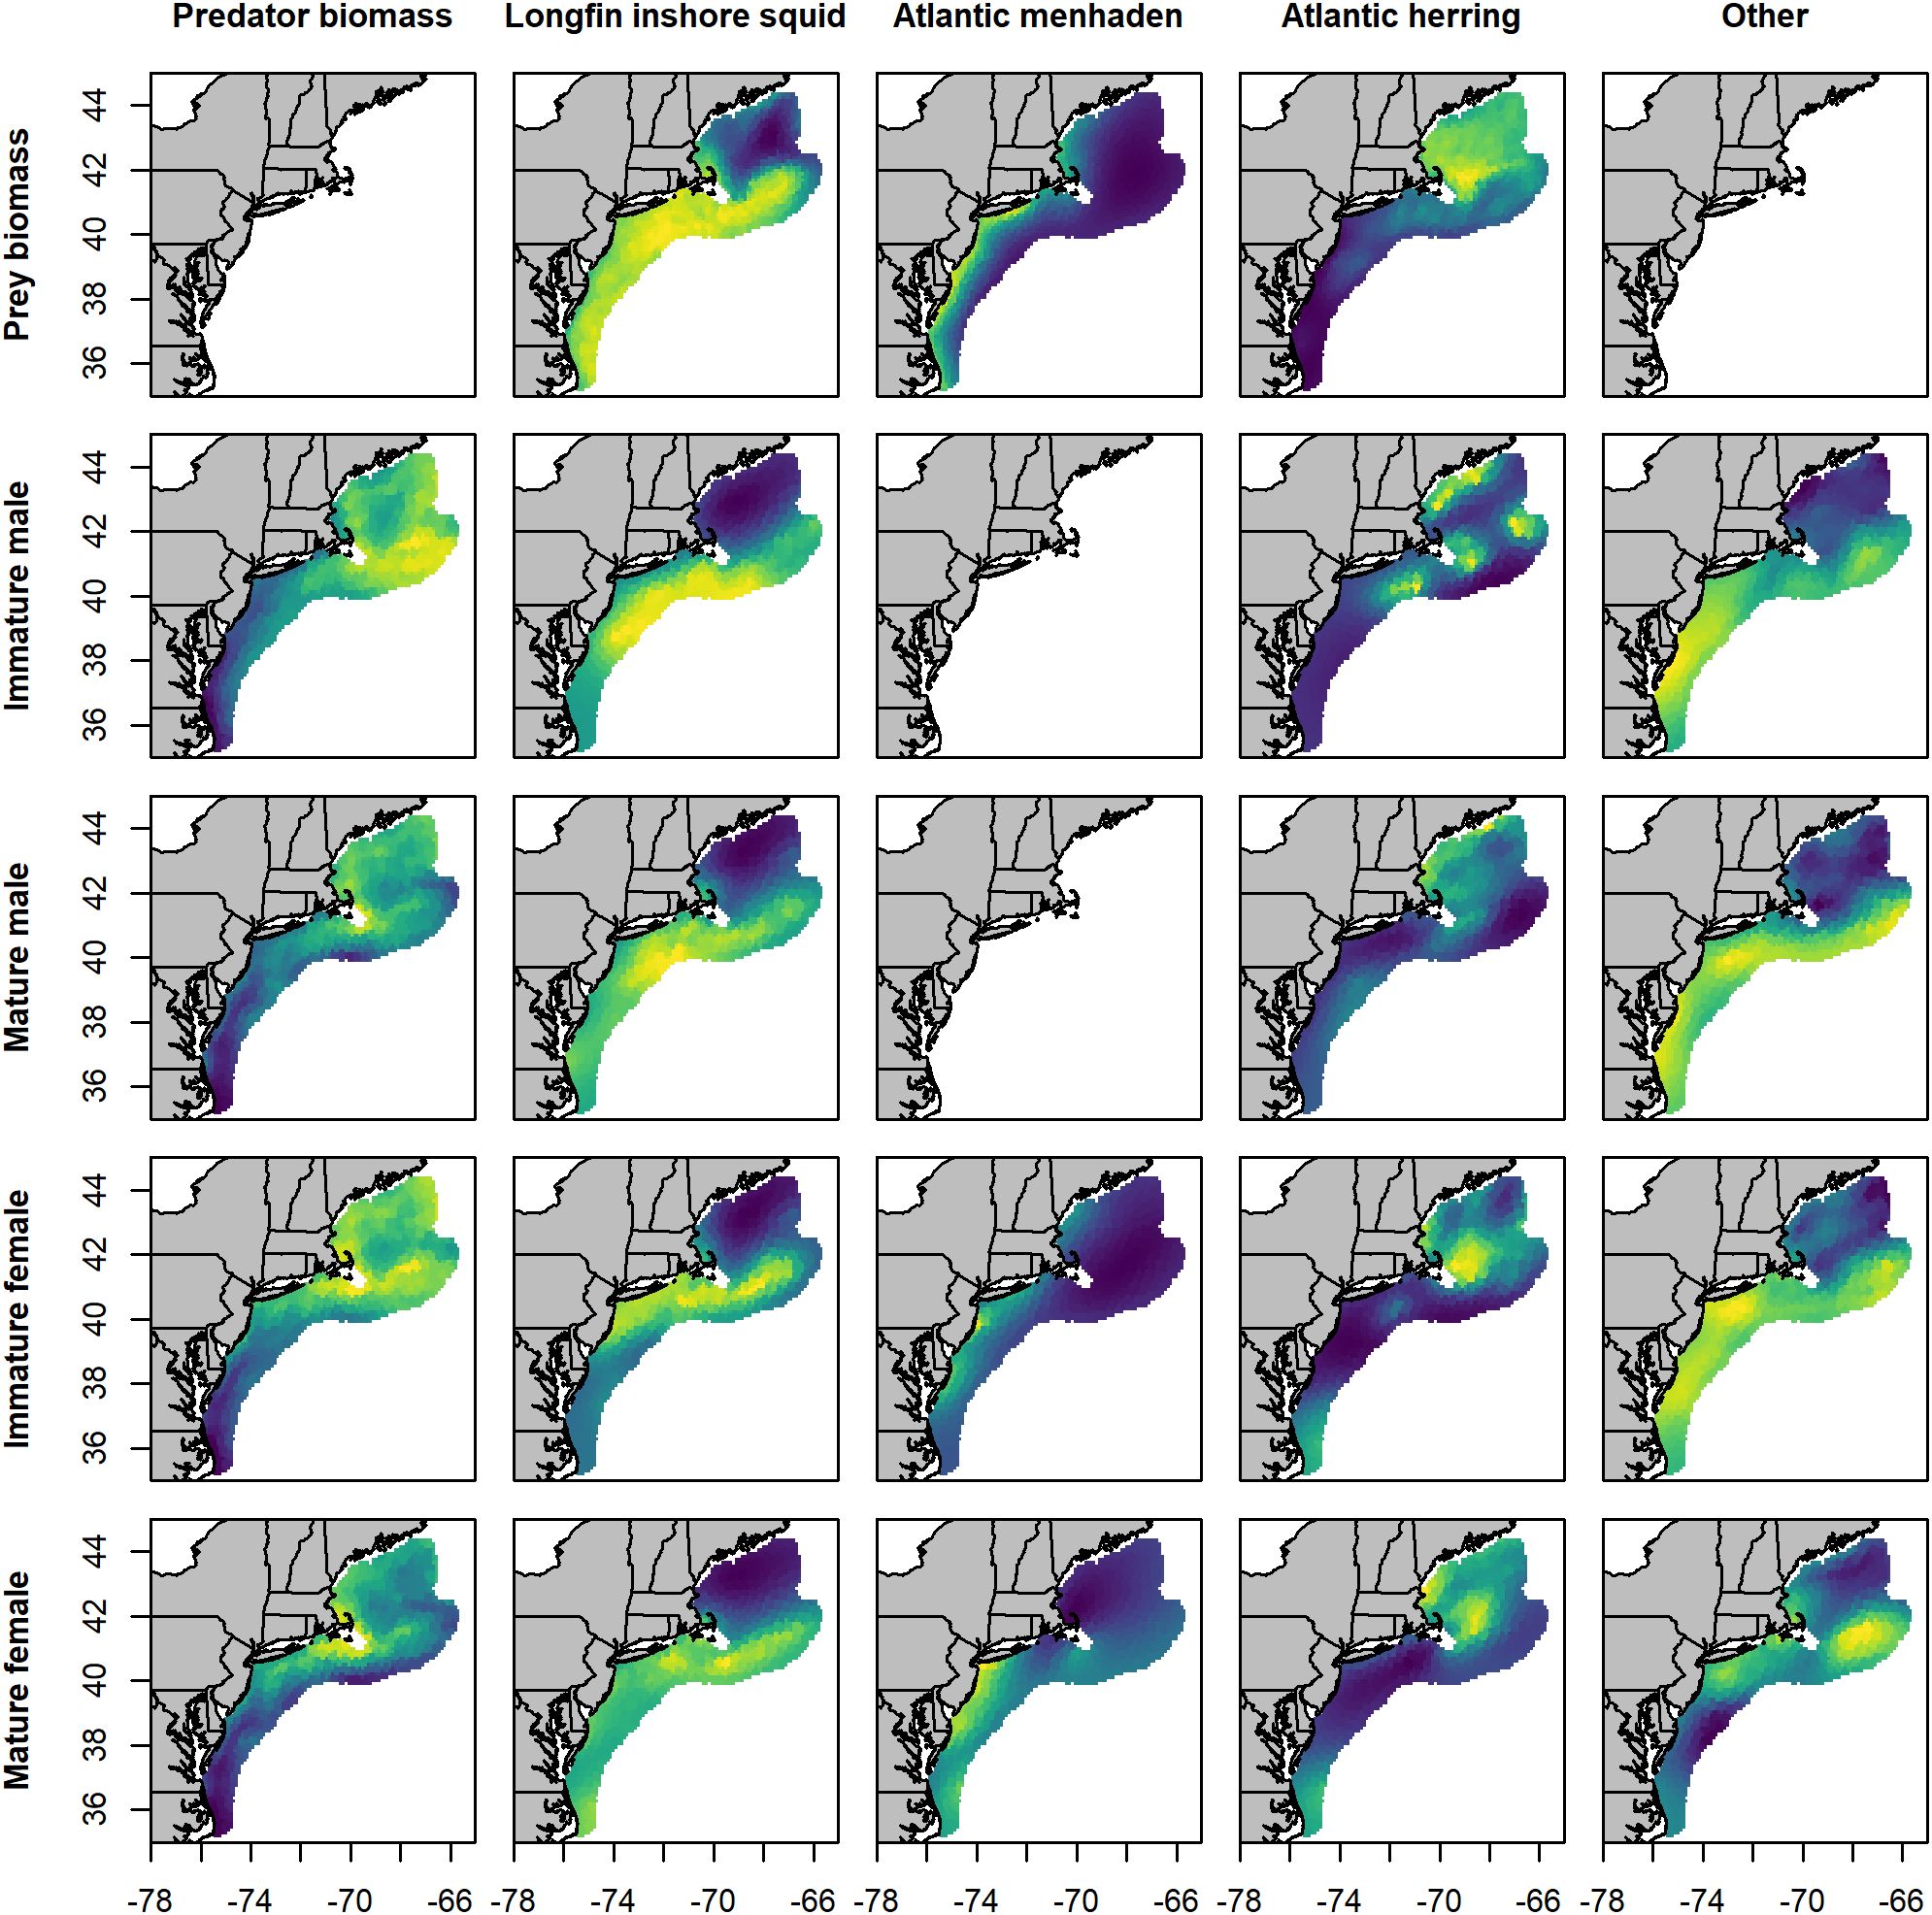
Figure 3. Maps of mean fall predicted biomass density for predator groups and prey species (kg·km-2), and per capita consumption (prey kg · predator kg-1) across the study area. Values were averaged across years (1980 - 2019). Subplots are organized by prey species from left to right, and by predator type from top to bottom. Yellow locations indicate areas of high density, blue locations indicate areas of low density, and green values indicate intermediate values. Color scales were calculated independently for each map and are not directly comparable between maps.
Annualized spring prey consumption was highly variable for all groups (Figure 4), rarely showing consistent trends outside of the aggregate “other” category. Consumption of Atlantic herring by immature males and consumption of Atlantic menhaden by immature females were notably sparse, occurring only a few years of the time-series. There was generally reduced consumption of Atlantic menhaden in the middle years of the study, while there was generally higher consumption of Atlantic herring in the same years. Annualized fall prey consumption was also highly variable (Figure 5). Consumption of Atlantic menhaden was sparse in comparison to spring, rarely occurring outside of the 2010s. Consumption of longfin inshore squid was also highest in the later years, though it was still regularly observed over the course of the study. Atlantic herring were also consumed frequently over the course of the study, though less so for immature males and immature females during the earlier and later periods.
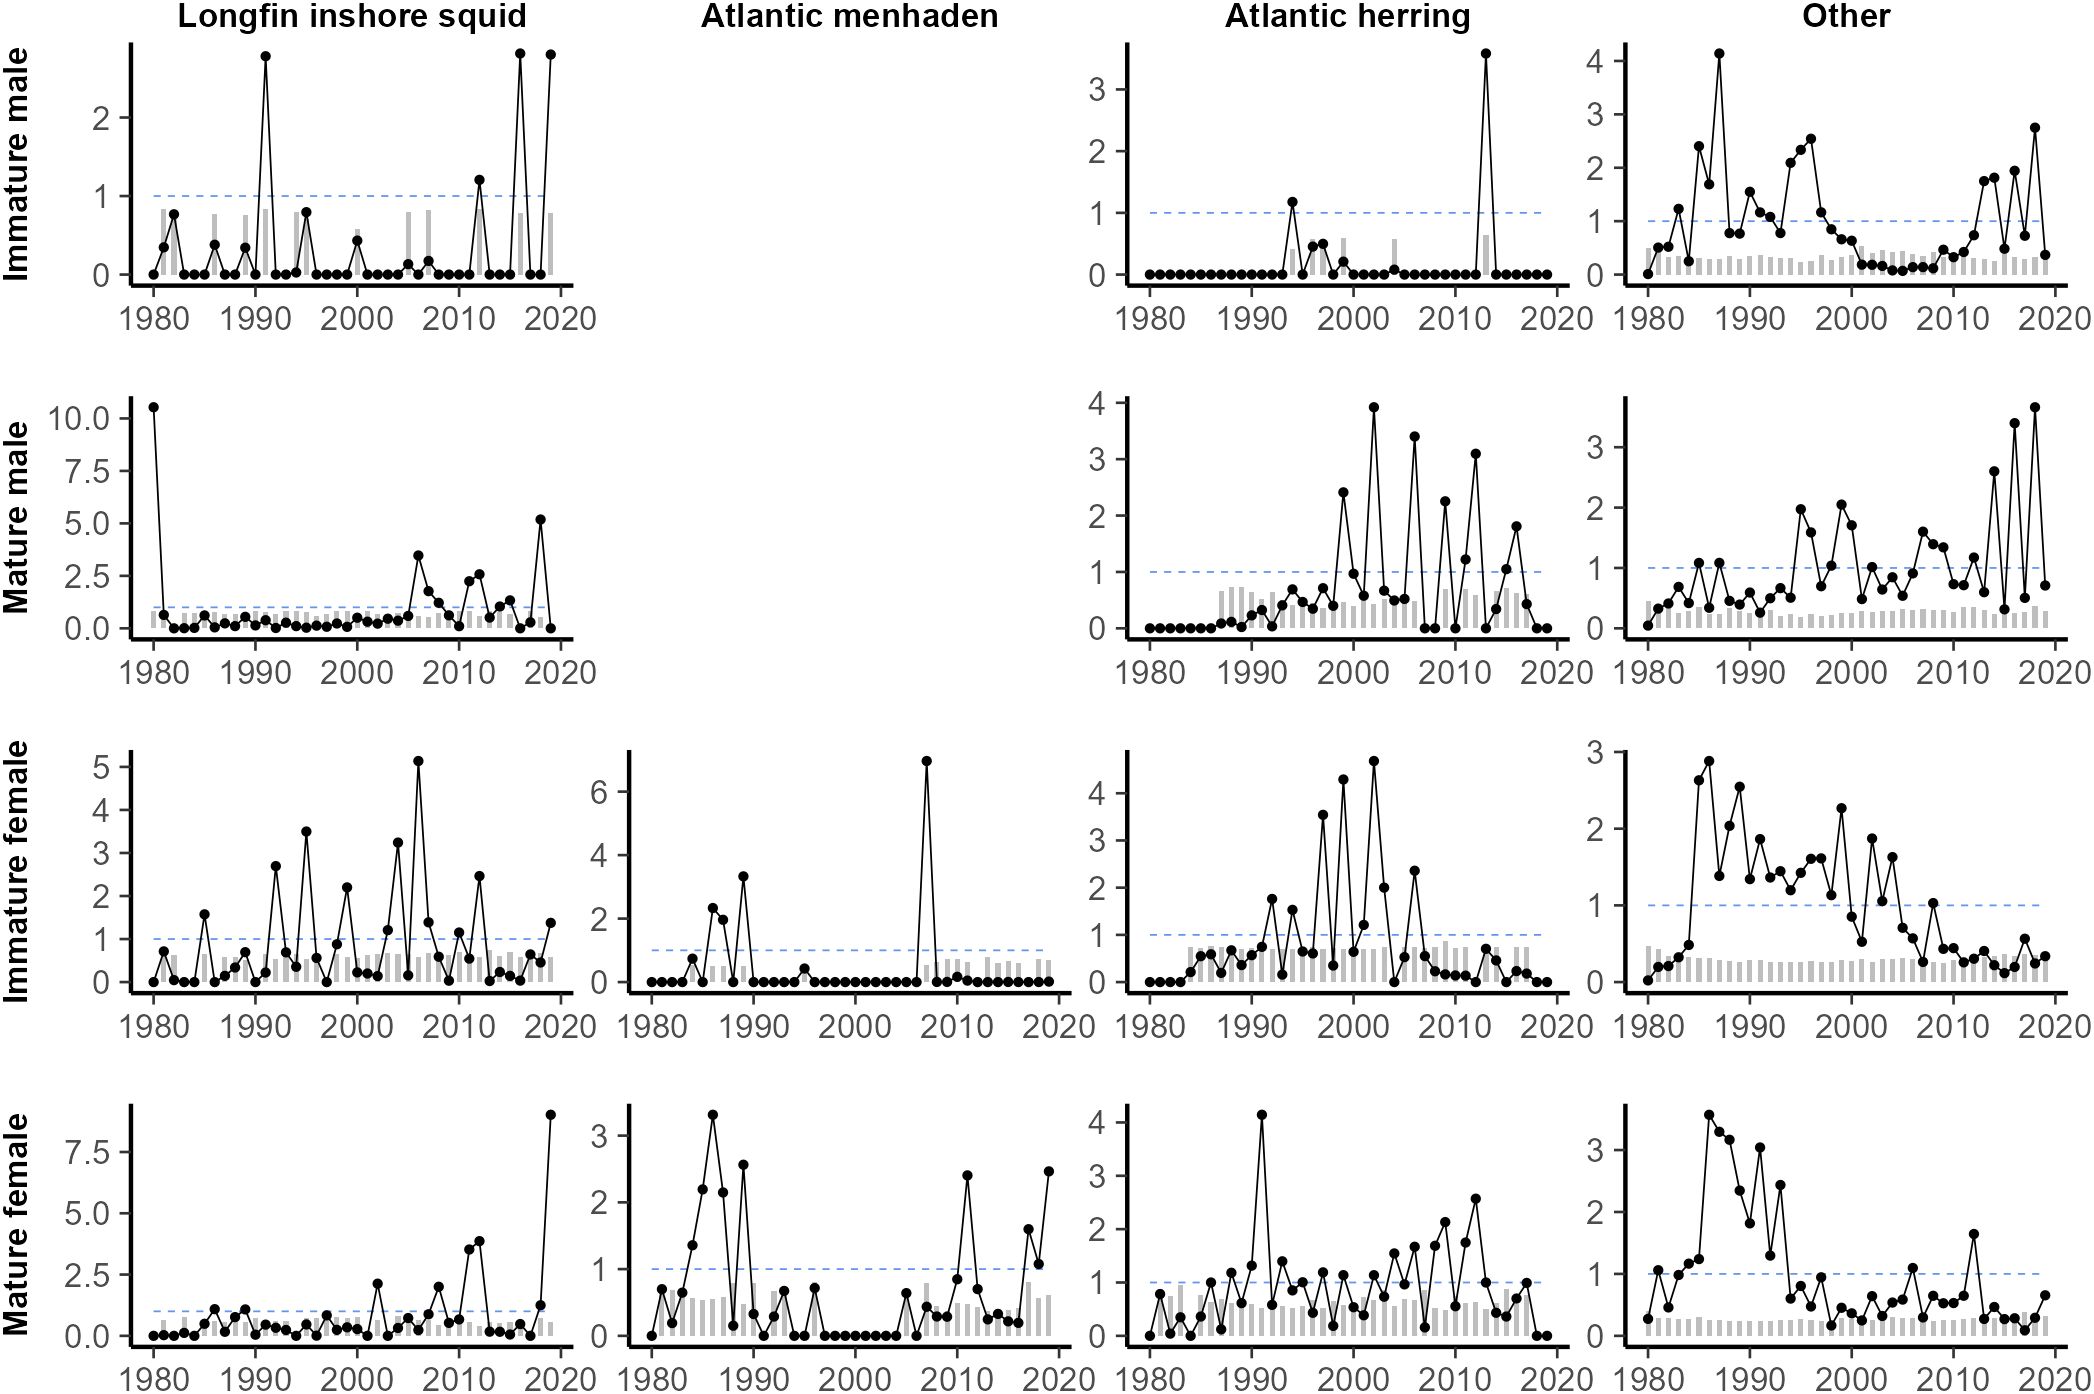
Figure 4. Estimated minimum spring consumption of key prey (kg) by spiny dogfish, separated by maturity stage (length) and sex, scaled to the time series mean for all non-zero years. Grey bars correspond to the yearly coefficient of variation (CV) and the dashed blue lines at y = 1 were included for reference. Years with no prey of a given species found in a predator group stomachs were assumed to be zero.
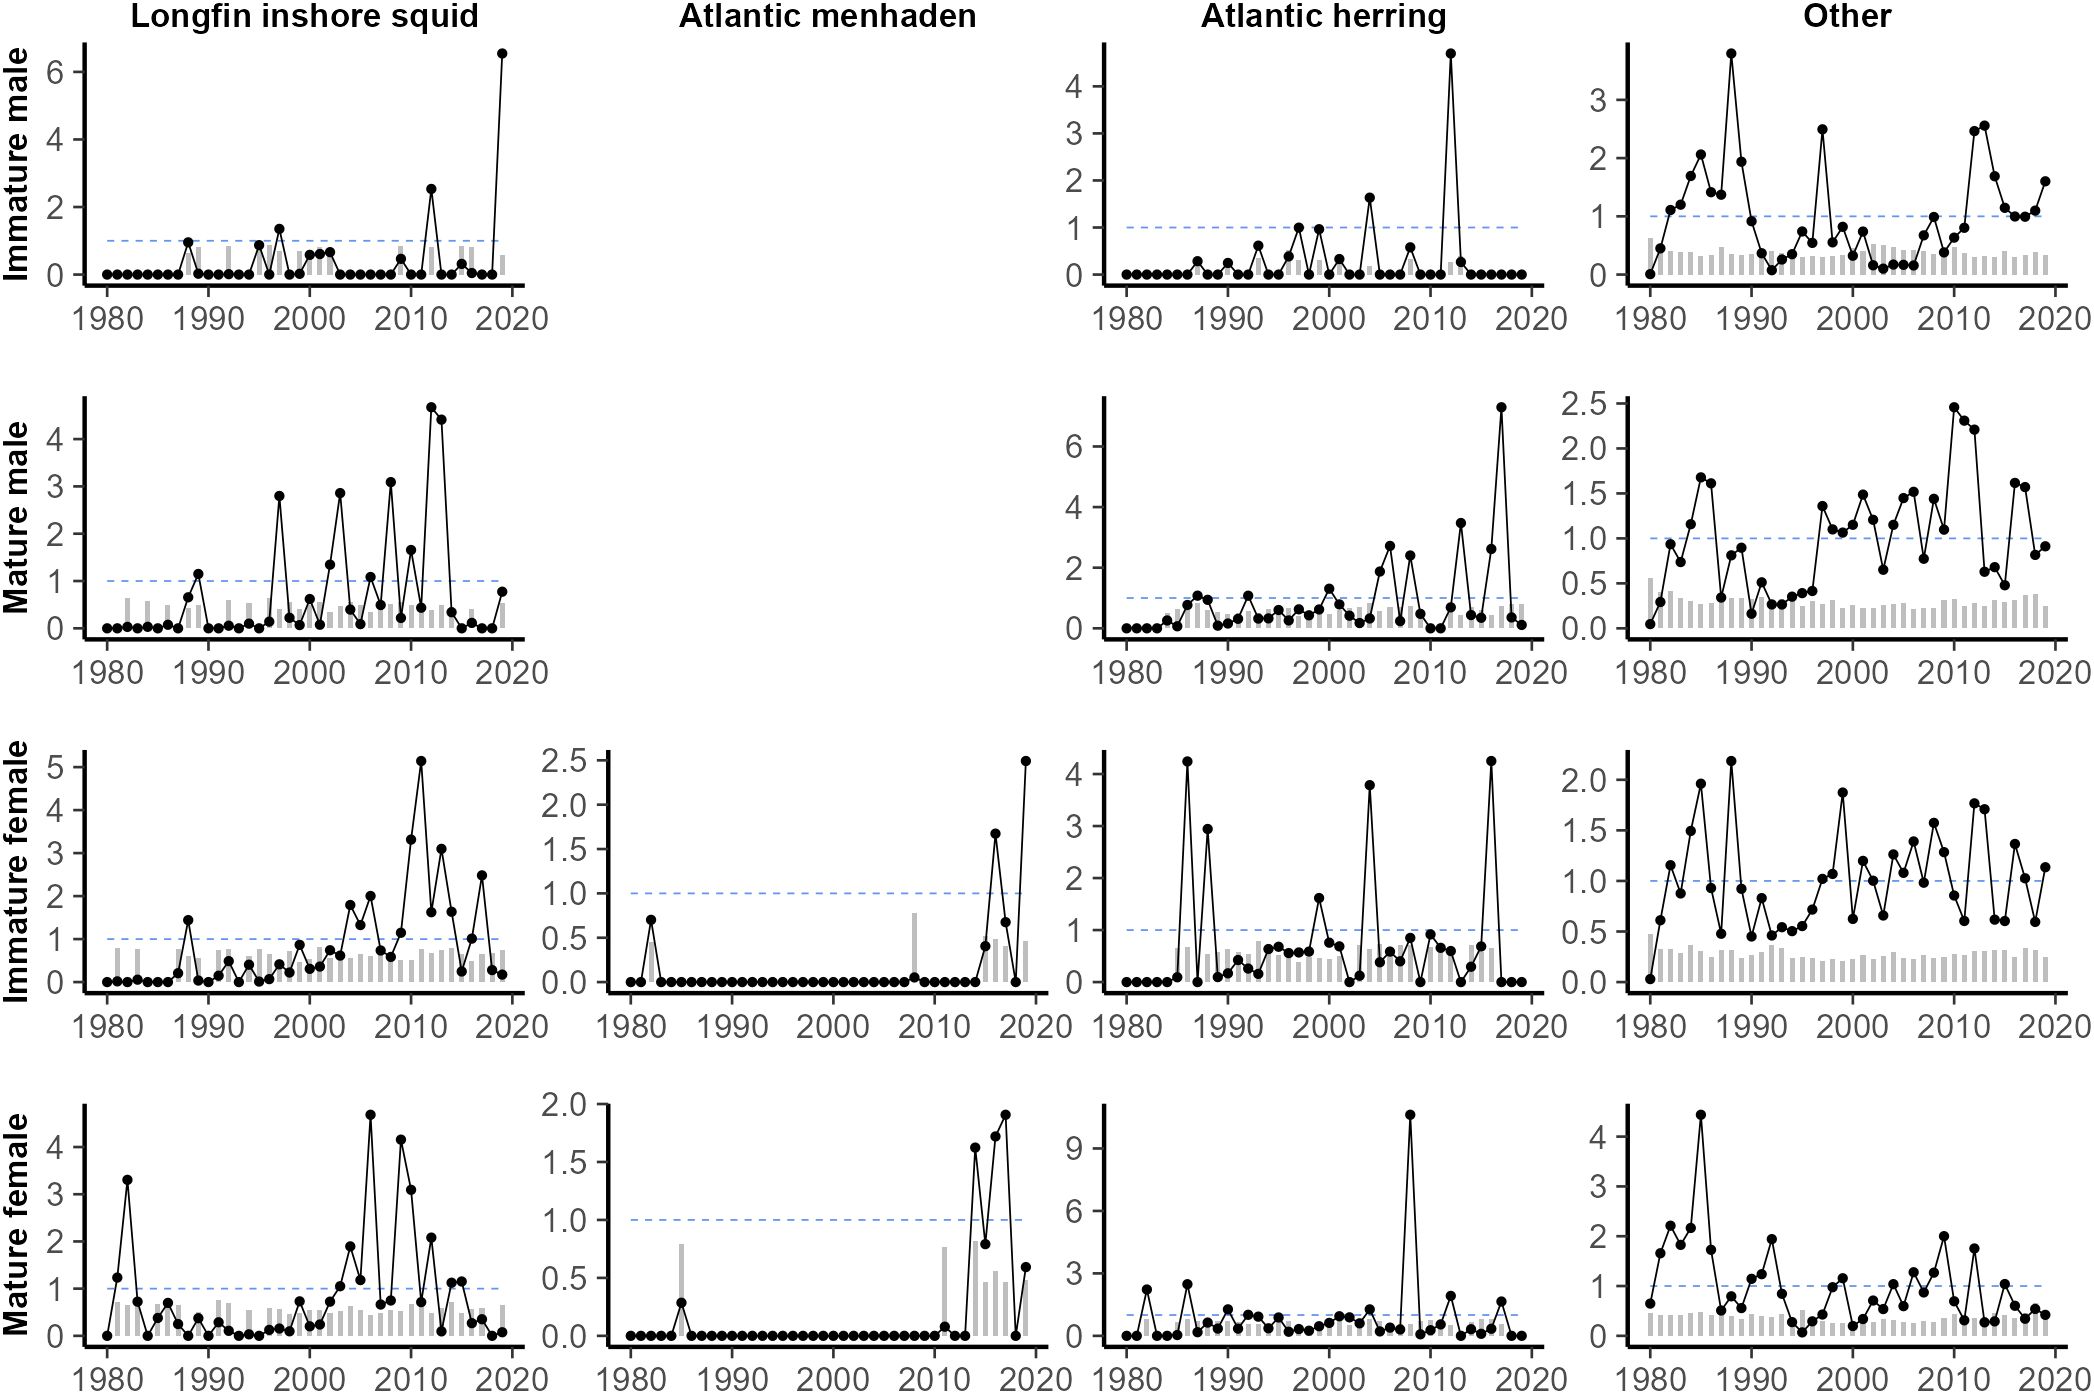
Figure 5. Estimated minimum fall consumption of key prey (kg) by spiny dogfish, separated by maturity stage (length) and sex, scaled to the time series mean for all non-zero years. Grey bars correspond to the yearly coefficient of variation (CV) and the dashed blue lines at y = 1 were included for reference. Years with no prey of a given species found in a predator group stomachs were assumed to be zero.
3.4 Overlap
In spring, the local index of collocation showed that Atlantic menhaden overlapped most with mature females followed by immature females, mature males, and immature males (Figure 6). This trend remained consistent throughout the study period, although in 2009, immature females had a higher overlap compared to mature females. There were no instances where the overlap values for male predator groups exceeded those of female predator groups. In fall, predator overlap with Atlantic menhaden was similar such that mature females had the highest mean overlap followed by immature females, mature males, and immature males. However, all groups showed lower overlap values compared to those from spring. In contrast, predator overlap with longfin inshore squid exhibited considerable variability in both seasons, with each of the four predator groups showing peak overlap in different years, but no clear temporal trend. Overlap with Atlantic herring was generally lower in early years of the study, with a general increase as time progressed, though the consistency of this trend varied between predators.
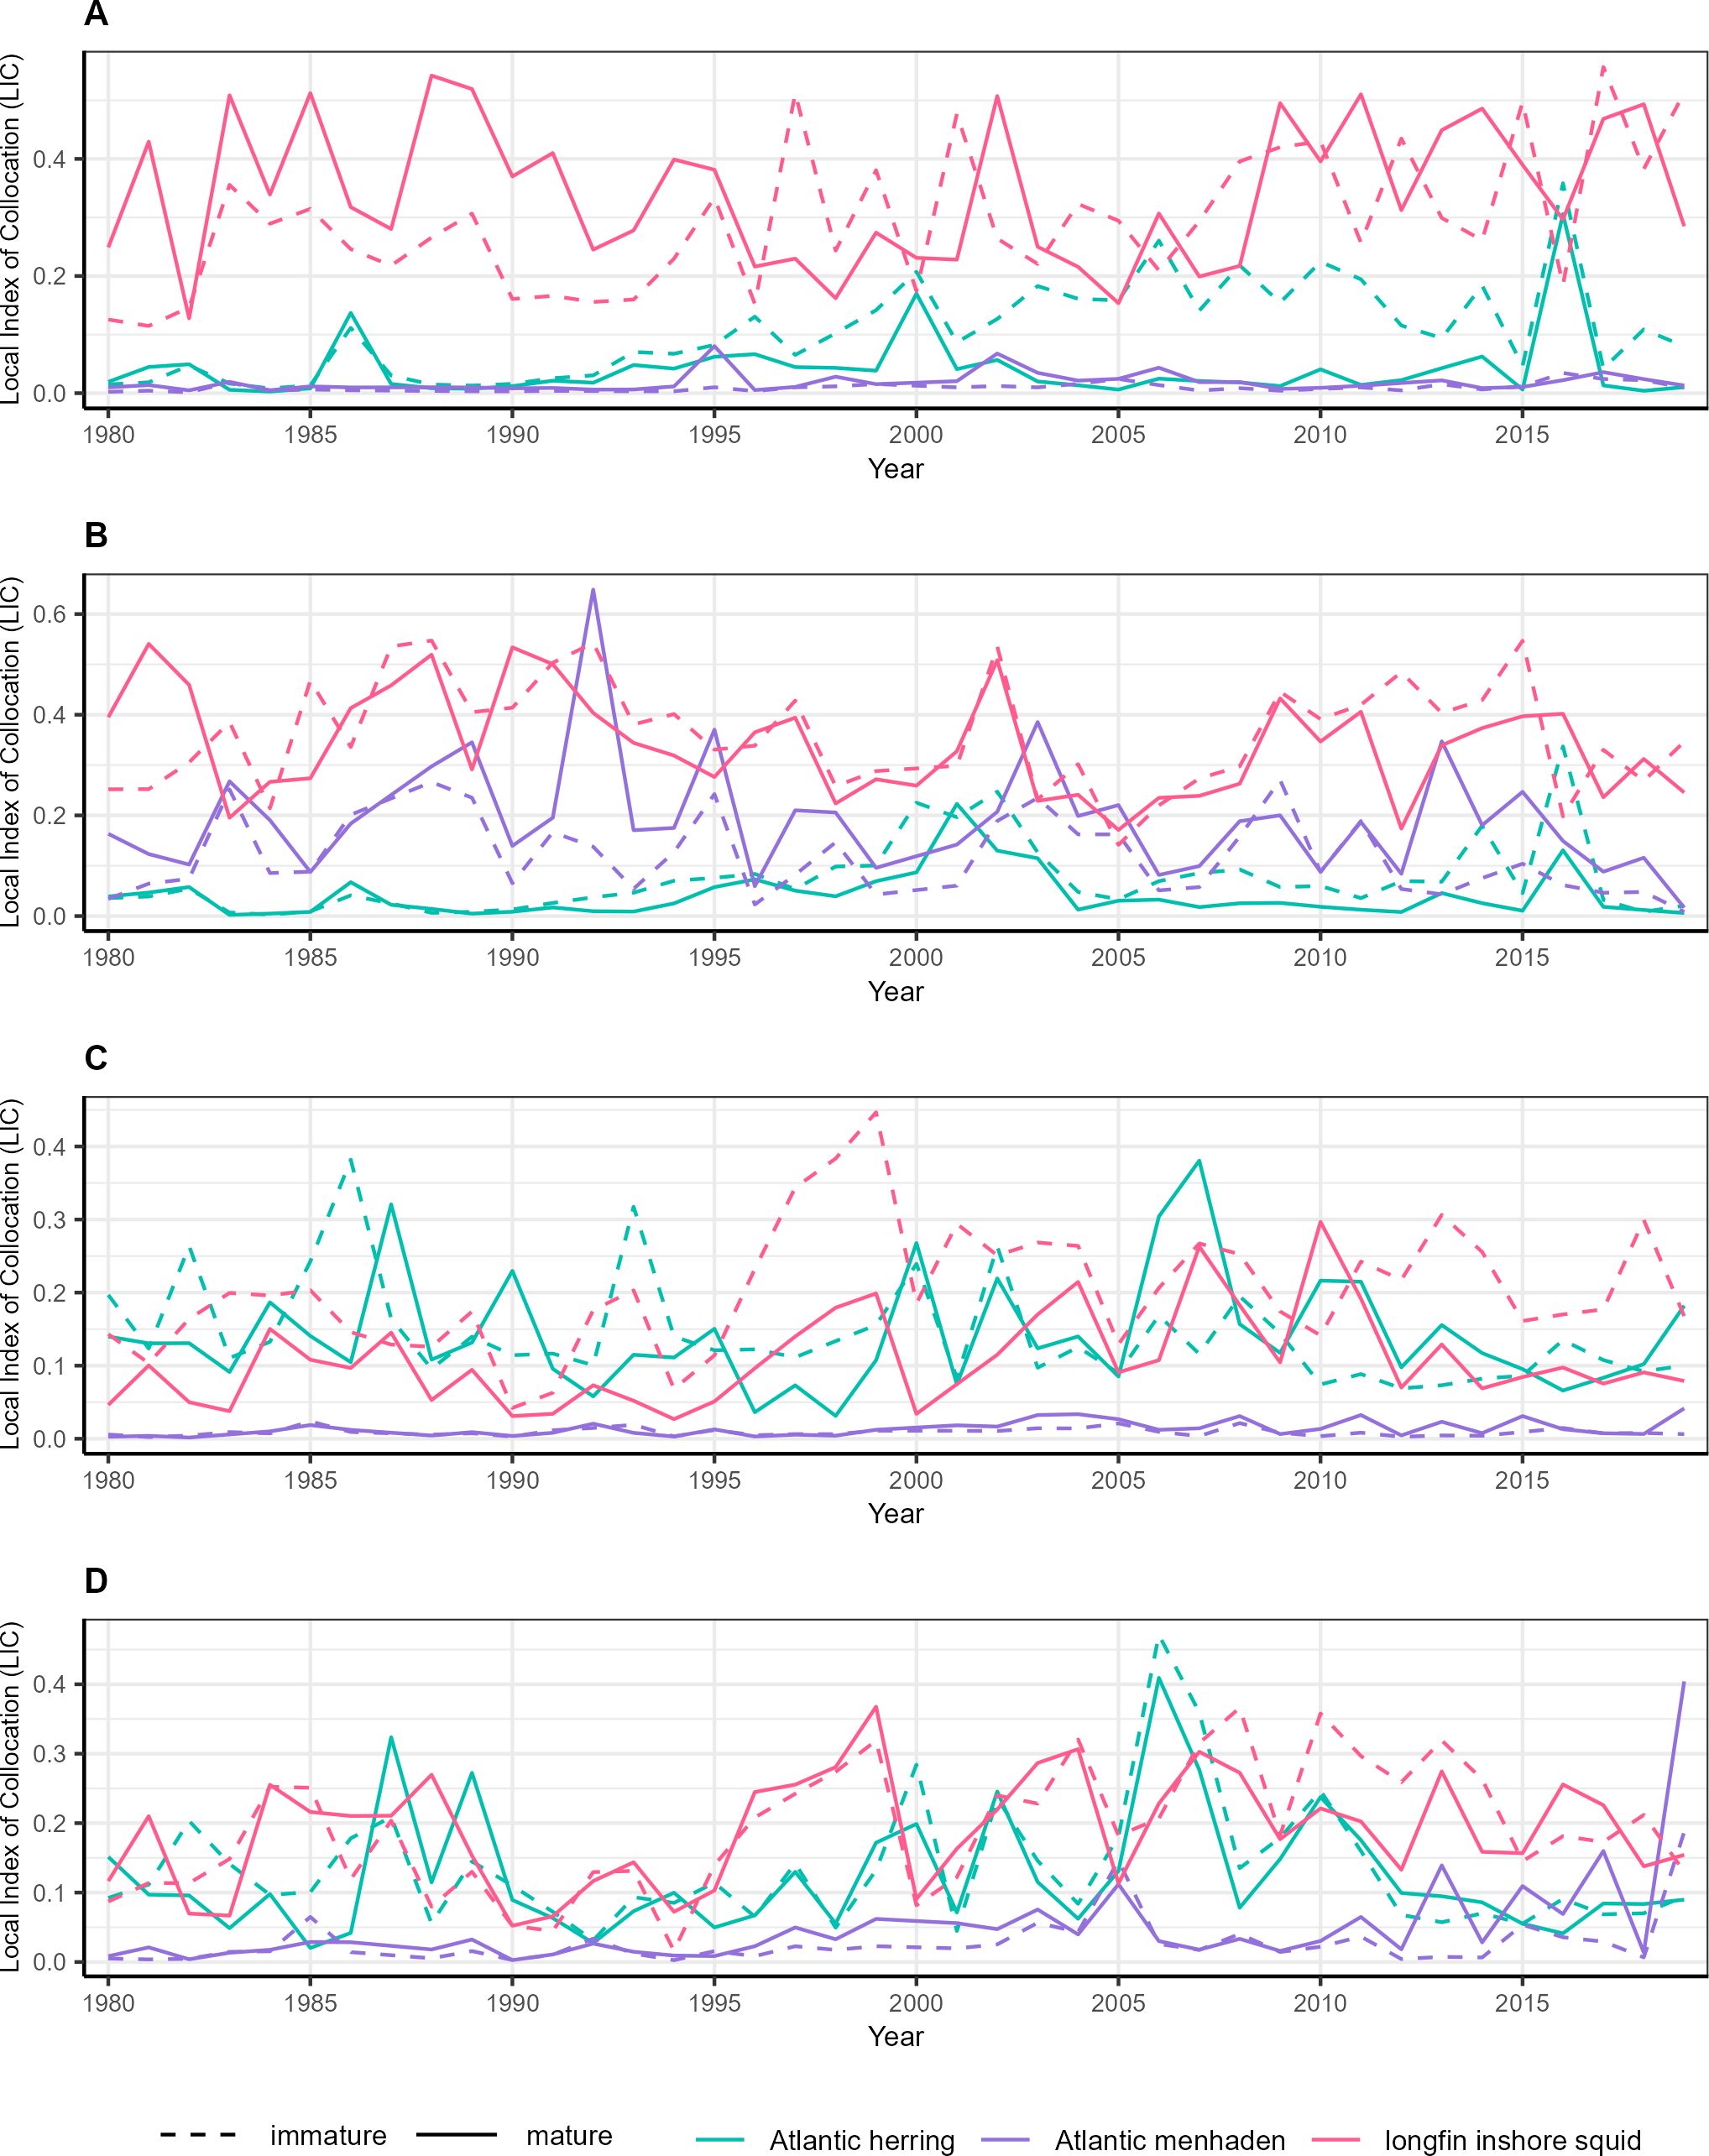
Figure 6. Time series of annualized seasonal predator-prey overlap, defined as local index of collocation, for key prey species and male spiny dogfish (A: spring, C: fall) and female spiny dogfish (B: spring, D: fall), from 1980-2019. Local index of collocation was calculated with associated predator/prey biomass densities across the Northwest Atlantic region that were estimated using catch data from the Northeast Fisheries Science Center and Northeast Area Monitoring and Assessment Program bottom trawl surveys in a multivariate spatiotemporal modelling framework.
3.5 Environmental linkages
For spring consumption by spiny dogfish (Figure 7A), the AMO had significant (adjusted p< 0.05) linkages with consumption of Atlantic herring by mature males; consumption of longfin inshore squid by immature females and mature males; and consumption of aggregate other prey by immature females, mature males, and immature males. The relationships between GSI and the consumption of Atlantic herring by mature males and consumption of aggregate other prey by immature males were also significant (adjusted p< 0.05). The NAO had significant (adjusted p< 0.05) linkages with consumption of Atlantic menhaden and Atlantic herring by immature females, as well as with consumption of longfin inshore squid and aggregate other prey by immature males.
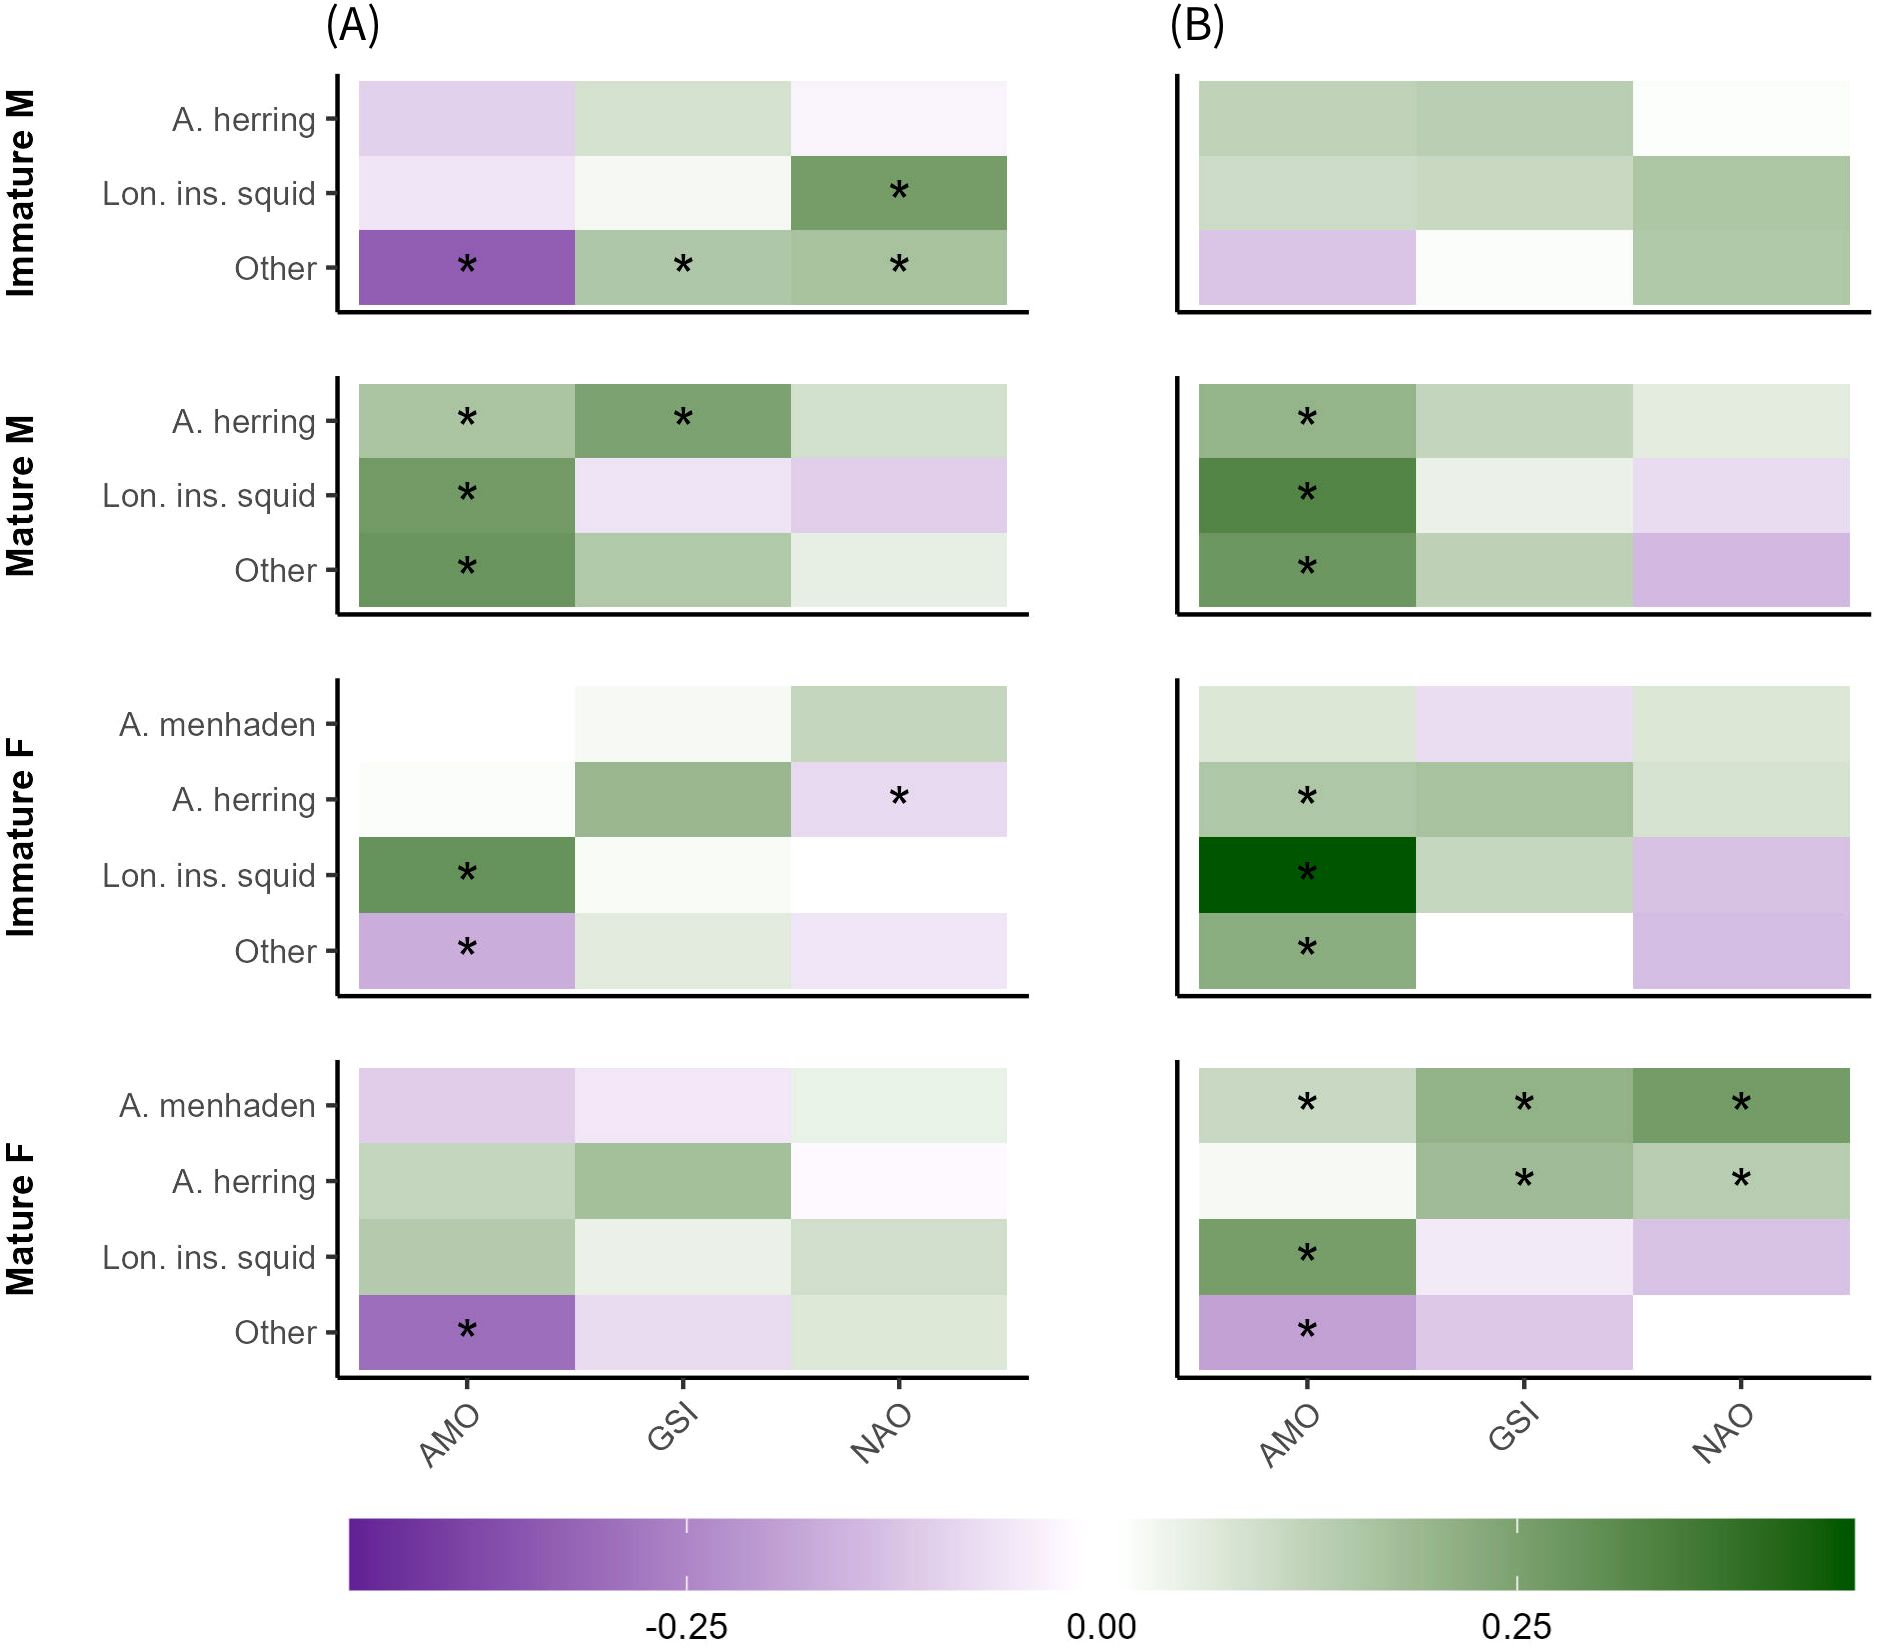
Figure 7. Correlation matrices of climate indices (AMO, GSI, NAO) and spring (A) and fall (B) consumption of key prey species by spiny dogfish, separated by maturity stage (length) and sex. Colors denote values (-1 to 1) for the Kendall Tau non-parametric regressions. Values near 1 indicate highly similar ordering between variables, values near -1 indicate highly dissimilar (inverse) ordering between variables, and values near 0 indicate weak or no similarity/dissimilarity in ordering between variables. Asterisks indicate a significant linkage between a covariate and consumption, based on a repeated median (Siegel) regression (p< 0.05), adjusted for multiple comparisons.
For fall consumption by spiny dogfish (Figure 7B), the AMO had significant (adjusted p< 0.05) linkages with consumption of Atlantic herring by immature females and mature males; consumption of longfin inshore squid by immature females, mature males, and mature females; and consumption of aggregate other prey by immature females, mature males, and mature females. The GSI had a significant (adjusted p< 0.05) linkage consumption of Atlantic herring by mature females, while the relationships between NAO and consumption of Atlantic menhaden by immature females and consumption of Atlantic herring by mature females were also significant (adjusted p< 0.05).
3.6 Prey availability
Of the sixty potential relationships between an availability metric of a prey species (harvest, abundance, or overlap) and its consumption, twenty were significant (p< 0.05, adjusted): four out of eight for Atlantic menhaden, eight out of sixteen for Atlantic herring, and three out of sixteen for longfin inshore squid (Figure 8). Except for annual harvest, all significant relationships between prey availability and consumption of that prey species were positive. Of the ten significant relationships between annual harvest and consumption, six were negative and four were positive, with Atlantic herring consumption generally being positively correlated with harvest while the consumption of Atlantic menhaden and longfin inshore squid were generally negatively correlated with harvest.
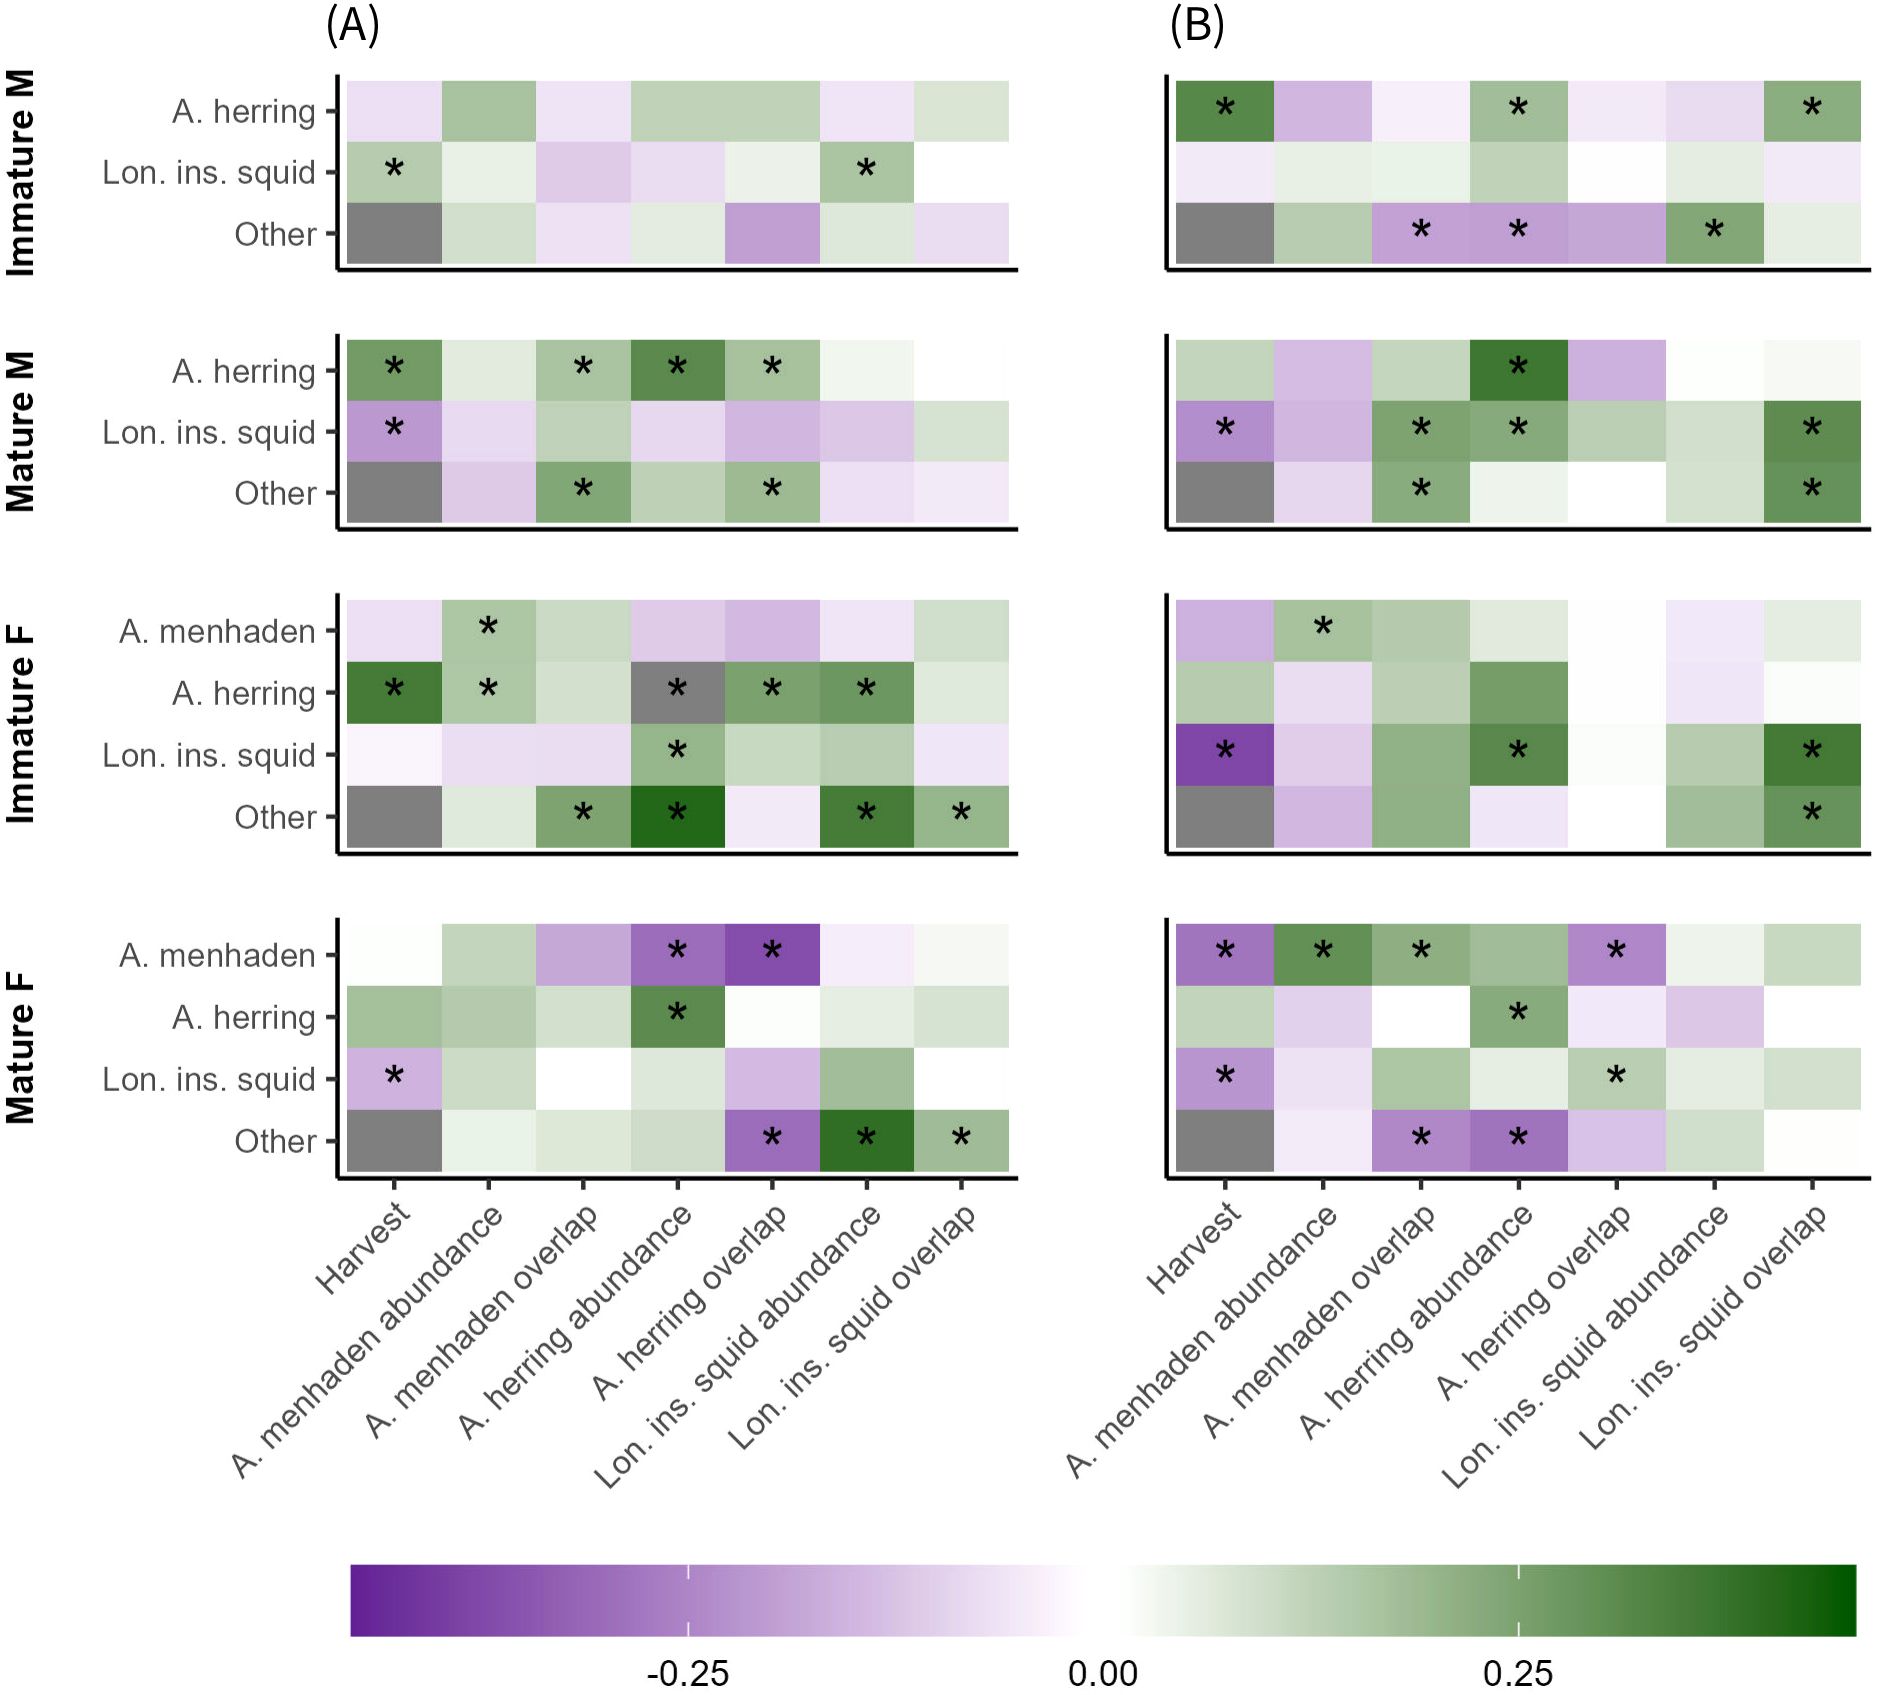
Figure 8. Correlation matrices of prey availability indices (annualized harvest, seasonal abundance, seasonal predator-prey overlap) and spring (A) and fall (B) consumption of key prey species by spiny dogfish, separated by maturity (length) and sex. Colors denote values (-1 to 1) for the Kendall Tau non-parametric regressions. Values near 1 indicate highly similar ordering between variables, values near -1 indicate highly dissimilar (inverse) ordering between variables, and values near 0 indicate weak or no similarity/dissimilarity in ordering between variables. Asterisks indicate a significant linkage between a covariate and consumption, based on a repeated median (Siegel) regression (p< 0.05), adjusted for multiple comparisons.
Prey abundance and overlap were also considered as potential drivers for consumption of other prey species (i.e., consumption of prey species A could be positively or negatively linked with availability of prey B). Twelve significant relationships were found between the availability of one key prey species and the consumption of another, out of eighty possible relationships. Of those twelve relationships, nine were positive and three were negative. Additionally, aggregate ‘other’ prey had twelve positive and five negative linkages with prey availability indices, out of forty-eight possible relationships.
4 Discussion
This study is the first to quantify spiny dogfish prey consumption by sex and maturity stage. Our model-based spatial distributions of these predator groups generally confirmed previous findings showing sexual segregation, with mature females concentrated inshore and males (both stages) and immature females located farther offshore, though all four predator groups were found across the entire study area (Dell’Apa et al., 2014; Haugen et al., 2017). The four species evaluated in this study (spiny dogfish, Atlantic menhaden, Atlantic herring, longfin inshore squid) showed strong seasonal shifts in distribution, and spatial patterns in consumption by spiny dogfish generally followed prey distributions (Hatfield and Cadrin, 2002; Kanwit and Libby, 2008; Carlson et al., 2014; Buchheister et al., 2017). For multiple predator-prey group combinations, the prey of interest was absent from predator stomachs for multiple years. This was likely due to small sample sizes, and consumption estimates for those years were set to zero because each year of the study period was modeled independently. While it is improbable that no interactions occurred between those prey and predators in these years, consumption was likely low such that our results likely provide useful information on the temporal patterns of consumption of key prey. Modeling the year covariate as a random walk or with a first order autoregressive structure to “borrow” information across years has been used previously in VAST to address low sample size issues, and implementing such an approach with data on predator-prey interactions represents a potentially fruitful area of future research (Thorson, 2019).
Of the three annualized covariates representing broad-scale climatic influences on the Northwest Atlantic ecosystem, the AMO was the most consistently linked with consumption of key prey by spiny dogfish. Positive linkages were found between consumption and the AMO for immature females, mature males, and mature females and all three key prey species during both spring and fall. Consumption of longfin inshore squid was positively correlated with AMO consistently for immature females and mature males, while the consumption of other prey in spring by immature males was negatively correlated with this index. Longfin inshore squid populations are known to fluctuate in response to environmental conditions and have been found to correlate with AMO (Collie et al., 2008; Nye et al., 2014; van der Kooij et al., 2016), which may explain their increased consumption by immature female and mature male spiny dogfish during positive AMO phases. Unlike other predator groups, mature female spiny dogfish are typically found in nearshore environments, which may explain why their consumption was less frequently tied with AMO (Haugen et al., 2017). However, both the AMO and gastric evacuation rate approach used to calculate consumption are closely linked to temperature, which raises the possibility that the statistical significance detected was confounded by temperature effects.
The GSI and the NAO were less correlated with annual consumption indices relative to the AMO, though both GSI and NAO were positively linked with consumption of Atlantic menhaden and Atlantic herring by mature females during fall. GSI and NAO are known to be correlated, so the similarities in their linkages with trends in annual consumption are not unreasonable (Taylor and Stephens, 1998; Bellucci and Richards, 2006). However, as the climate indices chosen here did not have a consistent temporal scale, we did not attempt to attribute between-index differences to a specific cause. While the exact mechanisms for the linkages between consumption and these climate indices are unknown, it may be that the position of the Gulf Stream alters habitat suitability for mature females and their prey (and therefore predator-prey interactions) in fall due to shifting temperature regimes (Hurrell and Deser, 2010). Linkages between the consumption of Atlantic herring, longfin inshore squid, and aggregate other prey by immature males, immature females, and mature males during spring may also be tied to shifting temperature patterns or indirect effects on productivity (Feng et al., 2014).
Harvest of prey was found to have both positive and negative correlations with spiny dogfish consumption. Positive correlations, such as with the consumption of Atlantic herring by multiple predator groups during spring and fall, may reflect bottom-up controls on consumption due to prey availability. Both consumption and harvest of prey can increase as prey availability increases (Beverton and Holt, 1993; Smith and Smith, 2020). In contrast, negative correlations between consumption and harvest, as documented for the consumption of Atlantic menhaden in the fall and longfin inshore squid in both seasons by mature females, could be driven by competition between spiny dogfish and fishing fleets for available prey (Hjermann et al., 2004). In this case, it would be challenging to determine whether fishing pressure limits predation or vice versa. Alternatively, it is possible that spiny dogfish are more effective predators of certain prey in habitats that differ from those where harvesting operations are most effective. Commercial fishing tactics and mobile piscivorous predators have distinct constraints, which may not always align (Alós et al., 2012; Olsen et al., 2012). This could create a scenario where prey distribution may favor spiny dogfish predation in one year and commercial harvest in another, creating the appearance of competition.
Significant linkages between the two remaining proxies for prey availability, modeled seasonal prey biomass density and seasonal predator-prey overlap, and consumption represented three general categories. The first category included those that support the hypothesis that prey availability governs consumption. Positive correlations between prey availability and consumption were detected for several predator-prey group combinations but were most prevalent for the consumption of Atlantic herring during both seasons and Atlantic menhaden in the fall. While no significant linkages were found between longfin squid abundance and consumption, there were significant correlations between overlap of immature female and mature male spiny dogfish and longfin inshore squid in fall, suggesting the importance of local prey availability due to predator-prey co-occurrence as opposed to broader, ecosystem-level availability resulting from shifts in prey population size (Schmitz et al., 2017).
The second category of linkages represented negative correlations between availability of one prey and consumption of another by spiny dogfish. These inverse relationships were detected between Atlantic herring and Atlantic menhaden, and may reflect “prey switching” (Murdoch, 1969). Prey switching occurs when predators preferentially consume the most available prey species, and is derived from optimal foraging theory, which predicts that there are circumstances where it is favorable for a predator to choose a more beneficial source of prey even if it means missing opportunities to hunt other prey species (Hubbard et al., 1982). Prey switching has been documented previously in the Northwest Atlantic (Fogarty et al., 1991; Overholtz et al., 2000; Link and Garrison, 2002; Buren et al., 2012), though this study is the first to show potential prey switching between Atlantic herring and Atlantic menhaden by spiny dogfish. While not explicitly modeled, prey switching is a key part of the theoretical underpinning for Holling’s Type III functional response relationship, which has been reported to best describe predation by most piscivores in the Northwest Atlantic, including spiny dogfish (Holling, 1959; Smith and Smith, 2020).
The third category of significant linkages included positive relationships between the availability of one prey species and the consumption of another. This relationship was most frequently detected between the consumption of longfin inshore squid and availability of Atlantic herring in the fall. There are a few potential explanations that might support this relationship. First, adult Atlantic herring and juvenile longfin inshore squid have overlapping diets, both consuming large amounts of euphausiids and chaetognaths (Bowman et al., 2000; Jacobson, 2005). This may tie the availability of both prey species to similar covariates such that when environmental conditions favor euphausiids or chaetognaths, both Atlantic herring and longfin inshore squid populations may respond positively, either regionally or locally. Second, adult longfin inshore squid feed heavily on small fishes in the fall, including clupeids such as Atlantic herring (Jacobson, 2005). Consequently, years with greater regional herring populations may concentrate longfin inshore squid and spiny dogfish into the same foraging habitat, with greater consumption of longfin inshore squid by spiny dogfish due to their increased availability.
Sex and maturity stage both played a role in consumption of key prey by spiny dogfish. Most notably, male spiny dogfish of both maturity stages consumed negligible amounts of Atlantic menhaden, even when found in nearshore waters, except for during 2016. In contrast, both immature and mature females consumed relatively large quantities of Atlantic menhaden in nearshore waters, with Atlantic menhaden comprising the largest component of consumption by mature females in the nearshore NEAMAP survey, even exceeding unidentified fishes. The reduced consumption of Atlantic menhaden by male spiny dogfish may be due to their smaller size, or greater depth preferences, as Atlantic menhaden schools are typically found in shallower habitats close to the surface. Further, when mature male spiny dogfish move to inshore habitats, they may be pursuing females rather than foraging. In numerous cases, prey consumption by one or more predator groups had a significant linkage with a given environmental covariate or prey availability index while consumption of the same prey by one or more other predator groups did not. This supports the hypothesis that sex and maturity influence the role of spiny dogfish as a predator. Dietary changes with maturity are expected, as spiny dogfish are known to undergo an ontogenetic shift towards piscivory (Koen Alonso et al., 2002; Bangley and Rulifson, 2014). Despite this, relationships between the consumption of a prey species and covariate changed directions across predator groups only occasionally, such as in the relationship between longfin squid harvest and fall squid consumption by immature males versus mature males and females. However, this phenomenon did manifest several times for the aggregate prey category, potentially pointing to greater differences in predatory habits with prey outside the three key species considered in this study. Potential candidate prey types for future evaluation include ctenophores, mackerels, or hakes. Unidentified prey (whether unidentified invertebrate, unidentified bony fish, or simply “animal remains”) was frequently the largest component of each spiny dogfish category by mass, highlighting the information loss that occurs when prey items cannot be identified. This reinforces the importance of pursuing identification to the lowest taxonomic level whenever possible, whether through more in-depth visual examination, molecular means, or a combination of both.
One additional influence we did not examine quantitatively was the direct impact of fishing pressure on consumptive removals by spiny dogfish. As a response to the decline of groundfish stocks, directed fishing pressure on spiny dogfish increased in the 1980s. After a period of intense fishing, the estimated biomass of spawning stock females was markedly low from the mid-1990s through the mid-2000s (Rago et al., 1998). As estimated predator biomass was used to calculate consumption, this reduction in predator biomass undoubtedly had an influence on consumptive removals in the region. This may explain some of the temporal patterns seen in the consumption of Atlantic menhaden and aggregate other prey by mature females. This pattern was not consistent across all predator groups or prey species but may warrant further examination by future researchers interested in the role of fishing pressure on consumptive removals by spiny dogfish and other exploited predatory species.
Overall, prey availability was found to be an important covariate for consumption of Atlantic menhaden, Atlantic herring, and longfin inshore squid by spiny dogfish, a dominant mid to upper trophic level predator in the Northwest Atlantic. Of the consumption linkages detected, the most relevant to regional fisheries management were likely the negative relationships between Atlantic herring availability and Atlantic menhaden consumption by female spiny dogfish, and the positive linkages between Atlantic herring availability and longfin inshore squid consumption. Atlantic menhaden are currently managed using an ecosystem approach to fisheries management (EAFM). While the associated ecosystem model considered five focal species that included four Atlantic menhaden predators (Atlantic striped bass, bluefish, spiny dogfish, weakfish) and Atlantic herring as an alternative prey, the final model selected only included striped bass, as it was the most sensitive predator to changes in levels of Atlantic menhaden biomass (Chagaris et al., 2020). It has been noted that the model originally showed high sensitivity to changes in Atlantic herring abundance, but this was attributed to model structure rather than a true ecological relationship (Anstead et al., 2021). The results from this investigation suggest that this omission should be reconsidered and that further research be dedicated to the effects of prey switching and alternate prey as management entities seek to incorporate ecological drivers into management plans across the Northwest Atlantic.
The linkages between longfin inshore squid consumption and Atlantic herring availability, combined with the known feeding ecology of Atlantic herring and longfin inshore squid, highlight a possibly complex dynamic between the two species. Indeed, longfin inshore squid may serve as both a competitor and predator to Atlantic herring, an alternative prey to higher trophic level predators of Atlantic herring including spiny dogfish, and both a predator and prey to themselves through cannibalism. As longfin inshore squid and Atlantic herring management entities consider ecological covariates in future management plans, incorporating these interactions may prove a challenging yet valuable area of research. Furthermore, as the distribution of spiny dogfish did not closely match any single prey species, future studies attempting to disentangle the ecological and environmental patterns of spiny dogfish distributions are warranted. As ocean conditions continue to change due to rising sea surface temperatures and associated climatological shifts, understanding habitat suitability and the ecological constraints of ecologically and economically important species, including spiny dogfish, will undoubtedly become increasingly important to the effective management of ecosystem services and living resources in the region.
Data availability statement
The raw data supporting the conclusions of this article will be made available by the authors, without undue reservation.
Ethics statement
The animal study was approved by William & Mary IACUC (protocol #2023-0098). The study was conducted in accordance with the local legislation and institutional requirements.
Author contributions
CD: Conceptualization, Data curation, Formal Analysis, Investigation, Methodology, Project administration, Software, Visualization, Writing – original draft, Writing – review & editing. JG: Conceptualization, Writing – review & editing, Data curation, Methodology, Validation. RL: Conceptualization, Funding acquisition, Supervision, Writing – review & editing, Methodology, Validation.
Funding
The author(s) declare financial support was received for the research and/or publication of this article. This manuscript was prepared by the authors under award number NA22NMF4540361 from the National Oceanic and Atmospheric Administration, U.S. Department of Commerce. The statements, findings, conclusions, and recommendations are those of the authors and do not necessarily reflect the views of the National Oceanic and Atmospheric Administration or the Department of Commerce.
Acknowledgments
The authors wish to acknowledge the field and laboratory efforts of past and present members associated with the NEAMAP survey at the Virginia Institute of Marine Science as well as the NEFSC survey. The authors also wish to acknowledge William & Mary HPC for providing the computer power necessary to conduct this research in an efficient manner.
Conflict of interest
The authors declare that the research was conducted in the absence of any commercial or financial relationships that could be construed as a potential conflict of interest.
Generative AI statement
The author(s) declare that no Generative AI was used in the creation of this manuscript.
Publisher’s note
All claims expressed in this article are solely those of the authors and do not necessarily represent those of their affiliated organizations, or those of the publisher, the editors and the reviewers. Any product that may be evaluated in this article, or claim that may be made by its manufacturer, is not guaranteed or endorsed by the publisher.
Supplementary material
The Supplementary Material for this article can be found online at: https://www.frontiersin.org/articles/10.3389/fmars.2025.1621343/full#supplementary-material
References
Alós J., Palmer M., and Arlinghaus R. (2012). Consistent Selection towards Low Activity Phenotypes When Catchability Depends on Encounters among Human Predators and Fish. PloS One 7, e48030. doi: 10.1371/journal.pone.0048030
Anstead K. A., Drew K., Chagaris D., Schueller A. M., McNamee J. E., Buchheister A., et al. (2021). The path to an ecosystem approach for forage fish management: A case study of atlantic menhaden. Front. Mar. Sci. 8. doi: 10.3389/fmars.2021.607657
Bangley C. W. and Rulifson R. A. (2014). Feeding habits, daily ration, and potential predatory impact of mature female spiny dogfish in north carolina coastal waters. North Am. J. Fisheries Manage. 34, 668–677. doi: 10.1080/02755947.2014.902410
Bellucci A. and Richards K. J. (2006). Effects of NAO variability on the North Atlantic Ocean circulation. Geophysical Res. Lett. 33. doi: 10.1029/2005GL024890
Beverton R. J. H. and Holt S. J. (1993). On the dynamics of exploited fish populations. Available online at: https://link.springer.com/book/10.1007/978-94-011-2106-4 (Accessed July 29, 2024).
Bowman R. E., Stillwell C. E., Michaels W. L., and Grosslein M. D. (2000). Food of northwest Atlantic fishes and two common species of squid. NOAA Technical Memorandum NMFS-NE-155. U.S. Department of Commerce, National Oceanic and Atmospheric Administration. Available online at: https://repository.library.noaa.gov/view/noaa/4064.
Buchheister A., Miller T. J., and Houde E. D. (2017). Evaluating ecosystem-based reference points for atlantic menhaden. Mar. Coast. Fisheries 9, 457–478. doi: 10.1080/19425120.2017.1360420
Buren A. D., Koen-Alonso M., and Montevecchi W. A. (2012). Linking predator diet and prey availability: common murres and capelin in the Northwest Atlantic. Mar. Ecol. Prog. Ser. 445, 25–35. doi: 10.3354/meps09465
Carlson A. E., Hoffmayer E. R., Tribuzio C. A., and Sulikowski J. A. (2014). The Use of Satellite Tags to Redefine Movement Patterns of Spiny Dogfish (Squalus acanthias) along the U.S. East Coast: Implications for Fisheries Management. PloS One 9, e103384. doi: 10.1371/journal.pone.0103384
Carroll G., Holsman K. K., Brodie S., Thorson J. T., Hazen E. L., Bograd S. J., et al. (2019). A review of methods for quantifying spatial predator–prey overlap. Global Ecol. Biogeography 28, 1561–1577. doi: 10.1111/geb.12984
Chagaris D., Drew K., Schueller A., Cieri M., Brito J., and Buchheister A. (2020). Ecological reference points for atlantic menhaden established using an ecosystem model of intermediate complexity. Front. Mar. Sci. 7. doi: 10.3389/fmars.2020.606417
Chen S.-Y., Feng Z., and Yi X. (2017). A general introduction to adjustment for multiple comparisons. J. Thorac. Dis. 9, 1725–1729. doi: 10.21037/jtd.2017.05.34
Collie J., Wood A., and Jeffries H. (2008). Long-term shifts in the species composition of a coastal fish community. Can. J. Fisheries Aquat. Sci. 65, 1352–1365. doi: 10.1139/F08-048
Dell’Apa A., Bangley C. W., and Rulifson R. A. (2015). Who let the dogfish out? A review of management and socio-economic aspects of spiny dogfish fisheries. Rev. Fish Biol. Fisheries 25, 273–295. doi: 10.1007/s11160-014-9379-1
Dell’Apa A., Cudney-Burch J., Kimmel D. G., and Rulifson R. A. (2014). Sexual segregation of spiny dogfish in fishery-dependent surveys in cape cod, massachusetts: potential management benefits. Trans. Am. Fisheries Soc. 143, 833–844. doi: 10.1080/00028487.2013.869257
Dell’Apa A., Pennino M. G., Bangley C. W., and Bonzek C. (2018). A hierarchical bayesian modeling approach for the habitat distribution of smooth dogfish by sex and season in inshore coastal waters of the U.S. Northwest atlantic. Mar. Coast. Fisheries 10, 590–605. doi: 10.1002/mcf2.10051
Dell’Apa A., Pennino M., and Bonzek C. (2017). Modeling the habitat distribution of spiny dogfish (Squalus acanthias), by sex, in coastal waters of the northeastern United States. Fishery Bull. 115, 89–100. doi: 10.7755/FB.115.1.8
Economakis A. E. and Lobel P. S. (1998). Aggregation behavior of the grey reef shark, Carcharhinus amblyrhynchos, at Johnston Atoll, Central Pacific Ocean. Environ. Biol. Fishes 51, 129–139. doi: 10.1023/A:1007416813214
Eggers D. M. (1977). Factors in interpreting data obtained by diel sampling of fish stomachs. J. Fish. Res. Bd. Can. 34, 290–294. doi: 10.1139/f77-045
Elliott J. M. and Persson L. (1978). The estimation of daily rates of food consumption for fish. J. Anim. Ecol. 47, 977–991. doi: 10.2307/3682
Enfield D. B., Mestas-Nuñez A. M., and Trimble P. J. (2001). The Atlantic Multidecadal Oscillation and its relation to rainfall and river flows in the continental U.S. Geophysical Res. Lett. 28, 2077–2080. doi: 10.1029/2000GL012745
Essington T. E. and Munch S. B. (2014). Trade-offs between supportive and provisioning ecosystem services of forage species in marine food webs. Ecol. Appl. 24, 1543–1557. doi: 10.1890/13-1403.1
Feng J., Stige L. C., Durant J. M., Hessen D. O., Zhu L., Hjermann D.Ø., et al. (2014). Large-scale season-dependent effects of temperature and zooplankton on phytoplankton in the North Atlantic. Mar. Ecol. Prog. Ser. 502, 25–37. doi: 10.3354/meps10724
Fogarty M., Cohen E., Michaels W., and Morse W. (1991). Predation and the regulation of sand lance populations: an exploratory analysis. ICES Mar. Sci. Symp. 193, 120–124.
Fogarty M. J. and Murawski S. A. (1998). Large-scale disturbance and the structure of marine systems: fishery impacts on georges bank. Ecol. Appl. 8, S6–S22. doi: 10.1890/1051-0761(1998)8[S6:LDATSO]2.0.CO;2
Fulton E. A., Smith A. D. M., and Johnson C. R. (2003). Mortality and predation in ecosystem models: is it important how these are expressed? Ecol. Model. 169, 157–178. doi: 10.1016/S0304-3800(03)00268-0
Garrison L. P. and Link J. S. (2000). Dietary guild structure of the fish community in the Northeast United States continental shelf ecosystem. Mar. Ecol. Prog. Ser. 202, 231–240. doi: 10.3354/meps202231
Gartland J., Gaichas S. K., and Latour R. J. (2023). Spatiotemporal patterns in the ecological community of the nearshore Mid-Atlantic Bight. Mar. Ecol. Prog. Ser. 704, 15–33. doi: 10.3354/meps14235
Gartland J. and Latour R. J. (2024). Disentangling bottom-up and top-down controls on fish consumption of key prey in the Northeast US Shelf ecosystem. ICES J. Mar. Sci. 81, 1669–1684. doi: 10.1093/icesjms/fsae115
Harfmart K. J. and Brandt S. B. (1995). Predatory demand and impact of striped bass, bluefish, and weakfish in the Chesapeake Bay: applications of bioenergetics models. Can. J. Fisheries Aquat. Sci. 52, 1667–1687. doi: 10.1139/f95-760
Hatfield E. M. C. and Cadrin S. X. (2002). Geographic and temporal patterns in size and maturity of the longfin inshore squid off the northeastern United States. Fishery Bull. 100, 200–213.
Haugen J. B., Curtis T. H., Fernandes P. G., Sosebee K. A., and Rago P. J. (2017). Sexual segregation of spiny dogfish (Squalus acanthias) off the northeastern United States: Implications for a male-directed fishery. Fisheries Res. 193, 121–128. doi: 10.1016/j.fishres.2017.04.007
Hjermann D.Ø., Ottersen G., and Stenseth N.C. (2004). Competition among fishermen and fish causes the collapse of Barents Sea capelin. Proc. Natl. Acad. Sci. 101, 11679–11684. doi: 10.1073/pnas.0402904101
Hochberg Y. (1988). A sharper Bonferroni procedure for multiple tests of significance. Biometrika 75, 800–802. doi: 10.2307/2336325
Holling C. S. (1959). The components of predation as revealed by a study of small-mammal predation of the European Pine Sawfly1. Can. entomologist 91, 293–320. doi: 10.4039/Ent91293-5
Hubbard S. F., Cook R. M., Glover J. G., and Greenwood J. J. D. (1982). Apostatic selection as an optimal foraging strategy. J. Anim. Ecol. 51, 625–633. doi: 10.2307/3987
Hurrell J. W. (1995). Decadal trends in the North Atlantic Oscillation: Regional temperatures and precipitation. Science 269, 676. doi: 10.1126/science.269.5224.676
Hurrell J. W. and Deser C. (2010). North Atlantic climate variability: The role of the North Atlantic Oscillation. J. Mar. Syst. 79, 231–244. doi: 10.1016/j.jmarsys.2009.11.002
Jacobson L. D. (2005). “Essential fish habitat source document,” in Longfin inshore squid, Loligo pealeii, life history and habitat characteristics. NOAA Tech Memo NMFS‑NE‑193. (Woods Hole, MA: National Oceanic and Atmospheric Administration, National Marine Fisheries Service, Northeast Fisheries Science Center). Available online at: https://repository.library.noaa.gov/view/noaa/4035.
Joyce T. M., Kwon Y.-O., Seo H., and Ummenhofer C. C. (2019). Meridional gulf stream shifts can influence wintertime variability in the north atlantic storm track and Greenland blocking. Geophysical Res. Lett. 46, 1702–1708. doi: 10.1029/2018GL081087
Kanwit J. K. and Libby D. A. (2008). Seasonal movements of Atlantic herring (Clupea harengus): results from a four year tagging study conducted in the Gulf of Maine and Southern New England. J. Northwest Atlantic Fishery Sci. 40, 29–39. doi: 10.2960/J.v40.m577
Kass R. E. and Steffey D. (1989). Approximate bayesian inference in conditionally independent hierarchical models (Parametric empirical bayes models). J. Am. Stat. Assoc. 84, 717–726. doi: 10.2307/2289653
Kendall M. G. (1955). Further contributions to the theory of paired comparisons. Biometrics 11, 43–62. doi: 10.2307/3001479
Koen Alonso M., Alberto Crespo E., Aníbal García N., Noemí Pedraza S., Ariel Mariotti P., and Judith Mora N. (2002). Fishery and ontogenetic driven changes in the diet of the spiny dogfish, squalus acanthias, in patagonian waters, Argentina. Environ. Biol. Fishes 63, 193–202. doi: 10.1023/A:1014229432375
Link J. S. and Garrison L. P. (2002). Changes in piscivory associated with fishing induced changes to the finfish community on Georges Bank. Fisheries Res. 55, 71–86. doi: 10.1016/S0165-7836(01)00300-9
Link J. S. and Marshak A. R. (2021). “So what?,” in ecosystem-based fisheries management: progress, importance, and impacts in the United States. Eds. Link J. S. and Marshak A. R. (Oxford, UK: Oxford University Press), 651–662. doi: 10.1093/oso/9780192843463.003.0013
Link J., Overholtz W., O’Reilly J., Green J., Dow D., Palka D., et al. (2008). The Northeast U.S. continental shelf Energy Modeling and Analysis exercise (EMAX): Ecological network model development and basic ecosystem metrics. J. Mar. Syst. 74, 453–474. doi: 10.1016/j.jmarsys.2008.03.007
McLeod A. I. (2022). Kendall: kendall rank correlation and mann-kendall trend test. Available online at: https://CRAN.R-project.org/package=Kendall (Accessed March 20, 2022).
Miller T. J. (2013). A comparison of hierarchical models for relative catch efficiency based on paired-gear data for US Northwest Atlantic fish stocks. Can. J. Fish. Aquat. Sci. 70, 1306–1316. doi: 10.1139/cjfas-2013-0136
Moustahfid H., Link J. S., Overholtz W. J., and Tyrrell M. C. (2009a). The advantage of explicitly incorporating predation mortality into age-structured stock assessment models: an application for Atlantic mackerel. ICES J. Mar. Sci. 66, 445–454. doi: 10.1093/icesjms/fsn217
Moustahfid H., Tyrrell M. C., and Link J. S. (2009b). Accounting explicitly for predation mortality in surplus production models: an application to longfin inshore squid. North Am. J. Fisheries Manage. 29, 1555–1566. doi: 10.1577/M08-221.1
Murdoch W. W. (1969). Switching in general predators: experiments on predator specificity and stability of prey populations. Ecol. Monogr. 39, 335–354. doi: 10.2307/1942352
Myers R. A., Baum J. K., Shepherd T. D., Powers S. P., and Peterson C. H. (2007). Cascading effects of the loss of apex predatory sharks from a coastal ocean. Science 315, 1846–1850. doi: 10.1126/science.1138657
NOAA (2024a). North atlantic oscillation (NAO) | National centers for environmental information (NCEI). Available online at: https://www.ncei.noaa.gov/access/monitoring/nao/ (Accessed May 29, 2024).
NOAA (2024b). Download climate timeseries: AMO SST: NOAA physical sciences laboratory. Available online at: https://psl.noaa.gov/data/timeseries/AMO/ (Accessed June 14, 2024).
NOAA (2024c). Fisheries one stop shop (FOSS) | NOAA fisheries | Landings. Available online at: https://www.fisheries.noaa.gov/foss/f?p=215:200 (Accessed July 26, 2024).
Nye J. A., Baker M. R., Bell R., Kenny A., Kilbourne K. H., Friedland K. D., et al (2014). Ecosystem effects of the Atlantic Multidecadal Oscillation. J. Mar. Syst. 133, 103–116. doi: 10.1016/j.jmarsys.2013.02.006
Olsen E. M., Heupel M. R., Simpfendorfer C. A., and Moland E. (2012). Harvest selection on Atlantic cod behavioral traits: implications for spatial management. Ecol. Evol. 2, 1549–1562. doi: 10.1002/ece3.244
Overholtz W. J. and Link J. S. (2007). Consumption impacts by marine mammals, fish, and seabirds on the Gulf of Maine–Georges Bank Atlantic herring (Clupea harengus) complex during the years 1977–2002. ICES J. Mar. Sci. 64, 83–96. doi: 10.1093/icesjms/fsl009
Overholtz W. J., Link J. S., and Suslowicz L. E. (2000). Consumption of important pelagic fish and squid by predatory fish in the northeastern USA shelf ecosystem with some fishery comparisons. ICES J. Mar. Sci. 57, 1147–1159. doi: 10.1006/jmsc.2000.0802
Overton A. S., Manooch C. S. III, Smith J. W., and Brennan K. (2008). Interactions between adult migratory striped bass (Morone saxatilis) and their prey during winter off the Virginia and North Carolina Atlantic coast from 1994 through 2007. Fishery Bull. 106, 174–182.
Pianka E. R. (1973). The structure of lizard communities. Annu. Rev. Ecol. Systematics 4, 53–74. doi: 10.1146/annurev.es.04.110173.000413
Pitchford S. C., Smith B. E., and McBride R. S. (2020). A real-time PCR assay to detect predation by spiny dogfish on Atlantic cod in the western North Atlantic Ocean. Ecol. Evol. 10, 11022–11030. doi: 10.1002/ece3.6694
Rago P. J. and Sosebee K. A. (2010). "Biological reference points for spiny dogfish." in Northeast Fish Sci Cent Ref Doc. 10‑06. (Woods Hole, MA: National Marine Fisheries Service, Northeast Fisheries Science Center, National Oceanic and Atmospheric Administration). Available online at: https://repository.library.noaa.gov/view/noaa/3727.
Rago P. J., Sosebee K. A., Brodziak J. K. T., Murawski S. A., and Anderson E. D. (1998). Implications of recent increases in catches on the dynamics of Northwest Atlantic spiny dogfish (Squalus acanthias). Fisheries Res. 39, 165–181. doi: 10.1016/S0165-7836(98)00181-7
R Core Team (2023). R: a language and environment for statistical computing. Version 4.3.1 (Vienna: R Foundation for Statistical Computing).
Schmitz O. J., Miller J. R. B., Trainor A. M., and Abrahms B. (2017). Toward a community ecology of landscapes: predicting multiple predator–prey interactions across geographic space. Ecology 98, 2281–2292. doi: 10.1002/ecy.1916
Siegel A. F. (1982). Robust regression using repeated medians. Biometrika 69, 242–244. doi: 10.1093/biomet/69.1.242
Sims D. W. (2006). ““Differences in habitat selection and reproductive strategies of male and female sharks,”,” in Sexual segregation in vertebrates. Eds. Ruckstuhl K. and Neuhaus P. (Cambridge University Press, Cambridge), 127–147. doi: 10.1017/CBO9780511525629.009
Smith B. E. and Smith L. A. (2020). Multispecies functional responses reveal reduced predation at high prey densities and varied responses among and within trophic groups. Fish Fisheries 21, 891–905. doi: 10.1111/faf.12468
Sosebee K. A. (2022). Maturity of spiny dogfish in US waters from 1998-2021. Working Paper submitted as part of the 2022 Spiny Dogfish Research Track Assessment. (Woods Hole, MA: National Marine Fisheries Service, Northeast Fisheries Science Center, NOAA.)
Steele J. H., Aydin K., Gifford D. J., and Hofmann E. E. (2013). Construction kits or virtual worlds; Management applications of E2E models. J. Mar. Syst. 109–110, 103–108. doi: 10.1016/j.jmarsys.2011.10.016
Stehlik L. L., Rosendale J., Phelan B. A., and Hare J. A. (2021). Gastric evacuation rates of spiny dogfish, goosefish, and summer flounder: implications for multispecies models. Mar. Coast. Fisheries 13, 496–508. doi: 10.1002/mcf2.10177
Taylor A. H. and Stephens J. A. (1980). Latitudinal displacements of the Gulf Stream(1966 to 1977) and their relation to changes in temperature and zooplankton abundance in the NE Atlantic. Oceanologica Acta 3, 145–149.
Taylor A. H. and Stephens J. A. (1998). The north atlantic oscillation and the latitude of the gulf stream. Tellus A 50, 134–142. doi: 10.1034/j.1600-0870.1998.00010.x
Thorson J. T. (2019). Guidance for decisions using the Vector Autoregressive Spatio-Temporal (VAST) package in stock, ecosystem, habitat and climate assessments. Fisheries Res. 210, 143–161. doi: 10.1016/j.fishres.2018.10.013
Thorson J. T. and Kristensen K. (2016). Implementing a generic method for bias correction in statistical models using random effects, with spatial and population dynamics examples. Fisheries Res. 175, 66–74. doi: 10.1016/j.fishres.2015.11.016
Tyrrell M. C., Link J. S., and Moustahfid H. (2011). The importance of including predation in fish population models: Implications for biological reference points. Fisheries Res. 108, 1–8. doi: 10.1016/j.fishres.2010.12.025
van der Kooij J., Engelhard G. H., and Righton D. A. (2016). Climate change and squid range expansion in the North Sea. J. Biogeography 43, 2285–2298. doi: 10.1111/jbi.12847
Veríssimo A., McDowell J. R., and Graves J. E. (2010). Global population structure of the spiny dogfish Squalus acanthias, a temperate shark with an antitropical distribution. Mol. Ecol. 19, 1651–1662. doi: 10.1111/j.1365-294X.2010.04598.x
Keywords: multivariate spatiotemporal models, spiny dogfish, predator-prey overlap, prey switching, longfin inshore squid, Atlantic menhaden, Atlantic herring
Citation: DeVries C, Gartland J and Latour RJ (2025) Patterns in spiny dogfish consumption by sex and maturity stage relate to prey availability and environmental forcing in the Northwest Atlantic. Front. Mar. Sci. 12:1621343. doi: 10.3389/fmars.2025.1621343
Received: 30 April 2025; Accepted: 23 July 2025;
Published: 14 August 2025.
Edited by:
Tomaso Fortibuoni, Istituto Superiore per la Protezione e la Ricerca Ambientale (ISPRA), ItalyReviewed by:
Oscar Sosa-Nishizaki, Center for Scientific Research and Higher Education in Ensenada (CICESE), MexicoCharles Bangley, Dalhousie University, Canada
Romana Gračan, University of Zagreb, Croatia
Copyright © 2025 DeVries, Gartland and Latour. This is an open-access article distributed under the terms of the Creative Commons Attribution License (CC BY). The use, distribution or reproduction in other forums is permitted, provided the original author(s) and the copyright owner(s) are credited and that the original publication in this journal is cited, in accordance with accepted academic practice. No use, distribution or reproduction is permitted which does not comply with these terms.
*Correspondence: Caroline DeVries, ZGV2cmllc2NnQHVuY3cuZWR1
†ORCID: Caroline DeVries, orcid.org/0009-0006-3572-9151
James Gartland, orcid.org/0000-0003-1436-2291
Robert J. Latour, orcid.org/0000-0002-8644-1733