 Georgia Papantoniou
 Vasiliki Sgardeli
 Vassiliki Vassilopoulou
 Konstantinos Tsagarakis
- Hellenic Centre for Marine Research, Institute of Marine Biological Resources and Inland Waters, Anavyssos, Greece
Introduction: Current manifestations of anthropogenic stressors on coastal ecosystems have intensified the need for a more profound understanding of trophic interactions, particularly under the ongoing climate change that is triggering the rewiring of food webs globally.
Methods: Herein, we present the development of an Ecopath model for the Eastern Ionian Sea (EIS; Central Mediterranean) in 1998-2000, the parameterization and fitting of the dynamic module Ecosim to biomass and catch data from 2000 to 2020, and future projections of the ecosystems’ responses to a set of single and multiple stressor scenarios for the period 2021-2080. The 21 simulations consisted of two levels of climate change and total and gear-specific fishing effort reduction. We estimated the cumulative impact of multiple stressors on ecosystem dynamics, with emphasis on stressor interactions (synergistic vs. antagonistic) and addressed the response of ecological indicators estimated in broad functional groups (e.g. trophic guilds, pelagic and demersal resources), to identify those that best track perturbation-induced shifts.
Results: The EIS is a moderately complex oligotrophic ecosystem, where exploitation indices classified fishing activities as sustainable, yet some stocks remain overexploited (e.g., hake, cuttlefish). The integration of trophic interactions, climate warming, fishing activity, and primary production enhanced the model's accuracy, indicating that both anthropogenic exploitation and environmental factors have historically shaped ecosystem dynamics. Future simulations highlighted that the high-baseline carbon emission scenario (RCP8.5) intensified ecosystem changes, compared to the scenario of moderate carbon mitigation (RCP4.5) after 2050. Moreover, antagonistic stressor interactions that persisted throughout the projection period under combined RCP4.5 scenarios shifted to synergistic by the latter half of the century (2080) under RCP8.5, resulting in negative effects on the biomass of most functional groups and raising serious concerns for future stock sustainability, as synergistic effects of stressors may non-linearly increase adverse impacts on ecosystems. Indicators showed that multiple stressors led to less abundant, less diverse, and lower trophic level benthivore communities, while piscivores were particularly vulnerable to warming, supporting projections of top-predator declines.
Discussion: Our findings emphasize the urgency of utilizing the window of opportunity until 2050 to integrate climate-adaptive measures into fisheries management in order to prevent future declines of Mediterranean marine resources.
1 Introduction
Humanity is simultaneously inflicting myriad stressors that undermine the biosphere’s complexity and resilience, pushing ecosystems worldwide towards tipping points that may irreversibly destabilize the Earth’s system (1) (Steffen et al., 2018). At sea, human activities have significantly expanded in recent decades, leading to the degradation of ocean health, affecting ecosystem services as well as interlinked societal goods and benefits (Korpinen et al., 2021; Borja et al., 2024). The Mediterranean basin, bearing the marks of human exploitation since antiquity and currently home to over 510 million people, is a unique region, serving as both a hotspot for biodiversity and climate change (Coll et al., 2010; Cramer et al., 2018). The Mediterranean Sea is particularly vulnerable to climate warming, with its surface waters warming at a rate 3.7 times higher than the global average (Pisano et al., 2020). Several prominent marine heatwaves have been reported during the last 20 years (Hamdeno and Alvera-Azcaráte, 2023), and a common prediction suggests a general trend of future warming, overlaid with increasingly frequent and intense fluctuations and extreme events (Tejedor et al., 2024; Xu et al., 2022). Numerous studies have highlighted the largely adverse effects of these events on species distributions (Baudron et al., 2020; Pinsky et al., 2020), marine biodiversity (Garrabou et al., 2022), ecosystem functioning (du Pontavice et al., 2020) and fisheries (Farahmand et al., 2023; Free et al., 2019; Tzanatos et al., 2014). In addition, commercial multi-gear fisheries are among the most widespread anthropogenic activities in the basin, exerting significant pressure on ecosystems through the overexploitation of marine resources and the alteration of species assemblages and food webs (Corrales et al., 2015; Jackson et al., 2021). Mediterranean marine fisheries are in a precarious state (FAO, 2022a; 2022b); the traditional long-term reliance on single-stock assessments, population-based models, and the maximum sustainable yield paradigm has failed to prevent the alarming decline of many previously dominant species (Colloca et al., 2017; Fiorentino and Vitale, 2021). Compounding this issue, the window of opportunity to achieve climate-resilient development is rapidly narrowing (IPCC, 2023), yet the cumulative effects of climate warming and multi-gear fishing pressure remain poorly understood.
European Union’s Marine Framework Directive (MSFD: EU, 2008, 2014) has recognized that maintaining marine food webs in Good Environmental Status (GES) is fundamental to ensure the long-term provision of essential ecosystem goods and services. Thus, it has established a requirement to monitor the state of European marine ecosystems and their responses to variable environmental and anthropogenic pressures. Ecopath with Ecosim (EwE) (Christensen and Walters, 2004) ecosystem models facilitate a comprehensive exploration of the effects of multiple stressors on ecosystem dynamics through retrospective analysis and future projections. In the Mediterranean Sea, EwE models have been used to investigate the combined effects of fishing pressure and climate warming on ecosystem function (Corrales et al., 2018; Tsagarakis et al., 2022; Papantoniou et al., 2023; Keramidas et al., 2024). However, these studies were based solely on the mean cumulative effect of the multiple stressors without assessing quantitatively the direction and magnitude of their interplay.
One of the greatest challenges when predicting ecological change, however, is understanding how multiple stressors interact and determine the potential for complex synergistic, antagonistic, or non-additive interactions among them (Côté et al., 2016; Jackson et al., 2021). Interactions between multiple stressors can be classified using additive effects models that combine both the magnitude and response direction of the cumulative and interaction effects while emphasizing the importance of considering the directions of individual stressor effects in identifying synergistic and antagonistic interactions (Agnetta et al., 2022; Piggott et al., 2015).
Furthermore, EwE also aids in computing ecological indicators to assess the sustainability of ecosystem utilization (Papantoniou et al., 2023; Tsagarakis et al., 2022). A grand challenge lies, however, in identifying the indicators that best track perturbation-induced shifts in food webs (Borja et al., 2013; Hummel et al., 2015; Queirós et al., 2016). Asymmetries in responses to stressors, such as climate change and fishing strategies, have the potential to alter important predator-prey interactions with unforeseen consequences. To tackle this, ICES (2015) has suggested that a relatively simple breakdown of the ecosystem into functional groups, such as trophic guilds and benthic and pelagic resources, may be sufficient to improve management. Thus, it is also crucial to consider broader functional groups, such as trophic guilds and demersal and pelagic resources, when calculating indicators, to sustain food web dynamics (Thorpe et al., 2022).
The Eastern Ionian Sea (EIS; Figure 1) (GSA-20 according to the General Fisheries Commission for the Mediterranean geographical sub-division) in Central Mediterranean encompasses an area of 121,680 km², featuring a narrow continental shelf, a vast region with depths exceeding 400m, and the Greek Trench, which reaches over 5,000 m along the western and southwestern Greek coastlines. The EIS is an oligotrophic ecosystem, characterized by low nutrient availability, reduced chlorophyll-a concentrations, and minimal zooplankton biomass (Ramfos et al., 2006). The spatial heterogeneity of the ecosystem provides critical spawning and nursery grounds for various commercially important demersal, pelagic, and large pelagic fish species (Moutopoulos et al., 2018). Moreover, the EIS is vital for species of conservation concern and marine megafauna, supporting significant seabird colonies (Karris et al., 2017), nesting sites, and a large population of loggerhead sea turtle, as well as foraging areas for monk seal and dolphins (Bearzi et al., 2005), which frequently interact with local fisheries. Marine heatwaves are increasingly being observed in the Ionian Sea during the last 40 years (Martínez et al., 2023) which may lead to extreme consequences for living organisms, ecosystem functioning and the related services they provide (Smith et al., 2023). Similarly to other Mediterranean areas commercial fisheries in the area employ a diverse array of fishing gear due to the inherent spatial heterogeneity of the EIS. Small-scale fisheries are characterized by a large number of fishers and vessels scattered along an extensive coastline, a wide variety of fishing gears and target species, and intense heterogeneity (Tzanatos et al., 2020).
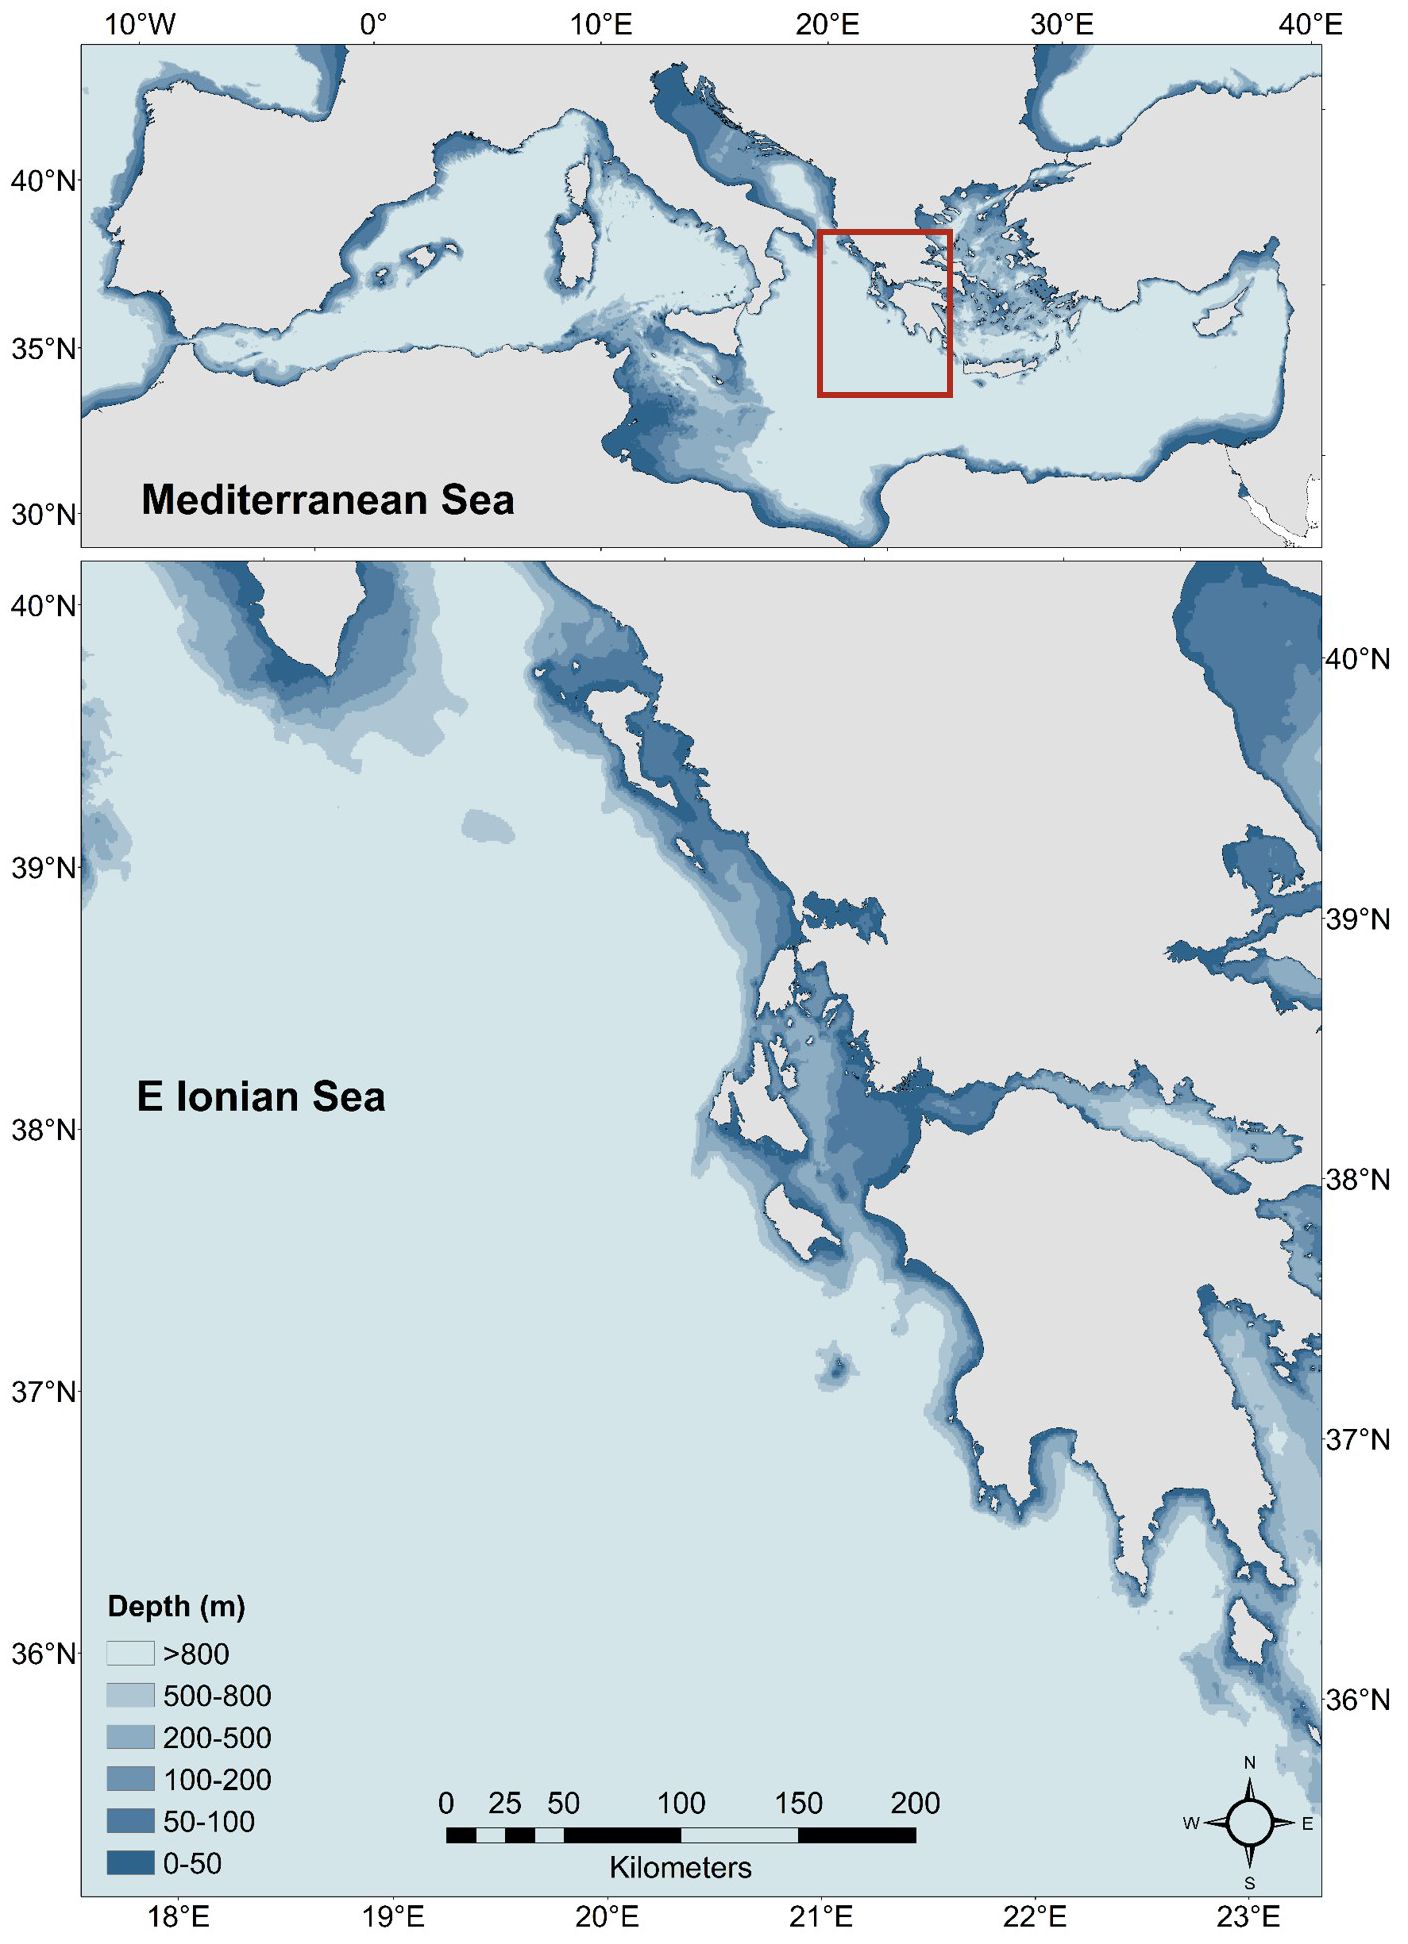
Figure 1. Location of the Eastern Ionian Sea (EIS) and the map and bathymetry of the study area (0-800m).
This study aims to address the impact of multiple pressures on ecosystem functioning and stock dynamics in the Eastern Ionian Sea (EIS), to classify the interactions between fishing pressure and climate warming and to assess whether prospective ecological indicators are responsive to different levels of anthropogenic and environmental pressures. To this end, we developed an EwE ecosystem model to depict the trophic structure of the EIS ecosystem (1998-2000) and to explore the historic role (2000-2020) of fishing pressure and temperature on the food web. We further tested the effect of two future climate warming scenarios (RCP4.5 and RCP8.5) (2021-2080) and various levels of total and gear-specific fishing effort on ecosystem function, marine resources and a suite of ecological indicators. Results from our study will provide insights on specific responses of fishing stocks and ecological indicators to climate change and fishing effort scenarios and may inform the development of management strategies integrating environmental considerations at the GSA level, thereby facilitating the move towards ecosystem-based fisheries management (EBFM) in the region.
2 Materials and methods
2.1 The EIS Ecopath model
2.1.1 Definition of functional groups
The EIS EwE model intends to provide a deeper understanding on the way climate warming and fishing pressure affects ecosystem dynamics and the important commercial species in the area. Altogether the model aimed to place species of commercial significance into single-species or multi-stanza groups whilst species of less financial importance and/or with limited data, were aggregated into multi-species groups. Multi-species functional groups were defined using ecological and dietary similarities of species. On this basis, we described the food web of the EIS with 57 functional groups (FGs) covering all trophic levels and marine habitats (Table 1). Apex predators are represented in 9 FGs of which 5 consist of marine mammals, while sea turtles, sea birds, large pelagic fishes, and pelagic sharks comprise one FG each. Fish comprise 25 FGs, cephalopods are represented with 5 FGs, decapods with 9 FGs while zoobenthos and planktonic organisms with 3 and 4 FGs, respectively. Primary producers were represented by phytoplankton while the microbial food web was indirectly considered in the detritus dynamics. Finally, although not present in EIS in 1998-2000, invasive species (etrumeus, Etrumeus golanii; blue crab, Callinectes sapidus; northern brown shrimp, Penaeus aztecus; silver cheeked toadfish, Lagocephalus sceleratus; rabbitfishes, Siganus luridus and Siganus rivulatus) were included in the model as single-species FGs with very small biomass values to allow addressing their impact on the food web with Ecosim simulations. Concerning the clustering of fishes into 25 FGs we attempted to describe the ecological and fishing reality of our ecosystem while trying to compensate for data limitations. Overall, pelagic fishes were represented with 11 FGs and demersal fish species comprised 14 FGs, while based on trophic guilds, 11 fish FGs were planktivorous, 7 were benthivores and 7 were piscivores. Four commercially important species in the area (anchovy, sardine, red mullet, hake) were split into multi-stanza groups to capture ontogenetic diet shifts and potential differences in exploitation patterns. Picarels, mackerels, horse mackerels, flatfishes and anglerfishes constituted single groups each according to the level of aggregation of landings data provided by the National Statistical Agency (ELSTAT, 2021). Concerning chondrichthyes, sharks and rays, and then skates comprised two distinct FGs respectively due to their unique functional diversity (Pimiento et al., 2023) and special conservation concerns (i.e. Global Shark Trends Project 2018–2020, International Plan of Action for Conservation and Management of Sharks) (Fischer et al., 2012) as they are highly sensitive to fishing pressure and able to reflect the status of entire marine ecosystems (Davidson et al., 2022). Other species were included in aggregated groups based on similar functional characteristics (e.g., medium and large pelagic fishes), dietary similarities (e.g., piscivores fishes-shelf and piscivores fishes-slope), and spatial distribution (e.g., epipelagic fishes, mesopelagic fishes).
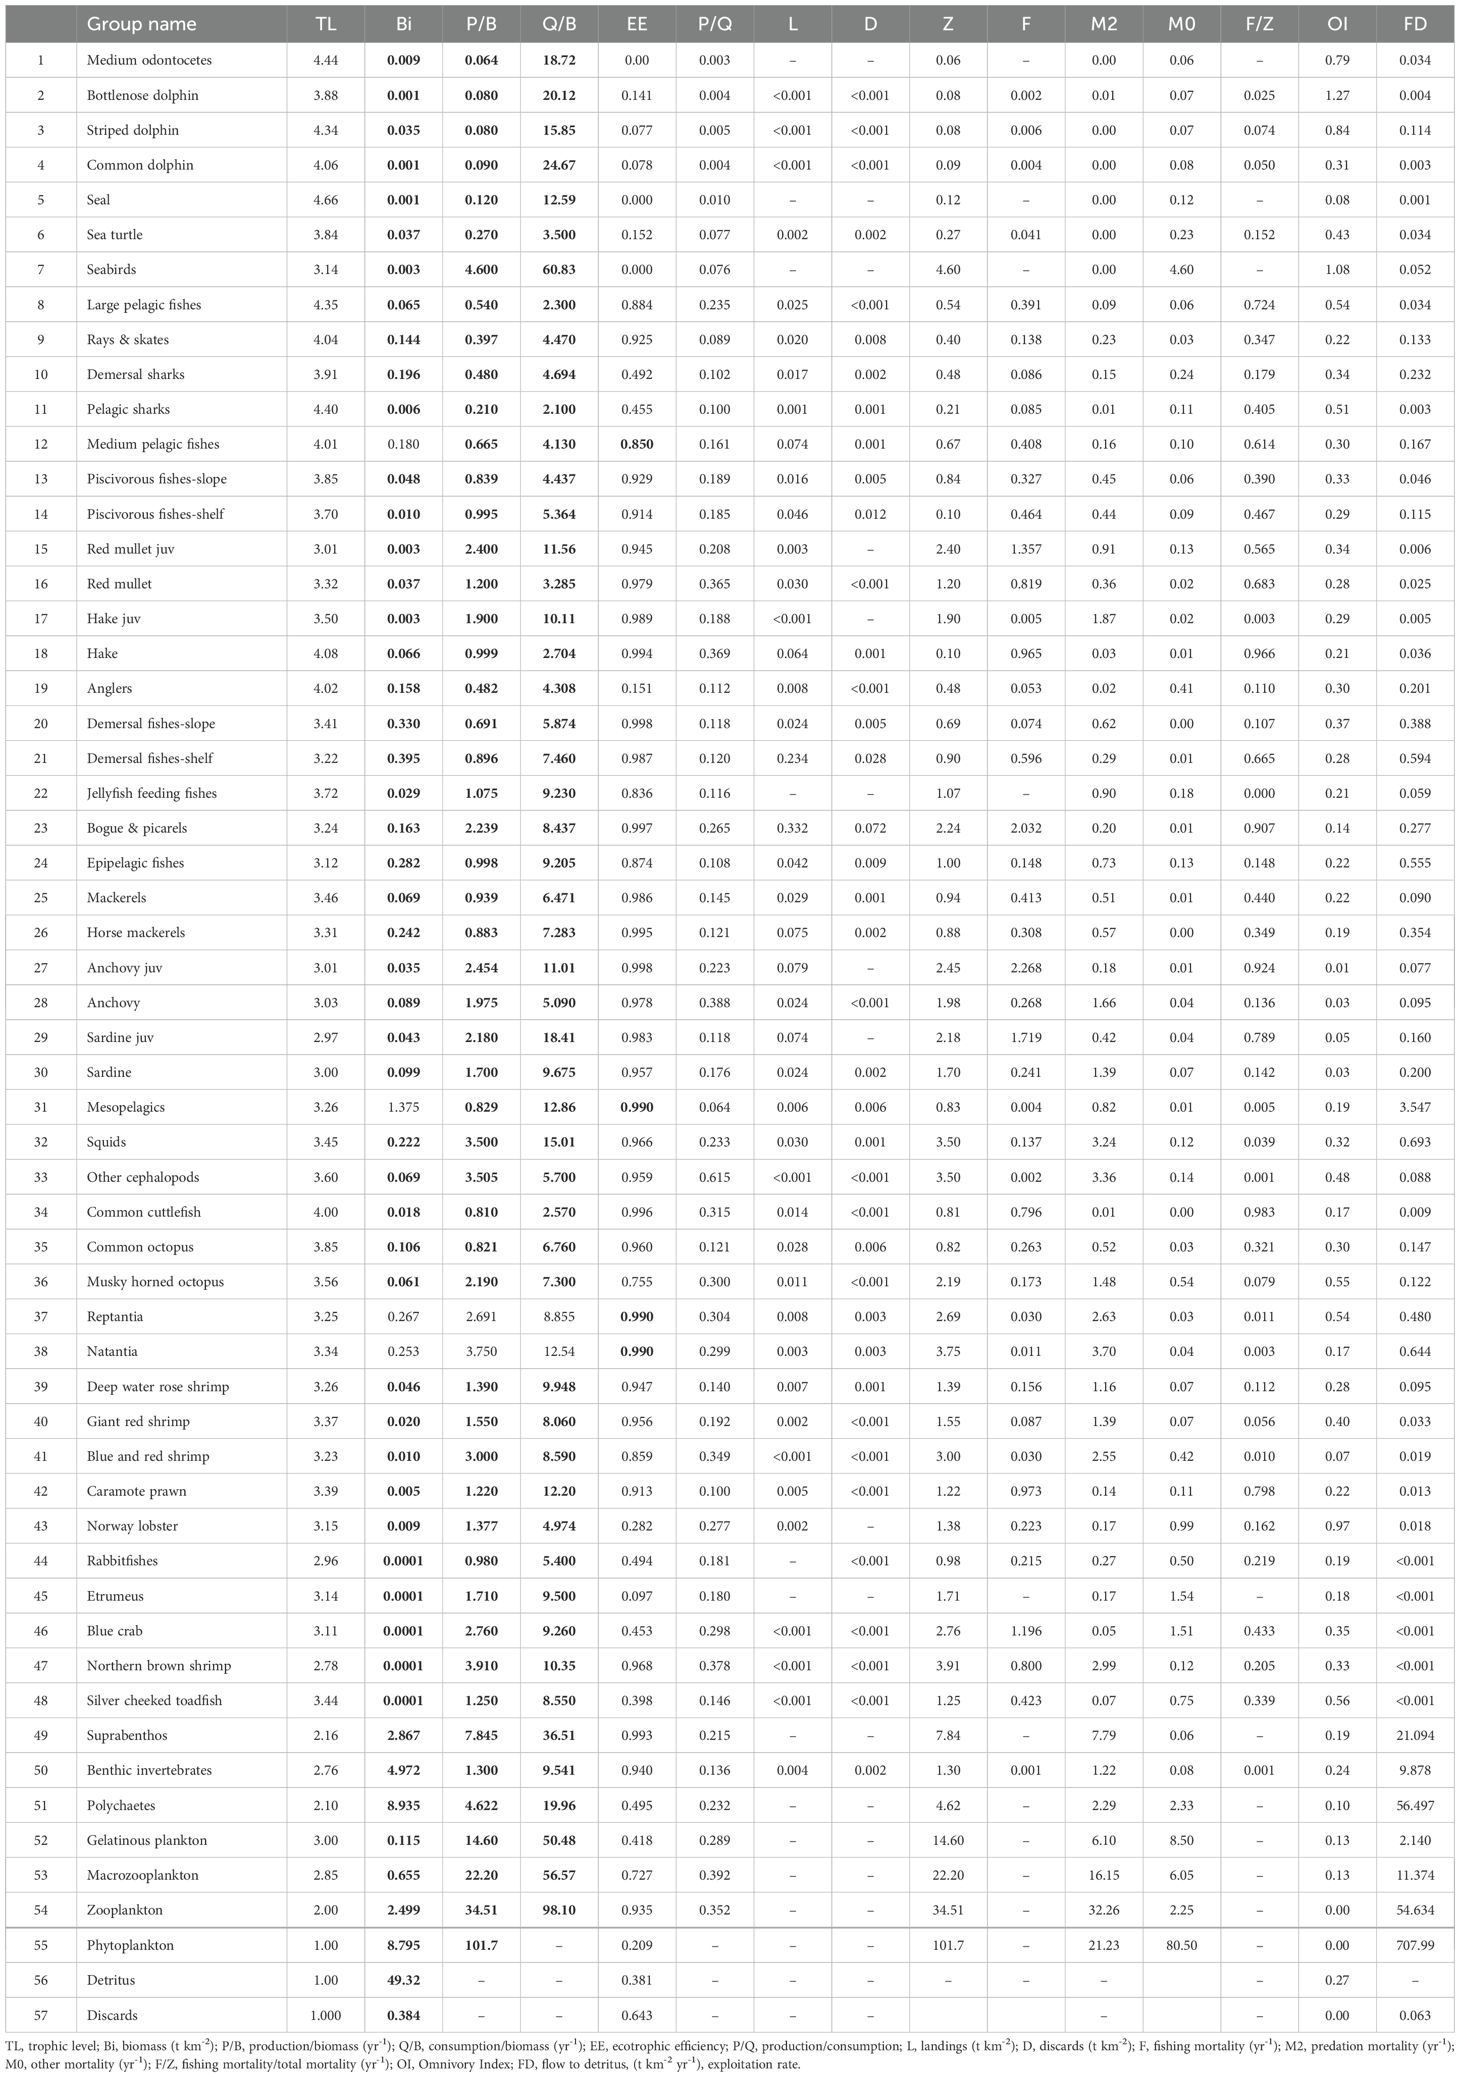
Table 1. Functional groups and input (in bold) and output parameters obtained from the Eastern Ionian Sea Ecopath model.
2.1.2 Basic input data (Bi, P/B, Q/B, EE, diet composition and fisheries)
Ecopath is a well-documented approach and therefore the basic concepts, the equations and a detailed description of the estimation of the input parameters and the data sources are included in the Supplementary Material, Section A. Fish biomass (Bi) data were derived from stock assessments when available, from fisheries independent acoustic and bottom trawl surveys after applying appropriate catchability factors (Supplementary Material, Supplementary Table S1) or by assuming ecotrophic efficiency (EE) for a few groups (i.e. medium pelagic and mesopelagic fishes, non-commercial shrimps and crabs & lobsters). For the remaining FGs, survey or literature data were used. Production to biomass (P/B) and consumption to biomass ratios (Q/B) were mainly estimated by applying empirical equations or were transferred from other models from the Ionian or the Aegean Seas (Supplementary Material, Supplementary Table S5). A diet matrix was built based on published dietary information from the Ionian Sea and adjacent ecosystems (Supplementary Material, Supplementary Table S2). The multi-gear and multi-species nature of fisheries in the EIS increases the uncertainty related to gear-specific mortality rates. The model included seven fishing fleets (trawl, purse seine, boat seines, longlines & troll baits, nets, pots & traps and recreational fisheries) and fisheries production was estimated using landings data from the Hellenic Statistical Authority (ELSTAT, 2021) which reports annual catch per species or group, explicitly for bottom trawls, purse seines and boat seines but aggregated for the rest of the small-scale fishery gears (longlines & troll baits, nets and pots & traps). In addition, data concerning the period preceding 2015 excluded vessels below 20hp and corrections were made using the more recently collected catch data. Furthermore, to distribute small-scale fisheries production to each gear, we used the catch composition data of a more recent period (2018-2020) collected under the Data Collection Regulation (DCR - Regulation (EC) 1543/2000 - and later Data Collection Framework, DCF - Regulation (EC) 99/2008). Discard quantities were estimated using data collected onboard commercial vessels by calculating species and gear-specific discard ratios and applying them to the landings. Catch-at-age data from DCF (2013-2020) were also used to estimate discard ratios for multi-stanza groups.
2.1.3 Pedigree
To capture uncertainties in parameter estimates for each functional group, a pedigree index was assigned to each parameter (Morissette, 2007). The pedigree index represents the quality of a parameter value and is expressed as a coefficient of variation. Assigning pedigree values allows model developers to be explicit about the level of confidence in the data. This aids model balancing by guiding otherwise subjective choices about the prioritization and the degree to which parameters might be adjusted. Furthermore, it informs of the uncertainties inherent in the model highlighting areas that should be treated with caution.
2.1.4 Pre-balance diagnostics and model balancing
Once the input parameters (biomass, catch, diets, and vital rates) had been added to the model a set of tests were applied to check whether the model followed the ecological rules of thumb described by Link (2010), who proposed a set of pre-balance (PREBAL) diagnostics for ecological network models, such as Ecopath. For a detailed description of the balancing and the application of the PREBAL procedure see Section A of the Supplementary Material.
2.1.5 Keystone indices
To evaluate the keystone roles of functional groups within the ecosystem, we employed two keystoneness indices proposed by Libralato et al. (2006) and Valls et al. (2015). Both indices are derived from the Mixed Trophic Impact (MTI) analysis, which quantifies the direct and indirect effects that each group exerts on the remainder of the system. The Libralato index combines a group’s overall impact with its relative biomass, penalizing groups with high biomass in order to highlight those that exert disproportionate influence despite low abundance—thereby identifying both keystone and dominant groups across the food web. Conversely, the Valls index modifies the biomass component to reduce bias associated with very high or very low biomass values, enhancing its suitability for detecting top-down control by apex predators without overrepresenting dominant or rare groups. The application of both indices enabled a more comprehensive characterization of keystone dynamics across trophic levels.
2.2 The Ecosim model
2.2.1 Model parameterization and hindcast runs
The time dynamic Ecosim model simulations are achieved through a series of coupled differential equations derived from the Ecopath master equation, as more extensively described in Supplementary Material Section B. Fishing effort (FE) was expressed as annual days at sea and entered into the model as relative values. All fishing gears operated throughout the hindcast period apart from boat seines that paused from 2008 until 2017 (Supplementary Material, Supplementary Figure S3). A notable reduction of FE was observed for boat seines (50%) and longlines and troll baits (60%) during the last two decades. Fishing effort of bottom trawls, purse seine and nets fluctuated considerably along the hindcast period with their values finally declining by ~20% in 2020 in relation to 2000. On the other hand, the FE of pots and traps showed a five-fold increase while recreational fishing was set to remain constant.
The Ecosim fitting used 23 biomass (described 2.2.2) and 29 catch calibration time series (ELSTAT, 2021). Biomasses for all FGs were entered into the model as relative values (to the first year of the simulations) while catches were entered as absolute values. Whilst observed and estimated biomass and catch values may not align, model simulations should follow the general trends of the observed data. The model was adjusted by modifying trophic interactions based on the foraging arena theory (Ahrens et al., 2012). The software’s routines were used to perform a sensitivity analysis to identify the most vulnerable prey items for each predator. This approach reduced the number of estimated parameters by assigning a single vulnerability to all prey of the same predator. Additionally, the software was utilized to modify the most sensitive vulnerabilities to best fit the observations in terms of the time series of biomasses and catches. Various fittings were attempted, considering different combinations of forcing such as fishing effort, temperature effects, and Primary Production (PP) Anomaly.
The environmental response functions that link the species or functional group dynamics with Sea Surface Temperature (SST) were obtained from AquaMaps (www.aquamaps.org) (Kaschner et al., 2021). Environmental response functions are given as Gaussian-based shaped curves showing minimum and maximum tolerance levels and 10th and 90th preferable percentiles to the environmental parameters, in our case temperature. SST functional responses impact the consumption rates of predators (𝑄𝑖𝑗) and were incorporated into the model following the methodologies outlined in recent studies which have used Ecosim to simulate the impact of sea warming (Serpetti et al., 2017; Tsagarakis et al., 2022). SST foraging responses were incorporated for 44 out of 55 FGs. Optimal temperatures were estimated by averaging the 10th and 90th percentiles of each species’ observed temperature range, while minimum and maximum values defined the thermal tolerance range, which was not necessarily symmetrical around the optimum (Supplementary Material, Supplementary Figure S4). As for multi-species FGs, temperature drivers were estimated after weighing with the biomasses of individual species (or landings when biomass estimates were not available), for the species with at least 98% cumulative contribution of the total FGs biomass. SST values were derived from the CERES ensemble projections (2018) (Supplementary Material, Supplementary Figure S6).
Subsequently, model simulations were fitted against observed data using an automated stepwise fitting plugin (Scott et al., 2016). The automated fitting constructed a series of model iterations to determine which combination of parameters provided the best statistical fit for model simulations against observed data, as determined by sum of squares and Akaike’s Information Criterion for small sample sizes (AICc) (Akaike, 1974). The drivers assessed were (i) SST, (ii) Fishing effort, (iii) PP anomaly (testing for different spline points but always ≥2), and (iv) Trophic Interactions (i.e., vulnerabilities; testing for different number of predators with altered vulnerability), while the number of estimated parameters (i.e. vulnerabilities and PP anomaly spline points) did not exceed K-1 (where K is the number of independent time series available) to ensure statistical strength (Heymans et al., 2016).
2.2.2 Sensitivity analysis
We used the Monte Carlo routine (Kennedy and O’Hagan, 2001) to assess the impact of the input parameter uncertainty on the model simulations. The Monte Carlo routine was used to perform a sensitivity analysis by exploring the effect of alternative Ecopath input (B, P/B, Q/B and Diets) on Ecosim best-fitted simulations. In total, 100 Monte-Carlo simulations were performed and confidence intervals were assigned to Ecopath input parameters for B, P/B and Q/B based on data origin obtained from the Pedigree (Christensen and Walters, 2004). The pedigree routine is used to set confidence intervals when undertaking Monte-Carlo simulations. Concerning Diets, the Dirichlet distribution method was used setting a multiplier of 30, which was selected after plotting the Dirichlet distributions for different values of the multiplier (between 1 and 100) (Steenbeek et al., 2018). Finally, the Ecosampler module was used to record the parameter variations of alternative balanced initial conditions produced by Monte Carlo runs. Confidence intervals (95%) were estimated for all outputs using the Monte Carlo model sets and were used on the best-fitted Ecosim model to obtain the range of dispersion of historical simulations, that can be used to assess the robustness of future projections for each functional group.
2.2.3 Future predictions
The fitted model was used to perform 60-year future simulations under different fishing pressure and climate scenarios. The 21 scenarios examined (Table 2) are similar to those tested in the N. Aegean EwE model (Tsagarakis et al., 2022) and the Saronikos Gulf EwE model (Papantoniou et al., 2023) in an effort to assess similarities and/or differences of marine resources to common stressors in variable systems of the same ecoregion. To determine which species may thrive or decline due to climate change and different management approaches, we compared the projected average biomasses and catches of FGs in the mid-term (year 2046-2050) and the long-term (period 2076-2080) under the different scenarios with those under the baseline scenario, which maintains conditions constant as in 2020 throughout the projection period (Table 2, Scenario 1). The relative mean changes between mid-term and long-term scenario biomass and catch values with the respective of the baseline scenario was estimated as:
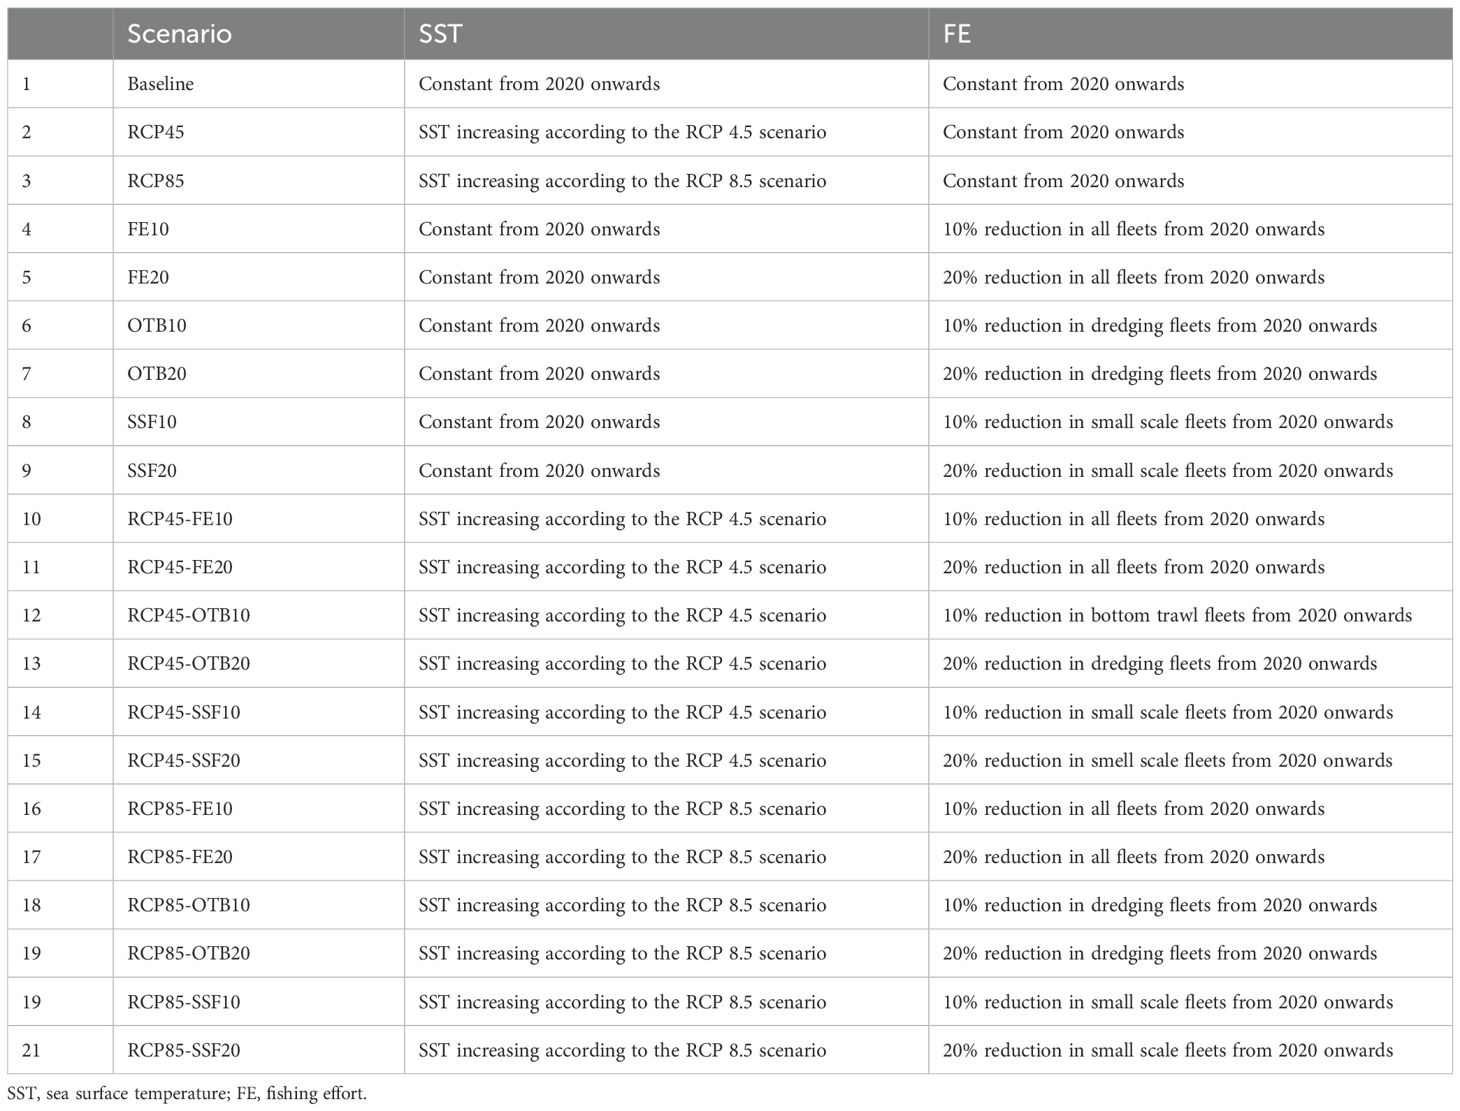
Table 2. Adjustment of the parameters used in the 21 future scenarios simulating climate warming and fishing effort reduction.
where RC = relative change, X baseline = mean biomass, catch or indicator values estimated for the mid-term or long-term according to the baseline scenario, and X scenario = mean biomass or catch values estimated for the mid-term or the long-term according to each scenario.
Concerning single stressors, we assessed eight future scenarios (Table 2, Scenario 2-9). The two SST scenarios examined (Table 2, Scenarios 2 and 3) were based on the Representative Concentration Pathways (RCPs) from the Intergovernmental Panel on Climate Change (IPCC). Specifically for the EIS, SST values were derived from the CERES ensemble projections (2018). The first scenario (RCP 4.5) represents a slowly declining emissions assuming some actions against climate change are taken, while the second scenario (RCP 8.5) represents the worst-case scenario assuming no actions are taken and hence emissions will keep rising. A slight increase in temperature is evident during the hindcast period in both RCP scenarios, however, the predicted SST trajectories diverge significantly after 2050. Specifically, the rate of temperature increase slows down in the RCP 4.5 scenario compared to the RCP 8.5 scenario (Supplementary Material, Supplementary Figure S5). This divergence is the primary rationale for selecting 2050 and 2080 as comparison points for simulating the effects. Climate change in the Mediterranean also involves shifts in primary productivity. However, previous assessment of primary productivity shifts in the EwE simulations of the N Aegean Sea and Saronikos gulf, demonstrated consistent biomass increases with higher productivity and decreases with lower productivity (Tsagarakis et al., 2022; Papantoniou et al., 2023). Given these predictable dynamics, primary productivity changes were not included in the current simulations. For future simulations, we assumed the PP anomaly of the final year of the hindcast period. Although the underlying function of the PP anomaly was not assessed and its future trend cannot be predicted, we consider that it affects both baseline and future scenarios consistently; therefore, the relative changes calculated using the RC formula are not influenced by this assumpt.
With regard to the six other single stressor scenarios (Table 2, Scenario 4-9), they assess the impact of multi-gear fishing on functional groups (FGs) and ecosystem structure, and simulated two levels of fishing effort reduction, for all gear types, for bottom trawling, for only small-scale fisheries, independently. The management scenarios tested were chosen based on the overexploitation of demersal stocks (FAO, 2022a), which are primarily targeted by bottom trawling and small-scale fisheries, while small pelagic species and purse seine fisheries contribute relatively little to the overall production in the study area (FAO, 2022b). The scenarios simulated decreases by 10% (FE10) and 20% (FE20) within 5 years (from 2021 to 2025), corresponding to the retraction of fishing vessels, a common practice in the Mediterranean fisheries management. This level of effort reductions are both ecologically meaningful and socioeconomically feasible, as they are tested throughout the study area (GSA-20), while higher levels of effort reduction would be less realistic. Finally, the compounded effect of climate warming and fishing pressure was explored with 12 scenarios (Table 2, Scenario 10-21).
2.2.4 Interaction effect index
The interactive effect of the two stressors (FE reduction and SST increase) in the combined scenarios was quantified by the interaction effect index (IEI) which compares the cumulative mean size effect of the two stressors with the sum of their individual effects (Allgeier et al., 2011; Piggott et al., 2015). IEI was estimated using the following formula:
where Abs = absolute value, effect SST_FE= the cumulative mean size effect of SST and FE, effect SST = the effect of SST increase, effect FE = the effect of FE reduction. Values IEI>0 correspond to synergistic interactions (i.e., larger that purely additive), values IEI<0 to antagonistic (lower than additive effects) while IEI=0 to neutral interactions between fisheries and climate change (Agnetta et al., 2022). We quantified these interaction effects only on the simulated FG biomass values.
2.2.5 Indicators
The aforementioned future simulations were also used to test whether selected indicators respond clearly to fisheries impacts and climate change, based on the postulate that fisheries and temperature are dominant drivers of change in fish biodiversity and food web structure. The indicators that we calculated were the following: Total Biomass (Bi), Guild level biomasses (Bi), Mean Maximum Length (MML), Large Species Index (LSI), Shannons’ Entropy (H), and Mean Trophic Level (MTL) (OSPAR 2017; Greenstreet et al., 2011; Oksanen et al., 2019; Thompson et al., 2020) (Supplementary Material, Supplementary Table S8). Bi, H and MTL were calculated for the entire fish community and separately for pelagic and demersal fishes and the three fish trophic guilds (planktivores, benthivores, and piscivores). MML and LSI were estimated for the entire community, the demersal community, total fishes, and demersal and pelagic fishes, separately. The clustering of FGs in groups and guilds are presented in Supplementary Table S8 (Supplementary Material, Section A). The biomasses of apex predators, such as marine mammals and seabirds, are distinguished from those of fish due to substantial differences in data availability and the inherently wide-ranging and migratory behavior of apex predators. Species that share common prey items can be grouped into functional feeding guilds and indicators of change in the biomass of guilds have been proposed to monitor change in ecosystem structure (e.g. ICES, 2015). The relative biomass of guilds within the ecosystem (i.e. the balance) may also provide a metric that is a proxy for change in dominance of ecosystem function. Changes in the biomass of each guild and the pairwise balance between them can be considered as likely to respond to fishing pressure. Furthermore, change in the structure of fish communities split between demersal and pelagic assemblages was evaluated using several different indicators MML, LSI and MTL that were specifically designed to be responsive to fishing impacts. Large individuals of any species are typically lost through prolonged fishing pressure, even when fished sustainably. Species with large ultimate body-size and/or species at the top of food webs (high trophic level) are also often at high risk of overexploitation.
3 Results
3.1 Ecopath model
3.1.1 Output parameters and quality of the model
Input data and resulting output parameters of the balanced model are shown in Table 1. PREBAL diagnostics indicate that biomass, production and consumption rates declined from the highest to the lowest TL at a rate of 5.9, 6.9 and 2.1% respectively, and that biomass spans 5 orders of magnitude across all TLs in agreement with PREBAL criteria (Supplementary Material, Supplementary Figure S1). The pedigree index obtained for the EIS model was 0.595 (Supplementary Material, Supplementary Table S6), classifying the data used as satisfying. According to the outputs of the model seal (4.66), medium odontocetes (4.44), striped dolphin (4.34), pelagic sharks (4.40), large pelagic fishes (4.35), adult hake (4.08), common dolphins (4.06), anglers (4.02) and medium pelagic fishes (4.01) were the FGs with the highest trophic level (Figure 2). The remaining FGs had a TL ranging between 4.01 and 2.97 for fish, with small pelagic fishes and rabbitfishes ranking at the lowest values due to the importance of low TL preys in their diet (zooplankton and phytobenthos, respectively).
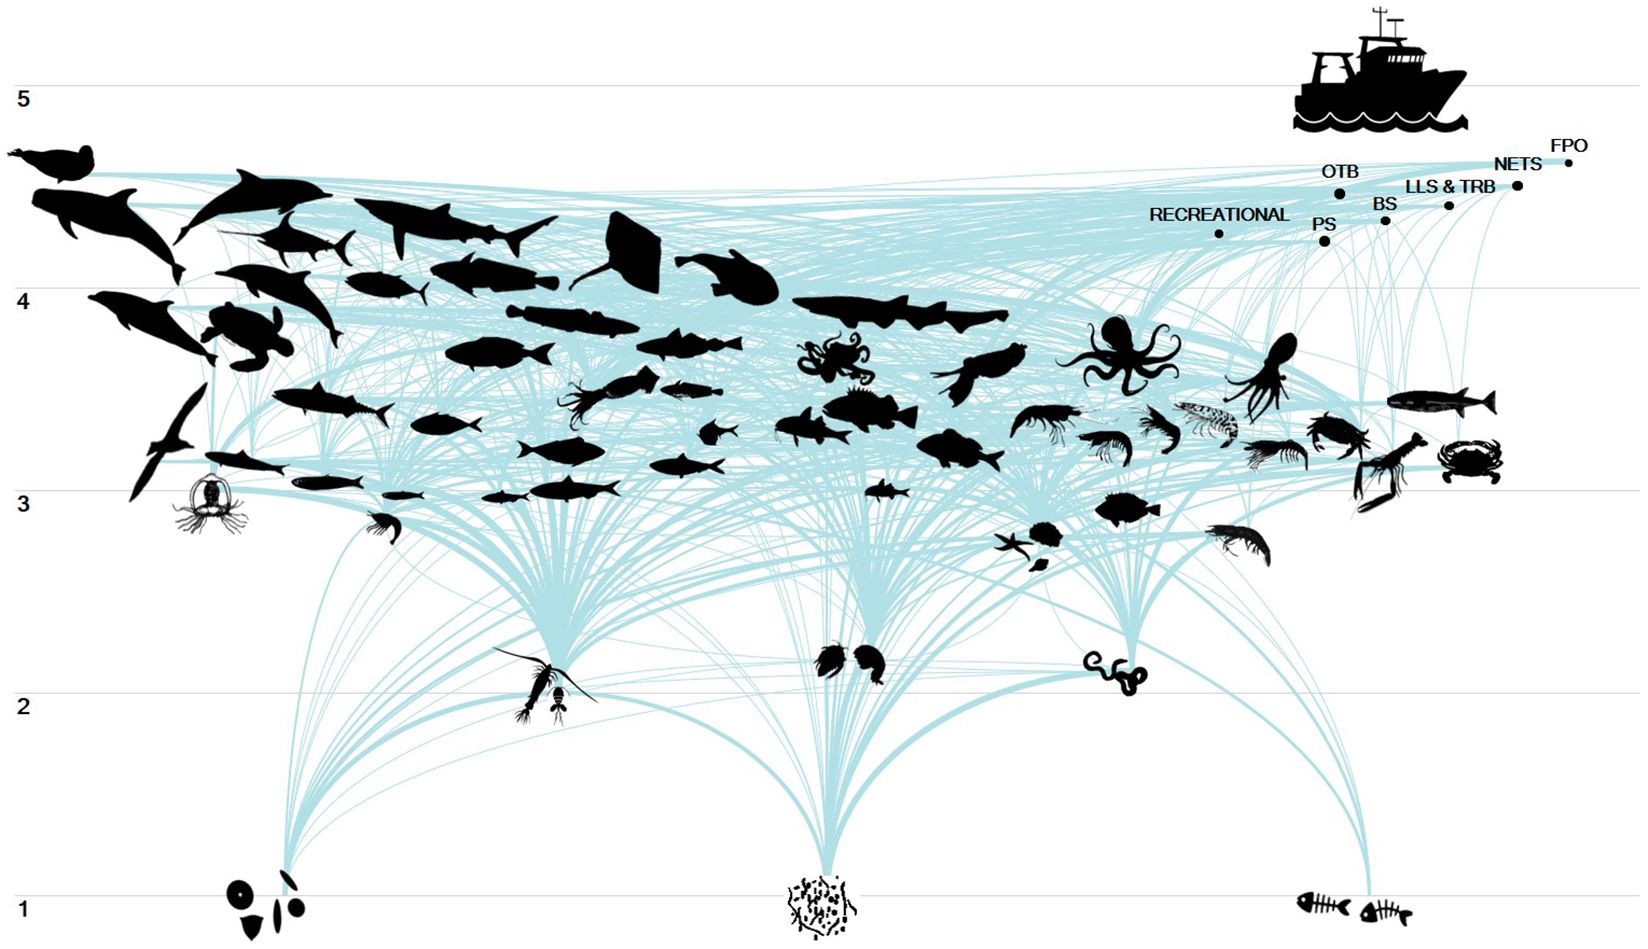
Figure 2. Flows diagram of the Eastern Ionian Sea food web model. The 57 FGs and the seven fleets (F1-F7) are presented from lower to higher trophic levels (y-axis) and from pelagic to demersal-benthic groups (x-axis). FGs and fleets are connected through links that represent prey-predator relationships in the food web.
The high EE values calculated across most FGs suggest that their production is being largely retained within the system through predation or extracted through fishing. Zooplankton, polychaetes, benthic invertebrates and phytoplankton scored high in keystones according to the index by Libralato et al. (2008) and low to the respective index by Valls et al. (2015), due to high biomass values (Figure 3). The structural significance of low trophic level FGs such as plankton, benthic invertebrates and crustaceans in the food web was also highlighted in the MTI analysis (Supplementary Material, Supplementary Figure S2) as they had a positive impact on pelagic fishes (e.g. bogue & picarels, anchovy, sardines, etc.) and demersal invertebrates (e.g., common cuttlefish, reptantia, caramote prawn, etc). Demersal sharks, rays & skates and squids ranked high in both indices (Figure 3), exerting a powerful effect on the community structure and function, disproportionate to their low biomasses. Demersal sharks and rays & skates seem to exert significant predatory control on their preys, principally on musky-horned octopus, reptantia and demersal fishes shelf. On the other hand, squids occupy an intermediate position in the food web (TL=3.45), and according to the Mixed Trophic Impact (MTI) they seem to have a positive impact on medium odocentes, striped dolphins and large pelagics as preys, and a negative effect on horse mackerels and epipelagic fishes as predators.
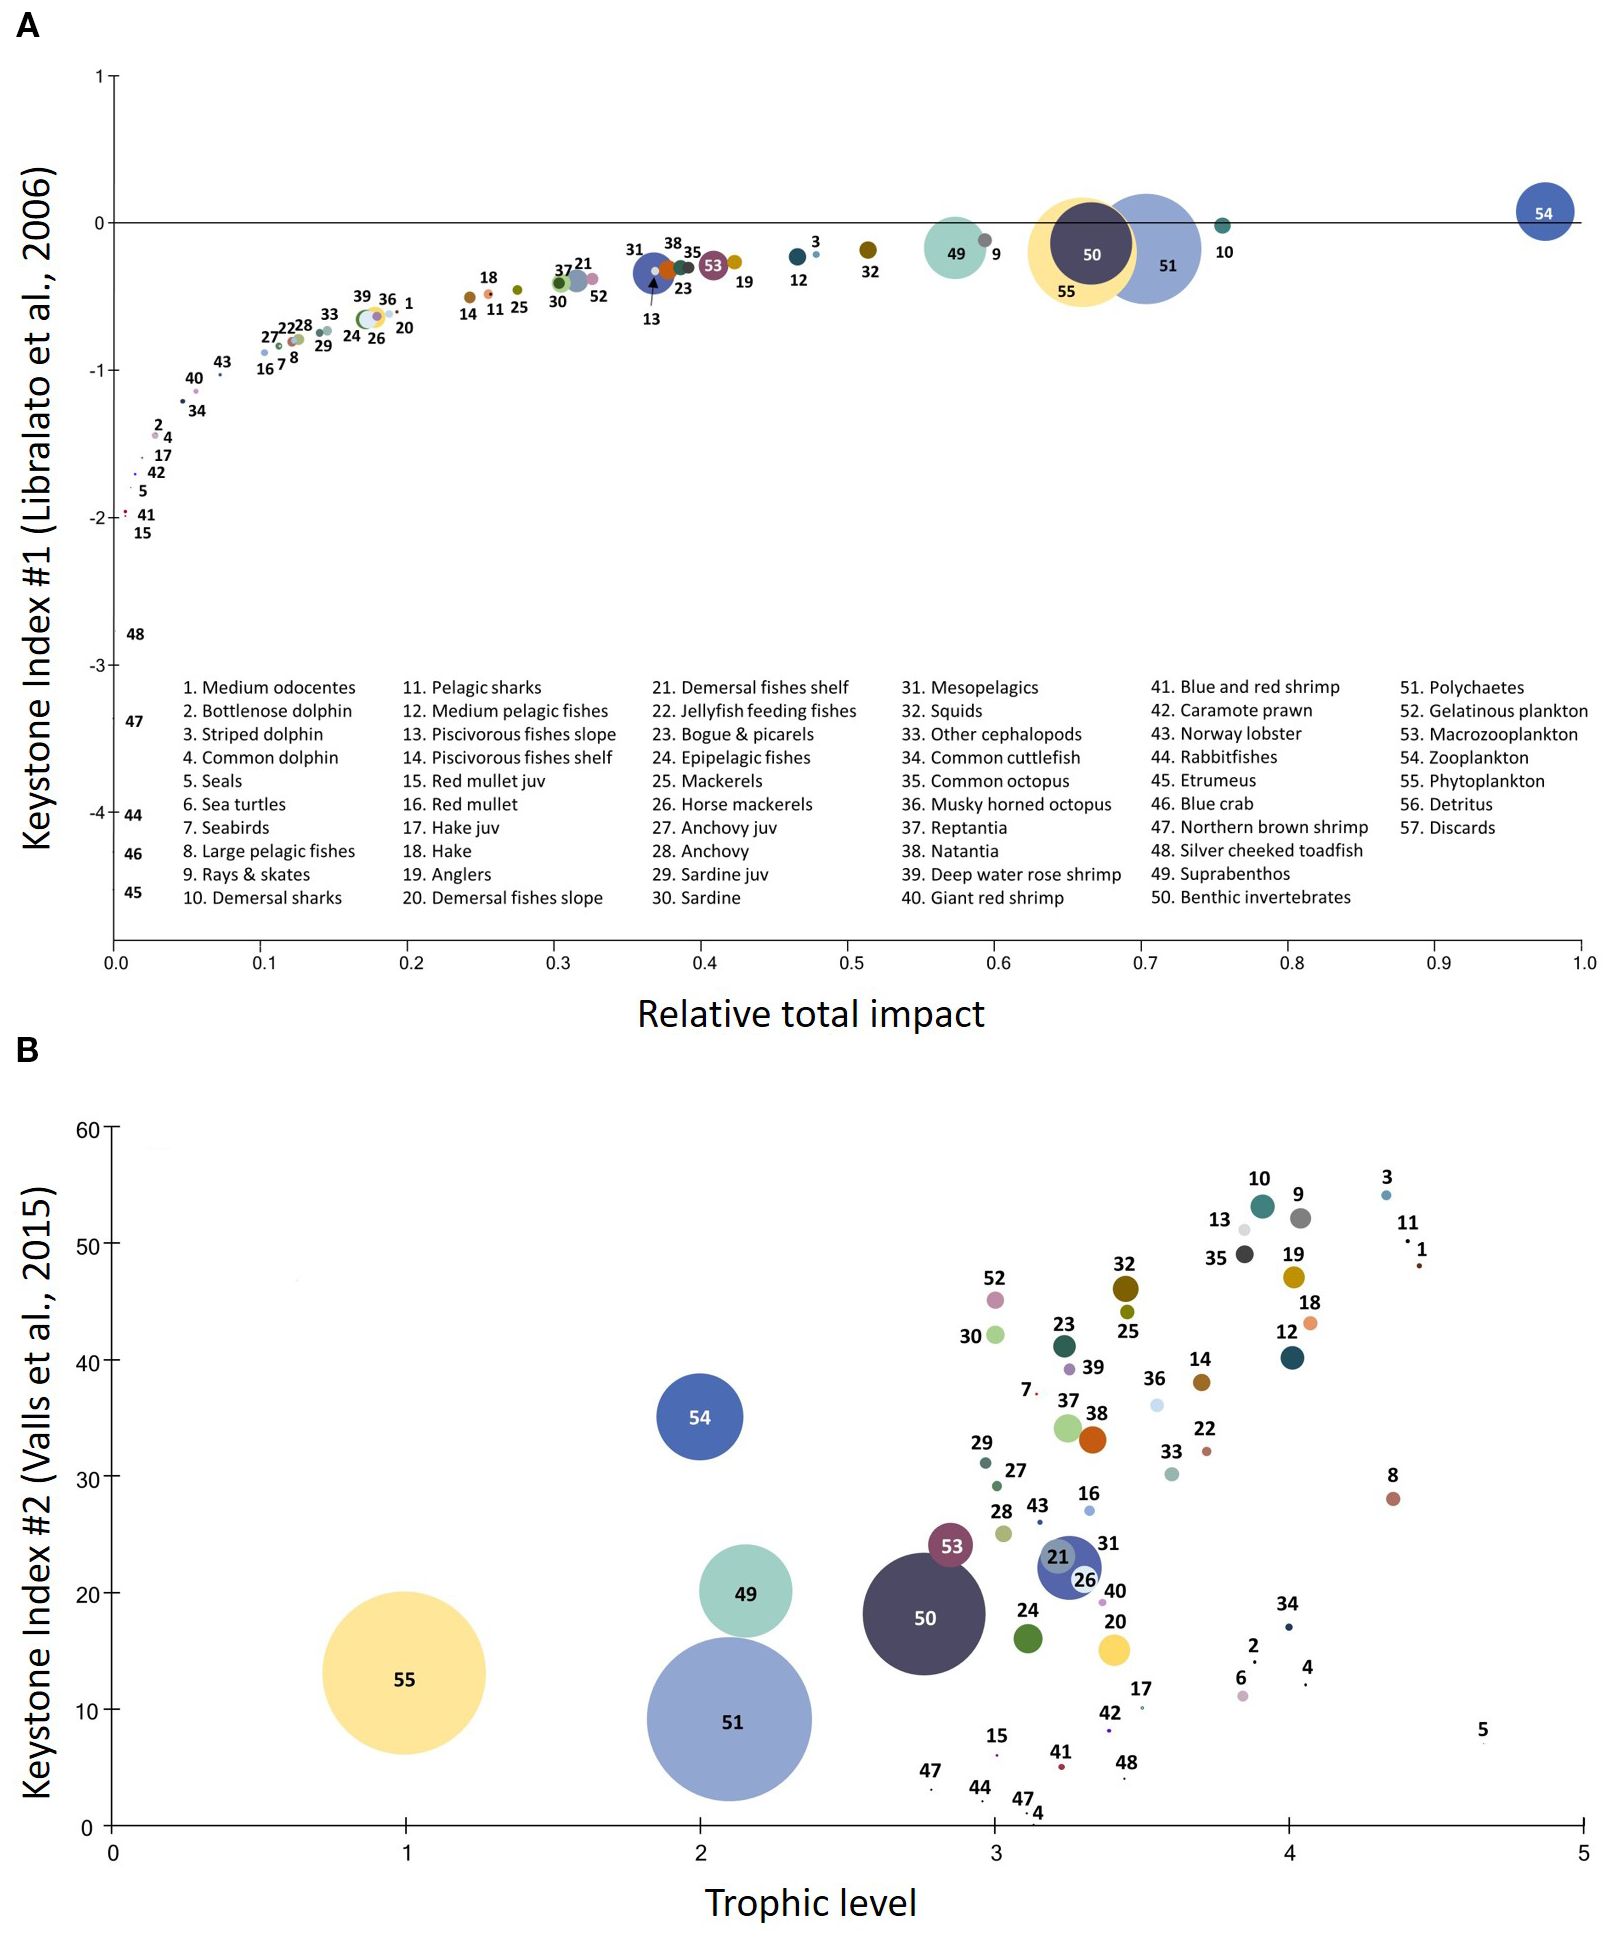
Figure 3. Keystone indices for the Eastern Ionian food web according to (A) Libralato et al. (2008) and (B) Valls et al. (2015). The circles’ dimensions correspond to the relative biomass of each functional group.
3.1.2 Fishing production
Total catch in EIS was 1.363t km-2 yr-1 (Supplementary Material, Supplementary Table S7). Among fishing gears, purse seines (PS), bottom trawls (OTB) and nets produced the highest quantities of landings while the lowest were recorded for traps and pots (FPO) and boat seines (BS). Discards rates were the highest for OTB, followed by nets and PS. Mixed fisheries had noticeable impact on EIS by extracting exploitable resources across trophic levels of the food web. Fishing mortality to total mortality ratio (F/Z) was the highest for taxa that comprise targets of the operating fleets such as common cuttlefish (0.98), adult hake (0.97), bogue & picarels (0.91), anchovy juveniles (0.92), caramote prawn (0.80), sardine juveniles (0.79) and large pelagic fishes (0.72) (Table 1). According to the MTI analysis OTB had a negative impact on bycatch species with high trophic level FGs such as sea turtle and pelagic sharks and on principal commercial species such as hake, anglers, caramote prawns and Norway lobster and to a lesser extent on the red mullet. Purse seines, targeting lower TL FGs, affected negatively mostly small pelagics such as anchovy juveniles, sardines juveniles and mackerels (Supplementary Material, Supplementary Figure S2). Among SSF gear, nets and had a significant impact on hake, boat seines (BS) mainly affected negatively red mullet and their juveniles, long lines & troll baits (LLS & TRB) principally impacted large pelagics, while traps (FPO) had a marginal effect on fishery resources. Interestingly MTI highlighted the broad spectrum of targets of the different fleets.
3.2 Ecosim
3.2.1 Ecosim fitting
The baseline model showed a sum of squares (SS) between predicted data and observed values (617.221) while the addition of trophic interactions, primary production anomaly and fishing as drivers decreased the models’ SS by 35.98%, 6.82% and 3.15%, respectively (Table 3). The best fit was able to reproduce satisfactorily the trends of biomass and catches for most FGs and showed credible statistical behavior. The statistically best model was obtained when calibrated trophic interactions, SST, PP anomaly and FE were included as drivers in the model fitting, improving the SS by 43.13% and reducing AIC from -582.51 to -1076.99 (Table 3). The PP Anomaly function was almost constant from the start of the hindcast period until 2016 with an increasing trend from 2017 to 2020 (Supplementary Material, Supplementary Figure S6).
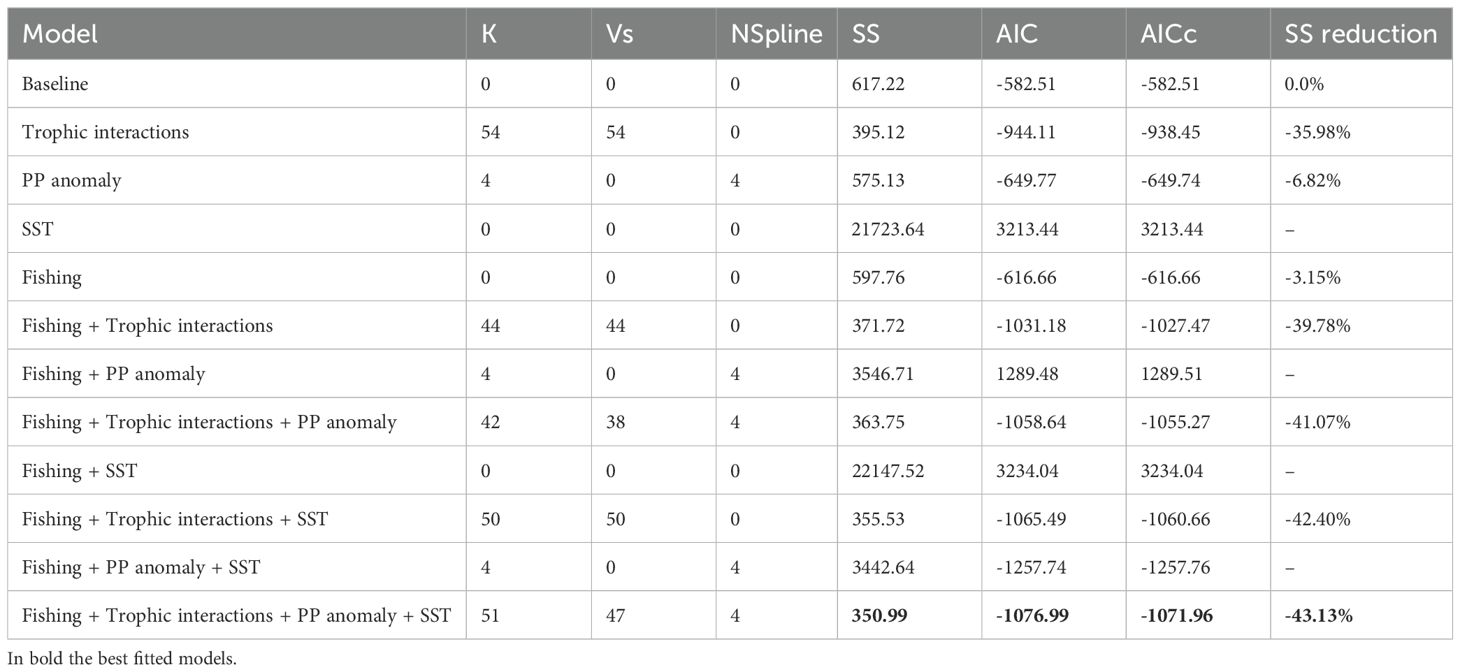
Table 3. Comparison across selected stepwise fitting interactions and the model baseline, showing the number of total parameters (K) estimated Vulnerabilities (Vs) and number of anomaly spline points (NSpline), the model sum of squares (SS), the Akaike Information Criterion (AIC) and the SS percentage of contribution to the fitting.
With the exception of anchovy the model satisfactorily fitted biomass observations for the multi-stanza groups as well as anglers, demersal fishes slope, bogue & picarels, squids, other cephalopod, common cuttlefish, natantia, deep-water rose shrimp, blue and red shrimp, Norway lobster, phytoplankton and zooplankton (Figure 4). Biomass values for the principal commercial FGs (e.g., red mullet, hake, deep water rose shrimp) presented a moderate increase towards the end of the hindcast period, while piscivorous fishes slope and musky-horned octopus followed the opposite pattern. Similarly, the model’s predictions for catches reproduced successfully the observed data for the majority of the FGs such as rays & skates, medium pelagic fishes, piscivorous fishes shelf, red mullets, anglers, demersal fishes slope, demersal fishes shelf, epipelagic fishes, mackerels, horse mackerels, as well as squids, common cuttlefish, common octopus, musky-horned octopus and Norway lobster (Figure 5). The catches simulations during the hindcast period for the multi-stanza groups were satisfactory for the red mullet and less successful for the rest, as the model overestimated catches for anchovy while underestimated catches for sardines and hake. The model could not reproduce successfully the decline in the observed catches during the first and the last years of the hindcast period for anchovy and the increase in the mid 2000’s for hake. The confidence intervals of the modelled biomass and catch trajectories (shaded areas in Figures 4, 5, respectively) illustrate the range of uncertainty associated with model predictions across functional groups. Notably, uncertainty was generally larger for groups with sparse or highly variable empirical data and for groups with complex life histories, such as multi-stanza FGs.
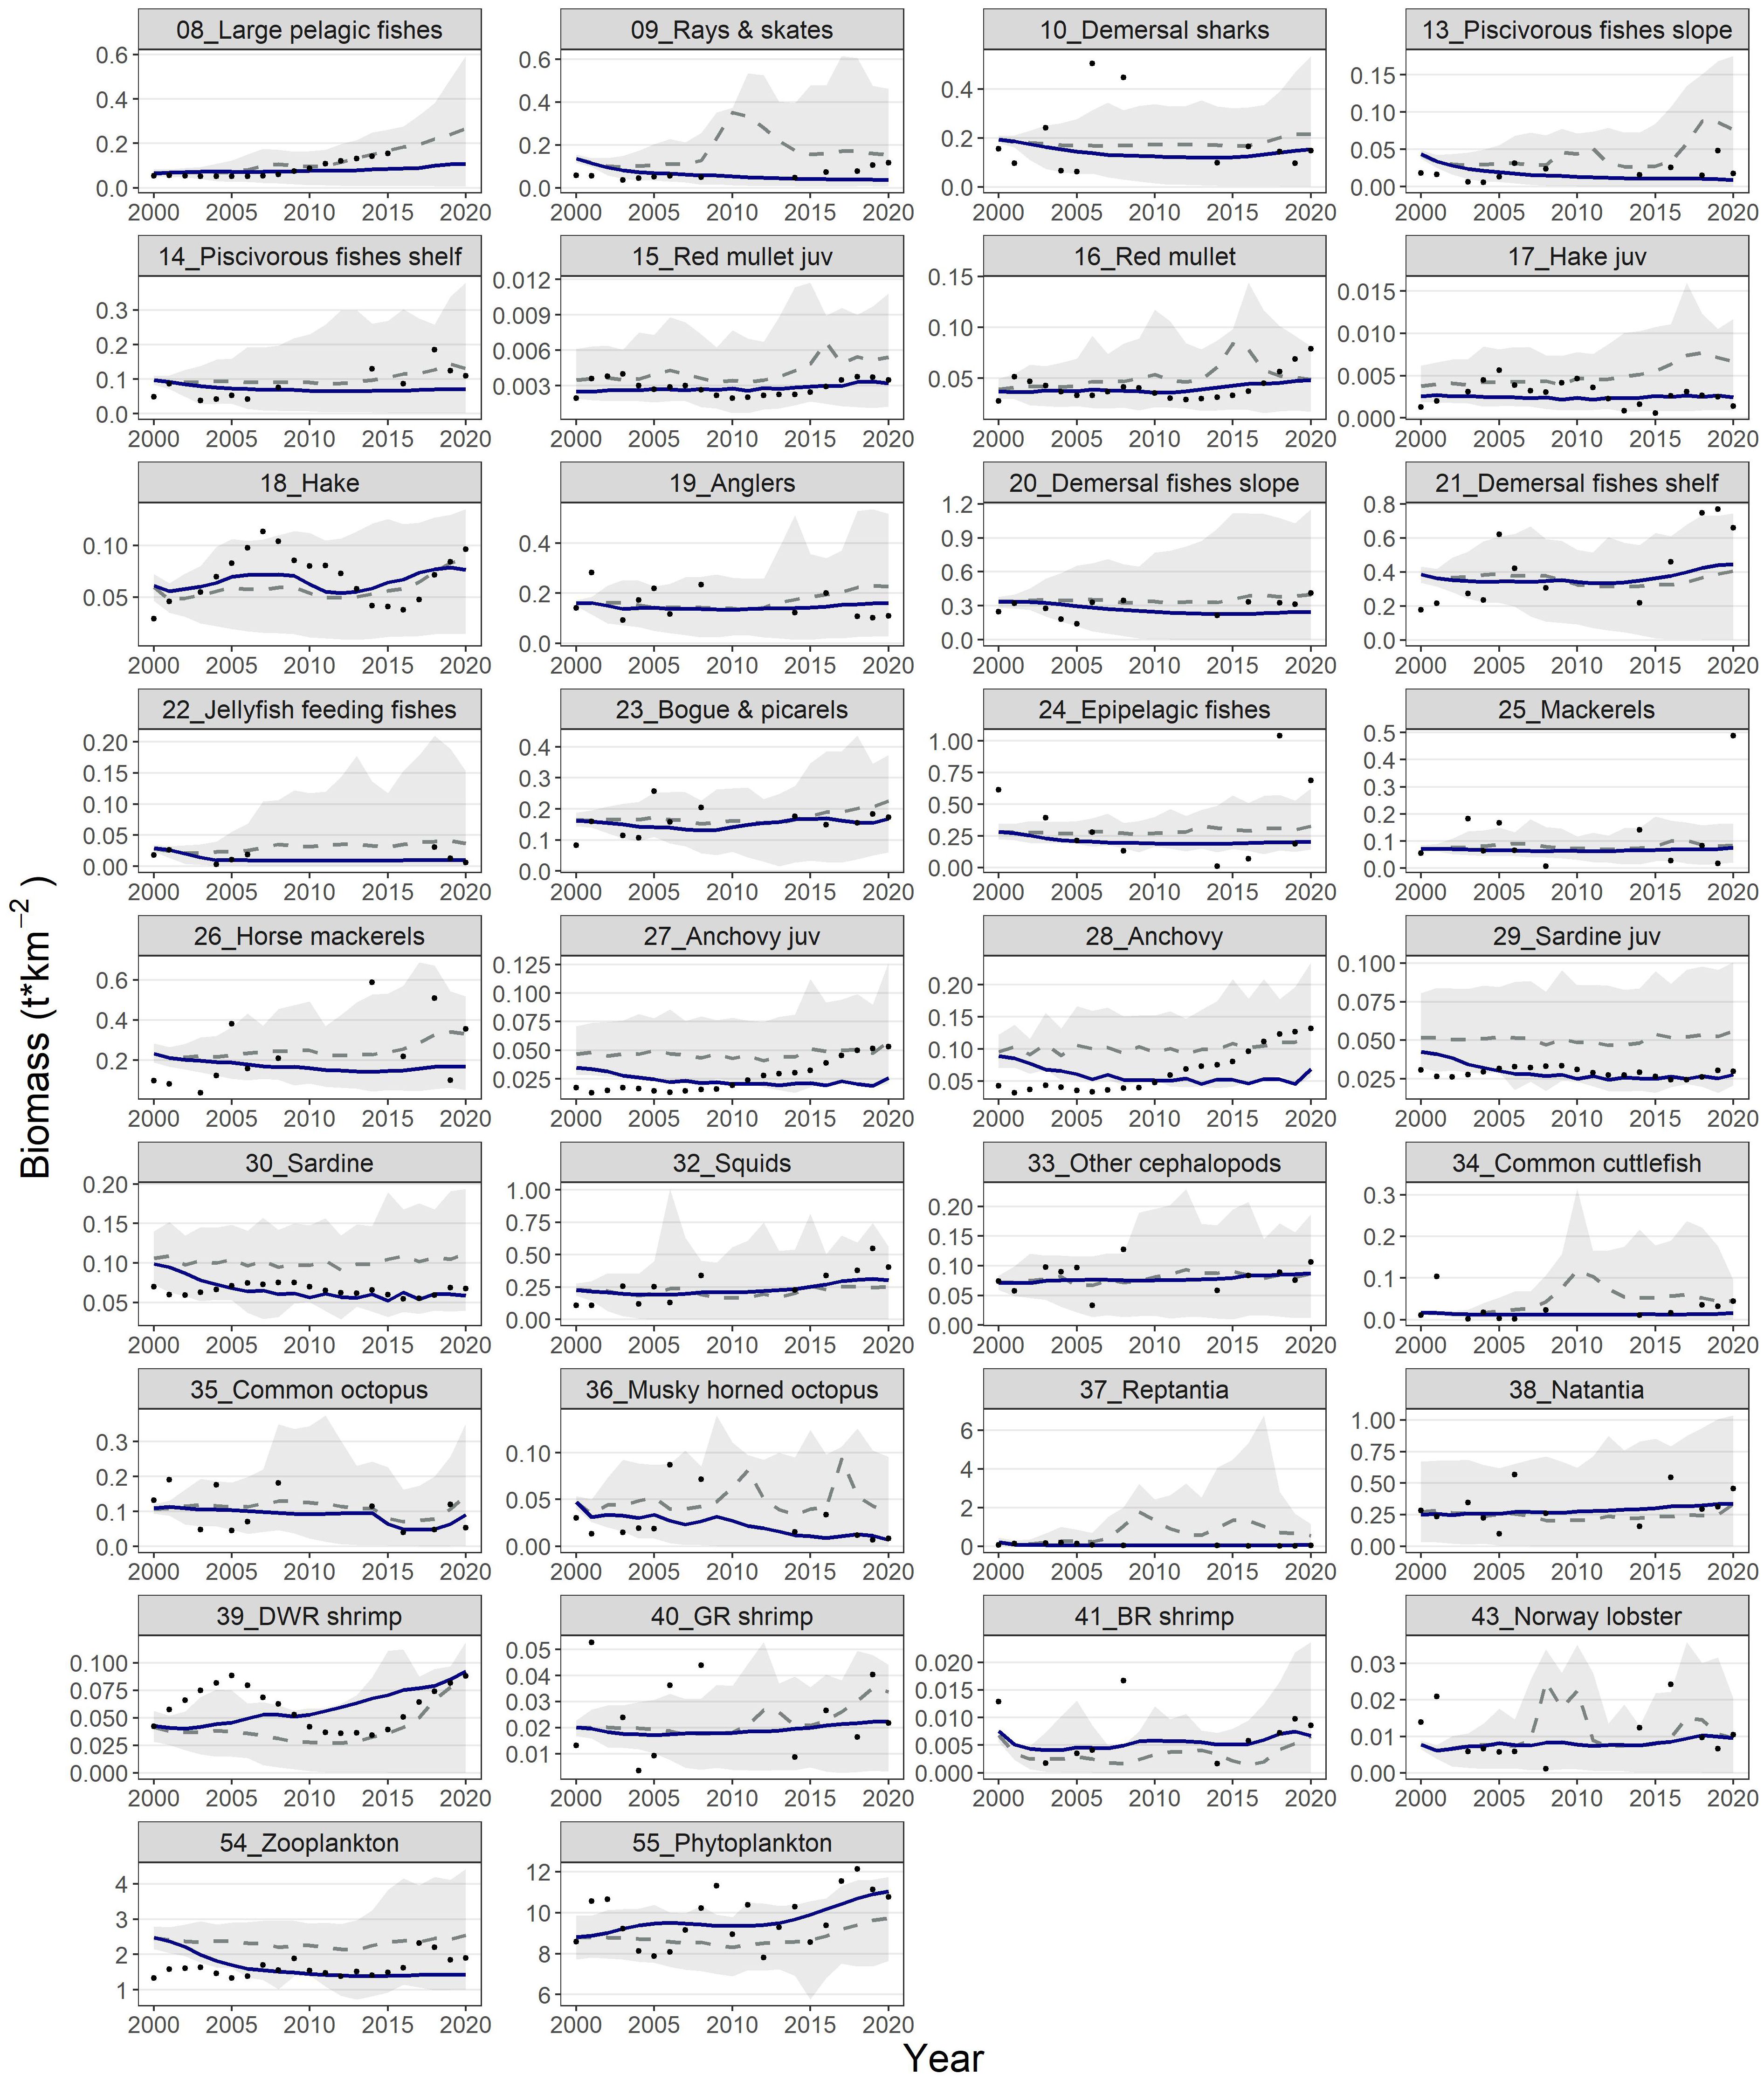
Figure 4. Predicted (blue lines) and observed (dots) biomass for the functional groups of the Ecosim model during the hindcast period (2000-2020). The dashed grey lines and shaded areas are the mean and the 5%-95% percentiles of the Monte-Carlo simulations.
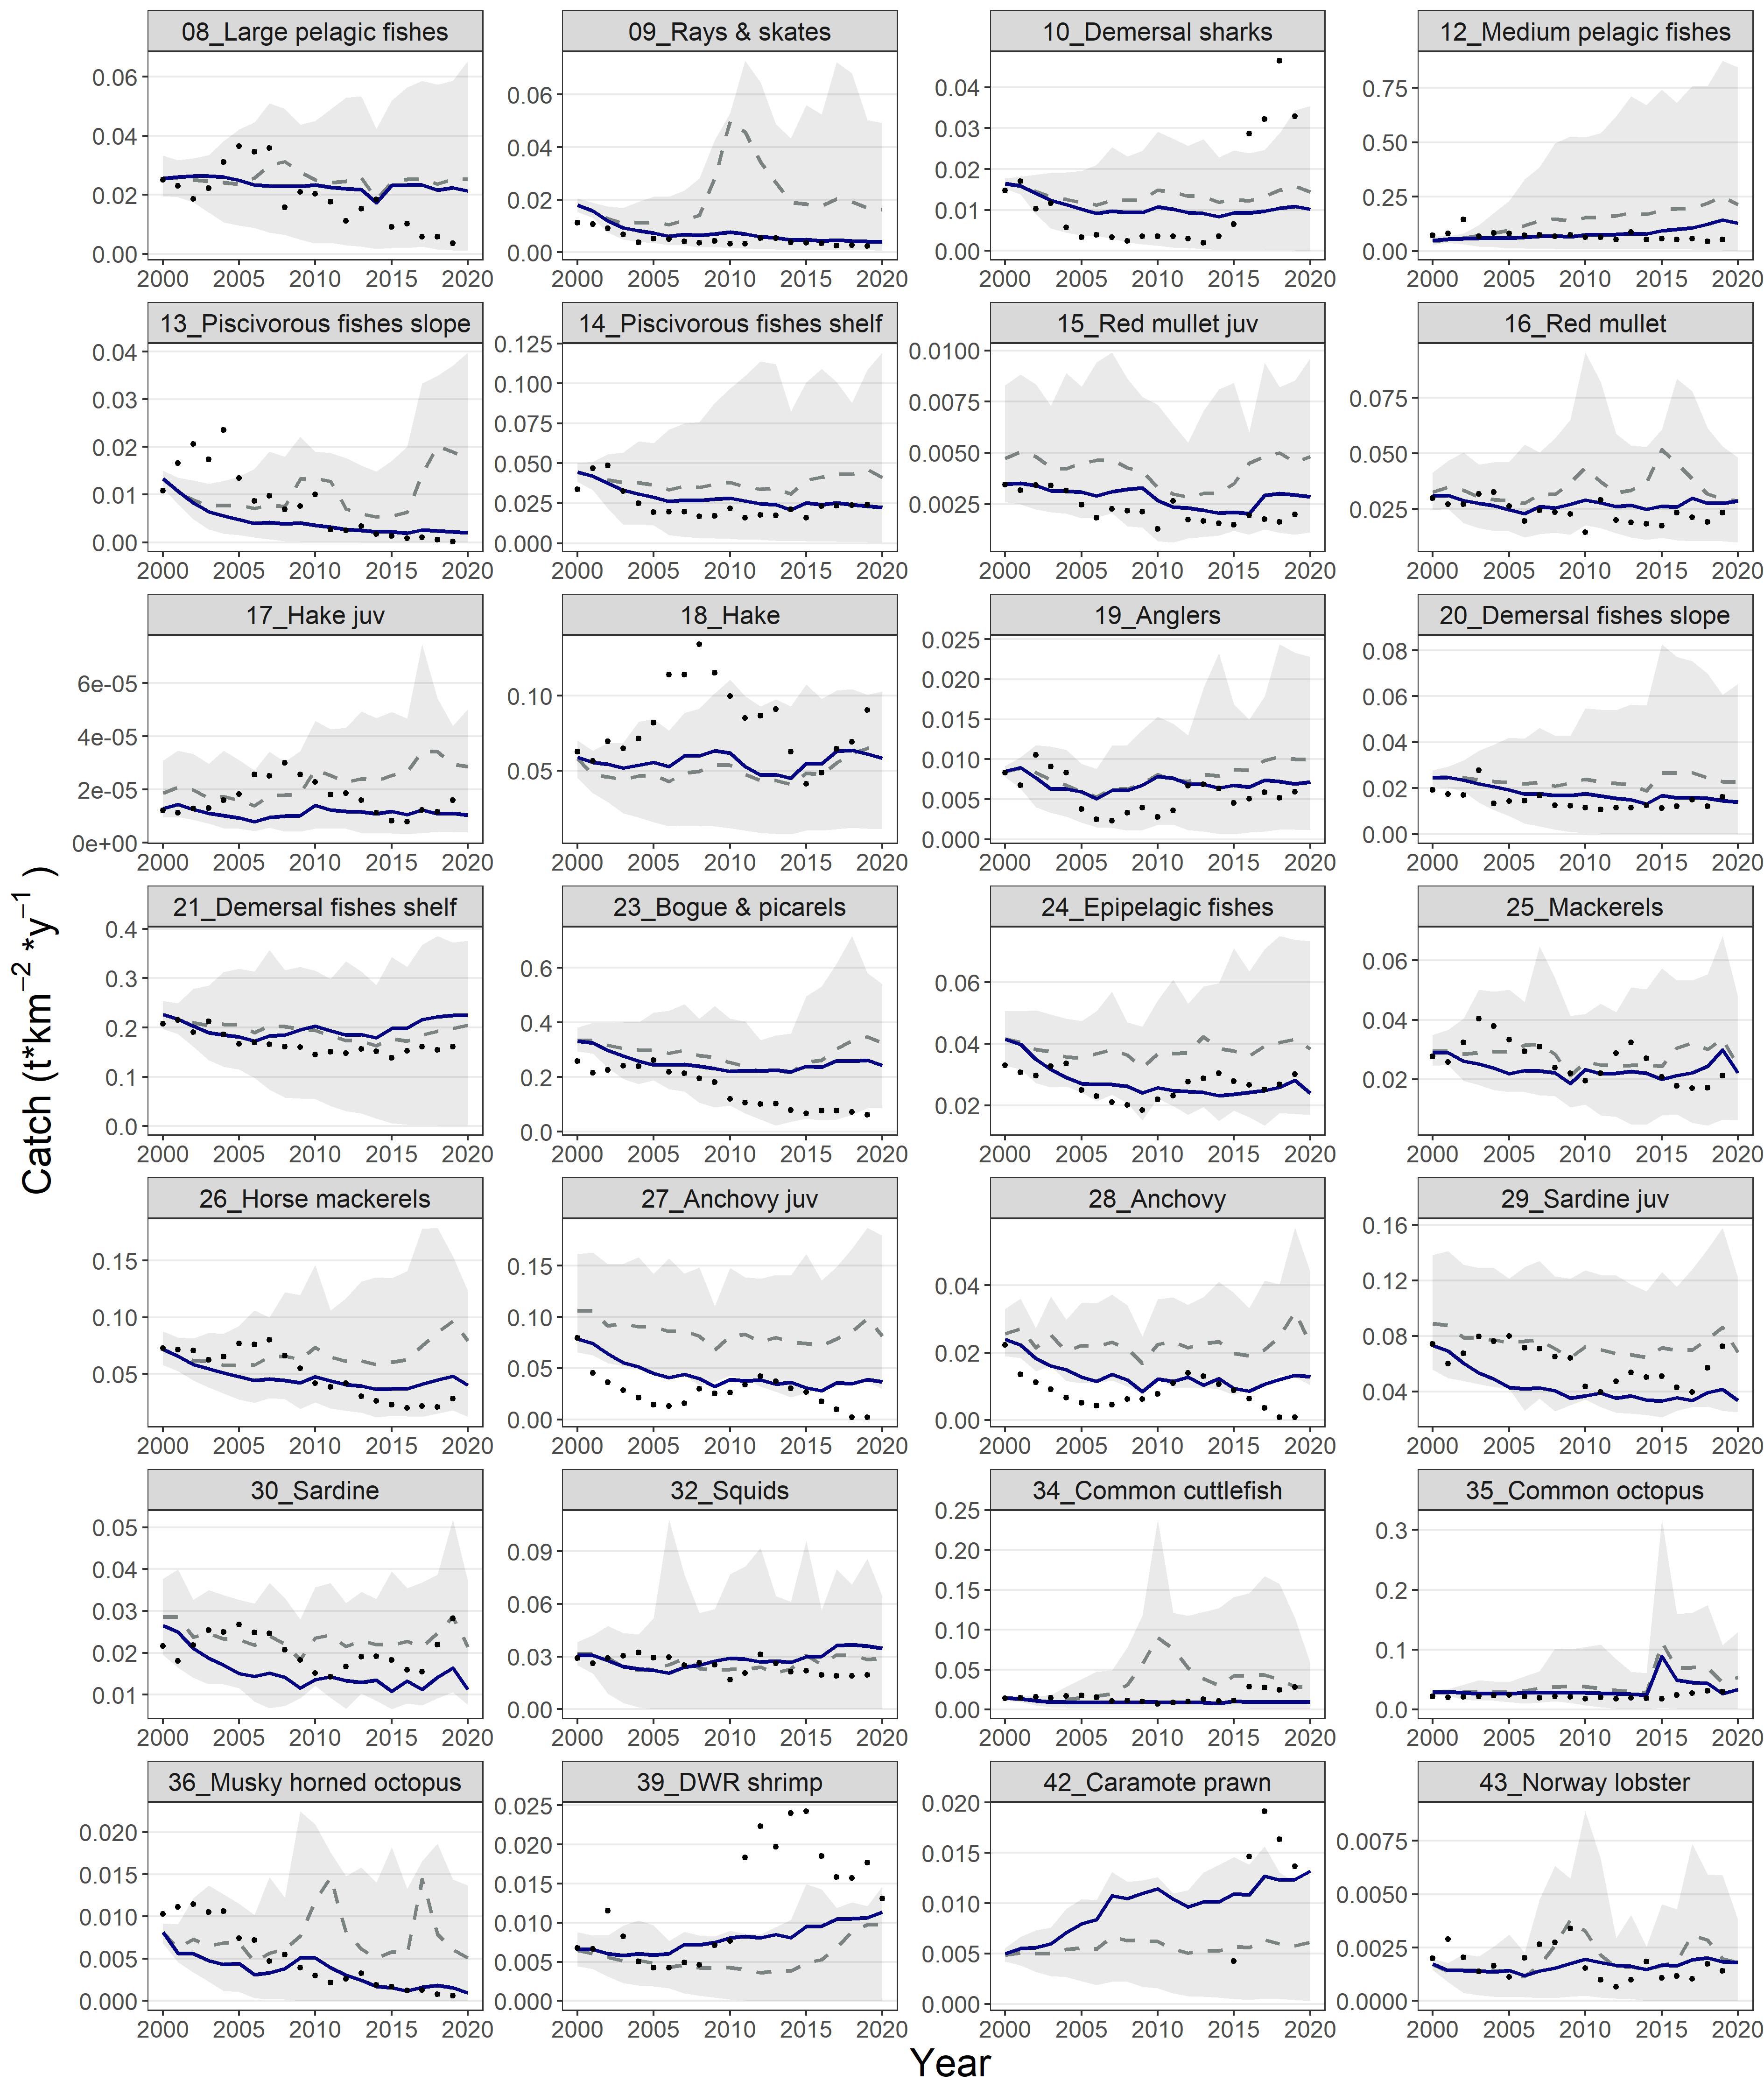
Figure 5. Predicted (blue lines) and observed (dots) catches for the functional groups of the Ecosim model during the hindcast period (2000-2020). The dashed grey lines and shaded areas are the mean and the 5%-95% percentiles of the Monte-Carlo simulations.
3.2.2 Future projections
3.2.2.1 Single stressors
3.2.2.1.1 Climate scenarios
Increases in SST under the RCP4.5 and RCP8.5 scenarios influenced similarly the biomass (Figures 6, 7) and catches (Supplementary Material, Supplementary Figures S7, S8) of the most abundant demersal and pelagic FGs, but showed varying effects across FGs. With the exception of bogue & picarels and large pelagics, the impact of the RCP4.5 scenario was subtle and relatively constant throughout the projection period for all FGs, while that of the RCP8.5 scenario was amplified in the long-term (Figure 7). Mean biomass, catch and indicator values for 2046–2050 and 2076–2080 under all scenarios did not vary significantly; therefore, the SD values were negligible and are not presented. Compared to the baseline scenario, the largest biomass increases in the mid-term under RCP4.5 and RCP8.5 scenarios were projected for piscivorous fish slope (35% and 82% respectively), musky-horned octopus (55% and 70%, respectively), mesopelagics (38% and 42%, respectively) and rays and skates (23% and 8%, respectively) (Figures 7, 8). The rest of the FGs that scored increases in their biomass in the mid-term under the RCP4.5 scenario, ranging from 0.01% to 3.15%, principally involved pelagic species (Figure 7). In the mid-term under the RCP8.5 scenario and the long-term under both scenarios, climate warming benefited demersal invertebrate FGs such as decapods and cephalopods but it had a negative impact on the biomass and catches of all pelagic FGs with the exception of medium pelagics and mackerels (Figure 7, Supplementary Material, Supplementary Figure S8) and FGs consisting of demersal fishes (e.g., demersal and piscivorous fishes shelf and slope). Among the FGs of commercial significance, red mullet and deep-water rose shrimp benefited from climate warming, showing subtle and significant long-term increases under both scenarios, respectively, for biomass (Figure 6) as well as catches (Supplementary Material, Supplementary Figure S7). In contrast, hake, demersal fishes shelf, horse mackerels, and squids displayed a gradual decline in biomass and catches under both scenarios through the mid-term, however in the long term, the RCP8.5 scenario had a distinctly adverse impact in comparison to RCP4.5 on both biomass (Figure 6) and catches (Supplementary Material, Supplementary Figure S7). Keystone FGs, rays & skates and demersal sharks, were impacted in a similar manner by both climate warming scenarios presenting an increasing trend in their biomass values for the first quarter of the projection period, while thereafter a decreasing trend followed under both scenarios, having a severe impact in the long-term on the biomass of rays & skates (20.35% and 66% under the RCP4.5 and RCP8.5, respectively) and on demersal sharks (2.23% and 40.93% under the RCP4.5 and RCP8.5, respectively) (Figure 8).
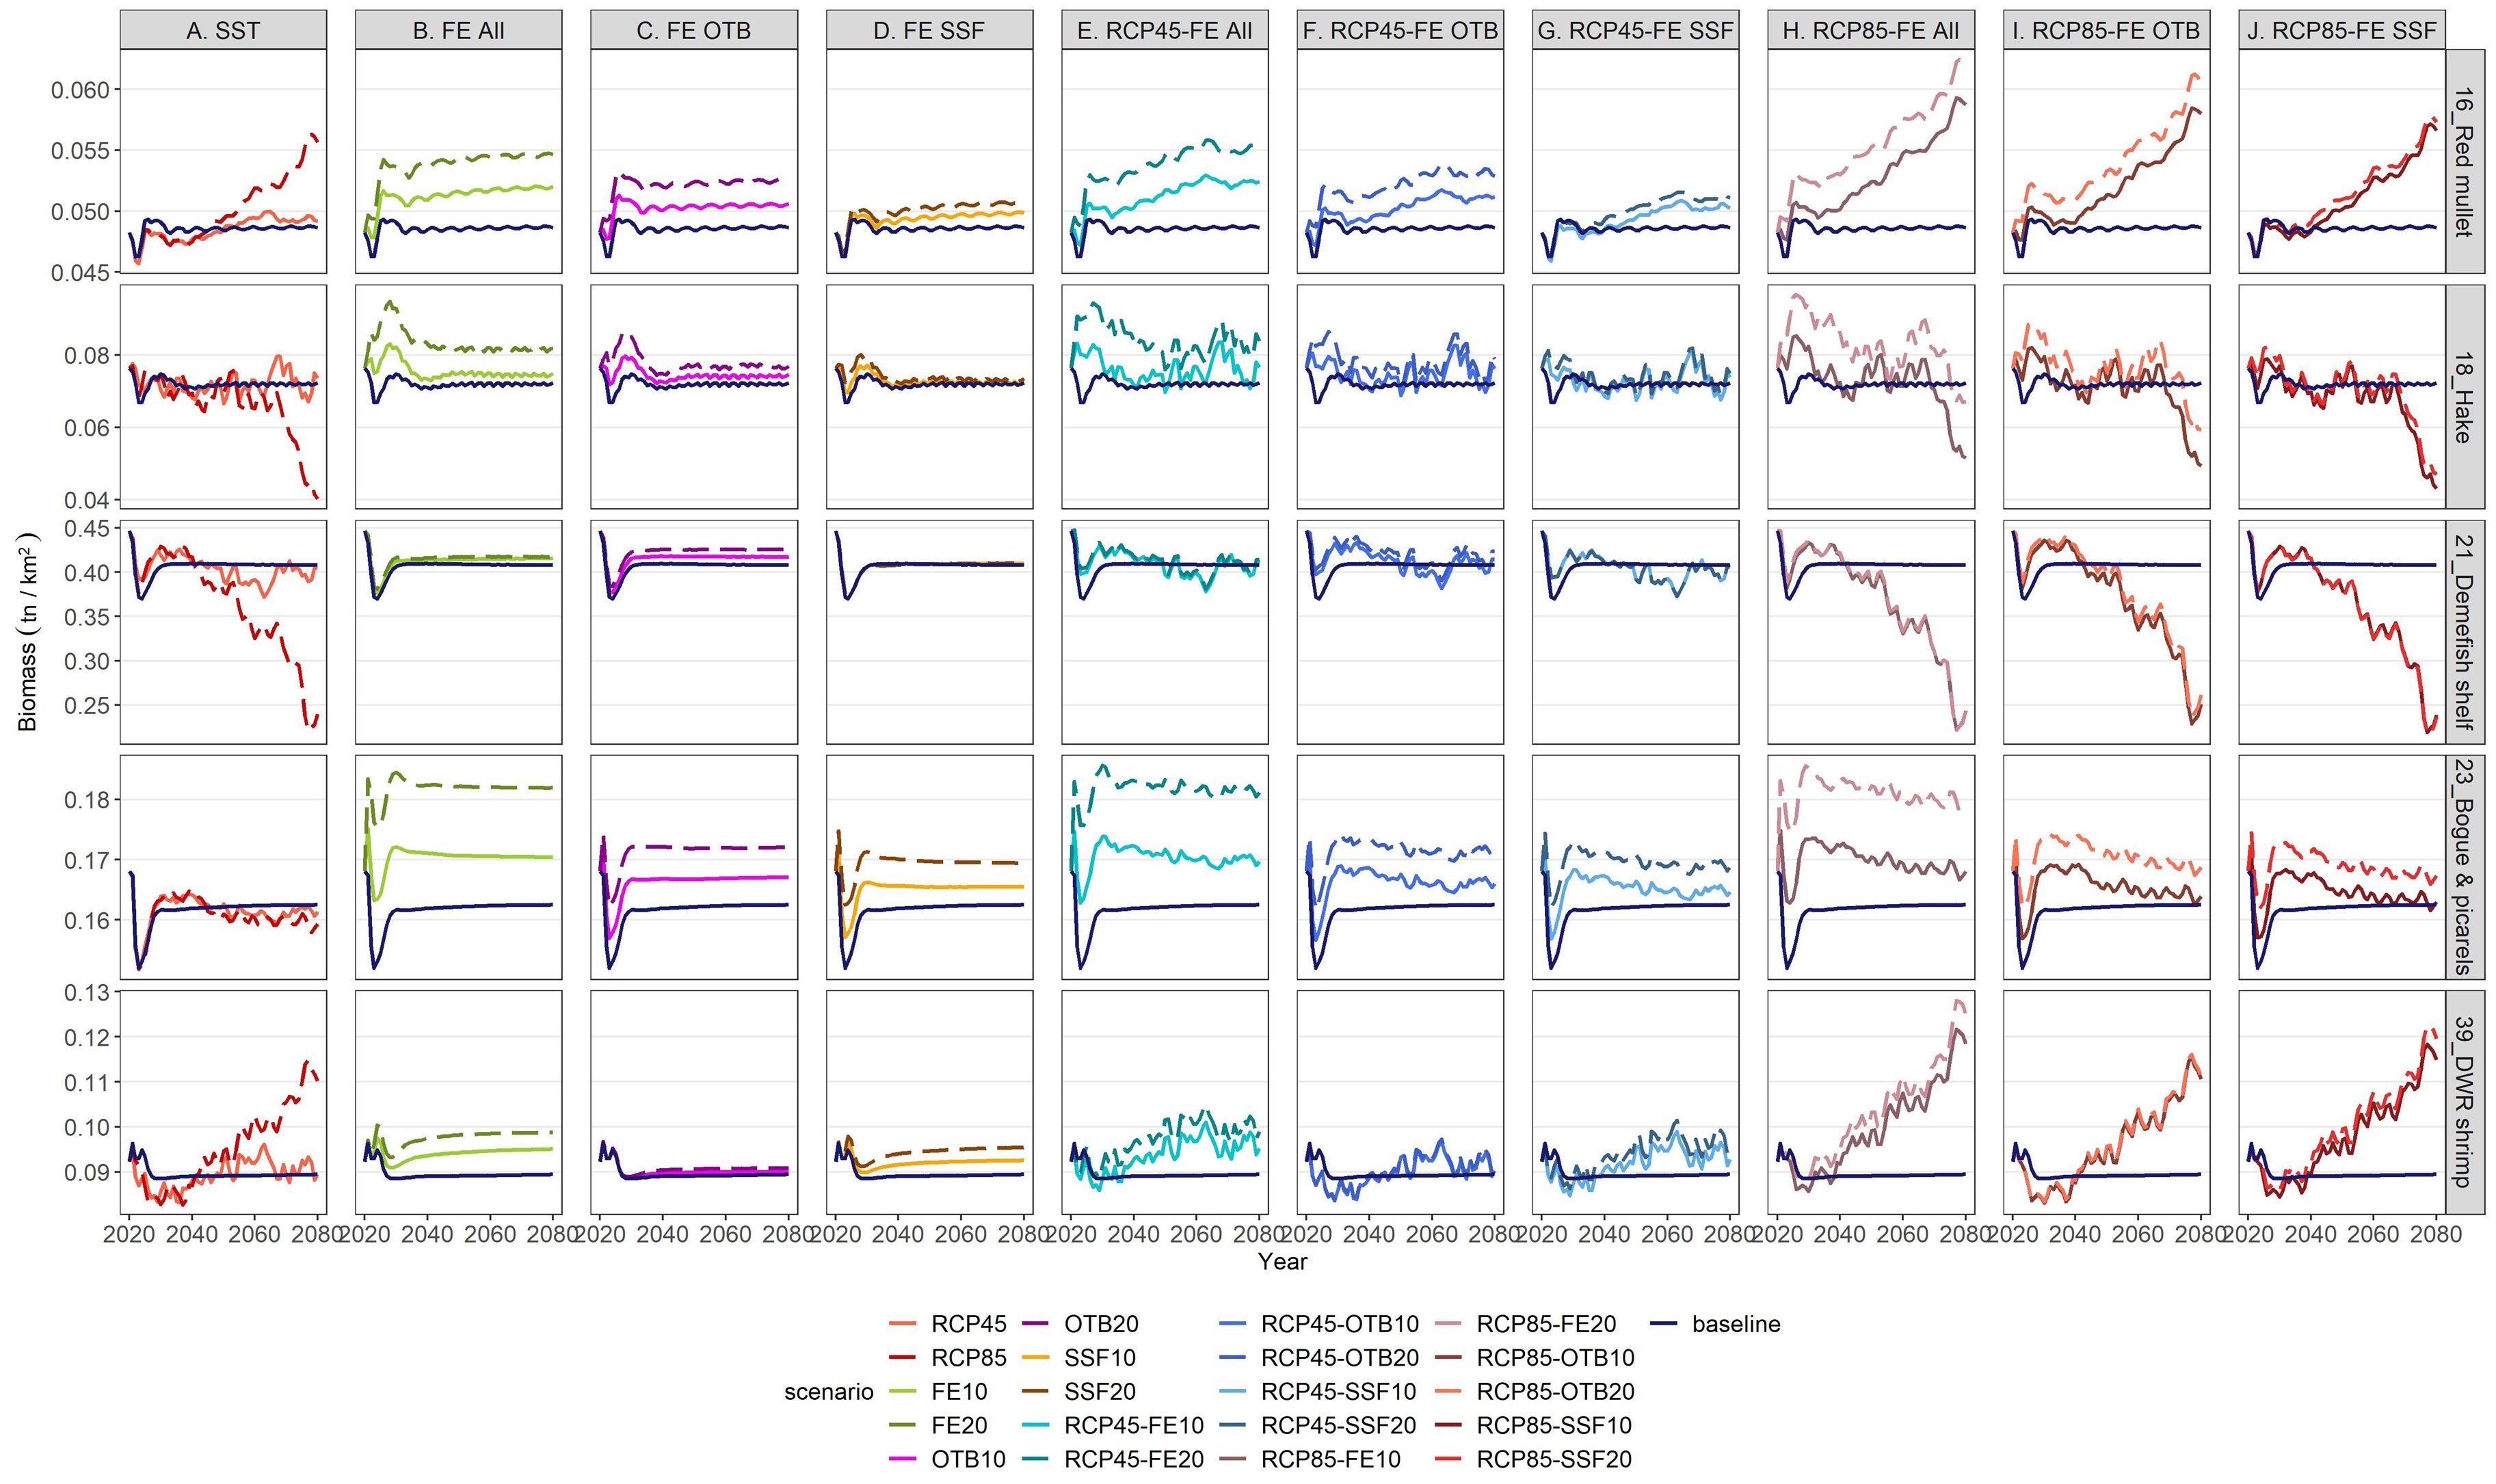
Figure 6. Biomass projections for 5 selected demersal FGs (red mullet, hake, demersal fishes shelf, bogue & picarels and deep-water rose shrimp) under individual and combined stressors in relation to the baseline scenario (dark blue solid lines) for the period 2021–2080.
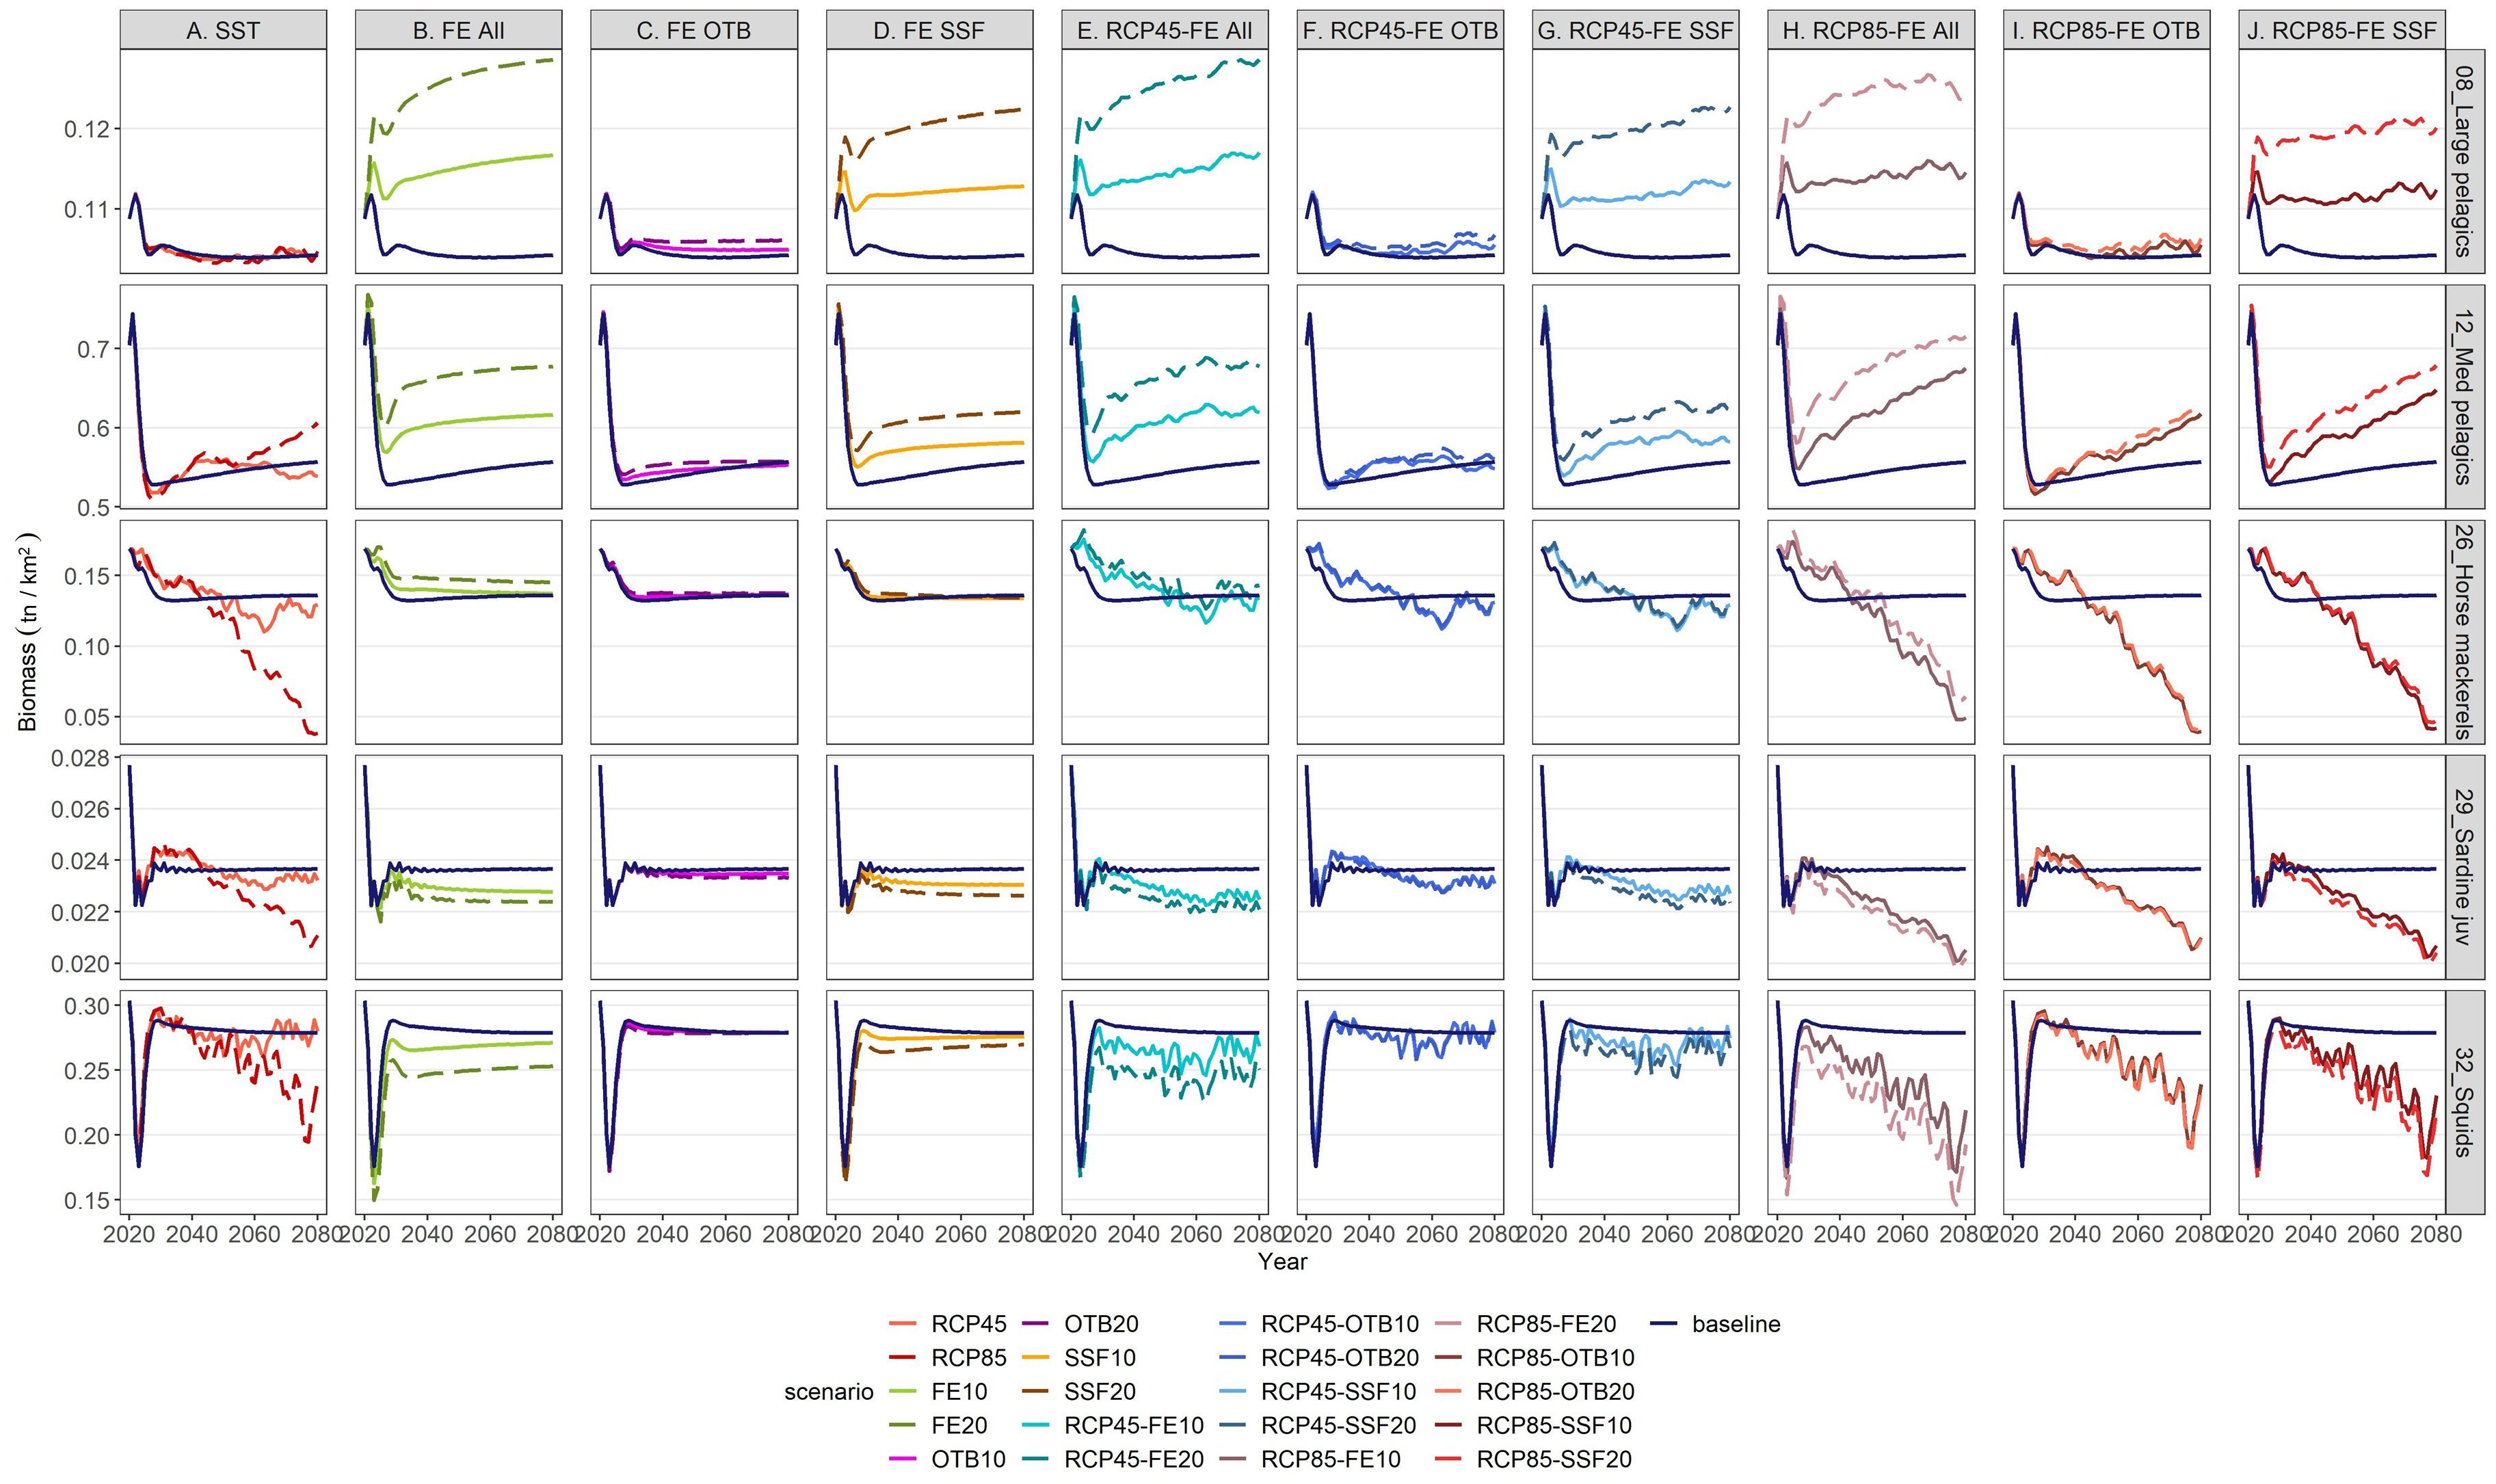
Figure 7. Biomass projections for 5 selected pelagic FGs (large pelagics, medium pelagics, horse mackerels, sardine juveniles and squids) under individual and combined stressors in relation to the baseline scenario (dark blue solid lines) for the period 2021–2080.
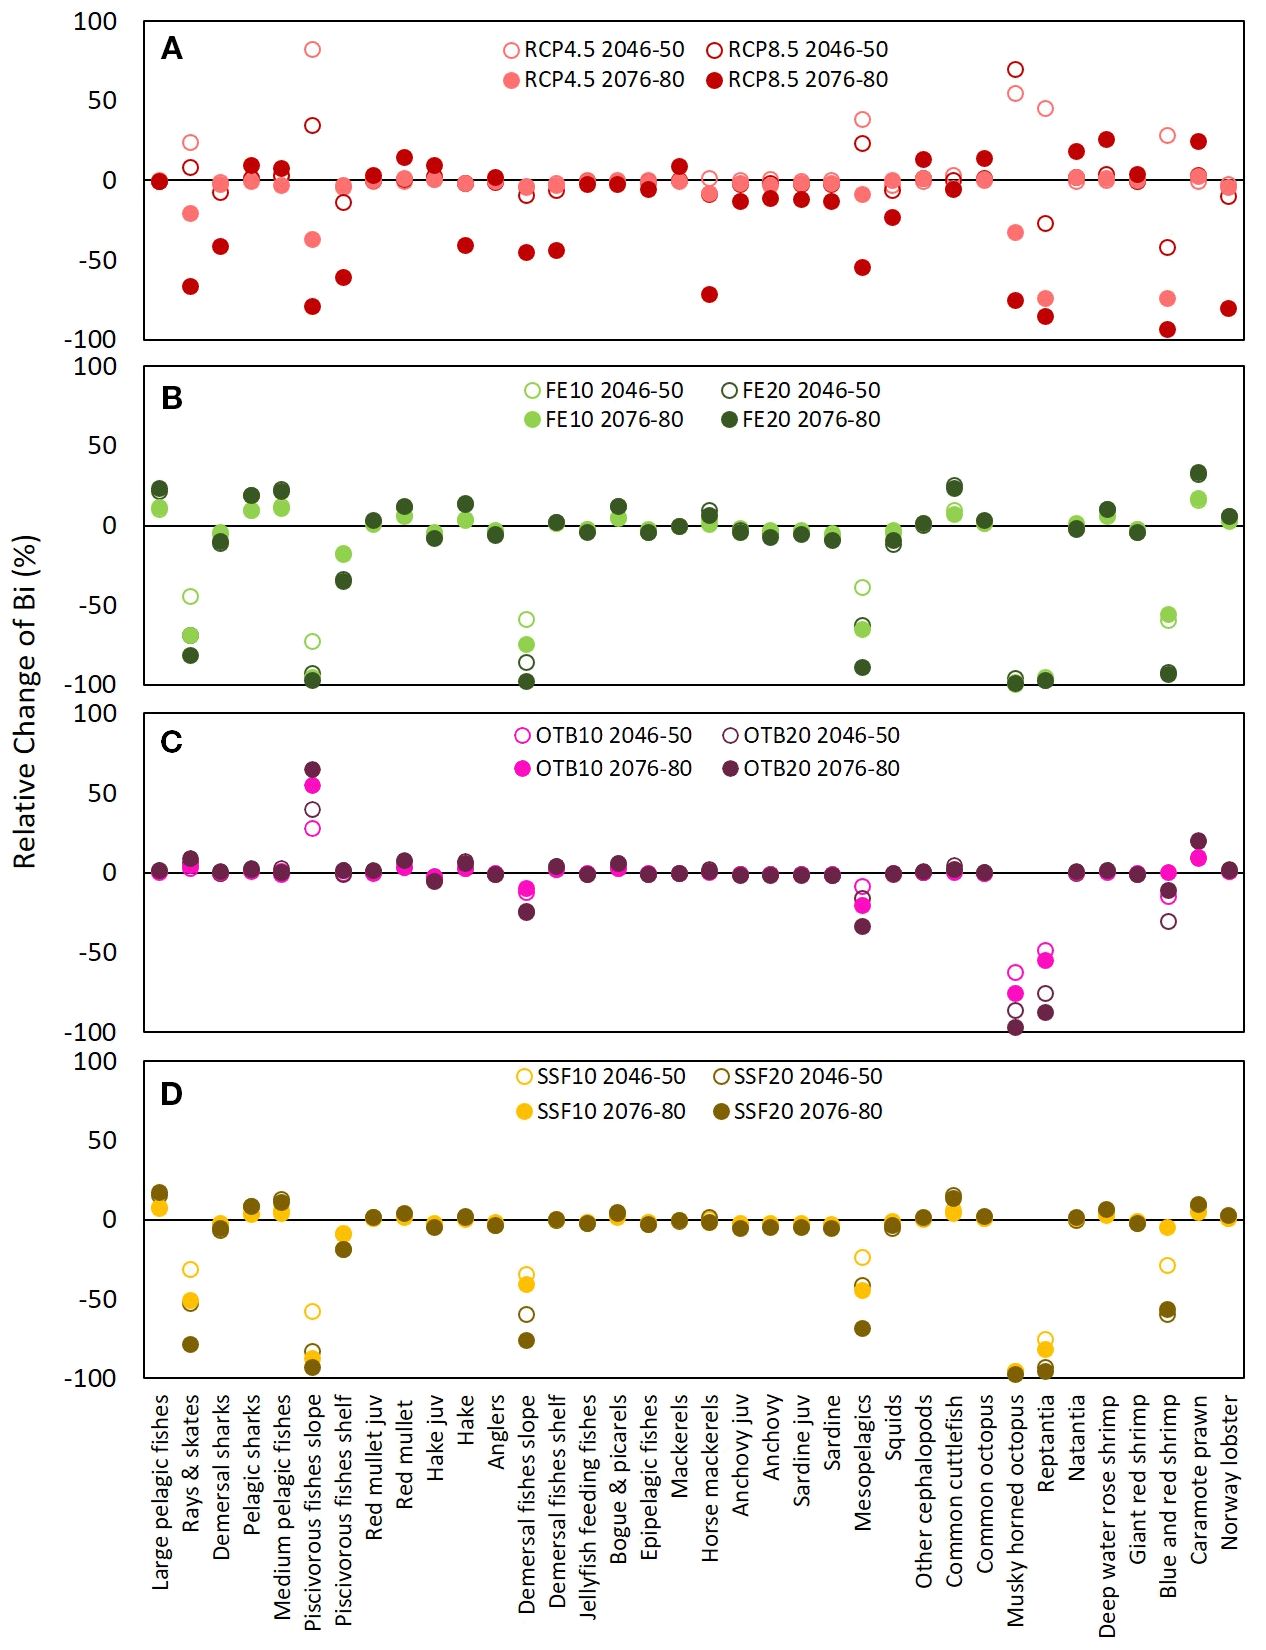
Figure 8. Graphical representation of the relative change (%) in functional group (FG) biomass in the mid-term (2046–2050) and long-term (2076–2080) under eight single-stressor scenarios compared to the baseline scenario. These include two climate change pathways (RCP4.5 and RCP8.5) (A), two levels of fishing effort reduction (10% and 20%) across all gears (FE10 and FE20) (B), reductions applied only to bottom trawl (OTB10 and OTB20) (C), and reductions applied only to small-scale fisheries (SSF10 and SSF20) (D).
3.2.2.1.2 Fishing effort reduction
Concerning FE reduction projections, all 20% reduction scenarios (FE20, OTB20, SSF20) exerted approximately double the impact of the respective 10% reduction scenarios (FE10, OTB10, SSF10), while the effect of both levels of reduction remained constant across the projection period (Figures 6, 7). The FGs that were the most vulnerable to FE shifts, regardless of the gear tested, were rays & skates, piscivorous fishes slope, demersal fishes slope, musky-horned octopus and reptantia (Figure 8). Relative to the baseline scenario, the uniform reduction of fishing effort across all fishing gears (FE10 and FE20) had a noticeable positive impact in the mid-term on the biomass for the majority of the commercially important FGs such as large pelagics (10 and 21%), medium pelagics (12 and 23%), red mullet (5 and 11%), hake (4 and 14%), bogue & picarels (5 and 12%), and deep-water rose shrimp (6 and 10%), while a more moderate increase was observed for demersal fishes shelf (1 and 2%) and horse mackerels (4 and 10%, respectively) (Figure 8). Catches of all FGs scored a decline for both FE reduction scenarios throughout the projection period, indicating that biomass increases were insufficient to offset the decline in landings resulting from effort reduction (Supplementary Material, Supplementary Figures S7, S8).
When fishing effort reduction was implemented only on bottom trawling (OTB10 and OTB20) notable increases were scored for piscivorous fishes slope and caramote prawn in the mid-term and the long-term (Figure 8). Moderate biomass increases were projected in the mid-term and were rather constant through the long-term for the red mullet, hake, bogue & picarels and demersal fishes shelf (Figures 6, 7). Observed reductions in landings were primarily noted for target species associated with otter bottom trawl (OTB) fisheries, including red mullet, hake, bogue and picarels, as well as for deep-water rose shrimp, while from the pelagic domain a decline in landings was highlighted for squids (Supplementary Material, Supplementary Figure S8).
The reduction of fishing effort for small scale fisheries scenarios (SSF10 and SSF20) primarily benefited the biomass of large and medium pelagic fishes while moderate long-term increases were observed for red mullet, bogue & picarels and deep-water rose shrimp (Figures 6, 7). In contrast, declines were observed for sardine juveniles and squid biomass, most likely due to increased top-down predation pressure by the rising biomass of large and medium pelagic species. Although hake is a key target for SSF, particularly nets, its biomass showed only a slight mid-term increase (0.88% for SSF10; 2.32% for SSF20) (Figure 8). Finally, catches decreased for most commercial FGs, except for red mullet and medium pelagic species that were not affected by SSF fishing pressure reductions (Supplementary Material, Supplementary Figures S7, S8).
3.2.2.2 Compounded effect of fishing effort reduction and climate change on FGs
The first set of cumulative scenarios, assuming RCP4.5 and FE release (FE10, FE20, OTB10, OTB20, SSF10, SSF20), triggered an increase in biomass values of important commercial species such as red mullet, bogues & picarels and large and medium pelagic under all six fishing pressure levels, except for large and medium pelagics under scenarios RCP4.5-OTB (Figure 9). Hake biomass presented a similar temporal pattern during the projection period under all 6 scenarios, however, it benefitted mostly when effort reduction concerned all fishing gears, and to a lesser extent when it concerned only trawls, while it marginally increased with the 20% reduction of SSF fishing pressure (Figure 9). On the other hand, sardine juveniles and squid biomass declined moderately in relation to the baseline scenario. Regarding keystone FGs, rays & skate biomass was severely impacted by all scenarios (from 11.23% to 92.84%) except for the two combined scenarios assuming OTB reduction in the mid-term (27.27% and 30.69% for RCP-OTB10 and RCP4.5-OTB20, respectively), while biomass of demersal sharks decreased under all scenarios but to a lesser extent (from 0.5% to 12%) (Figure 9).
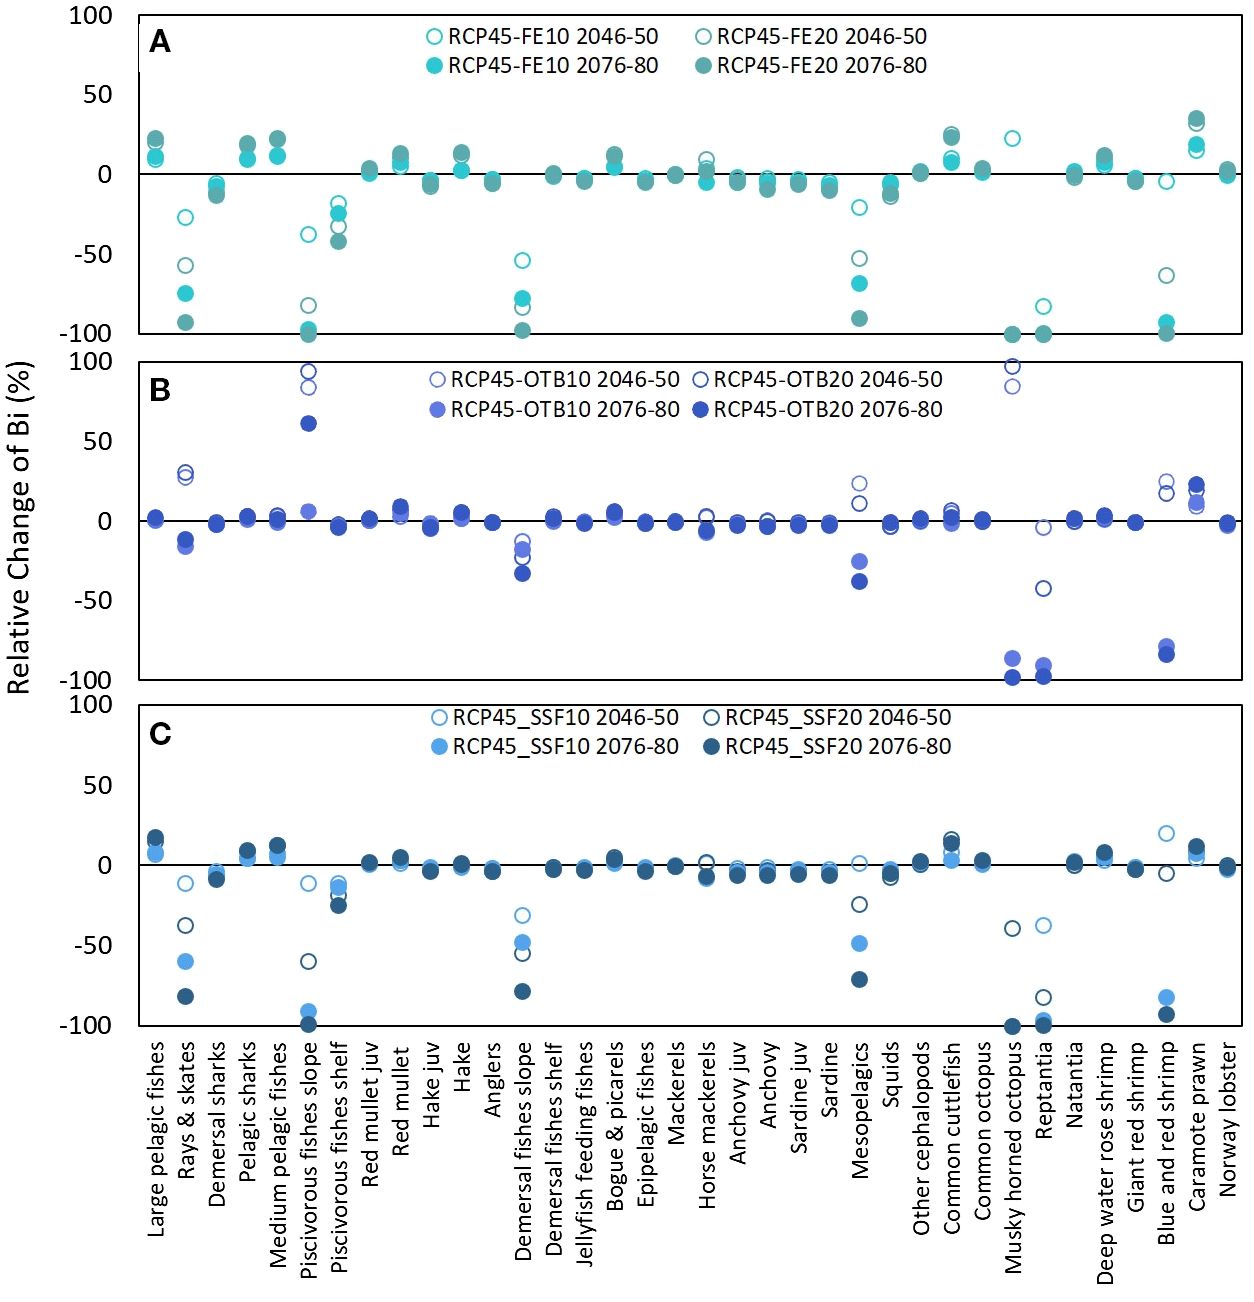
Figure 9. Graphical representation of relative change (%) in functional group (FG) biomass in the mid-term (2046–2050) and long-term (2076–2080) under six compounded stressor scenarios assuming RCP4.5 and two levels of fishing effort reduction (10% and 20%) across all gears (RCP4.5-FE10 and RCP4.5-FE20) (A), reductions applied only to bottom trawl (RCP4.5-OTB10 and RCP4.5-OTB20) (B), and reductions applied only to small-scale fisheries (RCP4.5-SSF10 and RCP4.5-SSF20) (C).
Multi-stressor RCP8.5 scenarios (Figure 10), overall, resulted in greater declines in biomass values for the impacted FGs, in relation to the respective RCP4.5 scenarios across all tested scenarios and throughout the examined period. Some characteristic examples were demersal sharks, piscivorous and demersal fishes shelf, horse mackerels, squids and Norway lobster, especially in the long-term. The rise of temperature according to RCP8.5 in the multi-stressor scenarios also had a detrimental impact on the biomass and catches of commercial FGs (hake, demersal fishes shelf, horse mackerels, sardine juveniles, squids) while proved highly advantageous for climate change winners, such as red mullet and deep-water rose shrimp, and overfished FGs, such as bogue and picarels (Figure 6) and large and medium pelagic fishes (Figure 7). Interestingly, all combined scenarios were beneficial for all cephalopods apart from squids.
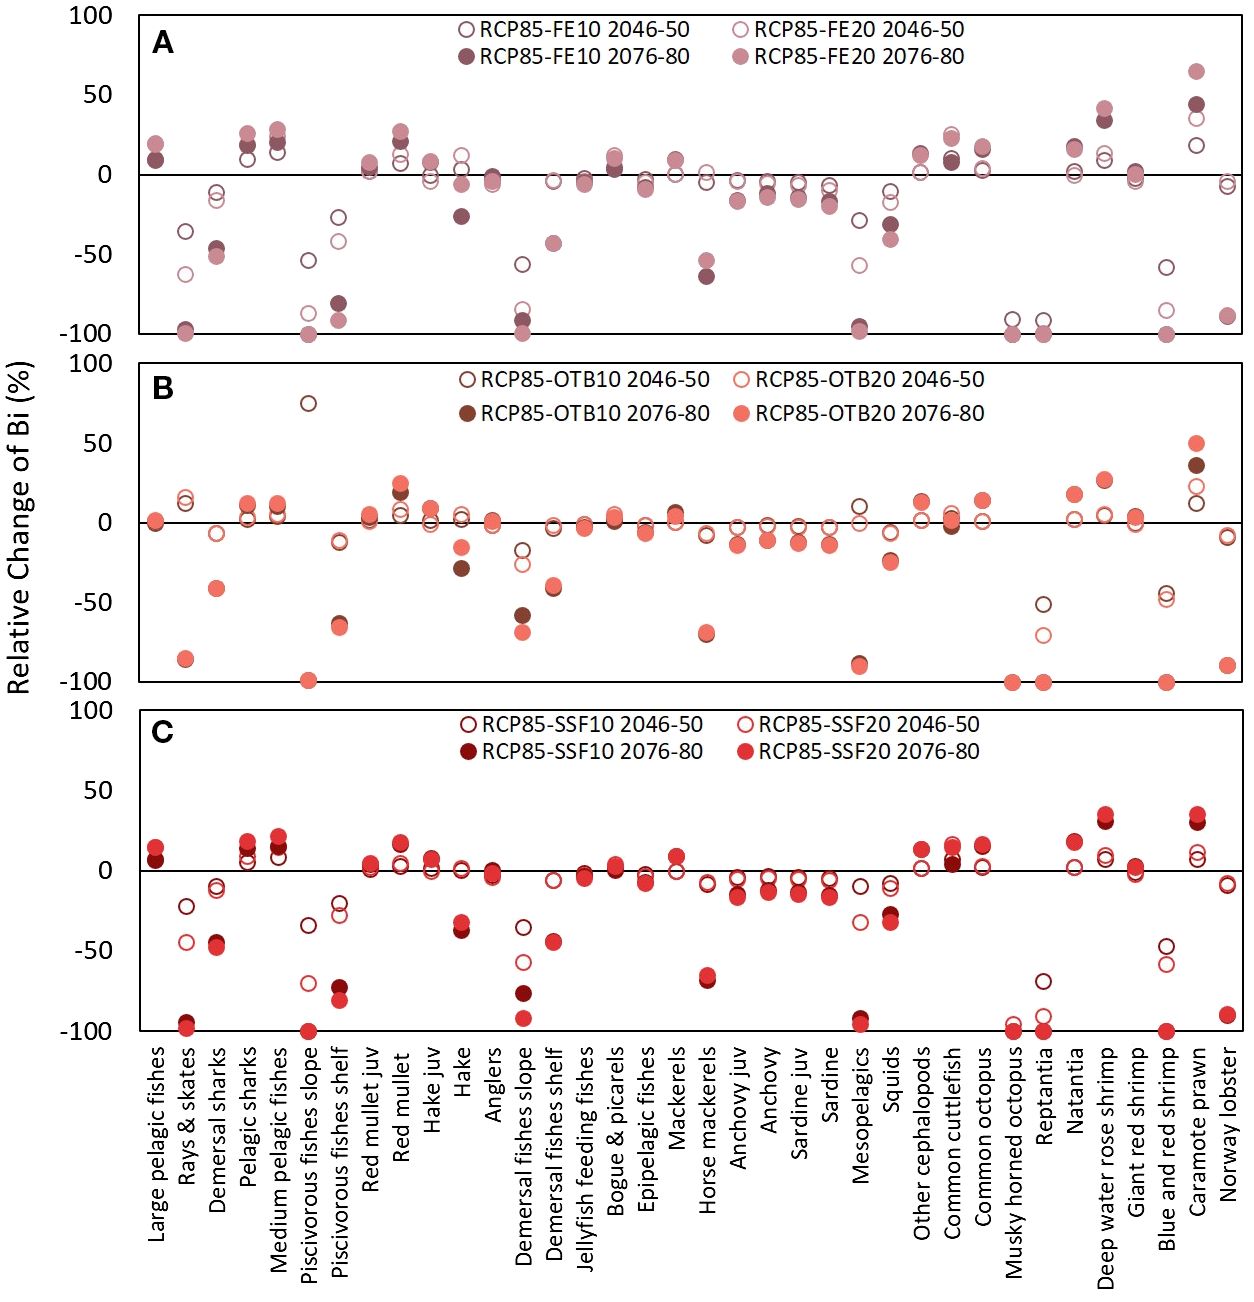
Figure 10. Graphical representation of relative change (%) in functional group (FG) biomass in the mid-term (2046–2050) and long-term (2076–2080) under six compounded stressor scenarios assuming RCP8.5 and two levels of fishing effort reduction (10% and 20%) across all gears (RCP8.5-FE10 and RCP8.5-FE20) (A), reductions applied only to bottom trawl (RCP8.5-OTB10 and RCP8.5-OTB20) (B), and reductions applied only to small-scale fisheries (RCP8.5-SSF10 and RCP8.5-SSF20) (C).
3.2.3 Interaction of stressors
Across the six combined scenarios assuming RCP4.5 and reduced fishing effort, the biomass of most functional groups (FGs) was positively affected in the mid-term under the RCP4.5-FE10, RCP4.5-OTB10, and RCP4.5-OTB20 scenarios (Table 4). In contrast, under the combined scenarios assuming RCP8.5 and reduced fishing effort, cumulative impacts were predominantly negative for the majority of FG biomass values (29 to 33 FGs), regardless of the type or degree of fishing effort reduction.
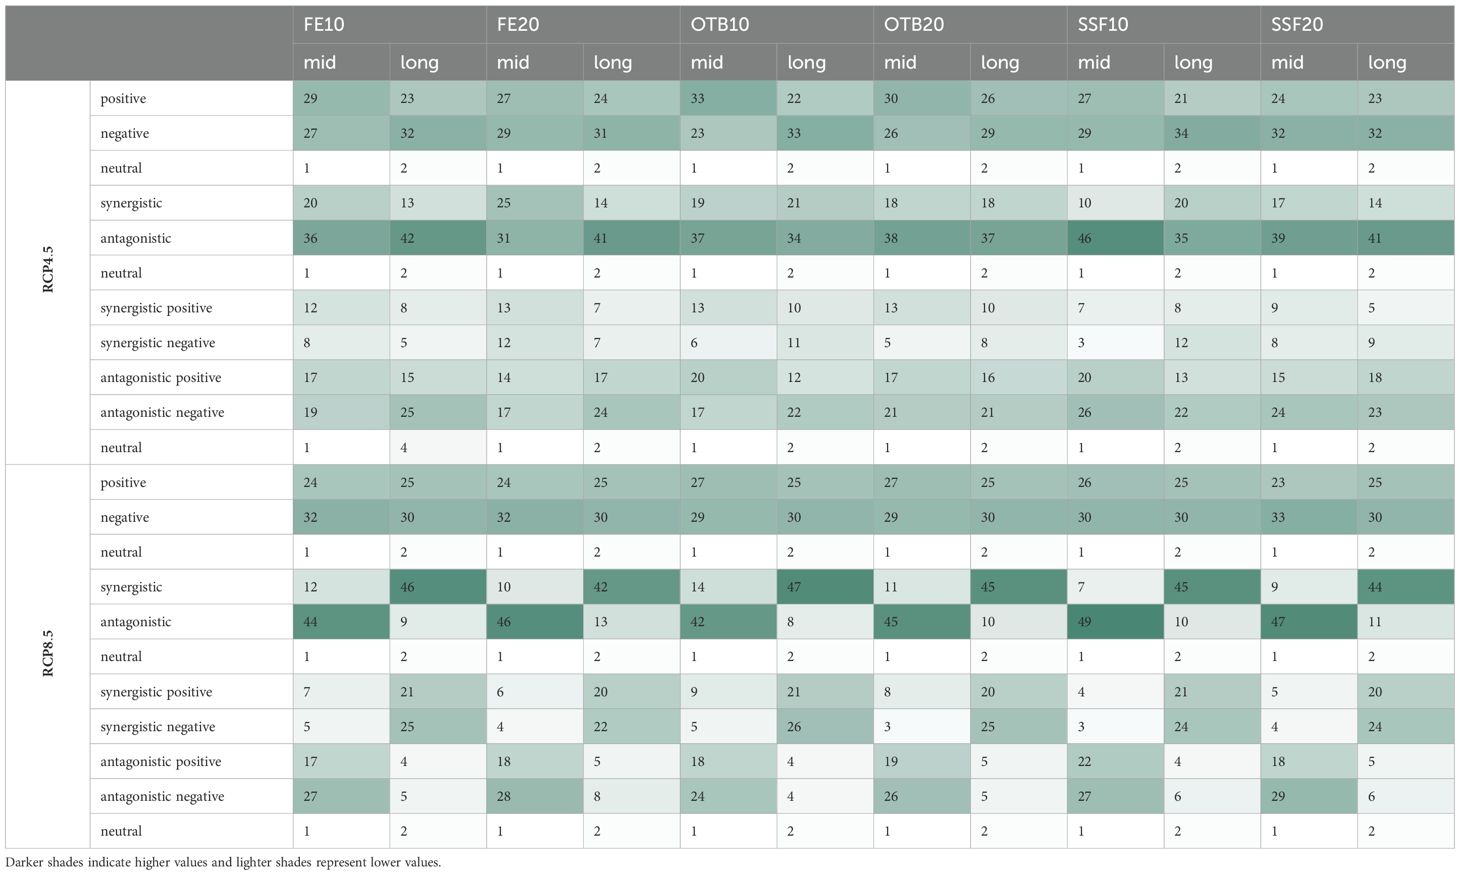
Table 4. Sum of functional groups (FGs) in which climate warming and reduced fishing effort interacted synergistically or antagonistically across the 12 combined scenarios for the mid-term (2046–2050) and long-term (2076–2080) periods and the number of FGs positively, negatively or neutrally affected by the cumulative effects.
The interaction between climate warming and fishing pressure, assessed through functional group biomass variations, differed across scenarios and was influenced by both the magnitude of temperature increase and the degree of fishing effort reduction. These drivers interacted in synergistic, antagonistic, or neutral ways (Table 4). Under the combined RCP4.5 and reduced fishing effort scenarios, antagonistic interactions were predominant, representing 54 to 80% (31 to 46 out of 57 FGs) of total interactions across the simulation period. Conversely, under the respective RCP8.5 scenarios, a distinct shift was observed from predominantly antagonistic interactions (73–85%) in the mid-term to synergistic ones (73–82%) in the long-term across all fishing effort reduction types and levels. The long-term increase in synergistic interactions included both positive and negative effects, however, the latter were more prevalent (Table 4). Finally, neutral interactions were consistently observed for jellyfish throughout the projection period across all scenarios, while for mesopelagic species, such interactions emerged only in the long term (Supplementary Material, Supplementary Tables S9, S10).
3.2.4 Indicators responses
Our results suggest that the fish community of the EIS was profoundly affected by all individual stressors in the long term, with biomass reductions ranging from 42% to 53% with losses being more pronounced in the demersal environment (47% to 63%) (Figure 11). Total fish biomass was affected by increasing temperature, while, maximum loses in fish biomass were observed under the RCP8.5-SSF20 scenario (54%) mostly in the demersal fish community (67%) and especially on benthivores (55%). Concerning trophic guilds, benthivores were the most impacted group, as their biomass decreased under all scenarios but the most marked depletions were under RCP8.5 in the long-term (40%), and effort reductions in all gears and SSF (Figure 11). Conversely, piscivore biomass increased under effort reduction for all gears and SSF, while decreased under climate warming and OTB effort reduction scenarios. The cumulative impact of stressors on fish biomass had a more pronounced effect in relation to single stressors for both positive and negative outcomes (Figure 12). Finally, minimum impact was observed for planktivores for all examined scenarios with the exception of RCP8.5 simulation in the long-term that created biomass losses of 17% compared to the baseline scenario.
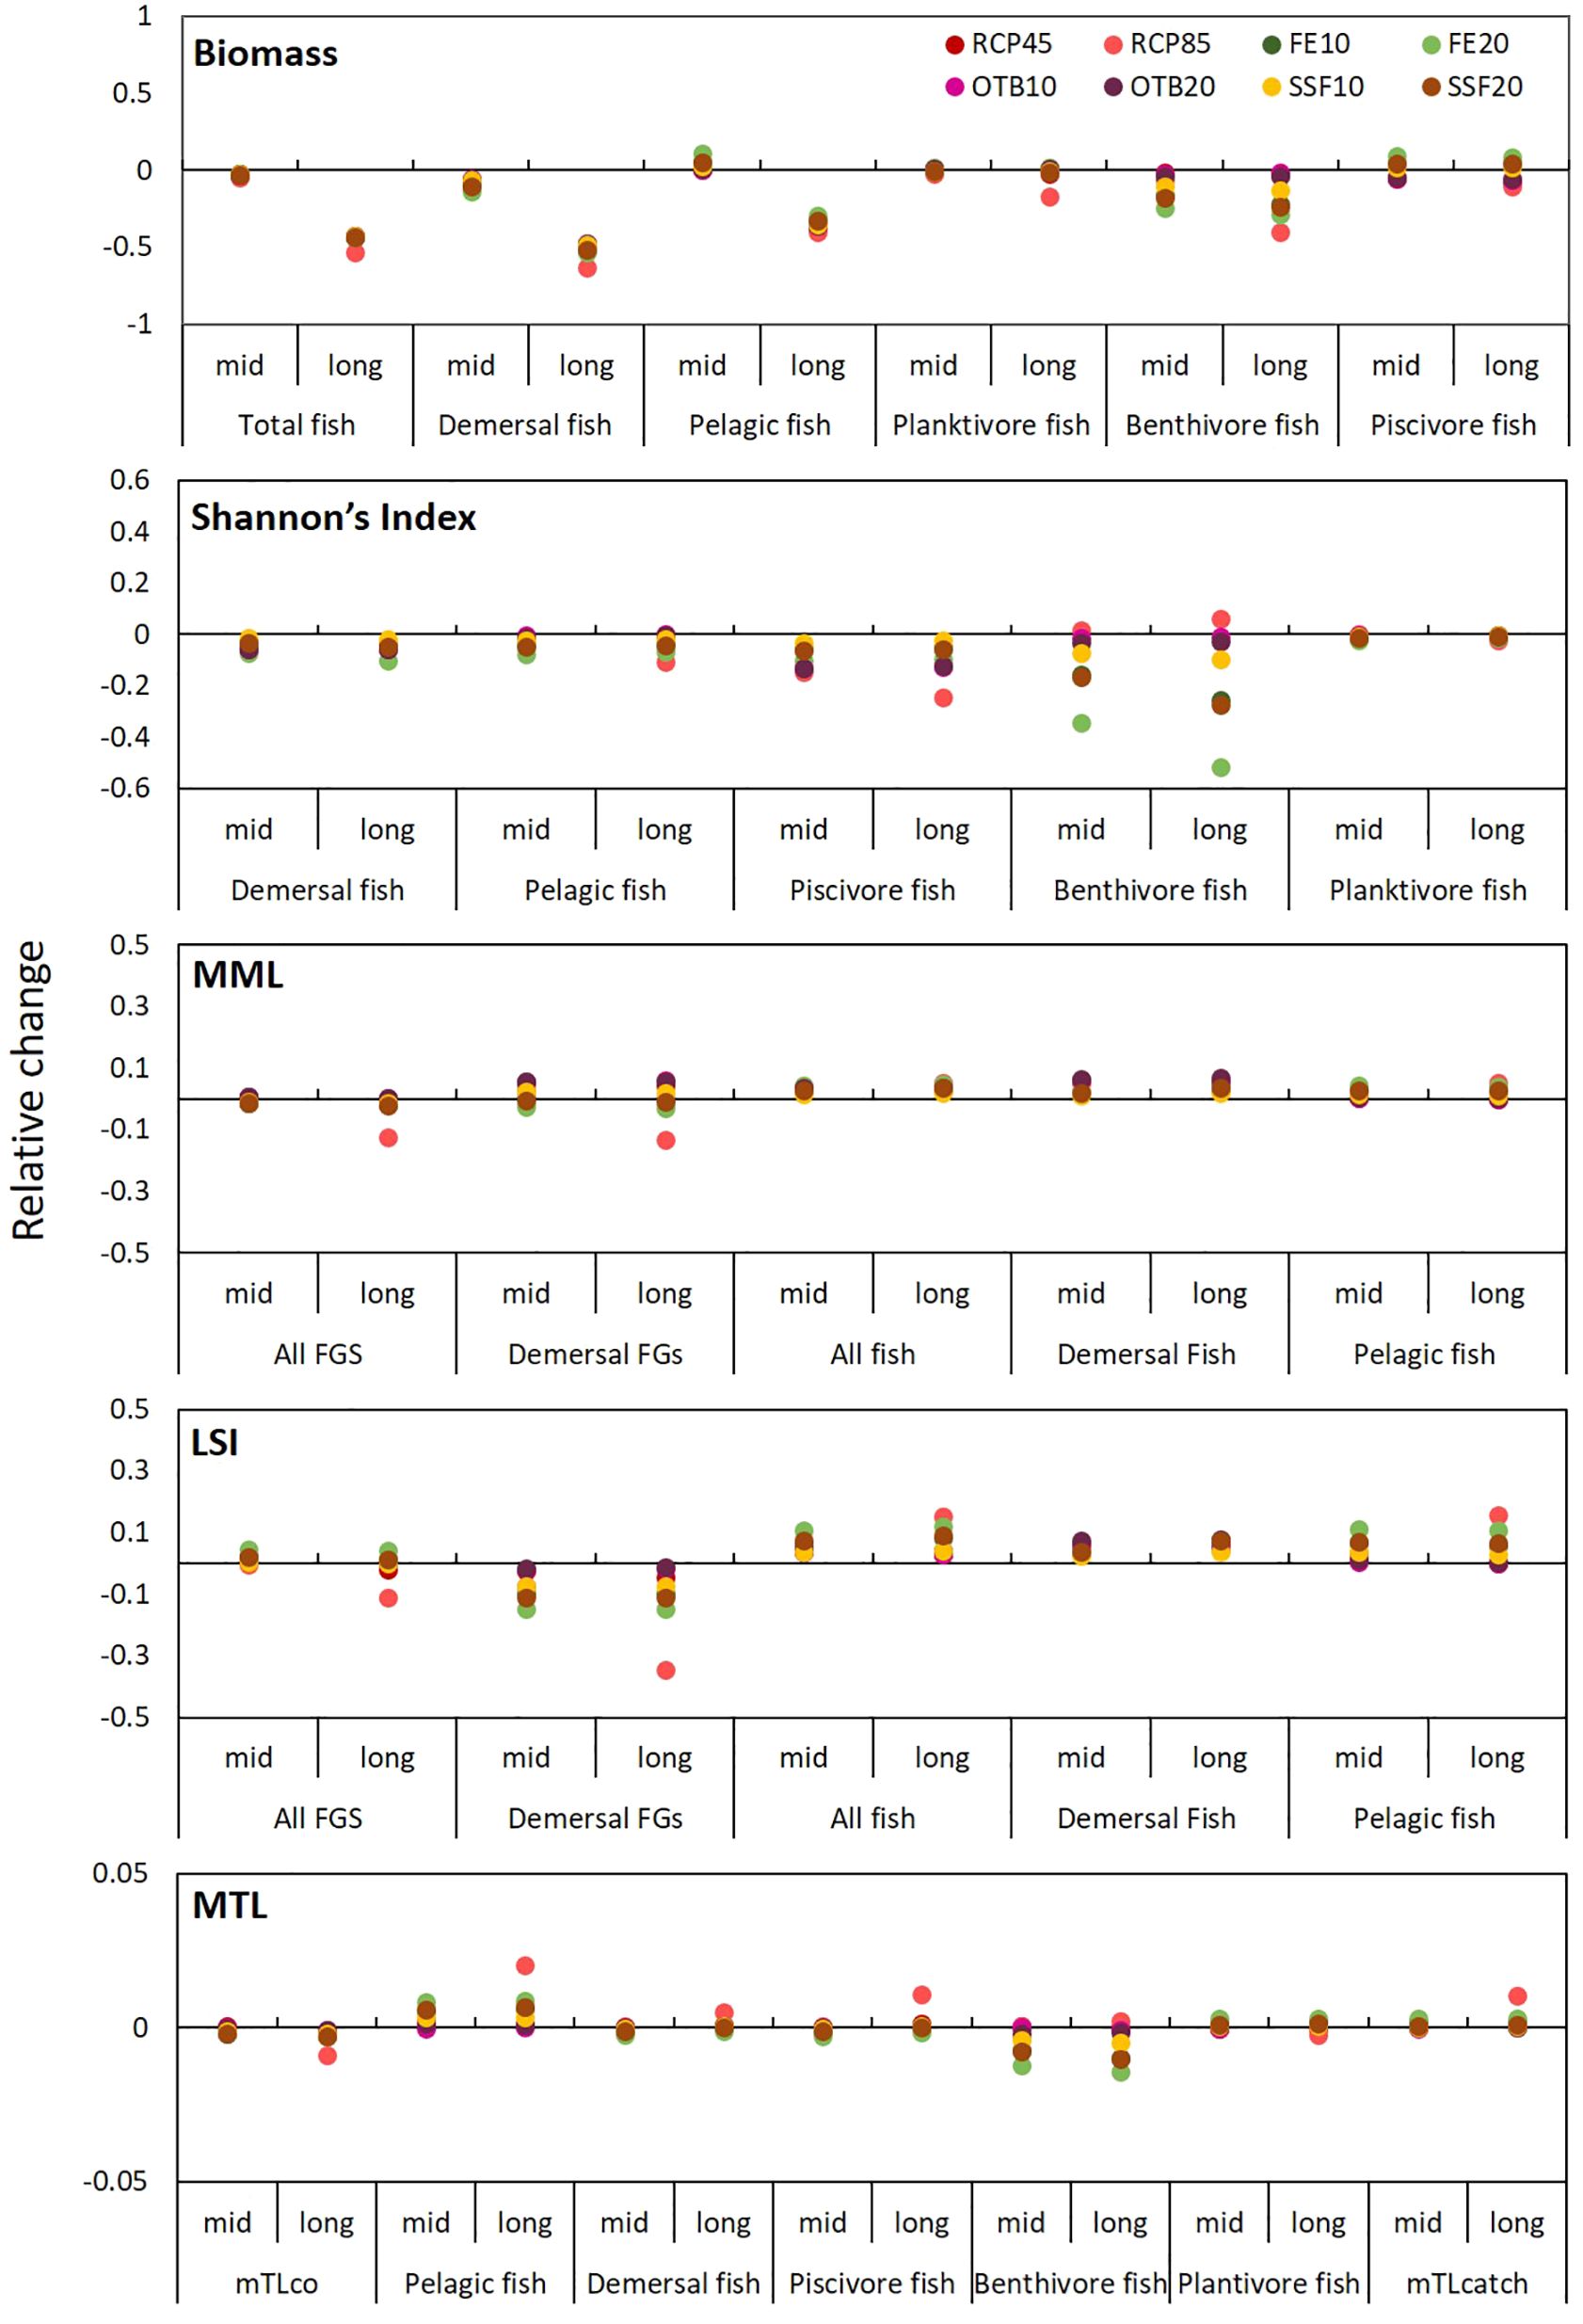
Figure 11. Graphical representation of relative change (%) of indicators in 2046–50 and 2076–2080 under the 8 single-stressor scenarios in comparison to the baseline scenario.
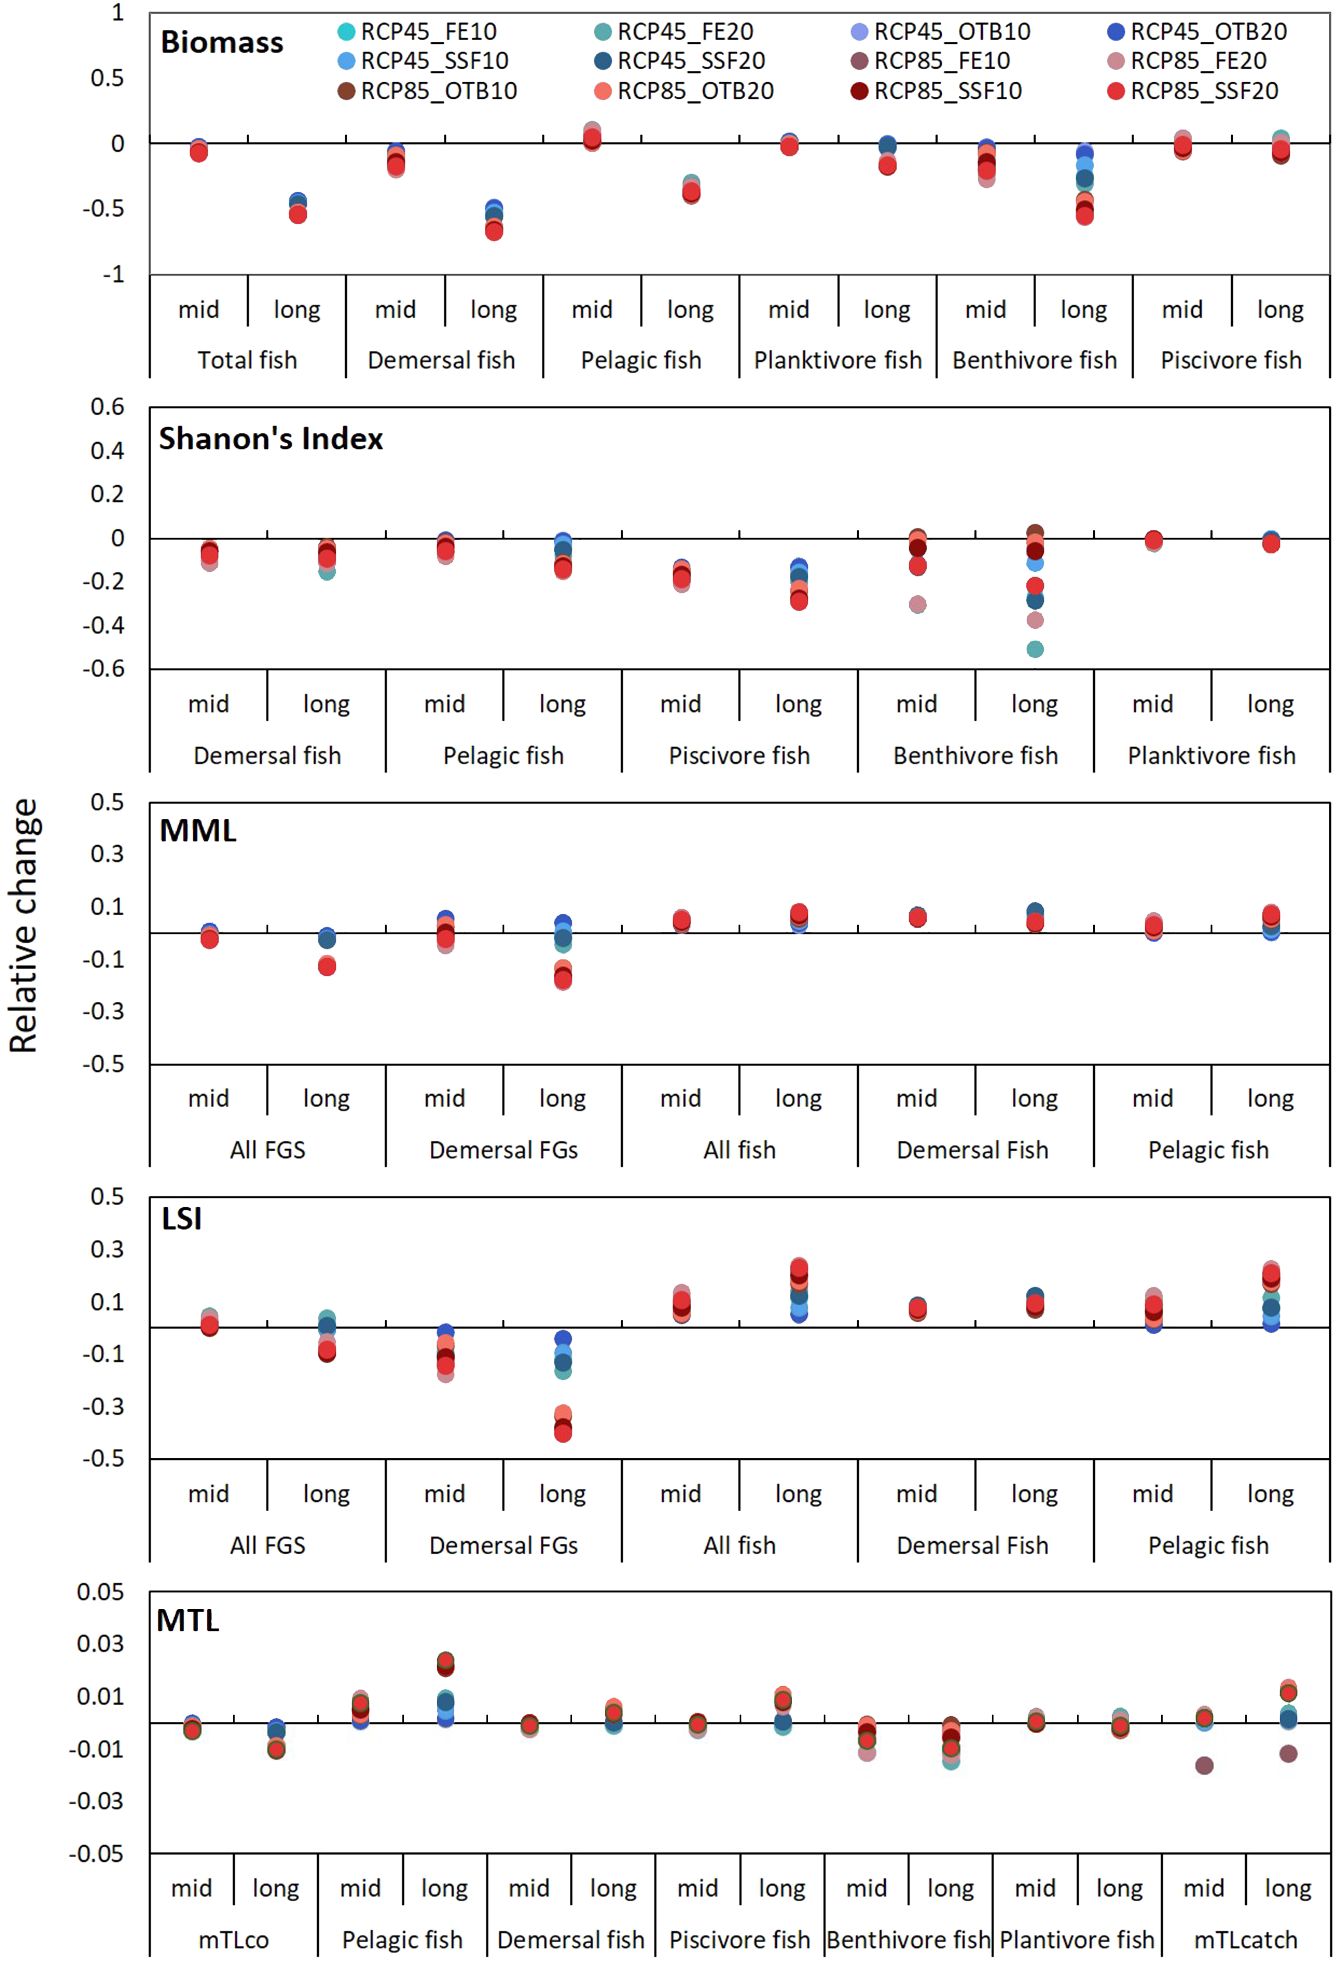
Figure 12. Graphical representation of relative change (%) of indicators in 2046–50 and 2076–2080 under the 12 multi-stressor scenarios in comparison to the baseline scenario.
Shannon’s Index responses to the various scenarios was similar between the pelagic and the demersal domain but it was especially informative when estimated on a guild level. Piscivore diversity declined across all scenarios, with the most pronounced reduction occurring in response to climate warming (24% long-term decline under RCP8.5) and OTB effort reductions (Figure 12). Benthivore diversity, on the other hand, was favored by temperature increase and hampered by effort reductions for all gears and SSF. Cumulative impact of stressors caused a further decrease in fish diversity when compared with single stressors. Among combined scenarios, those under RCP4.5 temperature increase had a subtler effect on Shannon’s values that the respective under RCP8.5, which were more severe in the long-term. Concerning piscivore diversity all combined scenarios had negative consequences for Shannon’s Index, indicating intraguild dominance, while benthivore diversity increased under bottom trawl reduction scenarios, irrespective of the climate scenario. This overall pattern highlights that piscivore diversity was mostly driven by temperature, while benthivore diversity by fishing effort. Finally, the impact of scenarios on planktivore diversity was minimal ranging from 0.4% to 2.3% for single stressors and 0.1% to 1.9% for combined scenarios.
Regarding size-related indicator values for the entire community, both MML and LSI increased in the mid-term under the RCP4.5 scenario, however, it was followed by a decrease in the long-term for both climate scenarios but especially under the RCP8.5 scenario (Figure 11). MML values for the entire community marginally benefited from restrictions on OTB fishing efforts, while LSI improved under all fishing restriction scenarios. Notably, in most scenarios for the demersal community, an increase in MML was accompanied by a decrease in LSI, suggesting that while larger species may become less abundant, the remaining community will grow in size. For the fish community, notable increases were observed compared to the baseline scenario, ranging from 1% to 5% for MML and 2% to 15% for LSI. Similar to biomass and diversity, the combined effect of stressors on size-related indicators amplified the impact observed for individual stressors with MML and LSI of the fish community increasing under the two sets of cumulative stressors in both pelagic and demersal habitats in relation to single-stressor scenarios. Conversely, regarding the entire community, the effects of combined stressors under the RCP4.5 scenario had subtle impact on size related indicators not exceeding 2%, however, under the RCP8.5 scenarios, MML and LSI decreased by 18% and 40%, respectively, under the RCP8.5-FE20 scenario.
The MTL of the community was mostly affected by climate warming according to RCP8.5 in the long-term (decreasing by 0.88%) and the respective combined scenarios (Figure 12). In the pelagic habitat the MTL of fish increased substantially, while more subtle increases were recorded for the demersal fish community. Regarding trophic guilds, MTL of piscivore fishes increased mostly in the long-term, planktivore MTL did not fluctuate significantly, whereas that of benthivore fishes decreased under all single and multi-stressor scenarios throughout the simulation period with impacts being augmented in the long-term. Finally, MTL of the catch increased under all scenarios (Figures 11, 12).
4 Discussion
The EwE model developed in this study captured a snapshot of the EIS food web from 1998 to 2000, providing a framework for establishing a robust baseline for the period 2000 to 2020. The model also served as a basis for future simulations, offering critical insights into the system’s potential responses to temperature fluctuations and reductions in fishing pressure of multi-gear fisheries. Using the model outputs, we further calculated indicators at the trophic guild level to identify potential links between climate change, fishing pressure, and shifts in community structure, supporting the integration of ecological indicators into fisheries management. Finally, we examined the interplay between stressors over extended time scales and across gradients of stressor intensity. This approach aimed to uncover the processes governing the interactions of stressors and to generate informative predictions for climate-resilient management. Although other models have been developed for the EIS (Moutopoulos et al., 2018; Piroddi et al., 2010), our modelling approach is considerably more detailed, incorporating 57 functional groups, including five non-indigenous and four multi-stanza groups, and allows a more comprehensive assessment of stressor interactions and emergent ecosystem properties at the GSA level, a scale where stocks are assessed and management decisions can be implemented. This ecosystem-specific approach is essential for accurately evaluating environmental thresholds and informing ecosystem-based fisheries management (EBFM) strategies in the rapidly evolving Mediterranean marine ecosystems.
4.1 EIS Ecopath model
This study introduces a mass-balance Ecopath model for Eastern Ionian Sea, an area of significant ecological importance for species of conservation concern and marine megafauna, supporting significant seabird colonies, nesting sites and a large population of loggerhead sea turtle, as well as foraging areas for monk seals and dolphins (Bearzi et al., 2005; Karris et al., 2017). The Ecopath model’s relatively high pedigree score (0.595) indicates that the data available for the study area were sufficient for the models’ parameterization, while also adhering to ecological principles and conforming to the laws of thermodynamics, as verified by the PREBAL analysis. Output values for production/consumption ratios (P/Q), respiration/assimilation ratios (R/A) and net food conversion efficiencies for all FGs were within the expected range (Christensen and Walters, 2004; Heymans et al., 2016). Flow and information indices suggest that the EIS ecosystem is a relatively mature oligotrophic ecosystem with moderate complexity and high trophic efficiency (TE) values (Supplementary Material, Supplementary Table S6). The high ecotrophic efficiency (EE) values calculated for most functional groups Table is either consumed within the system via predation or exported via fishing, a typical feature of oligotrophic systems (Tsagarakis et al., 2010). Furthermore, the EIS model exhibited structural and functional characteristics similar to those of previous models developed for the Ionian Sea (IOS, Moutopoulos et al., 2018; NIS, Pirrodi et al., 2010), such as the importance of detritus as an energy source for the system and strong benthic-pelagic coupling. The larger ecosystem size and higher flows (TST) reported in our model compared to Moutopoulos et al. (2018) are likely due to the inclusion of the highly productive Amvrakikos Gulf, which supports high small pelagic fish biomass, particularly anchovies, because of local fishing restrictions. Finally, similarities with the neighboring Gulf of Corinth (GoC, Raptis et al., 2025) include the identification of chondrichthyans as keystone species.
Our findings indicate that the food web in EIS is shaped by intricate trophic interactions, driven by both bottom-up and top-down dynamics. The structural importance of low-trophic-level functional groups, as indicated by keystone indices, suggests that the ecosystem is susceptible to bottom-up influences which may exert a significant impact on the dynamics of higher trophic levels propagating cascading effects throughout the food web such as pollution-related and climate-driven alterations in plankton (Möllmann et al., 2008) and demersal communities (Rivetti et al., 2014). On the other hand, sharks, rays, and skates were identified as keystone species, exerting a significant influence on the structure and functioning of the EIS food web. Although chondrichthyans are not directly targeted by fisheries, they are frequently caught as bycatch (Serena et al., 2020; Serena et al., 2021). The low values of exploitation indices (e.g., % PPR, Psust) and the high mTLc (3.38) imply that resources in EIS are sustainably exploited, however, sharks and rays face considerable threats in the Mediterranean Sea with over 50% of species being classified as at risk of extinction by the International Union for Conservation of Nature (IUCN) (Serena et al., 2020).
4.2 Hindcast period
The time dynamic Ecosim module was developed for the EIS to describe food web changes after fitting to observed time series from 2000 to 2020, a time frame when operating fishing fleets decreased and SST did not exhibit a specific trend but rather fluctuated irregularly between 20–21°C. The significant collection of environmental data compiled for the present study provided new insights into the abundance trends of several food-web components, hence allowing the EIS EwE model to capture ecosystem dynamics. The Ecosim model provided the most accurate representation of food-web dynamics when incorporating trophic interactions, a primary production anomaly, annual sea surface temperature (SST), and fishing activity. Trophic interactions had the greatest influence on improving the model fit when temperature was incorporated in the model. Integrating sea surface temperature (SST) time series for the hindcast period, alongside the thermal responses of functional groups (FGs), enhanced the model’s accuracy, highlighting temperature as crucial in shaping communities and fishing production in the EIS (e.g. Corrales et al., 2017; Damalas et al., 2021), while also enabling the exploration of future climate scenarios. Congruent with other studies in the Mediterranean Sea using EwE (e.g. Corrales et al., 2017; Dimarchopoulou et al., 2022; Tsagarakis et al., 2022; Keramidas et al., 2024) and other end-to-end modelling approaches (e.g. OSMOSE, ATLANTIS, Allometric Trophic Networks) (Moullec et al., 2019; Ihde and Townsend, 2017; ´Avila-Thieme et al., 2021), our results underscore the combined effects of environmental disturbances and human-induced stressors on the modeled ecosystem dynamics.
While certain time series trends were not accurately replicated (e.g. catches of adult and juvenile anchovy and sardines) the model effectively reproduces the majority of observed trends. The inaccuracies observed in landing simulations may stem from several factors, including errors in the initial input fisheries data, overlooked environmental variables or processes not accounted for by the model, or the model’s inability to capture a significant trophic interaction due to inadequate dietary data. Such miss-reporting and under-reporting is often mentioned for the Mediterranean Sea (Piroddi et al., 2017). The reliability of the model outputs and its ability to simulate observed patterns are largely dependent on the initial input data and the extent of our understanding of the ecosystem. The simulations during the hindcast period for the multi-stanza groups were satisfactory for red mullet (juveniles and adults) and less successful for the rest. Regarding the rest of the FGs, the simulations may be driven mainly by biomass data in accordance to other models (Papantoniou et al., 2023; Tsagarakis et al., 2022). However, there are challenges when calibrating EwE and incorporating technological creep may have improved the fit of the simulations by capturing temporal increases in fishing efficiency (Papantoniou et al., 2023; Piroddi et al., 2017; Tsagarakis et al., 2022). Finally, the degree of uncertainty as defined by confidence levels in our retrospective analysis emphasizes the wide spectrum of potential system responses under varying assumptions. Our modelling approach for the EIS is considerably more complex (57 FGs) and incorporates a broader ensemble of parameterizations and structural uncertainties - such as five invasive species and four multi-stanza groups - than most models developed for the Ionian and the Aegean Seas to date, which include fewer FGs (43 FGs: Moutopoulos et al., 2018; 44 FGs: Keramidas et al., 2024; 40 FGs: Papantoniou et al., 2023; Tsagarakis et al., 2022; 32 FGs: Dimarchopoulou et al., 2019), resulting in wider confidence intervals. This reinforces the importance of adopting a precautionary approach when interpreting specific outputs, while still enabling the extraction of meaningful insights regarding relative impacts of fishing or environmental scenarios, and the directional nature of ecosystem responses.
4.3 Impacts of climate warming on the EIS ecosystem
The majority of EwE studies conducted in the Mediterranean Sea, examine the impact of climate change on food webs up to 2050 (Agnetta et al., 2022; Corrales et al., 2018; Keramidas et al., 2024; Papantoniou et al., 2023; Tsagarakis et al., 2022) potentially obscuring the broader context and limiting our ability to characterize mechanisms operating over larger temporal scales. Although acknowledging the increased uncertainty following long-term projections, our study extends simulations to 2080, as projected sea surface temperature trajectories exhibit substantial divergence beyond 2050. Our findings carry significant implications for understanding how various degrees of global warming will affect Mediterranean marine ecosystems in temporal scales of relevance to natural systems.
Projected temperature increases according to the two IPCC scenarios produced substantial and variable changes across the communities in the EIS, including positive, negative and complex non-linear and non-homogeneous responses. Demersal functional groups such as red mullets, anglers, deep water rose shrimp, reptantia, common octopus and other cephalopods with high optimum temperatures and wide tolerance windows (Supplementary Material, Section B, Supplementary Figure S4) were identified as climate change winners augmenting their biomass with increasing temperatures under the RCP8.5 scenario. Increasing biomass with sea temperatures have also been reported in the W. Mediterranean for shrimps (Moullec et al., 2019), in the Aegean Sea for anglerfish (Tsagarakis et al., 2022) and red mullets (Keramidas et al., 2024), while cephalopods have been acknowledged as potential winners of climate warming in the marine environment at both regional and global scales (Doubleday et al., 2016; Veloy et al., 2022). On the other hand, adverse effects of climate warming on pelagic and demersal biomass were intensified under the most extreme climate scenario (RCP8.5) for the majority of the impacted FGs at the end of the century, when temperature patterns display significant deviation. This pattern suggests that the rate of temperature rise dictated these shifts, as warmer scenarios appeared to accelerate and intensify ecosystem changes proportionally. Comparable tendencies were observed in other ecosystems in the Mediterranean ecoregion (Corrales et al., 2018; Tsagarakis et al., 2022) and the Norwegian and Barents Seas, where the magnitude of biomass shifts was influenced by the rate of temperature increase (Bentley et al., 2017) and in the West coast of Scotland model with projections up to 2100 (Serpetti et al., 2017). Another interesting finding was that the responses of some functional groups were not monotonic (e.g., rays & skates, piscivorous fishes slope, mesopelagics and musky horned octopus) with increasing biomass values in mid-term and decreasing in the long-term under the same scenario. Such responses have been reported in studies from the Aegean Sea (Keramidas et al., 2024; Tsagarakis et al., 2022) and imply that apart from relative thermal sensitivities, complex and varied responses due to food web interactions may emerge in multispecies ecosystems. These results highlight the importance of using multi-species models to detect complexity of marine food-webs and their diverse behavior in the face of environmental change.
Furthermore, increasing sea temperature in the EIS led to reductions in smaller size fraction pelagic biomass and in biomass of sardines, anchovy and horse mackerels, aligning with findings from previous studies in Greek (Papantoniou et al., 2023; Tsagarakis et al., 2022) and global waters (Ariza et al., 2022). These forage fish serve as a trophic nexus in marine food-webs, connecting bottom-up and top-down processes in ways that can indirectly impact the plankton, and environmental effects can ripple upwards to impact predators (Lynam et al., 2017). These declines of small pelagic biomass may as well be linked to bottom-up processes (Gkanasos et al., 2021) and constraints in ecophysiological functions that hinder survival across the entire Mediterranean Sea (Pennino et al., 2020; Schickele et al., 2021). However, EwE outcomes from the Aegean Sea (Keramidas et al., 2024) and end-to-end modelling with OSMOSE from the W. Mediterranean (Moullec et al., 2019) have also predicted contrasting responses for small pelagic to rising temperatures. This variability in species responses to climate change can be attributed not only to differences in modelling approaches, datasets, and underlying assumptions, but also to fundamental ecological and physiological differences across ecosystems (Audzijonyte et al., 2020) and may reflect variations in population growth dynamics and survival strategies, influencing species adaptations to changing environmental conditions (Sakamoto et al., 2022).
4.4 Impacts of fishing effort reductions on marine resources of the EIS
Fishing effort was identified as a key driver of the EIS ecosystem, and under consistent environmental simulations, restrictions in total fishing effort yielded results comparable to those observed in other Mediterranean ecosystems (Papantoniou et al., 2023; Tsagarakis et al., 2022). As expected, reductions in total fishing effort (FE10, FE20) exerted a notable positive effect on the biomass of FGs targeted by commercial fisheries and characterized by high fishing mortality ratios (F/Z), such as common cuttlefish, hake, bogue & picarels, and caramote prawn, large pelagic fishes. However, reduced levels of fishing pressure did not lead to stock recovery on the heavily fished anchovy juveniles and sardine juveniles, and had a negative impact on the biomass of less fished FGs consisting of demersal fishes (e.g., piscivore fishes shelf and piscivore fishes slope). These declines can be attributed to direct and/or indirect trophic interactions within the food web, including predatory effects on prey and competitive dynamics. The projected decline in the biomass of sardine and anchovy is likely linked to increased predation mortality as they constitute a primary prey source for top predators (e.g., medium and large pelagic fishes) that benefited from the reduction in fishing effort. On the other hand, the severe impact on high trophic level demersal fishes (e.g. piscivorous fishes slope) could be attributed to increased competition for resources with other top predators whose biomass increased (e.g., hake, anglers). Overall, the observed subtle and pronounced declines in biomass seem to stem from the cascading effects of reduced fishing, highlighting the importance of using multispecies models to identify potential ecosystem and resource responses to varying levels of fishing pressure. Catches of all functional groups declined under both fishing effort reduction scenarios throughout the projection period, suggesting that biomass increases were not sufficient to counterbalance the catch loss from effort reduction. Decreases in catches followed a similar pattern with biomass, as maximum losses were observed for the FGs with the greatest biomass declines. Congruent with studies from the N Aegean Sea (Tsagarakis et al., 2022) and Thermaikos Gulf (Dimarchopoulou et al., 2022), the decreases in catches under the two simulations of total fishing effort were proportional to the level of fishing reduction for the majority of the fished FGs, however, in the EIS losses were relatively constant throughout the simulation period and did not decline with time, as reported in Saronikos Gulf (Papantoniou et al., 2023).
Commercial fisheries in the EIS and in the Mediterranean Sea in general, employ a diverse array of fishing gear due to the inherent spatial heterogeneity and the multispecies nature of Mediterranean communities. Thus, apart from reductions in total fishing effort, we also examined gear-specific effort reductions in an attempt to elucidate the complex mechanisms underlying multi-gear fleets and resource interactions. Focusing effort reductions on gear types that primarily target overexploited species could produce better outcomes and should be considered within a management strategy evaluation framework.
Bottom trawling is a widely practiced fishing method with low ecological efficiency, generating substantial catches, bycatch, and discards (Tsagarakis et al., 2014, 2017) and the European Common Fishery Policy (CEP) proposes permanent closures of bottom trawling from entire areas and/or temporal closures of fleets (Lutchman et al., 2009). Our results showed that when fishing effort reduction was implemented only on bottom trawling, as expected, substantial biomass increase was recorded mainly for its target species (e.g., caramote prawn, red mullet, bogue & picarels, hake). Surprisingly, it was less beneficial for the biomass of ecologically important species such as rays & skates and demersal sharks despite the fact that biomass declines of chondrichthyan species have been associated with increasing fishing effort of bottom trawling (Peristeraki et al., 2020). Although bottom trawling is often cited as a major concern for stocks, our study shows that the scenarios reducing exclusively bottom trawl fisheries produced only a small increase in hake biomass. Reduction of fishing effort of small-scale fisheries apart from an impressive recovery of large and medium pelagics also led to increases in biomass of benthopelagic and demersal species such as bogue & picarels, red mullet and hake, highlighting the broad spectrum of habitats that are influenced by the activities of this sector.
Our results suggest that, in the Eastern Ionian Sea (EIS), reductions in bottom trawling effort alone may not constitute an effective management measure for the recovery of the overexploited hake stock (FAO, 2022b; GFCM, 2022), as bottom trawls primarily target smaller-sized individuals, while catches of adult hake predominantly derive from small-scale fisheries (Scientific, Technical and Economic Committee for Fisheries et al., 2020). The most remarkable recovery in the EIS, according to our simulations, was achieved when effort reduction was applied in all gears. However, for almost all functional groups, the decline in effort corresponded to substantial decreases in catch levels and other ecological important functional groups declined, therefore, a uniform reduction in effort may not be the most effective approach. Our findings highlight the complex interplay of factors impacting Mediterranean marine resources under multi-gear fishing, and underscore the necessity of examining the implementation of area closures alongside gear-specific, and ideally metier-specific effort reductions that can only be implemented if based on suitable monitoring and analysis, to achieve desired conservation outcomes.
4.5 Cumulative impact and interactions of climate change and fishing pressure
Disentangling the effects of mixed fisheries and climate change across entire food-webs is exceedingly challenging and requires a description of ecosystems using tools that can quantify the cumulative and isolated effects of stressors on marine resources (Stock et al., 2023). The majority of the biomass of functional groups were impacted negatively by the combined scenarios of moderate carbon emission mitigation scenario (RCP 4.5) and small-scale effort reductions, however, when fishing reductions concerned all gears and bottom trawling it seemed to mitigate the impacts of climate change for the majority of FGs in the mid-term. However, towards the end of the century, climate change outpaced fisheries management in all scenarios, especially under extreme warming (RCP 8.5), causing major declines in species biomass, including commercially valuable ones, regardless of management efforts, consistent with long-term predictions for stock collapses from other systems (Holsman et al., 2020).
However, the effects of multiple stressors are inherently complex, exhibiting non-linear ecosystem responses (Hunsicker et al., 2016), intricate interactions between stressors (Jackson et al., 2021), and dynamic feedback mechanisms (O’Connor et al., 2021). Predicting how environmental and anthropogenic stressors such as warming and fishing pressure affect natural ecosystems is a major challenge for contemporary ecology (Côté et al., 2016). Notably, our results showed that temperature and fishing pressure reductions did not exhibited a monotonic interaction across scenarios, nor those interactions were consistent in time. Although antagonistic interactions prevailed under the combined RCP4.5 simulations (54-80%) across all levels and types of fishing effort reductions throughout the projection period, in the respective RCP8.5 simulations, we recorded a distinct shift from antagonistic interactions in the mid-term to synergistic in the long-term (73-85%). The clear pattern identified here suggests that stressor interactions respond to the increasing magnitude of stressors, in our case temperature and fishing effort, suggesting an alarming reality for climate-driven changes of fisheries under the warmest scenario with synergistic stressor interactions dominating after 2050, in accordance to long-term predictions for stock collapses from other systems (Holsman et al., 2020). Synergistic interactions are of particularly concern, as they generate effects that surpass the sum of their individual impacts (Hewitt et al., 2016), posing a severe risk of ecological degradation (Brook et al., 2008; Folke et al., 2004). Assuming high-baseline carbon emissions scenario (RCP8.5) and a 30% bottom trawl (OTB) fishing pressure reduction (30%), Agnetta et al. (2022) reported a greater prevalence of synergistic effects (30%) by 2050 in the Strait of Sicily than in the EIS when compared to our RCP8.5-OTB20 scenario (19%). The difference in the magnitude of fishing effort reduction could be a possible explanation for this disparity reaffirming the influence of stressor intensity on the strength and direction of stressor interplay. Our findings are in line with substantial evidence that supports that multiple stressors often interact in a non-additive manner (Crain et al., 2008; Kroeker et al., 2013) while they are regulated by initial conditions and the magnitude and relative riming of stressors (Turschwell et al., 2022).
Historically, ecosystem models have accounted for multiple stressors by either summing their individual influences on a species or ecosystem, multiplying them without distinguishing specific interaction effects, or applying weighting factors that may, at times, be arbitrary (Brown et al., 2013; Christensen et al., 2014; Furlan et al., 2019). Here, interactions between multiple stressors were classified using additive effects models, which integrate both the magnitude and direction of cumulative and interaction effects. Using these models, we highlighted the importance of accounting for the directional influence of individual stressors when identifying synergistic and antagonistic interactions (Agnetta et al., 2022; Piggott et al., 2015). Long-term simulations that include gradients of stressors, like those carried out in this study, are vital for understanding the processes that drive interactions among stressors. These simulations also offer valuable predictions that can guide effective management strategies. Recognizing these interactions is essential for prioritizing management efforts, as it helps identifying which stressors to target, as well as the optimal timing and location for interventions.
4.6 Indicator responses
Various indicators have been created (Kleisner et al., 2015; Shannon et al., 2014; Shin et al., 2010; Shin et al., 2012), and innovative modelling approaches have been suggested to explore the connections between pressure and state indicators (e.g., Fu et al., 2015). The OSPAR Convention has incorporated mean maximum length as a biodiversity indicator for demersal fish, trophic levels of surveyed species and of key trophic groups (such as planktivores, piscivores, and benthivores) as food web indicators (ICES, 2014) while Large Fish Indicator (LFI), represented here by the Large Species Indicator (LSI), serves as both a biodiversity (when it includes only demersal species) and food web indicator (when it includes both demersal and pelagic species).
Our results showed that the biomass of the fish community decreased in the long-term under all scenarios in both the pelagic and the demersal environments, with the losses being more profound in the demersal environment. Overall, fishing reduction strategies and multiple stressor scenarios lead to less abundant, less diverse, and lower trophic level benthivore communities in both the mid-term and the long-term. The rise of biomass and mTL of pelagic and piscivorous fishes, under most scenarios, implies that the benthivores may suffer from increased predation and competition. Piscivores, on the other hand, were more susceptible to climate warming, with rising temperatures having a negative impact on their biomass and particularly their diversity, in line with reports predicting declines in top-predator biomass with increasing temperatures by the end of the century (Moullec et al., 2019). The notable exception was the indicator responses of planktivores which were the least affected by all climate scenarios and fishing release strategies. Planktivorous fish species hold a pivotal role in food webs, with the ability to trigger complex cascading effects across multiple trophic levels, ultimately influencing the trophic functioning of ecosystems (Lynam et al., 2017; Tsagarakis et al., 2010). The increase in the prevalence of low trophic levels and small sized species in the ecosystem are aligned with findings from the western Mediterranean (Moullec et al., 2019) and the Gulf of Gabes (Hattab et al., 2016). Our results highlight the importance of considering interactions on a trophic guild level as asymmetries in responses to climate change as well as fishing strategies have the potential to alter important predator–prey interactions with unforeseen consequences.
Size-based indicators are considered to be amongst the most robust to track ecosystem effects of fishing when the fishing strategy changes. Reduced fishing effort led to increases of size-based indicators across habitats and trophic guilds for the fish community. Conversely, LSI of the entire community in the demersal environment was negatively impacted across all scenarios, indicating that demersal invertebrate communities were more vulnerable to climate change and fishing strategies than the fish community. Our results are in accordance with the outcomes from the Gulf of Gabes (Halouani et al., 2019) and the North Sea (Lynam and Mackinson, 2015; Shephard et al., 2011). The choice of appropriate indicators for fisheries management in the EIS consisted in identifying the ones which were the most sensitive to fishing pressure, climate warming and combined stressors. Overall, our results showed that all the indicators had quite similar performance regarding the trend of their responses and were informative regarding potential shifts of future communities.
4.7 Model assumptions and limitations
Like many multi-species modelling frameworks, Ecopath with Ecosim (EwE) is constrained by the quality and availability of input data. Accurate representation of food web structures is crucial for improving our understanding of trophodynamic processes in natural ecosystems. In this context, the model for the Eastern Ionian Sea benefitted significantly from the extensive availability of scientific survey data. However, certain data sources were not entirely representative of the specific time period. For instance, discard rates were based on data from 2003–2008, which do not accurately reflect the discarding practices during the 1998–2000 study period. An additional limitation pertains to biomass estimates obtained through survey methods characterized by low catchability (e.g., MEDITS trawl surveys). While these approaches are appropriate for relative measures such as biomass indices, they may not yield accurate absolute biomass values. Nevertheless, despite these uncertainties—arising from site- and gear-specific catchability factors—we have provided a clear and transparent account of the methodology, facilitating a critical evaluation of the model’s structure and ecological interpretations.
The model successfully replicated most of the time series, with predictions of historical biomass and catches aligning well with observed data from the EIS between 2000 and 2020. However, certain functional groups (FGs) were not accurately represented. This challenge in simulating catches is a limitation in several Ecosim models in the Mediterranean Sea, even for key commercial species (Corrales et al., 2017; Dimarchopoulou et al., 2022; Tsagarakis et al., 2022). The observed inconsistencies may arise from constraints in the initial fisheries input data, the exclusion of key environmental drivers or processes, or limited dietary information that restricts the model’s ability to fully capture trophic dynamics. The relatively wide confidence intervals in the historical period reflected the structural complexity of the EIS model and the range of possible system responses under different assumptions. Although uncertainty from the historical simulations is typically propagated into future projections, a key limitation is the absence of an explicit uncertainty analysis for the forward simulations, and therefore, these results warrant cautious interpretation. The hindcast and future simulations presented here are intended to explore general ecosystem responses to variations in temperature and fishing intensity, rather than to offer exact projections for individual functional groups.
In the Mediterranean, the presence and intensity of stressors vary significantly across both time and space, influencing their independent and combined effects on responses ranging from individual behavior to entire ecosystem processes (Aragão et al., 2022; Ramírez et al., 2018). Another limitation of our study is that using SST as a proxy may not fully capture the thermal conditions experienced by benthic and demersal species, particularly in stratified waters. However, we used SST because AquaMaps defines species’ temperature tolerance ranges based on surface temperatures, which also formed the basis of our functional group response functions.
Moreover, primary production shifts were not assessed here as we chose to focus specifically on warming effects and fishing strategies which allowed us to isolate the impacts of temperature on species’ biomass and production, and to evaluate the interaction between warming and fishing under a set of scenarios tailored to the study area.
Building on this work, further assessing the spatial variability of stressors, key environmental parameters (e.g., primary production, oxygen, and pH), as well as the influence of quasi-decadal North Ionian Gyre reversals (Meli, 2024) - which were not assessed here but affect circulation and sea-level dynamics - represents the next step towards elucidating pivotal ecological mechanisms that govern ecosystem service provision, thereby supporting sustainable natural capital utilization under operational ecosystem-based management approaches.
Data availability statement
The original contributions presented in the study are included in the article/Supplementary Material. Further inquiries can be directed to the corresponding author.
Author contributions
GP: Conceptualization, Data curation, Formal analysis, Investigation, Methodology, Software, Supervision, Validation, Visualization, Writing – original draft, Writing – review & editing. VS: Writing – review & editing. VV: Funding acquisition, Project administration, Writing – review & editing. KT: Conceptualization, Project administration, Supervision, Writing – review & editing.
Funding
The author(s) declare financial support was received for the research and/or publication of this article. This study has been funded by the SEAwise project, funded by the European Union’s Horizon 2020 research and innovation programme under grant agreement No 101000318.
Acknowledgments
Part of the data used in this work, were collected under Greece’s Data Collection Framework (National Program for the Collection of Fisheries Data), funded by Greece (Ministry of Rural Development and Food, Directorate General of Fisheries) and the European Union.
Conflict of interest
The authors declare that the research was conducted in the absence of any commercial or financial relationships that could be construed as a potential conflict of interest.
Generative AI statement
The author(s) declare that no Generative AI was used in the creation of this manuscript.
Any alternative text (alt text) provided alongside figures in this article has been generated by Frontiers with the support of artificial intelligence and reasonable efforts have been made to ensure accuracy, including review by the authors wherever possible. If you identify any issues, please contact us.
Publisher’s note
All claims expressed in this article are solely those of the authors and do not necessarily represent those of their affiliated organizations, or those of the publisher, the editors and the reviewers. Any product that may be evaluated in this article, or claim that may be made by its manufacturer, is not guaranteed or endorsed by the publisher.
Supplementary material
The Supplementary Material for this article can be found online at: https://www.frontiersin.org/articles/10.3389/fmars.2025.1621603/full#supplementary-material
References
Agnetta D., Badalamenti F., Colloca F., Cossarini G., Fiorentino F., Garofalo G., et al. (2022). Interactive effects of fishing effort reduction and climate change in a central Mediterranean fishing area: Insights from bio-economic indices derived from a dynamic food-web model. Front. Mar. Sci. 9. doi: 10.3389/fmars.2022.909164
Ahrens R. N., Walters C. J., and Christensen V. (2012). Foraging arena theory. Fish and Fisheries 13 (1), 41–59. doi: 10.1111/j.1467-2979.2011.00432.x
Allgeier J. E., Rosemond A. D., and Layman C. A. (2011). The frequency and magnitude of non-additive responses to multiple nutrient enrichment. J. Appl. Ecol. 48, 96–101. doi: 10.1111/j.1365-2664.2010.01894.x
Aragão G. M., López-López L., Punzón A., Guijarro E., Esteban A., García E., et al. (2022). The importance of regional differences in vulnerability to climate change for demersal fisheries. ICES J. Mar. Sci. 79, 506–518. doi: 10.1093/icesjms/fsab134
Ariza A., Lengaigne M., Menkes C., Lebourges-Dhaussy A., Receveur A., Gorgues T., et al. (2022). Global decline of pelagic fauna in a warmer ocean. Nat. Clim. Change 12, 928–934. doi: 10.1038/s41558-022-01479-2
Audzijonyte A., Richards S. A., Stuart-Smith R. D., Pecl G., Edgar G. J., Barrett N. S., et al. (2020). Fish body sizes change with temperature but not all species shrink with warming. Nat. Ecol. Evol. 4, 809–814. doi: 10.1038/s41559-020-1171-0
Baudron A. R., Brunel T., Blanchet M. A., Hidalgo M., Chust G., Brown E. J., et al. (2020). Changing fish distributions challenge the effective management of European fisheries. Ecography 43, 494–505. doi: 10.1111/ecog.04864
Bearzi G., Reeves R. R., Notarbartolo-Di-Sciara G., Politi E., Cañadas A., Frantzis A., et al. (2003). Ecology, status and conservation of short-beaked common dolphins Delphinus delphis in the Mediterranean Sea. Mammal Review 33, 224–252. doi: 10.1046/j.1365-2907.2003.00032.x
Bentley J. W., Serpetti N., and Heymans J. J. (2017). Investigating the potential impacts of ocean warming on the Norwegian and Barents Seas ecosystem using a time-dynamic food-web model. Ecological Modelling 360, 94–107. doi: 10.1016/j.ecolmodel.2017.07.002
Borja A., Elliott M., Andersen J. H., Cardoso A. C., Carstensen J., Ferreira J. G., et al. (2013). Good Environmental Status of marine ecosystems: What is it and how do we know when we have attained it? Marine Pollution Bulletin 76, 16–27. doi: 10.1016/j.marpolbul.2013.08.042
Ávila-Thieme M. I., Corcoran D., Pérez-Matus A., Wieters E. A., Navarrete S. A., Marquet P. A., et al. (2021). Alteration of coastal productivity and artisanal fisheries interact to affect a marine food web. Sci Rep 11, 1765. doi: 10.1038/s41598-021-81392-4
Borja A., Elliott M., Teixeira H., Stelzenmüller V., Katsanevakis S., Coll M., et al. (2024). Addressing the cumulative impacts of multiple human pressures in marine systems, for the sustainable use of the seas. Front. Ocean Sustain. 1. doi: 10.3389/focsu.2023.1308125
Brook B. W., Sodhi N. S., and Bradshaw C. J. A. (2008). Synergies among extinction drivers under global change. Trends Ecol. Evol. 23, 453–460. doi: 10.1016/j.tree.2008.03.011
Brown C. J., Saunders M. I., Possingham H. P., and Richardson A. J. (2013). Managing for interactions between local and global stressors of ecosystems. PloS One 8, e65765. doi: 10.1371/journal.pone.0065765
Christensen V., Coll M., Steenbeek J., Buszowski J., Chagaris D., and Walters C. J. (2014). Representing variable habitat quality in a spatial food web model. Ecosystems 17, 1397–1412. doi: 10.1007/s10021-014-9803-3
Christensen V. and Walters C. J. (2004). Ecopath with Ecosim: methods, capabilities and limitations. Ecol. Modelling Placing Fisheries their Ecosystem Context 172, 109–139. doi: 10.1016/j.ecolmodel.2003.09.003
Coll M., Piroddi C., Steenbeek J., Kaschner K., Lasram F. B. R., Aguzzi J., et al. (2010). The biodiversity of the Mediterranean Sea: estimates, patterns, and threats. PLoS One 5, e11842. doi: 10.1371/journal.pone.0011842
Colloca F., Scarcella G., and Libralato S. (2017). Recent trends and impacts of fisheries exploitation on Mediterranean stocks and ecosystems. Front. Mar. Sci. 4. doi: 10.3389/fmars.2017.00244
Corrales X., Coll M., Ofir E., Heymans J. J., Steenbeek J., Goren M., et al. (2018). Future scenarios of marine resources and ecosystem conditions in the Eastern Mediterranean under the impacts of fishing, alien species and sea warming. Sci. Rep. 8, 14284. doi: 10.1038/s41598-018-32666-x
Corrales X., Coll M., Tecchio S., Bellido J. M., Fernández Á.M., and Palomera I. (2015). Ecosystem structure and fishing impacts in the northwestern Mediterranean Sea using a food web model within a comparative approach. J. Mar. Syst. 148, 183–199. doi: 10.1016/j.jmarsys.2015.03.006
Corrales X., Coll M., Ofir E., Piroddi C., Goren M., Edelist D., et al. (2017). Hindcasting the dynamics of an Eastern Mediterranean marine ecosystem under the impacts of multiple stressors. Mar. Ecol. Prog. Ser. 580, 17–36. doi: 10.3354/meps12271
Côté I. M., Darling E. S., and Brown C. J. (2016). Interactions among ecosystem stressors and their importance in conservation. Proc. R. Soc. B: Biol. Sci. 283, 20152592. doi: 10.1098/rspb.2015.2592
Crain C. M., Kroeker K., and Halpern B. S. (2008). Interactive and cumulative effects of multiple human stressors in marine systems. Ecol. Lett. 11, 1304–1315. doi: 10.1111/j.1461-0248.2008.01253.x
Cramer W., Guiot J., Fader M., Garrabou J., Gattuso J.-P., Iglesias A., et al. (2018). Climate change and interconnected risks to sustainable development in the Mediterranean. Nat. Clim Change 8, 972–980. doi: 10.1038/s41558-018-0299-2
Damalas D., Sgardeli V., Vasilakopoulos P., Tserpes G., and Maravelias C. (2021). Evidence of climate-driven regime shifts in the Aegean Sea’s demersal resources: A study spanning six decades. Ecology and Evolution 11, 16951–16971. doi: 10.1002/ece3.8330
Damalas D., Maravelias C. D., and Kavadas S. (2014). Advances in Fishing Power: A Study Spanning 50 Years. Reviews in Fisheries Science & Aquaculture. 22, 112–121. doi: 10.1080/10641262.2013.839620
Damalas D., Sgardeli V., Vasilakopoulos P., Tserpes G., and Maravelias C. (2021). Evidence of climate-driven regime shifts in the Aegean Sea’s demersal resources: A study spanning six decades. Ecology and Evolution 11, 16951–16971. doi: 10.1002/ece3.8330
Davidson L. N. K., Jaiteh V. F., Chin A., and Jabado R. W. (2022). “Conservation science for sharks and rays,” in Biology of Sharks and Their Relatives (CRC Press). doi: 10.1201/9781003262190
Dimarchopoulou D., Keramidas I., Tsagarakis K., and Tsikliras A. C. (2019). Ecosystem Models and Effort Simulations of an Untrawled Gulf in the Central Aegean Sea. Front. Mar. Sci. 6, 648. doi: 10.3389/fmars.2019.00648
du Pontavice H., Gascuel D., Reygondeau G., Maureaud A., and Cheung W. W. L. (2020). Climate change undermines the global functioning of marine food webs. Global Change Biology 26, 1306–1318. doi: 10.1111/gcb.14944
ELSTAT. (2021). Sea Fishery Survey by motor-propelled vessels. Available at: http://www.statistics.gr.
Dimarchopoulou D., Tsagarakis K., Sylaios G., and Tsikliras A. C. (2022). Ecosystem trophic structure and fishing effort simulations of a major fishing ground in the northeastern Mediterranean Sea (Thermaikos Gulf). Estuarine Coast. Shelf Sci. 264, 107667. doi: 10.1016/j.ecss.2021.107667
Doubleday Z. A., Prowse T. A. A., Arkhipkin A., Pierce G. J., Semmens J., Steer M., et al. (2016). Global proliferation of cephalopods. Curr. Biol. 26, R406–R407. doi: 10.1016/j.cub.2016.04.002
Farahmand S., Hilmi N., Cinar M., Safa A., Lam V. W. Y., Djoundourian S., et al. (2023). Climate change impacts on Mediterranean fisheries: A sensitivity and vulnerability analysis for main commercial species. Ecol. Econ 211, 107889. doi: 10.1016/j.ecolecon.2023.107889
FAO. (2022a). Report of the Working Group on Stock Assessment of Demersal species (WGSAD), Online, 17–21 January 2022 (western Mediterranean) Online, 24–28 January 2022 (central and eastern Mediterranean and Adriatic Sea). General Fisheries Commission for the Mediterranean. (Available at : https://www.fao.org/gfcm/technical-meetings/detail/en/c/1635049/
FAO. (2022b). Report of the Working Group on Stock Assessment of Demersal species (WGSAD), Online, 17–21 January 2022 (western Mediterranean) Online, 24–28 January 2022 (central and eastern Mediterranean and Adriatic Sea). General Fisheries Commission for the Mediterranean. (Available at : https://www.fao.org/gfcm/technical-meetings/detail/en/c/1635049/)
Fischer J., Erikstein K., D'Offay B., Guggisberg S., and Barone M. (2012). Review of the implementation of the international plan of action for the conservation and management of sharks. FAO Fisheries and Aquaculture Circular (C1076). FAO. Available online at: https://www.proquest.com/openview/6807ccc650ce679d184e11aac6c63c98/1?pq-origsite=gscholar&cbl=237324
Fiorentino F. and Vitale S. (2021). How can we reduce the overexploitation of the Mediterranean resources? Front. Mar. Sci. 8. doi: 10.3389/fmars.2021.674633
Folke C., Carpenter S., Walker B., Scheffer M., Elmqvist T., Gunderson L., et al. (2004). Regime shifts, resilience, and biodiversity in ecosystem management. Annu. Rev. Ecology Evolution Systematics 35, 557–581. doi: 10.1146/annurev.ecolsys.35.021103.105711
Free C. M., Thorson J. T., Pinsky M. L., Oken K. L., Wiedenmann J., and Jensen O. P. (2019). Impacts of historical warming on marine fisheries production. Science 363, 979–983. doi: 10.1126/science.aau1758
Fu C., Large S., Knight B., Richardson A. J., Bundy A., Reygondeau G., et al. (2015). Relationships among fisheries exploitation, environmental conditions, and ecological indicators across a series of marine ecosystems. J. Mar. Syst. 148, 101–111. doi: 10.1016/j.jmarsys.2015.01.004
Furlan E., Torresan S., Critto A., Lovato T., Solidoro C., Lazzari P., et al. (2019). Cumulative Impact Index for the Adriatic Sea: Accounting for interactions among climate and anthropogenic pressures. Sci. Total Environ. 670, 379–397. doi: 10.1016/j.scitotenv.2019.03.021
Garrabou J., Gómez-Gras D., Medrano A., Cerrano C., Ponti M., Schlegel R., et al. (2022). Marine heatwaves drive recurrent mass mortalities in the Mediterranean Sea. Global Change Biol. 28, 5708–5725. doi: 10.1111/gcb.16301
General Fisheries Commission for the Mediterranean (GFCM). (2022). Working Group on Stock 1078 Assessment of Demersal Species (WGSAD); Scientific Advisory Committee on Fisheries (SAC). Rome, Italy, 125, 12–17. Available online at: https://www.fao.org/gfcm/technical-meetings/detail/en/c/1635049/
Gkanasos A., Schismenou E., Tsiaras K., Somarakis S., Giannoulaki M., Sofianos S., et al. (2021). A three dimensional, full life cycle, anchovy and sardine model for the North Aegean Sea (Eastern Mediterranean): Validation, sensitivity and climatic scenario simulations. Mediterr. Mar. Sci. 22, 653–668. doi: 10.12681/mms.27407
Greenstreet S. P. R., Rossberg A. G., Fox C. J., Le Quesne W. J. F., Blasdale T., Boulcott P., et al. (2012). Demersal fish biodiversity: species-level indicators and trends-based targets for the Marine Strategy Framework Directive. ICES J Mar Sci. 69, 1789–1801. doi: 10.1093/icesjms/fss148
Halouani G., Le Loc’h F., Shin Y.-J., Velez L., Hattab T., Romdhane M. S., et al. (2019). An end-to-end model to evaluate the sensitivity of ecosystem indicators to track fishing impacts. Ecol. Indic. 98, 121–130. doi: 10.1016/j.ecolind.2018.10.061
Hamdeno M. and Alvera-Azcaráte A. (2023). Marine heatwaves characteristics in the Mediterranean Sea: Case study the 2019 heatwave events. Front. Mar. Sci. 10. doi: 10.3389/fmars.2023.1093760
Hattab T., Leprieur F., Ben Rais Lasram F., Gravel D., Loc’h F. L., and Albouy C. (2016). Forecasting fine-scale changes in the food-web structure of coastal marine communities under climate change. Ecography 39, 1227–1237. doi: 10.1111/ecog.01937
Hewitt J. E., Ellis J. I., and Thrush S. F. (2016). Multiple stressors, nonlinear effects and the implications of climate change impacts on marine coastal ecosystems. Global Change Biol. 22, 2665–2675. doi: 10.1111/gcb.13176
Heymans J. J., Coll M., Link J. S., Mackinson S., Steenbeek J., Walters C., et al. (2016). Best practice in Ecopath with Ecosim food-web models for ecosystem-based management. Ecol. Model. 331, 173–184. doi: 10.1016/j.ecolmodel.2015.12.007
Holsman K. K., Haynie A. C., Hollowed A. B., Reum J. C. P., Aydin K., Hermann A. J., et al. (2020). Ecosystem-based fisheries management forestalls climate-driven collapse. Nat. Commun. 11, 4579. doi: 10.1038/s41467-020-18300-3
Hummel H., Frost M., Juanes J. A., Kochmann J., Bolde C. F. C. P., Aneiros F., et al. (2015). A comparison of the degree of implementation of marine biodiversity indicators by European countries in relation to the Marine Strategy Framework Directive (MSFD). Journal of the Marine Biological Ass.
ICES (2014). Mixed-fisheries advice for Subarea IV (North Sea) and Divisions IIIa North (Skagerrak) and VIId (Eastern Channel). ICES Advice: Recurrent Advice. ICES. doi: 10.17895/ices.advice.18669191.v1
ICES. (2015). Report of the Workshop on Guidance for the Review of MSFD Decision Descriptor 4 –Foodwebs II (WKGMSFDD4-II). ICES Document CM 2015\ACOM:49. Copenhagen: ICES.
Ihde T. F. and Townsend H. M. (2017). Accounting for multiple stressors influencing living marine resources in a complex estuarine ecosystem using an Atlantis model. Ecological Modelling 365, 1–9. doi: 10.1016/j.ecolmodel.2017.09.010
IPCC. (2023) Climate change 2023: synthesis report. A report of the intergovernmental panel on climate change. In: Core Writing Team, H Lee, J Romero (eds.), Contribution of Working Groups I, II and III to the Sixth Assessment Report of the Intergovernmental Panel on Climate Change. Geneva, Switzerland: IPCC.
Hunsicker M. E., Kappel C. V., Selkoe K. A., Halpern B. S., Scarborough C., Mease L., et al. (2016). Characterizing driver–response relationships in marine pelagic ecosystems for improved ocean management. Ecol. Appl. 26, 651–663. doi: 10.1890/14-2200
Jackson M. C., Pawar S., and Woodward G. (2021). The temporal dynamics of multiple stressor effects: from individuals to ecosystems. Trends Ecol. Evol. 36, 402–410. doi: 10.1016/j.tree.2021.01.005
Karris G., Xirouchakis S., Grivas C., Voulgaris M. D., Sfenthourakis S., Giokas S., et al. (2017). Estimating the population size of Scopoli's Shearwaters (Calonectris diomedea) frequenting the Strofades islands (Ionian Sea, western Greece) by raft counts and surveys of breeding pairs. North-Western Journal of Zoology, 13(1)
Kaschner K., Kesner-Reyes K., Garilao C., Segschneider J., Rius-Barile J., Rees T., et al. (2021). AquaMaps: Predicted Range Maps for Aquatic Species. Aquamaps.
Kennedy M. C. and O’Hagan A. (2001). Bayesian calibration of computer models. J. R. Stat. Society: Ser. B (Statistical Methodology) 63, 425–464. doi: 10.1111/1467-9868.00294
Keramidas I., Dimarchopoulou D., Kokkos N., Sylaios G., and Tsikliras A. C. (2024). Temporal ecotrophic impacts of fisheries and climate change in the Aegean Sea. Mar. Ecol. Prog. Ser. 749, 19–45. doi: 10.3354/meps14724
Kleisner K. M., Coll M., Lynam C. P., Bundy A., Shannon L., Shin Y. J., et al. (2015). Evaluating changes in marine communities that provide ecosystem services through comparative assessments of community indicators. Ecosystem Services 16, 413–429. doi: 10.1016/j.ecoser.2015.02.002
Korpinen S., Laamanen L., Bergström L., Nurmi M., Andersen J. H., Haapaniemi J., et al. (2021). Combined effects of human pressures on Europe’s marine ecosystems. Ambio 50, 1325–1336. doi: 10.1007/s13280-020-01482-x
Kroeker K. J., Kordas R. L., Crim R., Hendriks I. E., Ramajo L., Singh G. S., et al. (2013). Impacts of ocean acidification on marine organisms: quantifying sensitivities and interaction with warming. Global Change Biol. 19, 1884–1896. doi: 10.1111/gcb.12179
Libralato S., Christensen V., and Pauly D. (2006). A method for identifying keystone species in food web models. Ecological Modelling 195, 153–171. doi: 10.1016/j.ecolmodel.2005.11.029
Libralato S., Coll M., Tudela S., Palomera I., and Pranovi F. (2008). Novel index for quantification of ecosystem effects of fishing as removal of secondary production. Mar. Ecol. Prog. Ser. 355, 107–129. doi: 10.3354/meps07224
Link J. S. (2010). Adding rigor to ecological network models by evaluating a set of pre-balance diagnostics: A plea for PREBAL. Ecological Modelling 221, 1580–1591. doi: 10.1016/j.ecolmodel.2010.03.012
Lutchman I., Grieve C, De Clers S., and De Santo E. (2009). Towards A reform of the common fisheries policy in 2012 – A Cfp health check. London: IEEP. 80.
Lutchman I. and Grieve C n.d. Towards a reform of the common fisheries policy in 2012 – a cfp health check.
Lynam C. P., Llope M., Möllmann C., Helaouët P., Bayliss-Brown G. A., and Stenseth N. C. (2017). Interaction between top-down and bottom-up control in marine food webs. Proc. Natl. Acad. Sci. 114, 1952–1957. doi: 10.1073/pnas.1621037114
Lynam C. P. and Mackinson S. (2015). How will fisheries management measures contribute towards the attainment of Good Environmental Status for the North Sea ecosystem? Global Ecol. Conserv. 4, 160–175. doi: 10.1016/j.gecco.2015.06.005
Martínez J., Leonelli F. E., García-Ladona E., Garrabou J., Kersting D. K., Bensoussan N., et al. (2023). Evolution of marine heatwaves in warming seas: the Mediterranean Sea case study. Front. Mar. Sci. 10, 1193164. doi: 10.3389/fmars.2023.1193164
Meli M. (2024). The potential recording of North Ionian Gyre’s reversals as a decadal signal in sea level during the instrumental period. Sci. Rep. 14, 4907. doi: 10.1038/s41598-024-55579-4
Möllmann C., Müller-Karulis B., Kornilovs G., and St John M. A. (2008). Effects of climate and overfishing on zooplankton dynamics and ecosystem structure: regime shifts, trophic cascade, and feedback loops in a simple ecosystem. ICES J. Mar. Sci. 65, 302–310. doi: 10.1093/icesjms/fsm197
Morissette L. (2007). Complexity, cost and quality of ecosystem models and their impact on resilience : a comparative analysis, with emphasis on marine mammals and the Gulf of St. Lawrence (University of British Columbia). doi: 10.14288/1.0074903
Moullec F., Barrier N., Drira S., Guilhaumon F., Marsaleix P., Somot S., et al. (2019). An end-to-end model reveals losers and winners in a warming Mediterranean sea. Front. Mar. Sci. 6. doi: 10.3389/fmars.2019.00345
Moutopoulos D. K., Tsagarakis K., and Machias A. (2018). Assessing ecological and fisheries implications of the EU landing obligation in Eastern Mediterranean. Journal of Sea Research 141, 99–111. doi: 10.1016/j.seares.2018.08.006
O’Connor M. I., Mori A. S., Gonzalez A., Dee L. E., Loreau M., Avolio M., et al. (2021). Grand challenges in biodiversity–ecosystem functioning research in the era of science–policy platforms require explicit consideration of feedbacks. Proc. R. Soc. B: Biol. Sci. 288, 20210783. doi: 10.1098/rspb.2021.0783
OSPAR. (2017) Intermediate Assessment 2017. Available at: https://oap.ospar.org/en/ospar-assessments/intermediate-assessment-2017
Papantoniou G., Zervoudaki S., Assimakopoulou G., Stoumboudi M., and Tsagarakis K. (2023). Ecosystem-level responses to multiple stressors using a time-dynamic food-web model: The case of a re-oligotrophicated coastal embayment (Saronikos Gulf, E Mediterranean). Sci. Total Environ. 903, 165882. doi: 10.1016/j.scitotenv.2023.165882
Pennino M. G., Coll M., Albo-Puigserver M., Fernández-Corredor E., Steenbeek J., Giráldez A., et al. (2020). Current and future influence of environmental factors on small pelagic fish distributions in the Northwestern Mediterranean Sea. Front. Mar. Sci. 7. doi: 10.3389/fmars.2020.00622
Peristeraki P., Tserpes G., Kavadas S., Kallianiotis A., and Stergiou K. I. (2020). The effect of bottom trawl fishery on biomass variations of demersal chondrichthyes in the eastern Mediterranean. Fisheries Res. 221, 105367. doi: 10.1016/j.fishres.2019.105367
Piggott J. J., Townsend C. R., and Matthaei C. D. (2015). Reconceptualizing synergism and antagonism among multiple stressors. Ecol. Evol. 5, 1538–1547. doi: 10.1002/ece3.1465
Pimiento C., Albouy C., Silvestro D., Mouton T. L., Velez L., Mouillot D., et al. (2023). Functional diversity of sharks and rays is highly vulnerable and supported by unique species and locations worldwide. Nat. Commun. 14, 7691. doi: 10.1038/s41467-023-43212-3
Pinsky M. L., Selden R. L., and Kitchel Z. J. (2020). Climate-Driven Shifts in Marine Species Ranges: Scaling from Organisms to Communities. Annual Review of Marine Science 12, 153–179. doi: 10.1146/annurev-marine-010419-010916
Piroddi C., Giovanni B., and Villy C. (2010). Effects of local fisheries and ocean productivity on the northeastern Ionian Sea ecosystem. Ecological Modelling 221, 1526–1544. doi: 10.1016/j.ecolmodel.2010.03.002
Pisano A., Marullo S., Artale V., Falcini F., Yang C., Leonelli F. E., et al (2020). New Evidence of Mediterranean Climate Change and Variability from Sea Surface Temperature Observations. Remote Sensing 12, 132. doi: 10.3390/rs12010132
Piroddi C., Coll M., Liquete C., Macias D., Greer K., Buszowski J., et al. (2017). Historical changes of the Mediterranean Sea ecosystem: modelling the role and impact of primary productivity and fisheries changes over time. Sci. Rep. 7, 44491. doi: 10.1038/srep44491
Ramírez F., Coll M., Navarro J., Bustamante J., and Green A. J. (2018). Spatial congruence between multiple stressors in the Mediterranean Sea may reduce its resilience to climate impacts. Sci. Rep. 8, 14871. doi: 10.1038/s41598-018-33237-w
Rivetti I., Fraschetti S., Lionello P., Zambianchi E., and Boero F. (2014). Global warming and mass mortalities of benthic invertebrates in the Mediterranean Sea. PLoS One 9, e115655. doi: 10.1371/journal.pone.0115655
Queirós A. M., Strong J. A., Mazik K., Carstensen J., Bruun J., Somerfield P. J., et al. (2016). An Objective Framework to Test the Quality of Candidate Indicators of Good Environmental Status. Front. Mar. Sci. 3. doi: 10.3389/fmars.2016.00073
Ramfos A., Isari S., Somarakis S., Georgopoulos D., Koutsikopoulos C., and Fragopoulu N. (2006). Mesozooplankton community structure in offshore and coastal waters of the Ionian Sea (eastern Mediterranean) during mixed and stratified conditions. Mar. Biol. 150, 29–44. doi: 10.1007/s00227-006-0326-0
Raptis N., Papantoniou G., Raitsos D. E., Damalas D., and Tsagarakis K. (2025). Ecopath modelling Unravels the food web of the Gulf of Corinth, a deep Mediterranean important marine Mammal area. Deep Sea Research Part I: Oceanographic Research Papers. 218, 104466. doi: 10.1016/j.dsr.2025.104466
Sakamoto T., Takahashi M., Chung M.-T., Rykaczewski R. R., Komatsu K., Shirai K., et al. (2022). Contrasting life-history responses to climate variability in eastern and western North Pacific sardine populations. Nat. Commun. 13, 5298. doi: 10.1038/s41467-022-33019-z
Schickele A., Goberville E., Leroy B., Beaugrand G., Hattab T., Francour P., et al. (2021). European small pelagic fish distribution under global change scenarios. Fish Fisheries 22, 212–225. doi: 10.1111/faf.12515
Shin Y. J., Bundy A., Shannon L. J., Blanchard J. L., Chuenpagdee R., Coll M., et al. (2012). Global in scope and regionally rich: an IndiSeas workshop helps shape the future of marine ecosystem indicators. Rev. Fish Biol. Fisheries 22 (3), 835–845. doi: 10.1007/s11160-012-9252-z
Scientific, Technical and Economic Committee for Fisheries, Carvalho N., Guillen J., and Prellezo R. (2020). The 2020 annual economic report on the EU fishing fleet (STECF 20-06). In: Carvalho N., Guillen J., and Prellezo R.. Publications Office. doi: 10.2760/500525
Scott E., Serpetti N., Steenbeek J., and Heymans J. J. (2016). A Stepwise Fitting Procedure for automated fitting of Ecopath with Ecosim models. SoftwareX 5, 25–30. doi: 10.1016/j.softx.2016.02.002
Serena F., Abella A. J., Bargnesi F., Barone M., Colloca F., Ferretti F., et al. (2020). Species diversity, taxonomy and distribution of Chondrichthyes in the Mediterranean and Black Sea. Eur. Zoological J. 87, 497–536. doi: 10.1080/24750263.2020.1805518
Serpetti N., Baudron A. R., Burrows M. T., Payne B. L., Helaouët P., Fernandes P. G., et al. (2017). Impact of ocean warming on sustainable fisheries management informs the Ecosystem Approach to Fisheries. Sci. Rep. 7, 13438. doi: 10.1038/s41598-017-13220-7
Shannon L., Coll M., Bundy A., Gascuel D., Heymans J. J., Kleisner K., et al. (2014). Trophic level-based indicators to track fishing impacts across marine ecosystems. Marine Ecology Progress Series. 512, 115–140. doi: 10.3354/meps10821
Shephard S., Reid D. G., and Greenstreet S. P. R. (2011). Interpreting the large fish indicator for the Celtic Sea. ICES J. Mar. Sci. 68, 1963–1972. doi: 10.1093/icesjms/fsr114
Shin Y. J., Shannon L. J., Bundy A., Coll M., Aydin K., Bez N., et al. (2010). Using indicators for evaluating, comparing, and communicating the ecological status of exploited marine ecosystems. 2. Setting the scene. ICES J Mar Sci. 67, 692–716. doi: 10.1093/icesjms/fsp294
Smith K. E., Burrows M. T., Hobday A. J., King N. G., Moore P. J., Gupta A. S., et al. (2023). Biological impacts of marine heatwaves. Annu. Rev. Mar. Sci. 15, 119–145. doi: 10.1146/annurev-marine-032122-121437
Steenbeek J., Corrales X., Platts M., and Coll M. (2018). Ecosampler: A new approach to assessing parameter uncertainty in Ecopath with Ecosim. SoftwareX 7, 198–204. doi: 10.1016/j.softx.2018.06.004
Steffen W., Rockström J., Richardson K., Lenton T. M., Folke C., Liverman D., et al. (2018). Trajectories of the earth system in the anthropocene. Proc. Natl. Acad. Sci. 115, 8252–8259. doi: 10.1073/pnas.1810141115
Stock A., Murray C. C., Gregr E. J., Steenbeek J., Woodburn E., Micheli F., et al. (2023). Exploring multiple stressor effects with Ecopath, Ecosim, and Ecospace: Research designs, modeling techniques, and future directions. Sci. Total Environ. 869, 161719. doi: 10.1016/j.scitotenv.2023.161719
Tejedor E., Benito G., Serrano-Notivoli R., González-Rouco F., Esper J., and Büntgen U. (2024). Recent heatwaves as a prelude to climate extremes in the western Mediterranean region. NPJ Clim Atmos Sci. 7, 1–7. doi: 10.1038/s41612-024-00771-6
Thorpe R. B., Arroyo N. L., Safi G., Niquil N., Preciado I., Heath M., et al. (2022). The response of North Sea ecosystem functional groups to warming and changes in fishing. Front. Mar. Sci. 9. doi: 10.3389/fmars.2022.841909
Tsagarakis K., Coll M., Giannoulaki M., Somarakis S., Papaconstantinou C., and Machias A. (2010). Food-web traits of the North Aegean Sea ecosystem (Eastern Mediterranean) and comparison with other Mediterranean ecosystems. Estuarine Coast. Shelf Sci. 88, 233–248. doi: 10.1016/j.ecss.2010.04.007
Tsagarakis K., Palialexis A., and Vassilopoulou V. (2014). Mediterranean fishery discards: review of the existing knowledge. ICES J Mar Sci 71, 1219–1234. doi: 10.1093/icesjms/fst074
Tsagarakis K., Carbonell A., Brčić J., Bellido J. M., Carbonara P., Casciaro L., et al. (2017). Old Info for a New Fisheries Policy: Discard Ratios and Lengths at Discarding in EU Mediterranean Bottom Trawl Fisheries. Front. Mar. Sci. 4. doi: 10.3389/fmars.2017.00099
Tsagarakis K., Libralato S., Giannoulaki M., Touloumis K., Somarakis S., Machias A., et al. (2022). Drivers of the north Aegean Sea ecosystem (Eastern Mediterranean) through time: insights from multidecadal retrospective analysis and future simulations. Front. Mar. Sci. 9. doi: 10.3389/fmars.2022.919793
Turschwell M. P., Connolly S. R., Schäfer R. B., De Laender F., Campbell M. D., Mantyka-Pringle C., et al. (2022). Interactive effects of multiple stressors vary with consumer interactions, stressor dynamics and magnitude. Ecol. Lett. 25, 1483–1496. doi: 10.1111/ele.14013
Tzanatos E., Georgiadis M., and Peristeraki P. (2020). “Small-scale fisheries in Greece: status, problems, and management,” in Small-Scale Fisheries in Europe: Status, Resilience and Governance. Eds. Pascual-Fernández J. J., Pita C., and Bavinck M. (Springer International Publishing, Cham), 125–150. doi: 10.1007/978-3-030-37371-9_7
Tzanatos E., Raitsos D. E., Triantafyllou G., Somarakis S., and Tsonis A. A. (2014). Indications of a climate effect on Mediterranean fisheries. Climatic Change 122, 41–54. doi: 10.1007/s10584-013-0972-4
Valls A., Coll M., and Christensen V. (2015). Keystone species: toward an operational concept for marine biodiversity conservation. Ecol. Monogr. 85, 29–47. doi: 10.1890/14-0306.1
Veloy C., Hidalgo M., Pennino M. G., Garcia E., Esteban A., García-Ruiz C., et al. (2022). Spatial-temporal variation of the Western Mediterranean Sea biodiversity along a latitudinal gradient. Ecol. Indic. 136, 108674. doi: 10.1016/j.ecolind.2022.108674
Keywords: climate warming, fishing effort, compounded impact, stressor interactions, ecological indicators
Citation: Papantoniou G, Sgardeli V, Vassilopoulou V and Tsagarakis K (2025) Investigating the potential impacts and interactive effects of climate warming and multi-gear fishing on the Eastern Ionian Sea ecosystem using EwE and ecological indicators. Front. Mar. Sci. 12:1621603. doi: 10.3389/fmars.2025.1621603
Received: 01 May 2025; Accepted: 17 September 2025;
Published: 09 October 2025.
Edited by:
Marie Briguglio, University of Malta, MaltaReviewed by:
Natalia Serpetti, Joint Research Centre, ItalyPasquale Ricci, University of Bari Aldo Moro, Italy
Jerome Guiet, University of California, Los Angeles, United States
Copyright © 2025 Papantoniou, Sgardeli, Vassilopoulou and Tsagarakis. This is an open-access article distributed under the terms of the Creative Commons Attribution License (CC BY). The use, distribution or reproduction in other forums is permitted, provided the original author(s) and the copyright owner(s) are credited and that the original publication in this journal is cited, in accordance with accepted academic practice. No use, distribution or reproduction is permitted which does not comply with these terms.
*Correspondence: Georgia Papantoniou, Z2VvcGFwYW50QGhjbXIuZ3I=