Abstract
Introduction:
Coastal shallow marine sediments serve as important sinks for trace metals and are crucial indicators of anthropogenic pollution. The Wanning area of Hainan Island has experienced rapid coastal development and intensified aquaculture, raising concerns about metal contamination.
Methods:
In this study, 57 surface sediment samples were collected from the coastal shallow sea of the Wanning area. The concentrations of seven trace metals (As, Hg, Cu, Zn, Cd, Pb, and Cr) were determined. Pollution levels were evaluated using the Nemero multifactor pollution index, and source apportionment was conducted through the Positive Matrix Factorization (PMF) model.
Results:
The average concentrations of As, Hg, Cu, Zn, Cd, Pb, and Cr were 11.40, 0.037, 11.36, 51.69, 0.10, 24.53, and 45.86 mg/kg, respectively, which generally comply with China’s Class I Marine Sediment Quality Standard. While the overall pollution level was low, localized hotspots of As, Cu, Cr, and Pb were identified. The PMF model identified four major pollution sources: aquaculture-related fish medicine (Factor 1, 17.9%), urban wastewater and farm feed (Factor 2, 30.5%), agricultural pesticide use (Factor 3, 17.3%), and maritime transportation (Factor 4, 34.3%).
Discussion:
The results indicate that the primary contributors to trace metal pollution in the Wanning coastal area are human activities, including maritime transport, aquaculture, and agriculture. These findings highlight the need for targeted pollution control measures to ensure sustainable coastal development and marine environmental protection.
1 Introduction
Coastal shallow marine sediments have increasingly attracted attention from environmental scientists, particularly those in marine studies, because of their role as major sinks for pollutants and an important biological habitats (Ma, 1993). Most trace metals discharged into the marine environment eventually settle in sediments, making them long-term reservoirs of these contaminants (Kong et al., 2015; Zhang et al., 2010). In recent years, intensified human activities—including sewage discharge, coastal development, transportation, and agricultural practices—have significantly increased the input of trace metals into coastal shallow marine sediments. Since trace metals are not easily degraded or excreted by aquatic organisms, they can accumulate in their tissues. These metals may then be transferred and biomagnified through the food chain, ultimately posing a threat to human health (Jain et al., 2016; Cao et al., 2013). Furthermore, the diffuse nature of trace metal pollution can diminish coastal tourism value and severely impact local landscapes and ecosystems, placing unprecedented pressure on coastal resources. Given the increasing global focus on coastal sustainability, it is essential to assess the extent, diffusion, and sources of trace metal pollution in coastal shallow marine sediments, to provide a valuable reference for effective pollution control and contribute to integrated coastal management and sustainable ecological–economic development.
Wanning City, located in the eastern part of Hainan Island, is an important coastal city in Hainan Province. The ongoing development of the Hainan Free Trade Port has accelerated urbanization and agricultural intensification, exerting significant pressure on environmental quality (Li et al., 2022a; Sun et al., 2022; Yang et al., 2022; Sun et al., 2022; Wang et al., 2022). The major industries in Wanning include rubber processing, transportation, and construction-related activities such as cement manufacturing and brick production. Agricultural activities primarily involve the cultivation of rice, tropical fruits, betel nut, and rubber (Fei et al., 2020; Wu et al., 2021a, Wu et al., 2021b). Fisheries in the area are primarily characterized by large-scale marine aquaculture operations. In addition, Wanning serves as a maritime transportation hub in eastern Hainan. Its urban development pattern resembles that of many other coastal cities around the world, and studying the trace metal pollution associated with such development provides valuable insights for sustainable planning in other coastal regions.
Trace metal source investigations generally involve two aspects: source identification and source apportionment. Source identification refers to the qualitative recognition of trace metal sources (Shao et al., 2018), such as traditional multivariate statistical methods. In contrast, source apportionment focuses on quantifying the contributions of different pollution sources. Common receptor models include the chemical mass balance (CMB) method (Chen et al., 2018), factor analysis (Sun et al., 2024; Liu et al., 2023), and mixed models (Lu et al., 2012; Huang et al., 2018), as well as machine learning methods based on ensemble learning models, such as random forests and gradient boosted trees (Wang et al., 2015; Zhang et al., 2017). The CMB method requires real-time monitoring of the pollution sources in the study area and constant updating of the source composition spectra (Zhang et al., 2015), which incurs high costs and is subject to human-induced biases. Although machine learning models are effective at capturing nonlinear patterns and assessing the importance of environmental variables, they generally lack the ability to precisely quantify the contribution of each pollution source. The Positive Matrix Factorization (PMF) model, by contrast, can quantitatively estimate source contributions without requiring precise source profile information, making it a more convenient and efficient tool for pollution source apportionment (Bu et al., 2020; Li et al., 2020).
Accordingly, this study employed the PMF model to quantitatively identify and apportion the sources of trace metals in sediments. However, previous PMF-based studies typically focused on the entire study area, making it difficult to spatially correlate pollution sources with local trace metal levels in sediments (Huang et al., 2022a, Huang et al., 2022b; Chai et al., 2021; Lv et al., 2013). To address this limitation, this study applied kriging interpolation to spatially visualize the PMF-derived factors. The spatial distribution of pollution sources was then interpreted in combination with the dominant industrial and agricultural activities in surrounding towns.
2 Materials and methods
2.1 Overview of the study area
Wanning City is located in the southeastern part of Hainan Island. It is a typical coastal city in Hainan Province. It borders the South China Sea to the east, Qionghai City to the north, Qiongzhong County to the west, and Lingshui County to the south. As of the end of 2024, Wanning City had a resident population of 558,300, with 12 towns under the city’s jurisdiction. Major transportation routes such as National Highway 223 and the Eastern Expressway pass through Wanning, connecting Haikou and Sanya, and Wuchang port and Gangbei port provide access to other provincial ports. Both land and maritime transportation are convenient.
Wanning City has a subtropical humid monsoon maritime climate. The average annual temperature is 24.1°C. The hottest months are June and July, with an average temperature of 28.5°C. The coldest month is January, averaging 18.7°C. The annual temperature range is only 10°C. The mild climate makes it highly suitable for both aquaculture and tropical agriculture. The Modern Agricultural Industrial Park in Wanning City is located along the coast and includes four towns: Shangen, Hele, Wancheng, and Dong’ao, and it mainly focuses on marine aquaculture, particularly of the eastern star-spot (Epinephelus akaara) and Seriola quinqueradiata. The aquaculture output ranks first in Hainan Province, contributing over 35% of the national production value in this category. In northern Wanning, particularly in Longgun and Shangen Towns, the tropical plantation industry is highly developed; the region produces tropical fruits such as pineapple, lychee, and longan. It is also the largest winter pineapple production base in China, and it has also been recognized as a demonstration base for premium tropical crop products in the South Asia region.
2.2 Data sources and quality control
2.2.1 Surface sediment sampling methods
In this study, 57 benthic surface sediment samples were systematically collected from the coastal shallow sea and lagoon areas of the Wanning region (Figure 1). Upon arrival at each designated site, surface sediment samples were collected using either a grab sampler or a box sampler, depending on site conditions, and the coordinates of each sampling location were recorded using Global Positioning System (GPS). Surface samples were collected to a depth of at least 5 cm, with a minimum wet weight of 2 kg. The samples were filtered to remove excess water and visible debris, including gravel, wood chips, weeds, plastics, and biological remains such as shells, and the samples were thoroughly homogenized, placed in cloth bags lined with polyethylene, and transported to the laboratory for analysis.
Figure 1

Distribution of sampling points.
Samples of the overlying water column (1 to 2 m from the seafloor) were collected at the same time as sediment samples. To avoid contamination, precautions were taken to prevent interference from potential onboard pollution sources. Samples were taken against the direction of wind and current. Bottom water samples were avoided in areas enriched with suspended sediments (generally within 1 m of the seafloor), and water disturbed by the ship’s propellers was avoided. If floating debris was observed on the water surface, care was taken to prevent it from entering the sampler; otherwise, the water was re-sampled.
2.2.2 Sample pretreatment and testing
All sample analyses were conducted at the laboratory of the Haikou Marine Geological Survey Center, China Geological Survey.
Prior to analysis, the wet samples stored in polyethylene bags were transferred to clean, pre-numbered porcelain evaporating dishes and dried in an oven at 80–100°C. During drying, the samples were stirred frequently with a glass rod and crushed to accelerate moisture loss: the dried samples were then spread on clean polyethylene sheets to manually remove gravel and large biological debris. Approximately 100 g of each dried sample was placed into a 500-mL agate bowl. Agate balls were then added, and the samples were ground using a ball mill until the entire sample passed through a 160-mesh sieve (96 μm). The number and size of agate balls, as well as the grinding time, were pre-optimized through preliminary tests. No further sieving was conducted after grinding. After thorough grinding and homogenization, the sample was reduced using the quartering method, then 10–20 g of the prepared sample was placed into labeled sample bags (including station number and sample layer information) for analysis.
According to the national standard methods of chemical analysis of seabed sediment (GB/T 20260-2006), elements such as Cu, Zn, Cd, Pb, and Cr were analyzed using inductively coupled plasma mass spectrometry (ICP-MS), and the detection limits were 0.80 mg/kg for Cu, 3.73 mg/kg for Zn, 0.0467 mg/kg for Cd, 2.73 mg/kg for Pb, and 3.40 mg/kg for Cr. Arsenic (As) was measured using hydride-generation atomic fluorescence spectrometry, with a detection limit of 0.05 mg/kg. Mercury (Hg) was determined using cold vapor atomic fluorescence spectrometry, with a detection limit of 0.003 mg/kg. For quality control, certified reference materials (CRMs) were analyzed after every 20 samples. Parallel duplicates and blanks were also tested simultaneously. The results of the CRMs are shown in Supplementary Tables S1 and S2 (see Supplementary Materials).
Sediment grain size was determined in the laboratory using both sieve analysis and laser diffraction methods. Analytical precision was monitored using internal check samples. Internal check samples accounted for 10%–20% of total samples for sieve analysis and 5%–10% for the laser method. The allowable error range followed the specifications outlined in Marine Surveys Part 8: Marine Geological and Geophysical Surveys (GB/T 12763.8-2007). Samples exceeding this range were reanalyzed.
Water quality parameters, including temperature, salinity, and pH, were measured on-site using a multi-parameter water quality analyzer, with appropriate calibration and parallel sampling performed to ensure accuracy. Quality control involved blank tests, parallel samples, sample retention, and re-testing, as well as instrument calibration. Water temperature was measured on-site using a thermometer, with calibration performed for quality assurance.
2.3 Evaluation methods
2.3.1 Evaluation model for surface sediment environmental quality
(1) Single-factor pollution index
The single-factor pollution index Pki is a dimensionless parameter used to evaluate the degree of contamination by individual trace metals in sediments. It serves as a simple and effective tool for assessing environmental quality and the influence of anthropogenic activities (Chai et al., 2021). The Pki classification criteria are presented in Table 1 (Chai et al., 2021; Wang et al., 2022b). where Pki is the single-factor pollution index for metal i; Cki is the measured concentration of metal i in the sediment; and Ci is the corresponding background concentration of metal i (the geochemical baseline value for Chinese shallow marine sediments). The single-factor pollution index was categorized into five classes: safe (≤1), warning threshold (1< ≦2), slight pollution (2< ≦3), moderate pollution (3< ≦5), and severe pollution (>5).
Table 1
| Pollution index | Element | Max | Min | Mean value | The proportion of samples with different pollution levels/% | P Ni for element | Pollutant percentage/% | ||||
|---|---|---|---|---|---|---|---|---|---|---|---|
| Safety | Warning Threshold | Slight | Moderate | Severe | |||||||
| As | 5.99 | 0.20 | 1.48 | 36.8 | 47.4 | 3.5 | 8.8 | 3.5 | 4.36 | 11.7 | |
| Hg | 10.52 | 0.02 | 1.48 | 50.9 | 29.8 | 5.3 | 7.0 | 7.0 | 7.51 | 20.2 | |
| Cu | 15.27 | 0.03 | 0.89 | 75.4 | 17.5 | 5.3 | 0.0 | 1.8 | 10.81 | 29.1 | |
| Zn | 2.60 | 0.08 | 0.80 | 64.9 | 28.1 | 7.0 | 0.0 | 0.0 | 1.92 | 5.2 | |
| Pb | 4.68 | 0.36 | 1.23 | 45.6 | 45.6 | 5.3 | 3.5 | 0.0 | 3.42 | 9.2 | |
| Cd | 9.25 | 0.36 | 1.54 | 47.4 | 29.8 | 8.8 | 8.8 | 5.3 | 6.63 | 17.8 | |
| Cr | 3.49 | 0.07 | 0.75 | 77.2 | 19.3 | 1.8 | 1.8 | 0.0 | 2.53 | 6.8 | |
| P Ni for sampling point | 11.01 | 0.56 | 2.25 | 12.3 | 10.5 | 38.6 | 19.3 | 19.3 | / | / | |
Trace metal pollution index of the sediment in the research area.
(2) Nemero multifactor pollution index
The Nemero multifactor pollution index is a widely used method in pollution evaluation developed based on the single-factor pollution index, which is commonly used in soil pollution. The Nemero multifactor pollution index considers both the mean and maximum values of the single-factor pollution index, thereby reflecting the comprehensive impact of each pollutant on soil quality, especially highlighting the role of high-concentration pollutants (Zhao et al., 2020), and the specific calculation formula is as follows:
where is the mean value of the single pollution index of i sample; is the maximum value of the single pollution index of i sample; is the comprehensive pollution index of i samples. The pollution degree of trace metals was determined according to the calculated values. The grading evaluation criteria are shown in Table 2.
Table 2
| Single factor pollution index () | Multifactor pollution index () | ||
|---|---|---|---|
| Pollution gradation | Pollution gradation | ||
| ≦1 | Safe | ≦0.7 | Safe |
| (1, 2] | Warning threshold | (0.7, 1] | Warning threshold |
| (2, 3] | Slight pollution | (1, 2] | Slight pollution |
| (3, 5] | Moderate pollution | (2, 3] | Moderate pollution |
| >5 | Severe pollution | >3 | Severe pollution |
Evaluation and classification standard of sediment Nemero pollution index method.
(3) Pollutant percentage in Surface sediment
The percentage of each pollutant can be used to determine its relative contribution to the overall pollution level. Ranking pollutants by their percentage contributions, from highest to lowest, reflects their respective influence on total contamination (Fu et al., 2023).
2.3.2 Analysis of pollution sources
The PMF model is a receptor-based source apportionment method grounded in the least squares principle and recommended by the U.S. Environmental Protection Agency (USEPA) (Paatero and Tapper, 1994). It has been widely applied to identify and quantify pollution sources in various environmental media. It mainly decomposes the trace metal concentration matrix factors into, and residuals , at the same time defines the objective function Q so that its value is minimized to obtain the optimal factor contribution matrix and the factor source spectrum matrix, and the specific formulas are as follows:
where is the content of the jth trace metal indicator in the ith sample (mg/kg), is the factor contribution matrix, is the factor source spectrum matrix, and the components in G and F are positive, is the residual difference of the jth trace metal indicator in the ith sample, and p is the number of factors; is the uncertainty of the jth trace metal indicator in the ith sample, MDL is the trace metal instrument detection limit (mg/kg), σ is the error coefficient (taken as 0.1), and Conc is the mass concentration of trace metal indicator (mg/kg).
3 Results and analysis
3.1 Physicochemical properties of the environment
3.1.1 Sediment grain size and bathymetry
Sediment grain size serves as an integrated indicator of the sediment source, transport capacity, and transport pathway, and is also an important factor affecting the content of trace elements (Liu et al., 2012). The surface sediments in the study area are primarily composed of four types: sand, silt sand, sandy silt, and silt (Figure 2), with sand and silty sand being the dominant types, accounting for 63%. The particle size of sediments mainly ranges between 32 and 250 μm and between 2 and 8 μm, with the 32–250 μm size fraction being the most prevalent, indicating that sediment grain size in the region is relatively concentrated (Figure 3). Correlation analysis revealed a significant negative correlation between sand content and trace metal concentrations in the sediments of the study area (−0.25< R< −0.6, excluding As). In contrast, silt content exhibited a significant positive correlation with trace metal concentrations (0.31 < R < 0.71, excluding As), as did clay content (0.24 < R < 0.57, excluding As).
Figure 2
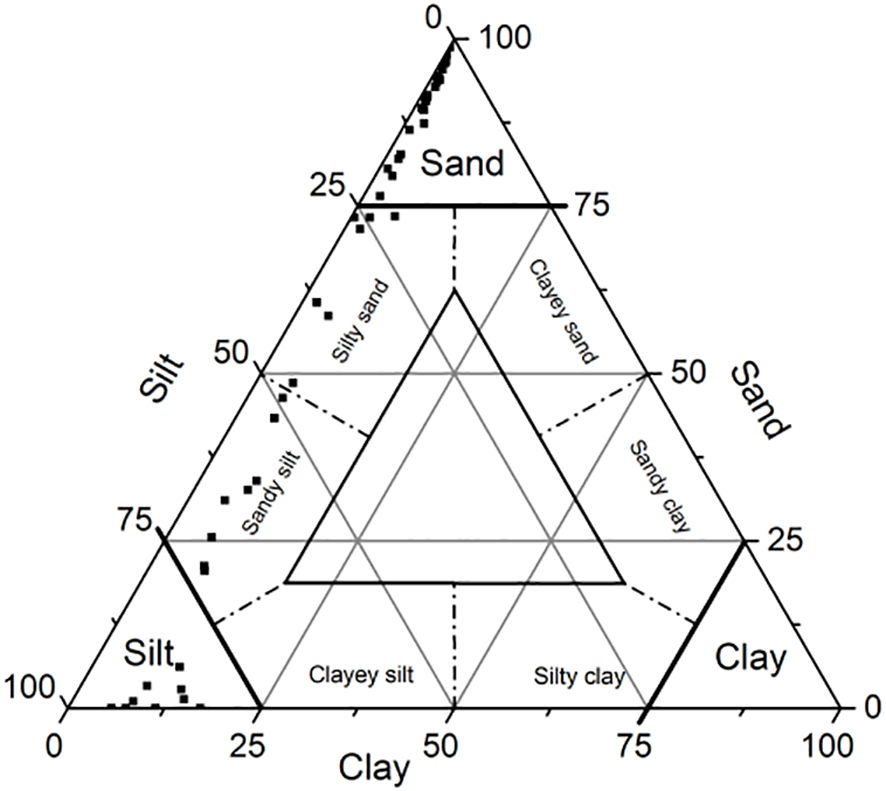
Sediment classification map.
Figure 3
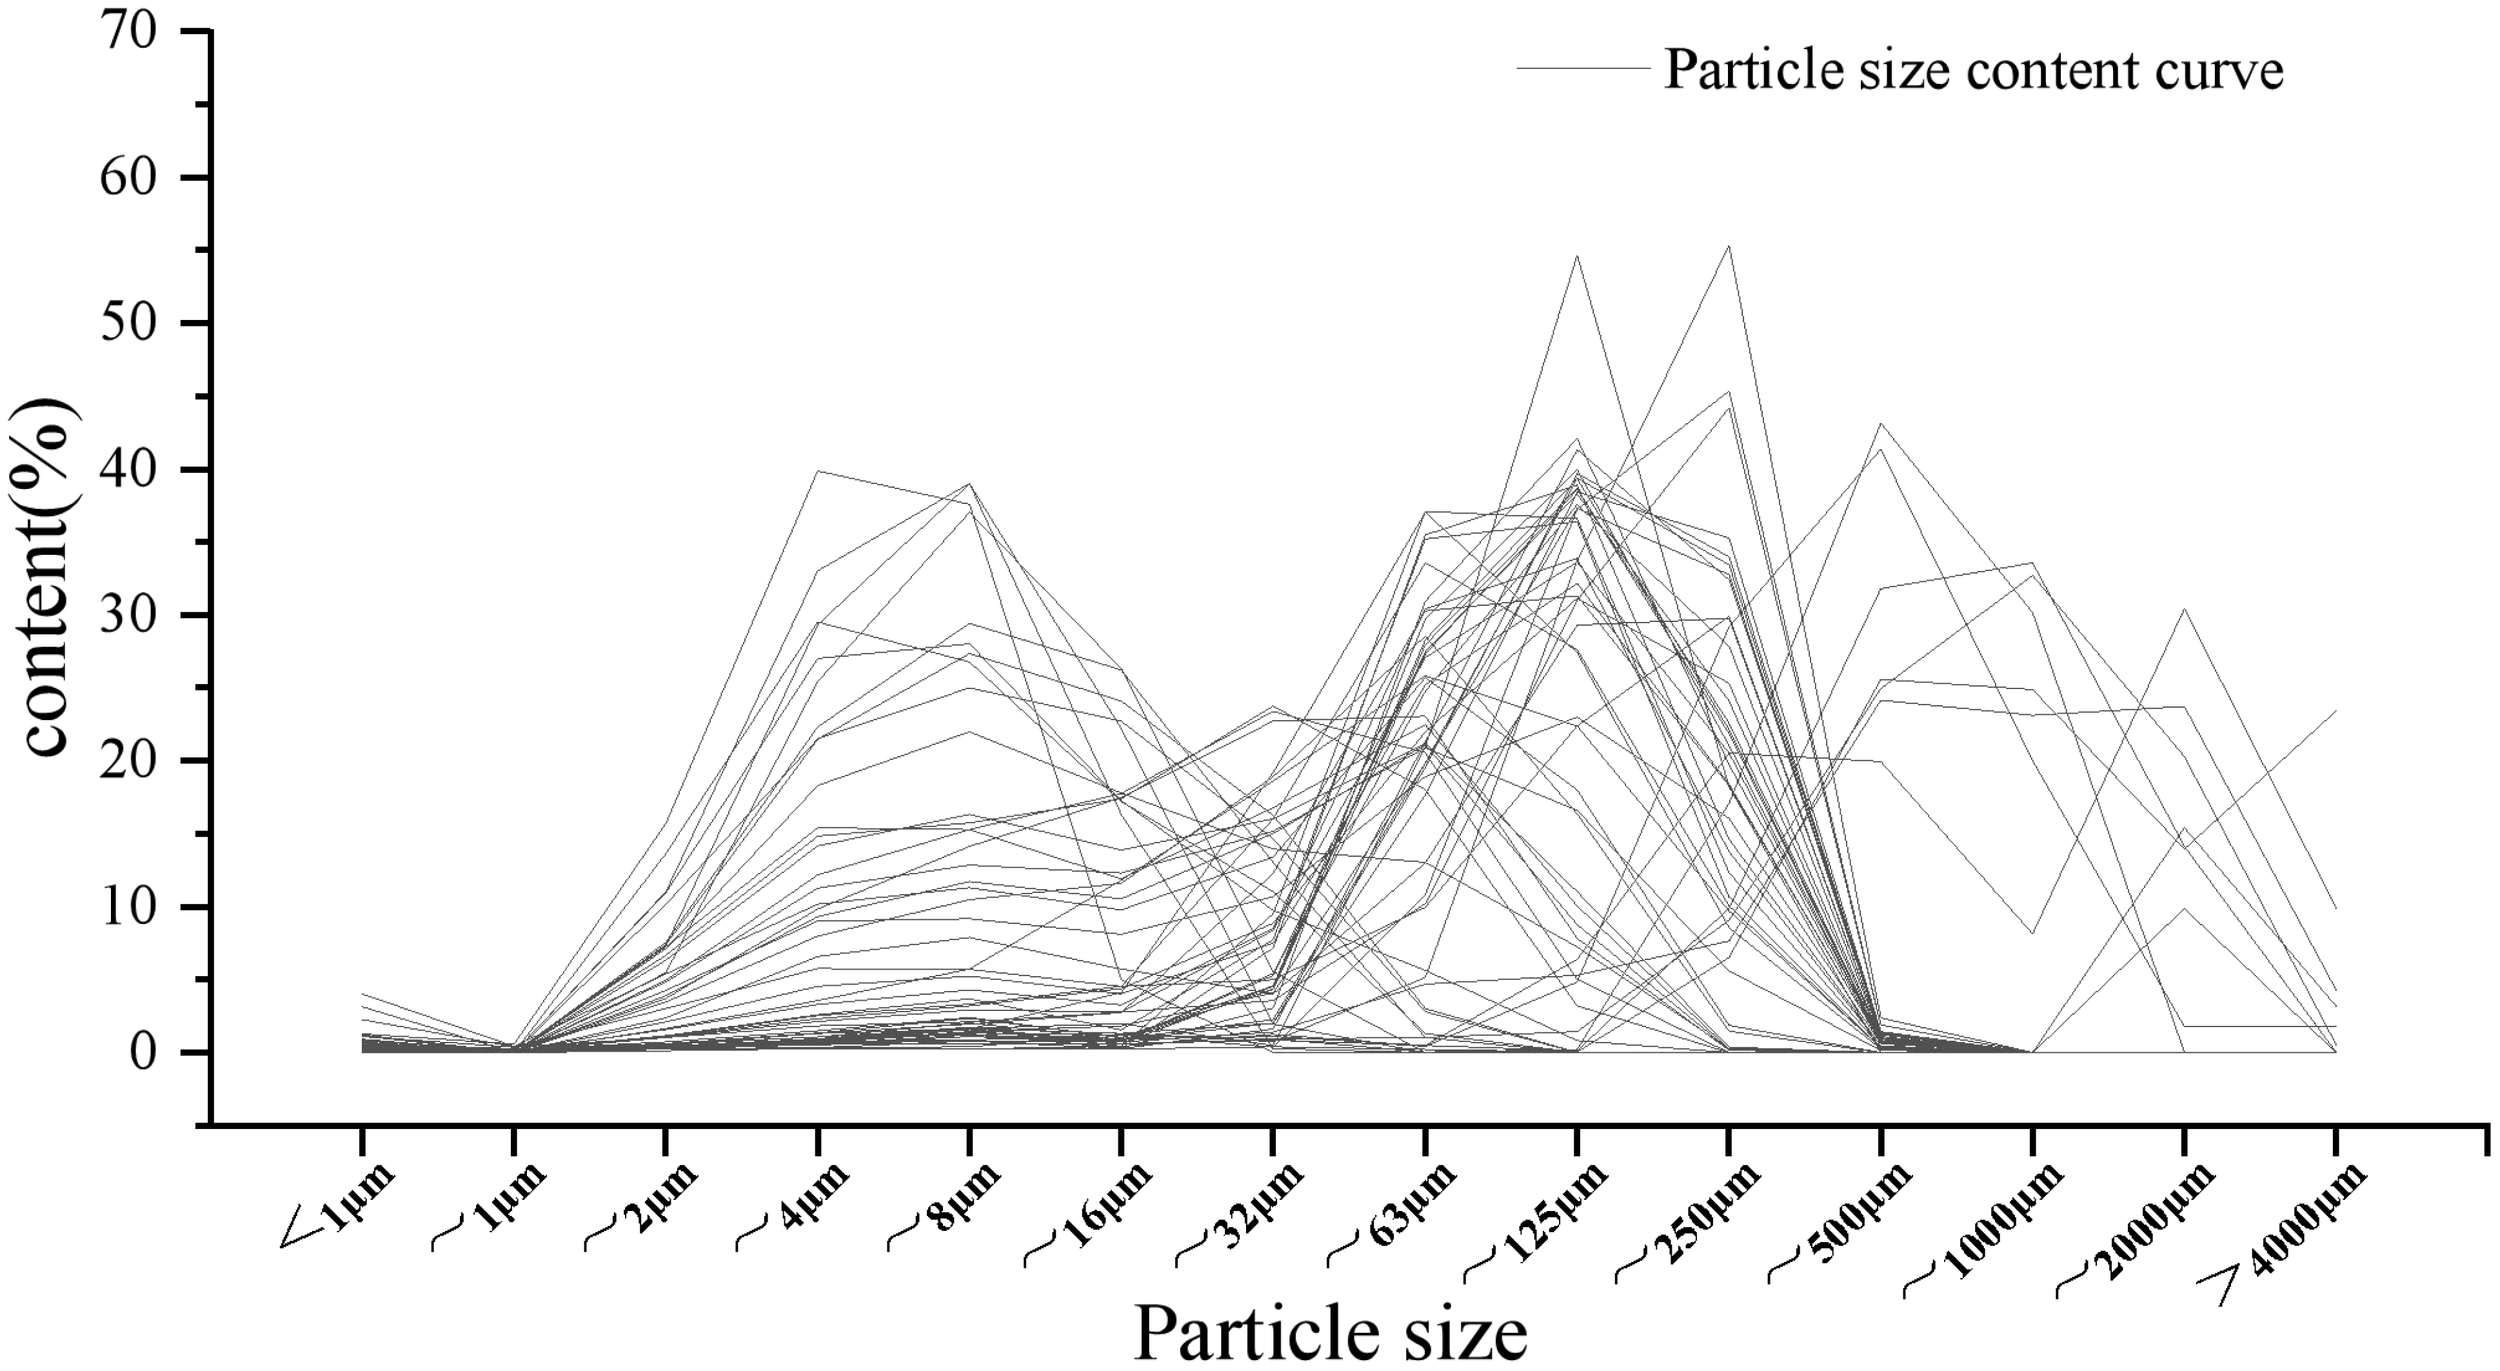
Sediment grain size distribution curve.
An analysis of the relationship between water depth and trace metal concentrations at sediment sampling sites (Figure 4) showed a weak negative correlation (−0.35 < R < −0.02) between seawater depth and sediment trace metal levels in the study area. There is also a weak negative correlation between seawater depth and sediment grain size, indicating that grain size decreases with increasing depth. However, trace metal concentrations in the sediments also decrease with depth, rather than increase. This suggests that the trace metals in the sediments originate primarily from anthropogenic activities near the coast, rather than being inherent to the sediments themselves. The correlation between As concentrations and both water depth and grain size shows trends opposite to those of the other elements, possibly due to the distinct fugacity behavior of As in marine sediments.
Figure 4
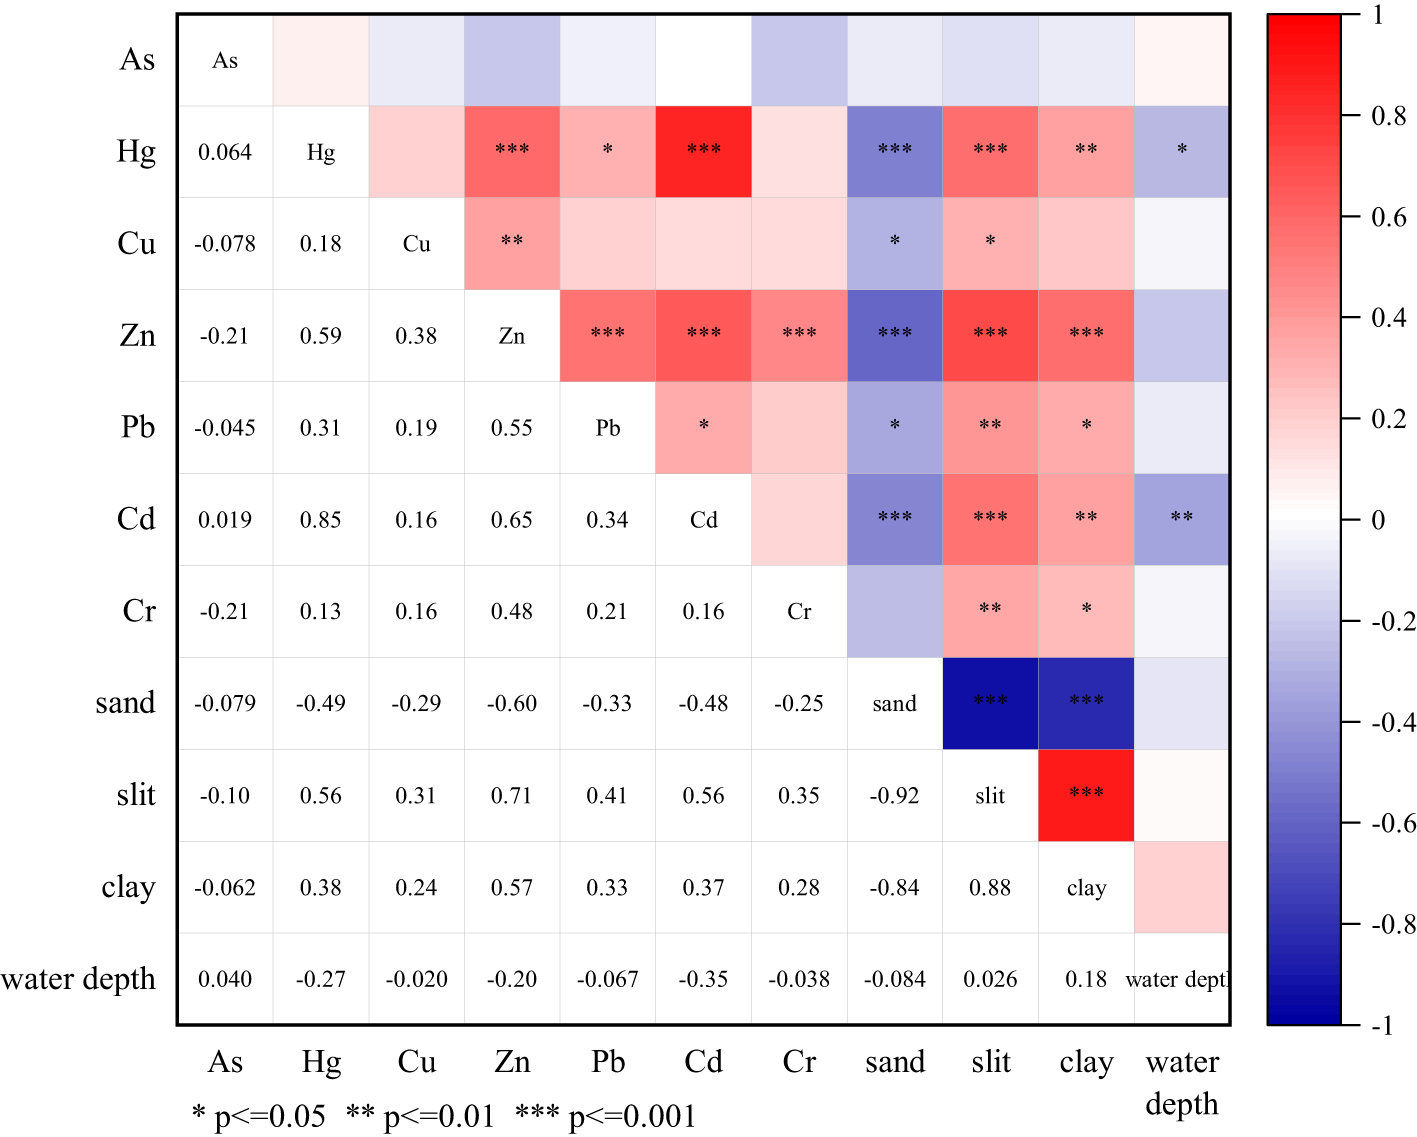
Surface sediment trace metal correlations.
3.1.2 Surface water salinity, water temperature, and pH
The transport and transformation of trace metals in sediments are closely related to their geochemical behavior and environmental conditions (Guo et al., 2023). The accumulation patterns of trace metals are not only influenced by their inherent physical and chemical properties, but also significantly affected by environmental factors such as sediment pH, redox potential, and particle size (Hu et al., 2021; Wijesiri et al., 2019). During this investigation, surface seawater parameters including pH, temperature, and salinity above the sediment sampling sites were measured (Figure 5).
Figure 5
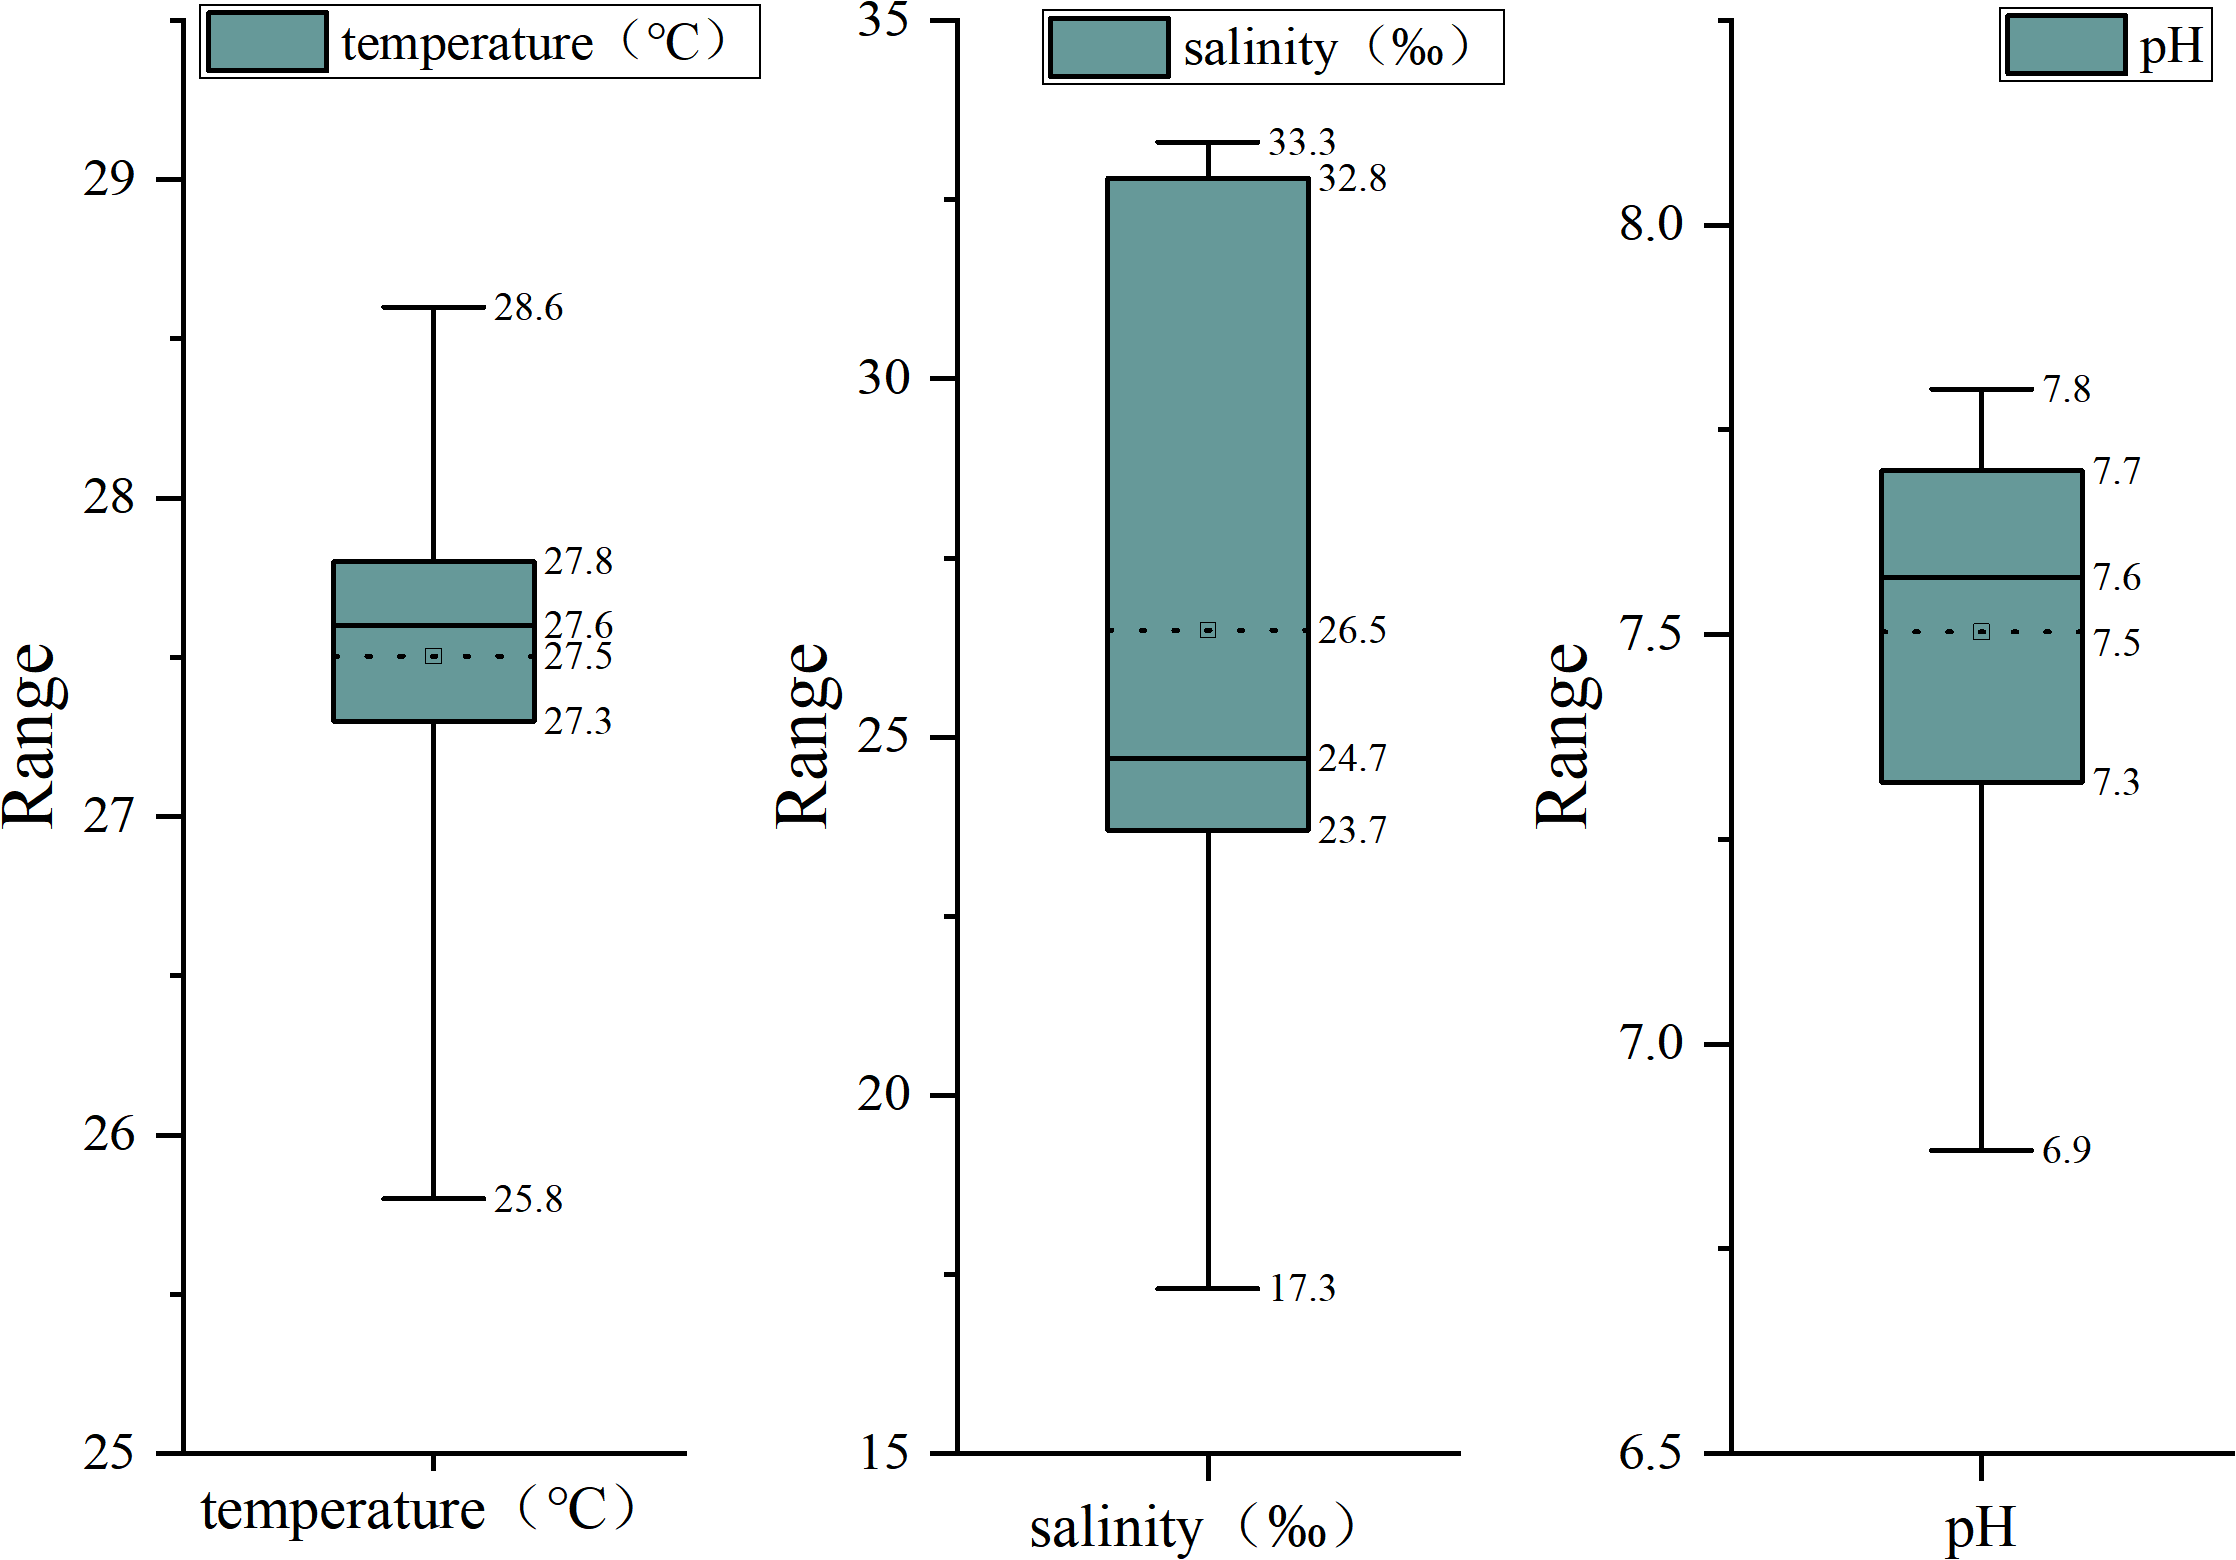
Box line plot of temperature, salinity, and pH distribution at sampling points.
Results showed that pH values ranged from 6.9 to 7.8, with an average of 7.5, indicating a weakly alkaline environment. Water temperatures varied from 25.8°C to 28.6°C, averaging 27.5°C. Salinity ranged from 17.3‰ to 33.3‰, with an average of 26.5‰. The surface water in the study area exhibited relatively low spatial variability in pH, salinity, and temperature.
3.2 Statistical analysis of trace metal content
The results of the trace metal content of sediments in the study area (Table 3) showed that Hg was below the detection limit in 7 samples (12%), Cu in 8 samples (14%), and Cd in 24 samples (42%). In this study, values below the detection limit were statistically treated as half the detection limit. The statistical summary indicated that the concentration ranges (mean values in parentheses) of the seven trace metal elements were as follows: As: 1.55–46.10 mg/kg (11.40 mg/kg); Hg: 0.0015–0.2630 mg/kg (0.0370 mg/kg); Cu: 0.40–229.00 mg/kg (13.36 mg/kg); Zn: 5.46–169.00 mg/kg (51.69 mg/kg); Cd: 0.0234–0.6010 mg/kg (0.1001 mg/kg); Pb: 7.29–93.60 mg/kg (24.53 mg/kg); and Cr: 4.23–213.00 mg/kg (45.86 mg/kg). The mean concentrations of Cr and Cd were substantially higher than those in coastal and southern shallow marine sediments of southern Hainan Island. Mean concentrations of As, Cu, and Pb were moderately higher, while those of Hg and Zn were slightly higher than those in the southern sea area but lower than those in nearshore sediments of southern Hainan Island.
Table 3
| Statistical parameter | As | Hg | Cu | Zn | Cd | Pb | Cr |
|---|---|---|---|---|---|---|---|
| Minimum value (mg/kg) | 1.55 | <0.003 | <0.8 | 5.46 | <0.0467 | 7.29 | 4.23 |
| Maximum value (mg/kg) | 46.10 | 0.2630 | 229.00 | 169.00 | 0.60 | 93.60 | 213.00 |
| Average value (mg/kg) | 11.40 | 0.0370 | 13.36 | 51.69 | 0.10 | 24.53 | 45.86 |
| Upper quartile (mg/kg) | 8.69 | 0.02 | 4.63 | 39.10 | 0.07 | 21.70 | 44.30 |
| Standard deviation | 8.62 | 0.06 | 30.71 | 39.63 | 0.12 | 14.93 | 36.69 |
| Dispersion coefficient | 0.76 | 1.49 | 2.30 | 0.77 | 1.18 | 0.61 | 0.80 |
| Coastal sediments in southern Hainan Island (He et al., 2017) (mg/kg) | 4.67 | 0.06 | 10.45 | 53.72 | 0.05 | 22.38 | 23.42 |
| Marine sediments in southern Hainan Island (Luo et al., 2017) (mg/kg) | 9.74 | 0.0194 | 8.33 | 38.98 | 0.06 | 20.69 | 27.45 |
| Chinese shallow marine sediments Zhao and E. (1993) (mg/kg) | 7.7 | 0.025 | 15 | 65 | 0.065 | 20 | 61 |
| Sediment Type I/II/III Quality Standards (GB 18668-2002, 2002) (mg/kg) | 20/65/93 | 0.2/0.5/1 | 35/100/200 | 150/350/600 | 0.5/1.5/5 | 60/130/250 | 80/150/270 |
| SQGs (MacDonald et al., 2000) TEC/PEC |
9.79 /33.00 |
0.18 /1.06 |
31.60 /149.00 |
121.00 /459.00 |
0.99 /4.58 |
35.50 /128.00 |
43.40 /111.00 |
Distribution parameters and background values of trace metal content in sediments of the study area.
Compared to Chinese shallow sea sediments, the average concentrations of Cu, Pb, Zn, and Cr were similar, although the coefficient of variation for Cu was higher, indicating its greater tendency to form localized pollution hotspots. In contrast, the mean concentrations of As, Hg, and Cd were significantly higher than national averages, and both Hg and Cd had high dispersion coefficients, suggesting a greater likelihood of forming large-scale pollution zones. As had a lower dispersion coefficient, indicating its potential for forming wide low-level contamination zones. Compared with the quality standard of Chinese marine sediment, the average value of each element in the study area meets the standard of marine sediment class I. There are eight sample points of As that meet the standard of class II; two sample points of Hg meet the standard of class II; one sample point of Cu meets the standard of class III and two sample points meet the standard of class II; one sample point of Zn meets the standard of class II; two sample points of Cd meet the standard of class II; two sample points of Pb meet the standard of class II; two sample points of Cr meet the standard of class III and three sample points meet the standard of class II. These results indicate that trace metal pollution in Wanning’s shallow marine sediments is generally low, although localized elevated levels of As, Cu, and Cr require attention.
Compared with U.S. Sediment Quality Guidelines, mean concentrations of Hg, Cu, Zn, Cd, and Pb were all below the Threshold Effect Concentration (TEC), while As and Cr were slightly above TEC but below the Probable Effect Concentration (PEC). Maximum concentrations of As, Cu, and Cr exceeded the PEC, whereas maximum values for Hg, Zn, and Pb were between TEC and PEC. Cd levels remained below TEC throughout. The distribution of sample exceedances was as follows: As: 2 samples > PEC (3.5%) and 19 samples between TEC and PEC (33.3%); Cu: 1 sample > PEC (1.8%) and 3 samples between TEC and PEC (5.3%); Cr: 3 samples > PEC (5.3%) and 27 samples between TEC and PEC (47.3%); Hg: 3 samples between TEC and PEC (5.3%); Zn: 4 samples between TEC and PEC (7.0%); and Pb: 6 samples between TEC and PEC (10.5%).
Overall, the ecological risks from trace metals in the study area appear minimal, with only isolated sites for As, Cu, and Cr potentially posing adverse ecological effects.
3.3 Characteristics of the spatial distribution of trace metal content
Inverse Distance Weighting (IDW) was used to characterize the spatial distribution of seven trace metals in the study area (Figure 6). The results indicated that high concentrations of As were primarily distributed in the southern part of Shan’gen Town and the northern nearshore areas of Lingshui. Hg exhibited elevated concentrations mainly within the Grandpa Sea Lagoon, with a few high-value points also observed in the coastal waters near Hele Town. Cu showed only a single high-value point located in the shallow coastal area of northern Lingshui. High-value zones of Cd and Zn largely overlapped, appearing both in the Grandpa Sea Lagoon and in nearby coastal waters. Pb showed a single high-value point near the estuary of the Small Sea Lagoon, while Cr concentrations were higher near the estuaries of both the Grandpa Sea Lagoon and the Sun River.
Figure 6
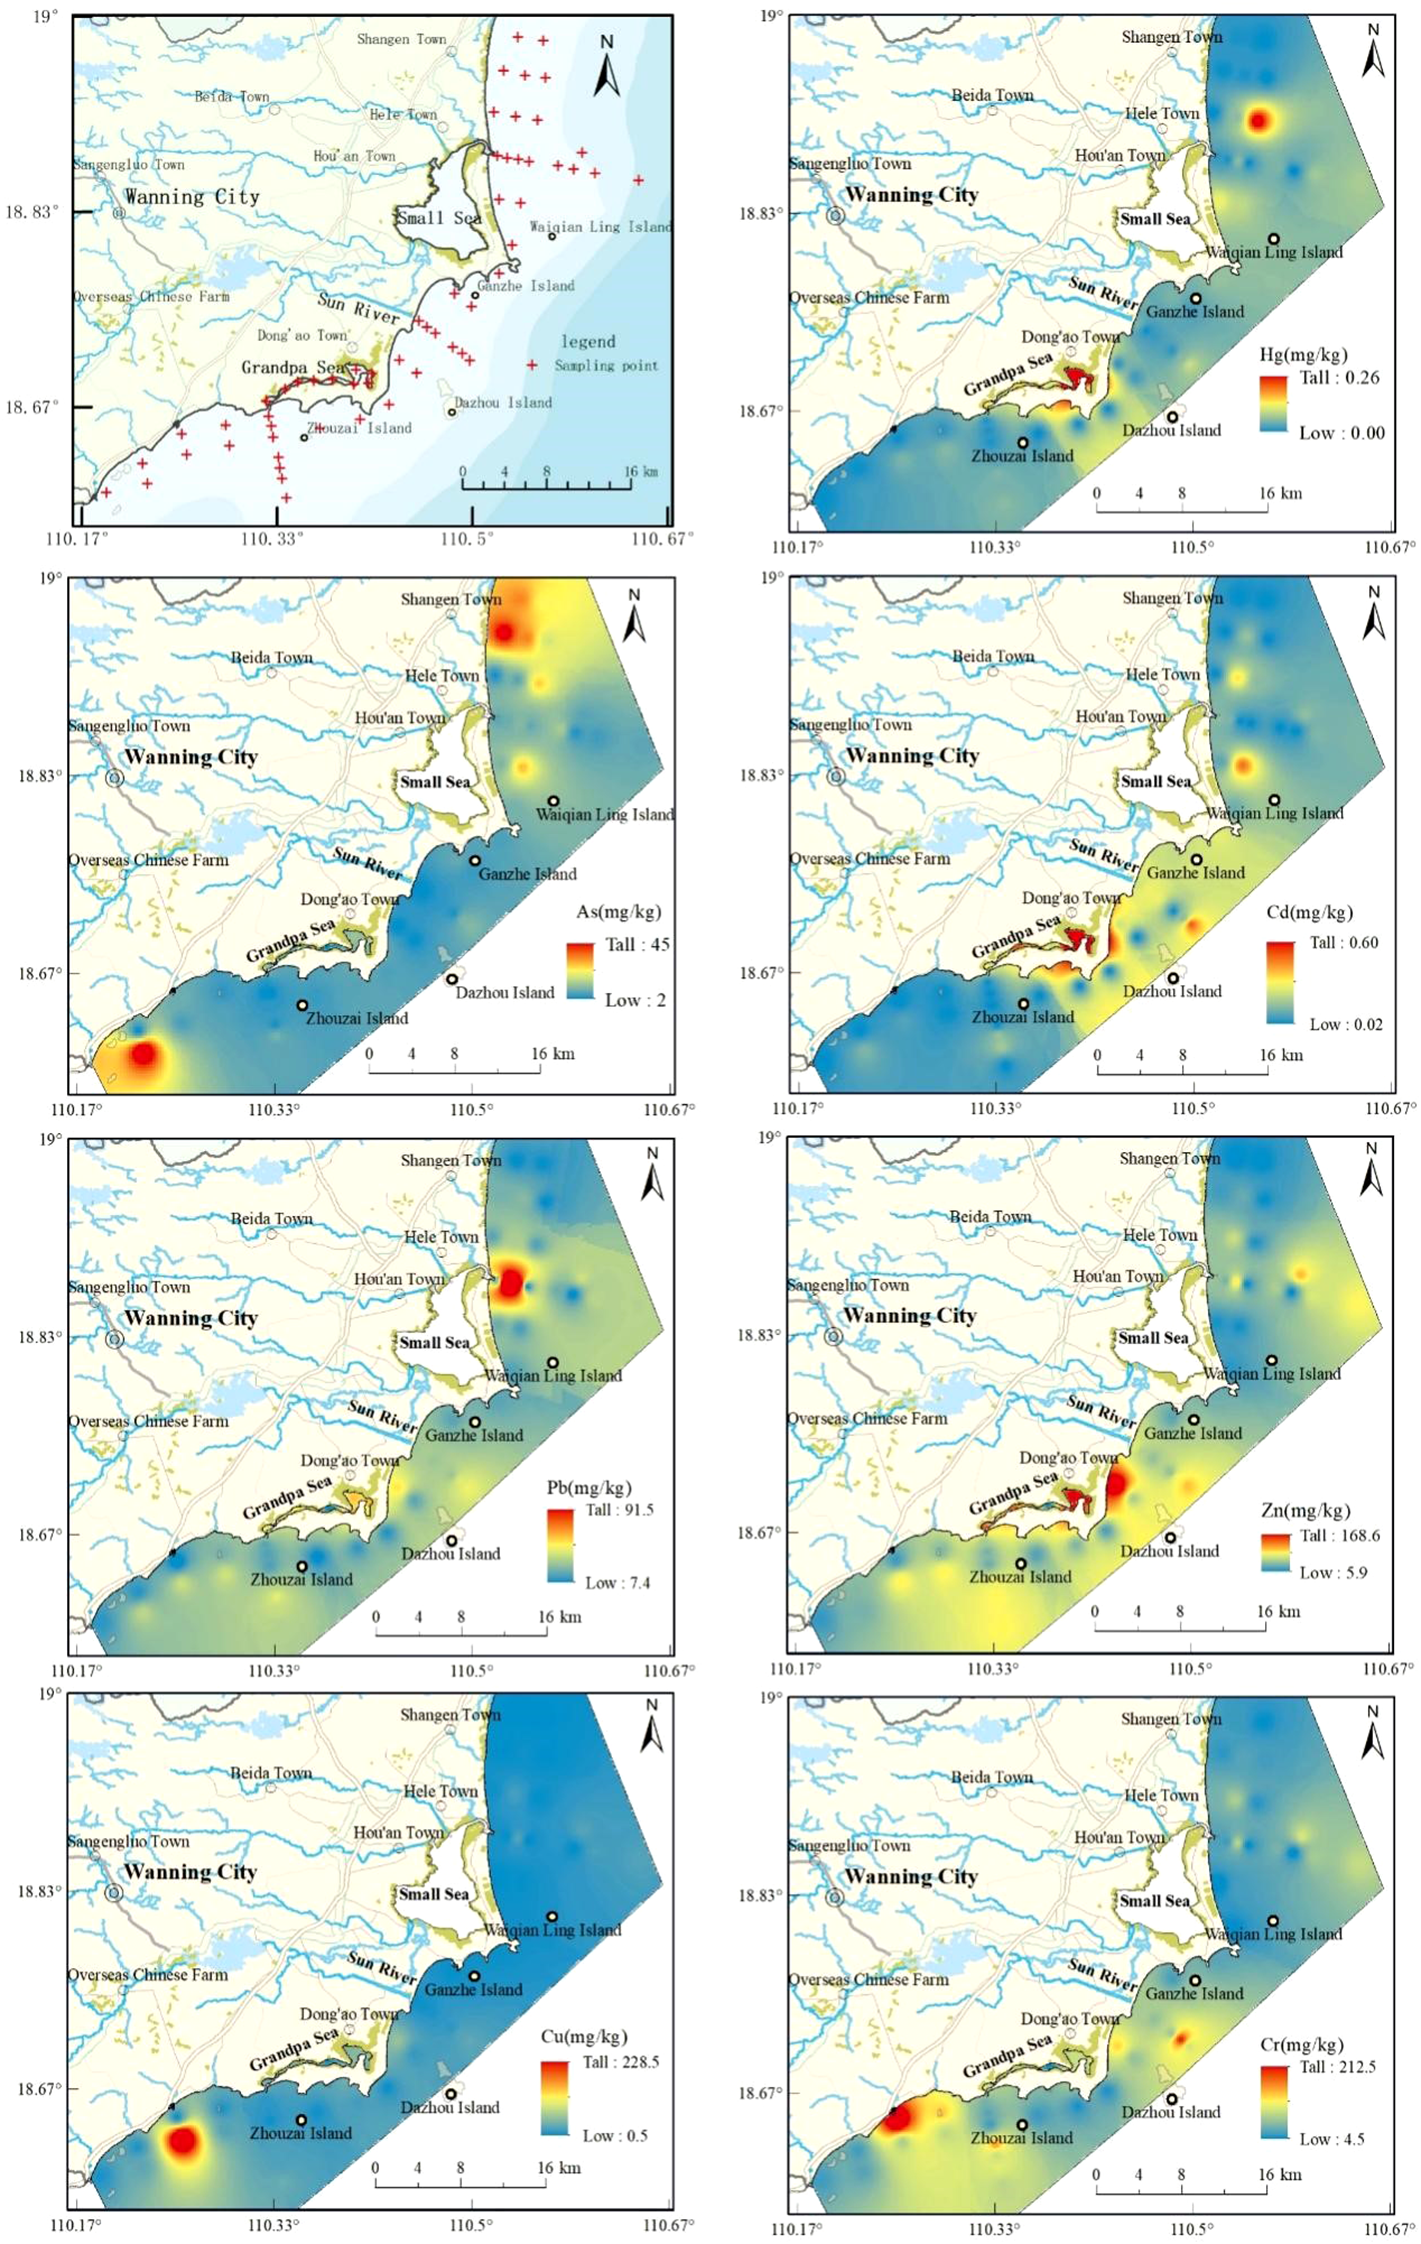
Spatial distribution of trace metal elements.
3.4 Evaluation of trace metal pollution
To further determine the pollution levels of the seven trace metals in the sediments, both the single-factor pollution index and the Nemero multifactor pollution index were calculated.
The results of the single-factor pollution index showed that values ranged from 0.2 to 5.99 for As (mean: 1.48), 0.02 to 10.52 for Hg (mean: 1.48), 0.03 to 15.27 for Cu (mean: 0.89), 0.08 to 2.60 for Zn (mean: 0.80), 0.36 to 4.68 for Pb (mean: 1.23), 0.36 to 9.25 for Cd (mean: 1.54), and 0.07 to 3.49 for Cr (mean: 0.75). Average indices above 1 but below 2 for Cd, Hg, As, and Pb suggest slight pollution, while Cu, Zn, and Cr had mean values below 1, indicating generally clean conditions. However, maximum index values for As, Hg, Cu, Pb, Cd, and Cr exceeded 3, indicating moderate to severe pollution at certain locations. The proportion of such sites was 14.1% for Cd, 14.0% for Hg, 12.3% for As, and 3.3% for Pb (Figure 7). Zn’s maximum index was between 2 and 3, indicating only light pollution, with no sample showing moderate or severe pollution. Overall, relative to Chinese shallow marine sediments, Cd, Hg, As, and Pb exhibit slight pollution with localized moderate-to-severe contamination, while Cu and Cr are mostly clean but show some local moderate-to-severe pollution, and Zn is lightly polluted throughout. Compared to China’s Class I Marine Sediment Quality Standards and U.S. TEC guidelines, the overall pollution level remains low, particularly because background concentrations in Chinese shallow marine sediments are generally lower—especially for Hg and Cd.
Figure 7
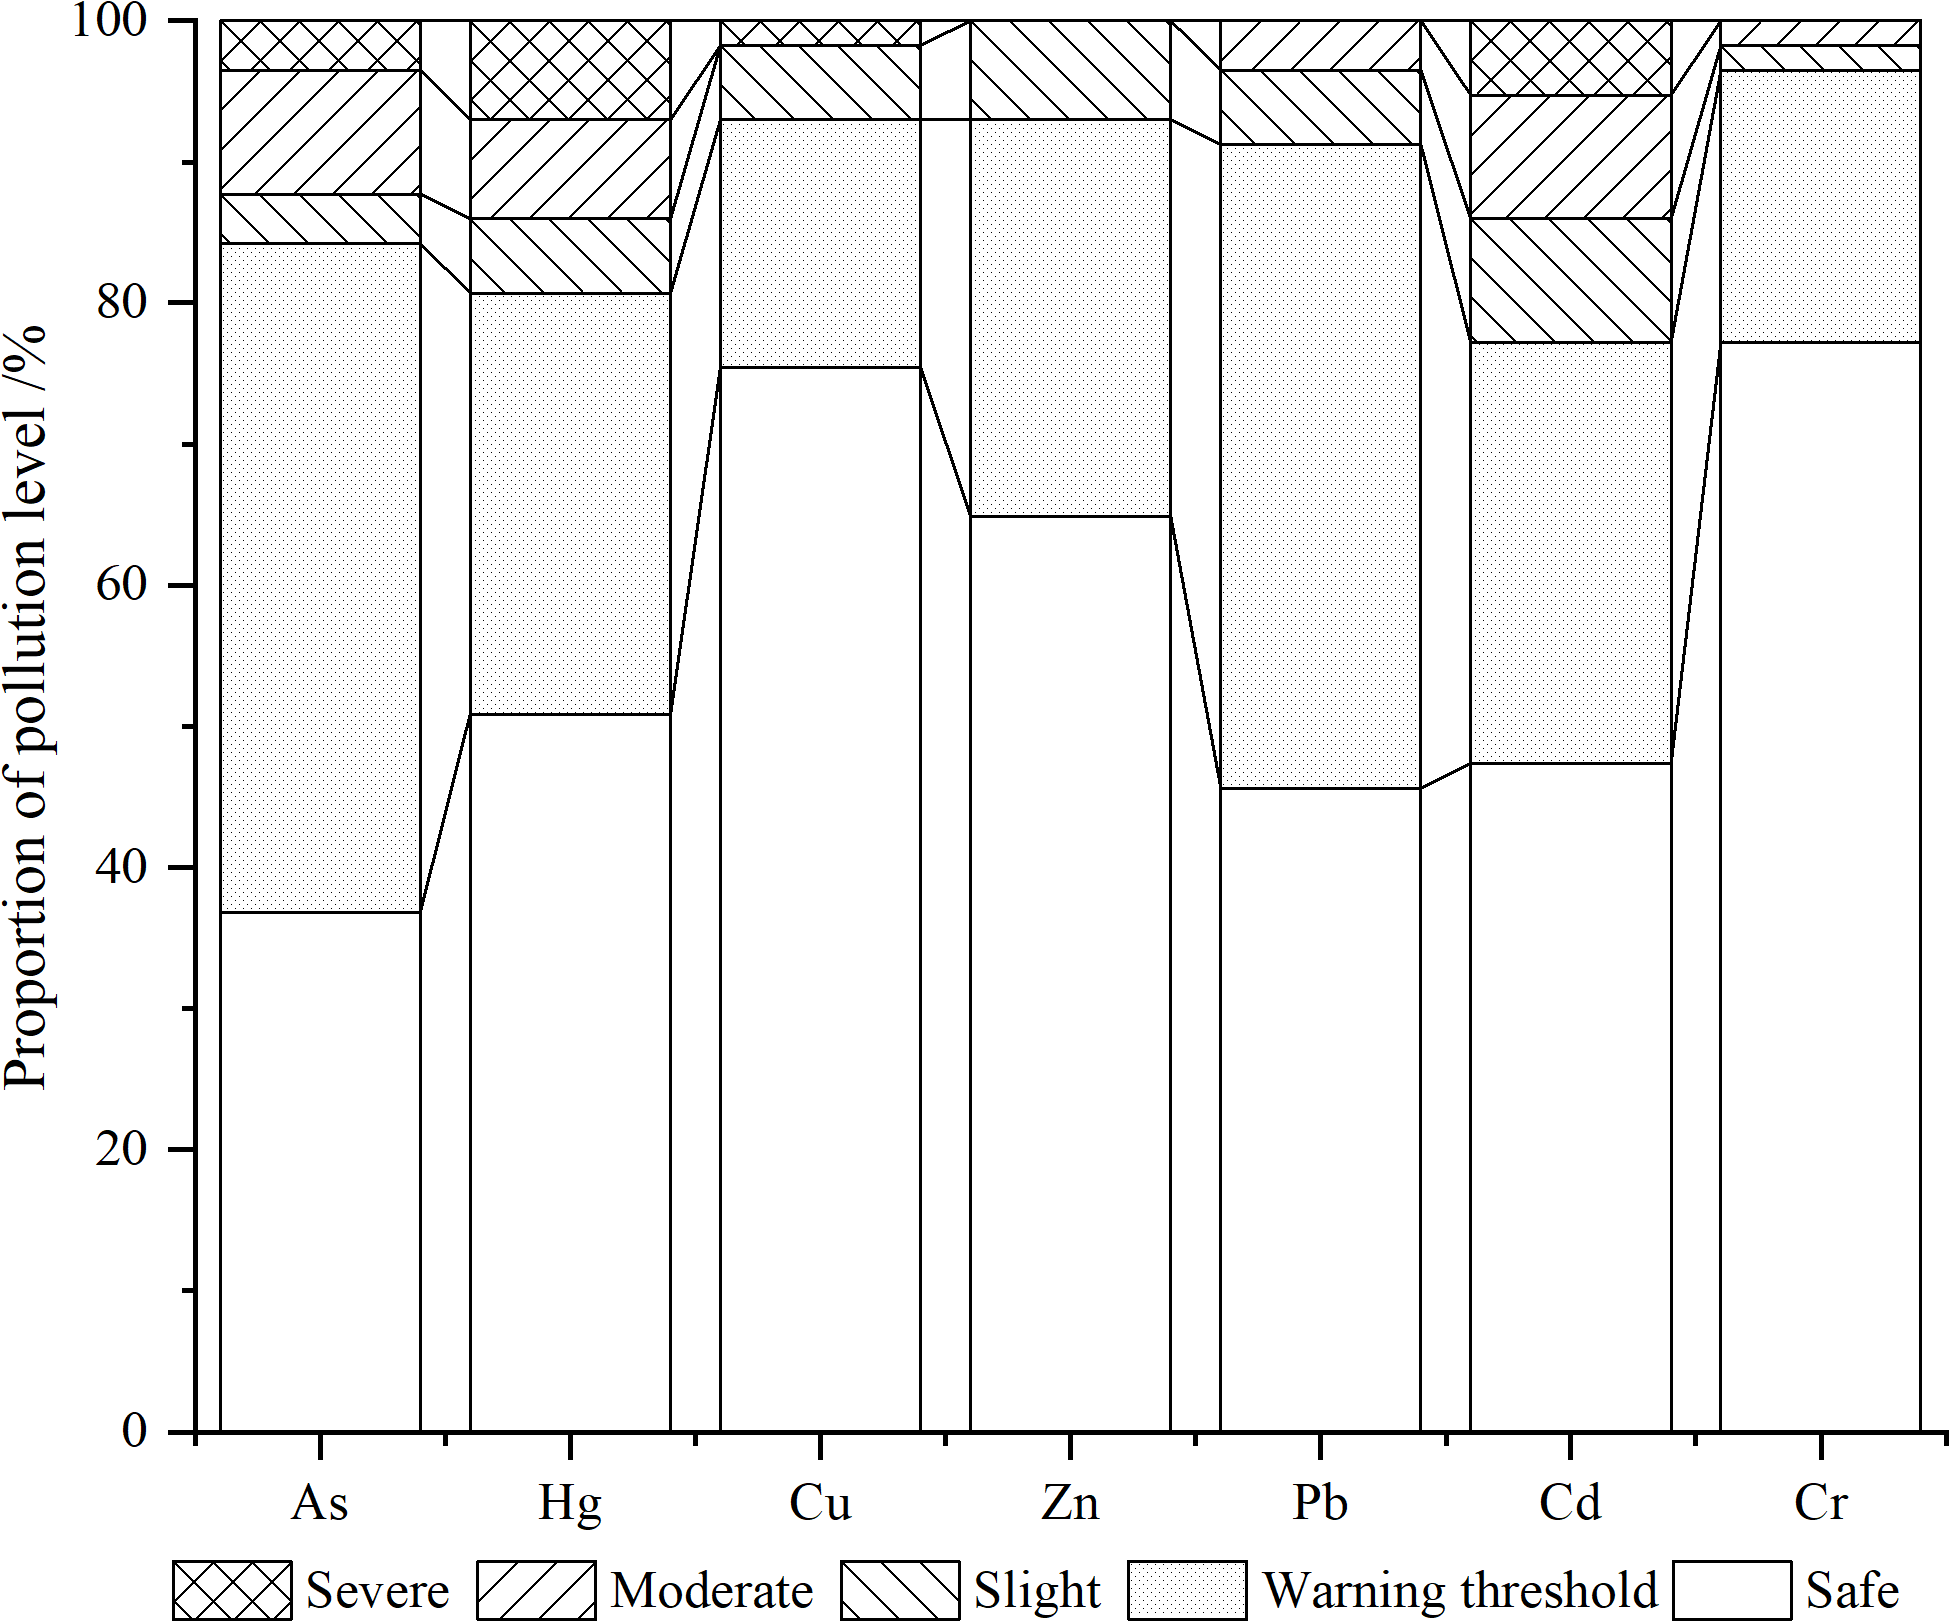
Stacked histogram of single factor pollution index in the study area.
The Nemero multifactor pollution index values followed the order: Cu (10.81) > Hg (7.51) > Cd (6.63) > Pb (3.42) > Cr (2.53) > Zn (1.92). Elements As, Hg, Cu, Pb, and Cd had index values exceeding 3, indicating heavy pollution compared to Chinese shallow marine sediments. Cr showed moderate pollution, and Zn showed light pollution. The average integrated pollution index across all sites was 2.25, with a minimum of 0.56 and a maximum of 11.01, indicating moderate overall pollution with some heavily polluted hotspots. These results are consistent with the statistical findings of trace metal concentrations in sediments.
The percentage contribution of each element to the overall pollution was as follows: Cu (29.1%) > Hg (20.2%) > Cd (17.8%) > As (11.7%) > Pb (9.2%) > Cr (6.8%) > Zn (5.2%).
This shows that Cu, Hg, Cd, and As are the dominant contributors, accounting for a combined 78.8% of the total pollution. Pb, Cr, and Zn contributed only 21.2%, suggesting relatively weak pollution from these elements.
In conclusion, based on the single-factor index, Nemero index, and pollution percentage, Cu, Hg, Cd, and As are the main contributors in the study area. Nevertheless, the overall pollution level remains low when benchmarked against Chinese and U.S. sediment quality standards. This is because the background levels used (average concentrations of Chinese shallow marine sediments) are much lower than these standards.
For instance, the average As concentration in Chinese shallow marine sediment is 0.39 of China’s Class I standard and 0.79 of U.S. TEC; Hg is 0.13 (China) and 0.14 (U.S.A.); Cu is 0.43 (China) and 0.47 (U.S.A.); Zn is 0.43 (China) and 0.54 (U.S.A.); Cd is 0.13 (China) and 0.07 (U.S.A.); Pb is 0.33 (China) and 0.56 (U.S.A.); Cr is 0.76 (China) and 1.41 (U.S.A.). Therefore, Cu, As, Pb, and Cr are of greater concern when assessed against national sediment standards.
3.5 Analysis of trace metal sources
3.5.1 Correlation analysis
Pearson correlation analysis is effective in revealing the relationships among trace metal elements and provides insights into their potential sources (Huang et al., 2022a, Huang et al., 2022b). A significant positive correlation between elements indicates similar sources and geochemical behaviors (e.g., enrichment and transport), whereas negative correlations suggest different origins (Chai et al., 2021). As shown in Figure 5, the correlations between As and Hg or Cd are weak, and there is a significant negative correlation between As and Cu, Zn, Pb, and Cr, indicating that As originates from sources different from those of the other elements in the study area. Highly significant positive correlations (p ≤ 0.001) are observed among Hg, Zn, and Cd, with the correlation coefficient between Hg and Cd reaching 0.85, suggesting similar sources and geochemical behavior between these two elements, but different from other metals. Cd shows a significant positive correlation with Zn and Hg, but its correlation with Cu, Pb, Cr, and As is weak, indicating that Cd likely originates from different sources than those elements. Cu, Pb, Zn, and Cr exhibit significant positive correlations (p ≤ 0.001), with correlation coefficients around 0.5, suggesting similar sources, consistent with findings from intertidal sediments in Sanya Entertainment Island (Meng et al., 2025). Zn is significantly correlated with Cr, Pb, Cu, Cd, and Hg, indicating a wide range of sources and multi-origin characteristics for Zn in the study area.
3.5.2 Source analysis of trace metals in sediments based on PMF modeling
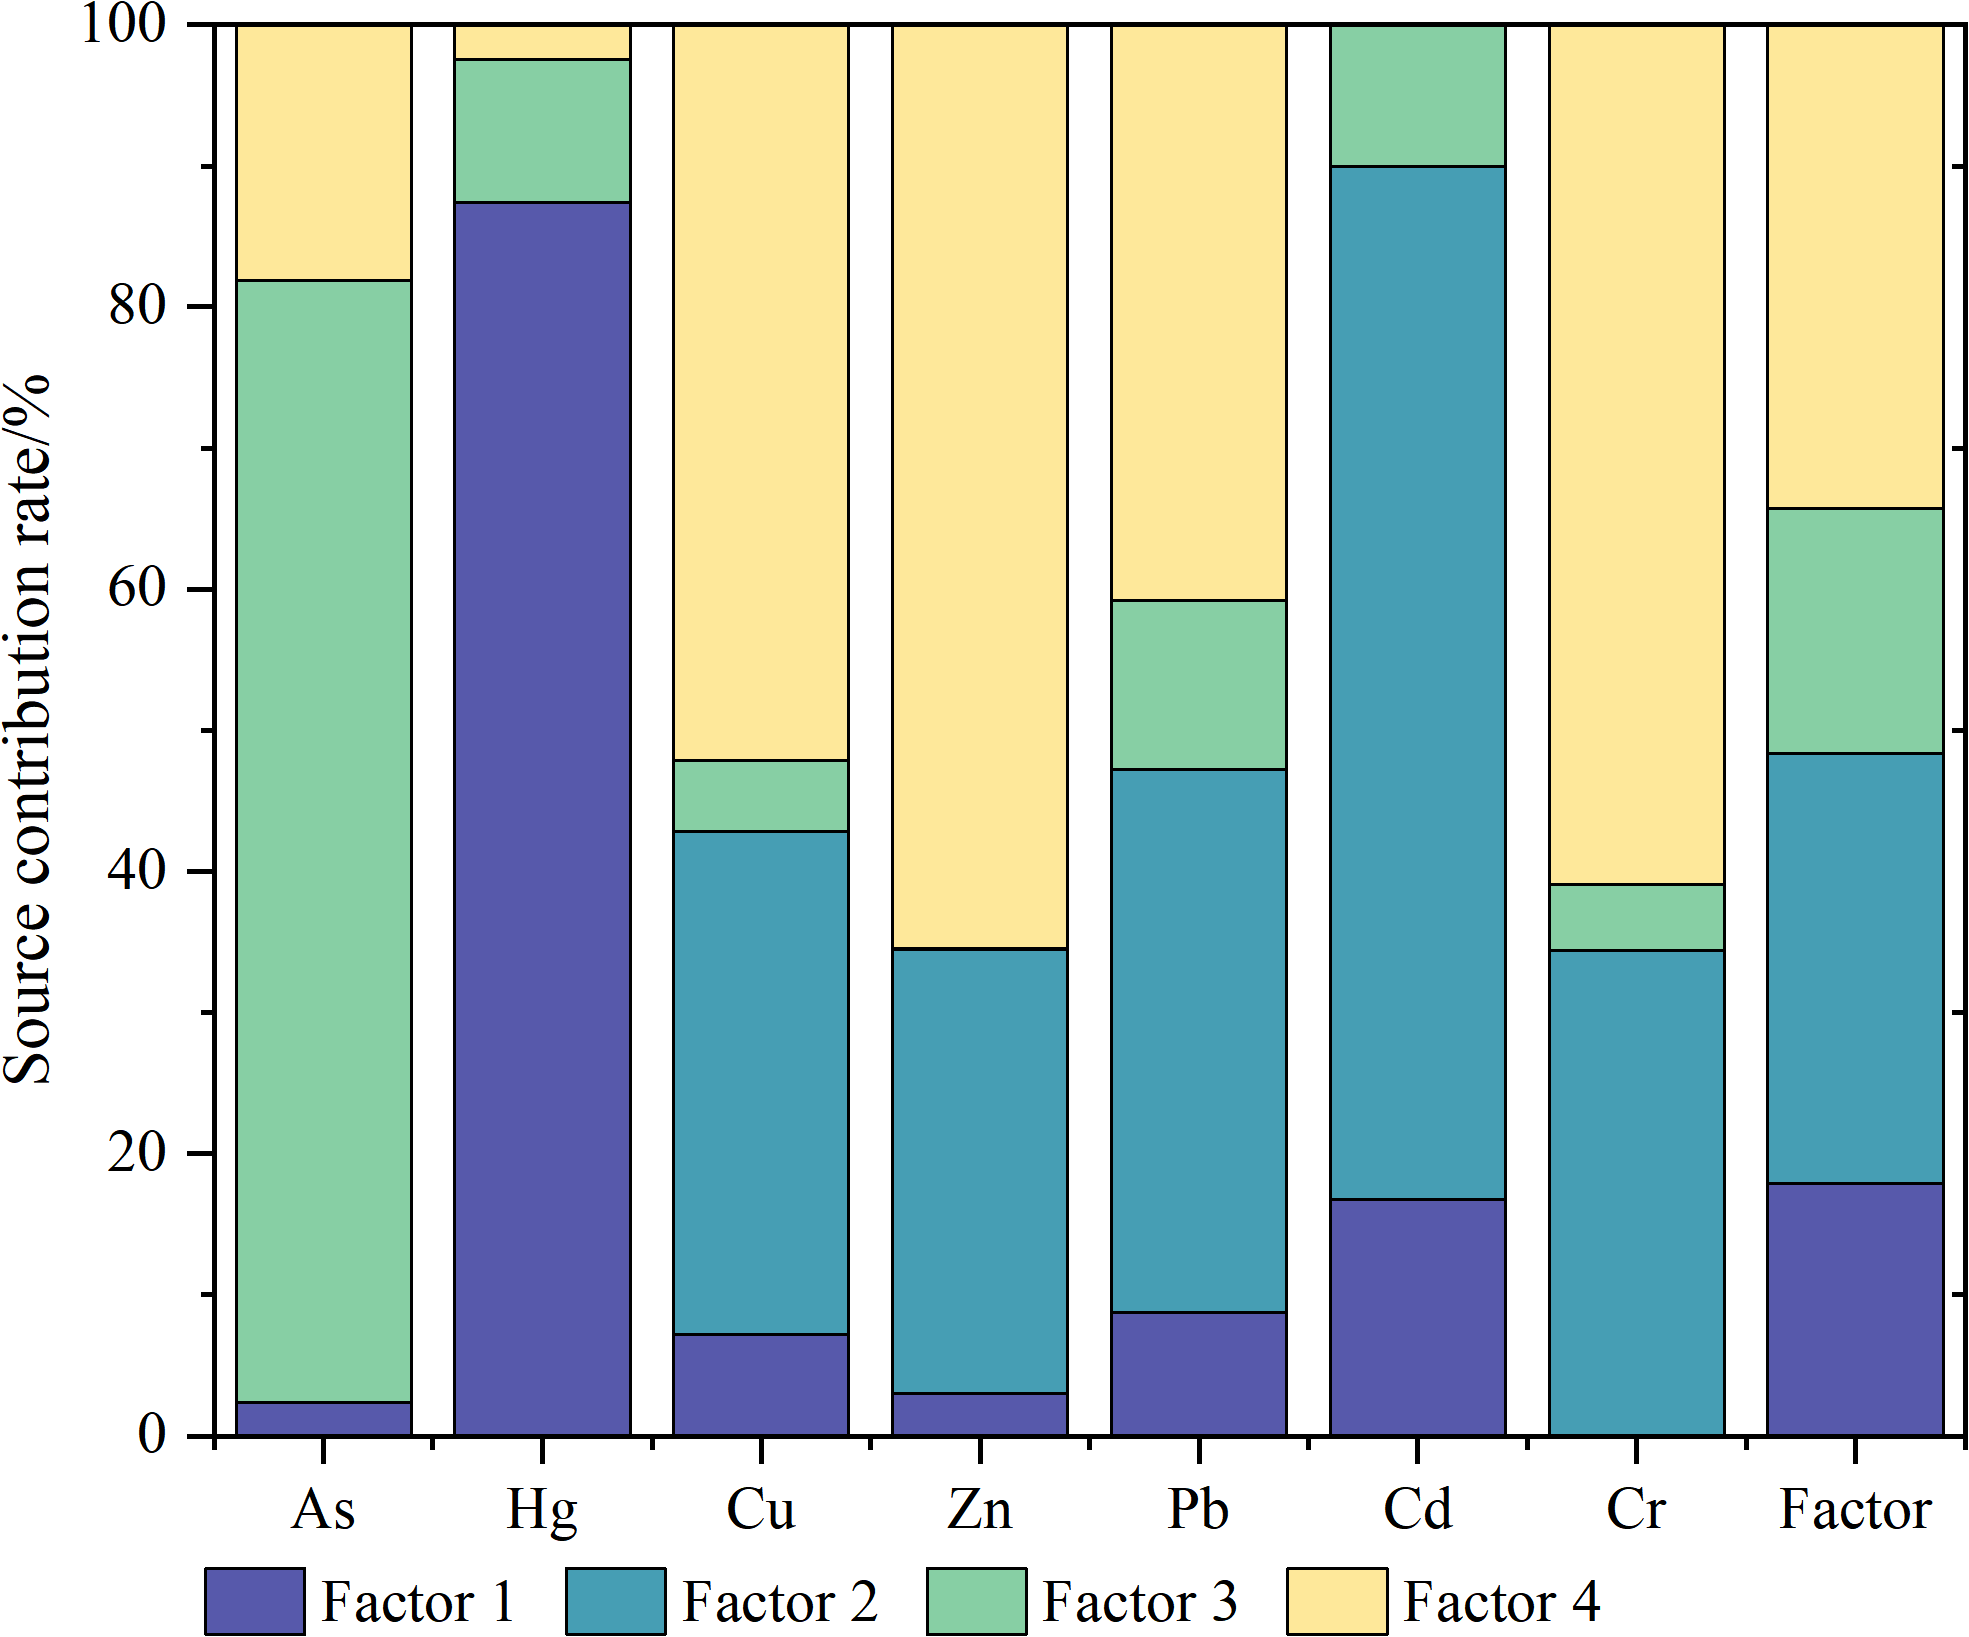
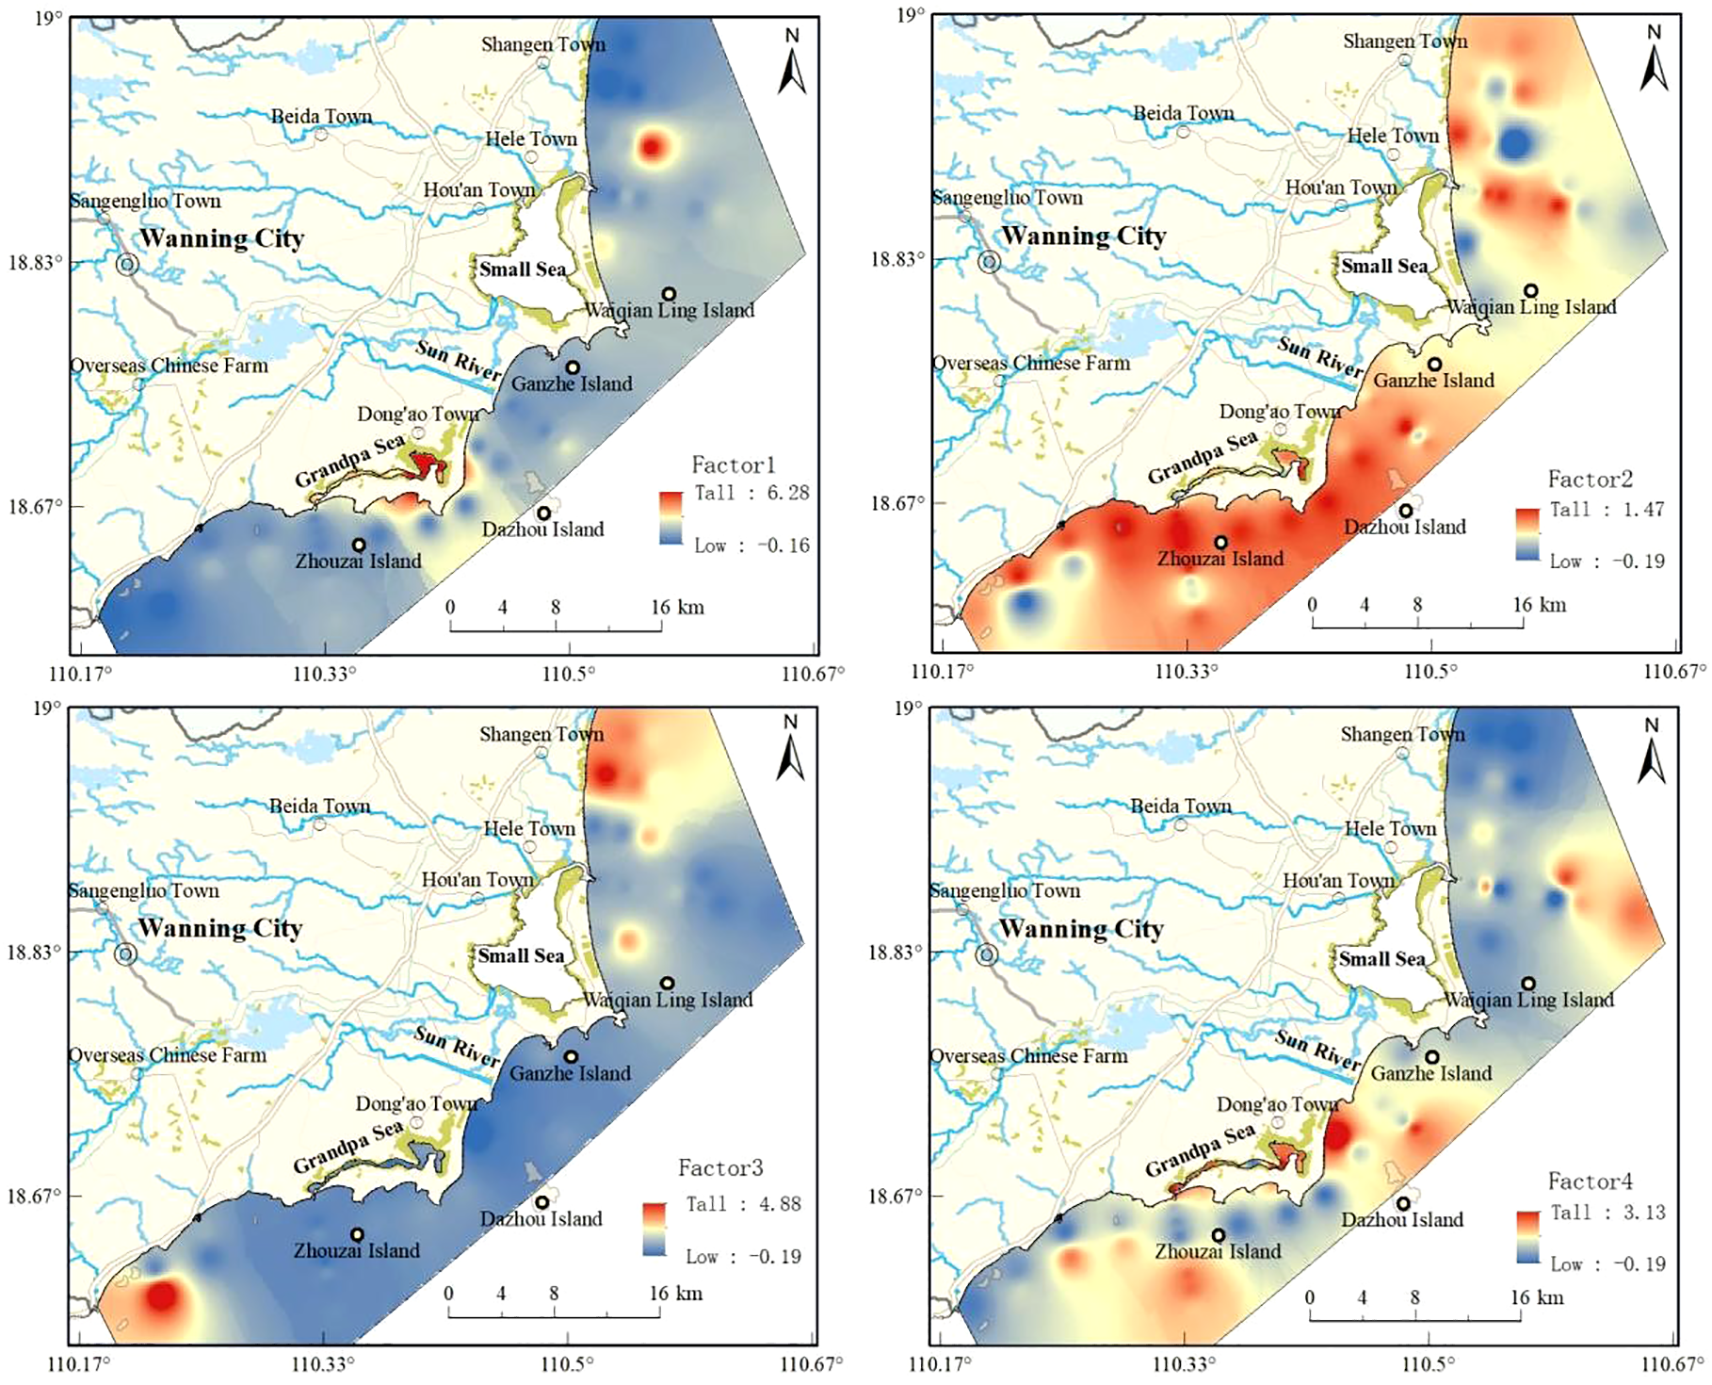
The PMF model was employed to identify the potential sources of seven trace metals in the shallow coastal surface sediments of the study area. The model was run 25 times, and four factors were extracted based on the lowest and most stable Q values obtained during the iterations. All signal-to-noise ratios (S/N) exceeded 4, and the fitting coefficients (R²) for Cu, Cr, and Pb were relatively low, likely due to the presence of several outliers. In contrast, the fitting coefficients (R²) for As, Hg, Zn, and Cd all exceeded 0.9 (Table 4), indicating that the PMF model produced reliable results. The presence of outliers, such as the maximum Cu value being 572 times higher than the minimum, reflects localized severe pollution, which negatively affected the model’s overall fit. These outliers were retained in the analysis to preserve data integrity. The source contributions of the seven trace metals are shown in Figures 8 and 9. In addition, to further clarify the sources represented by each PMF factor, the spatial distribution of factor contributions was visualized using kriging interpolation (Figure 10), and the potential pollution sources were inferred based on local industrial, agricultural, and transportation activities.
Table 4
| Metal | Intercept | Slope | SE | R 2 |
|---|---|---|---|---|
| As | 0.02 | 0.98 | 0.04 | 1.00 |
| Hg | 0.00 | 0.99 | 0.00 | 1.00 |
| Cu | 0.79 | 0.04 | 0.36 | 0.13 |
| Zn | 0.98 | 0.80 | 0.84 | 0.94 |
| Pb | 1.83 | 0.39 | 0.92 | 0.29 |
| Cd | 0.00 | 0.91 | 0.00 | 0.99 |
| Cr | 2.98 | 0.36 | 1.94 | 0.32 |
Fitting results for measurements using the predicted values of the PMF model.
Figure 8
Contribution of PMF-modeled source factors to sediment trace metals.
Figure 9
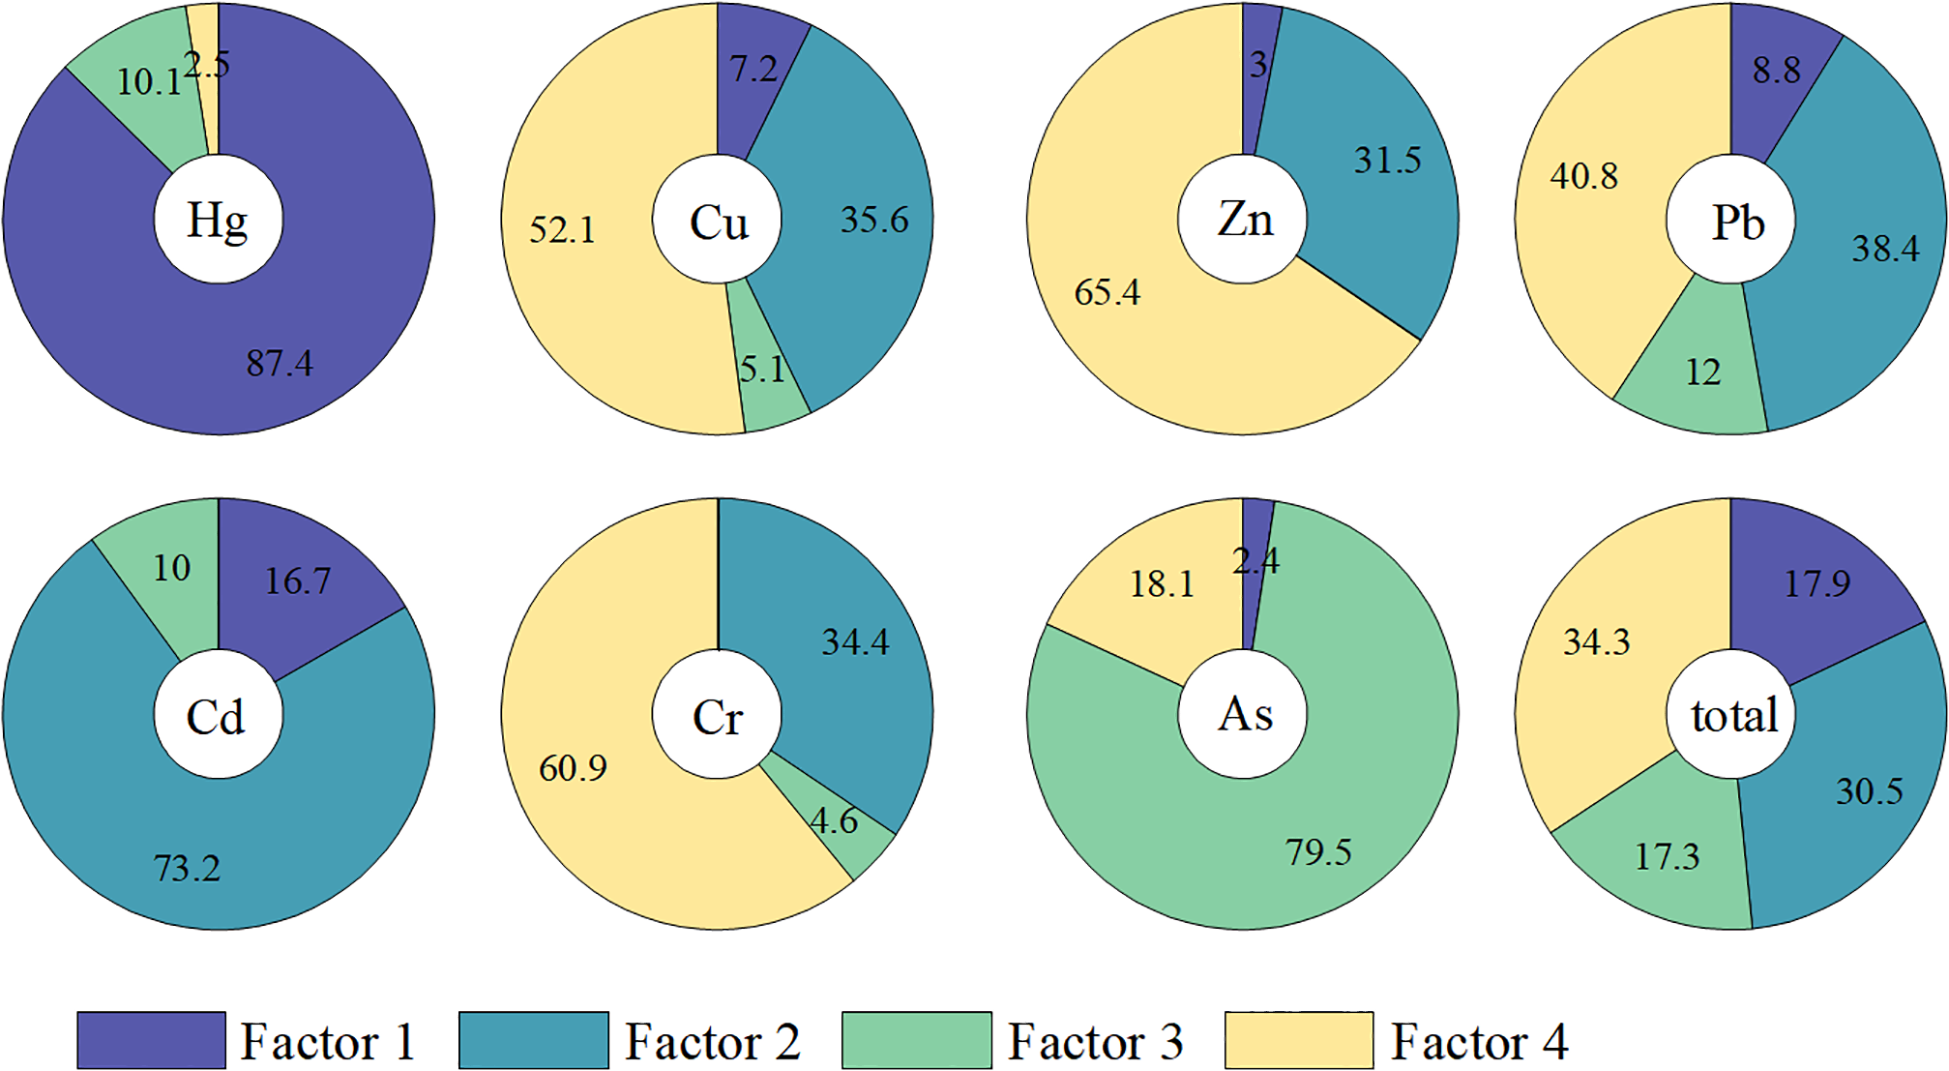
The contribution percentage of PMF factors for each metal.
Figure 10
PMF factor profiles of sediment trace metal based on spatial distribution.
Factor 1 is primarily characterized by high loadings of Hg, Cd, Pb, Cu, Zn, and As, with Hg being the dominant contributor at 87.4%. The average concentration of Hg in the study area exceeds the background levels of Chinese shallow marine sediments. The high dispersion coefficient and elevated maximum values suggest that Hg accumulation in the study area is closely associated with anthropogenic activities, resulting in significant local enrichment. The spatial distribution of elevated Hg concentrations aligns well with the loading pattern of Factor 1. Generally, fossil fuel combustion, industrial emissions, and wastewater discharge are the main sources of Hg (Chai et al., 2021; Wang et al., 2022c). The discharge of wastewater, atmospheric deposition of Hg-containing particulates, and surface runoff all contribute to Hg enrichment in sediments (Li et al., 2022; Rydberg et al., 2008; Fei et al., 2022; Ren et al., 2021; Sun et al., 2019; Zhang et al., 2021). Hg is also among the most commonly detected toxic trace metals in mariculture sediments (Wang et al., 2021). Mercury-containing fish medications, including calomel, mercurous nitrate, mercury acetate, and mercury pyridine acetate, as well as the use of fertilizers, also contribute to Hg pollution (Madrid et al., 2002). In the study area, Factor 1 is predominantly distributed in the lagoon of the Grandpa Sea and the nearshore waters of the Small Sea lagoon—key mariculture zones in Wanning City. This pattern is consistent with observations in the Sandu Bay aquaculture area along the northeastern coast of Fujian Province (Li, 2008). Mercury-containing fish medications, widely used in aquaculture before their ban in 2002, can persist in aquatic environments for extended periods and gradually accumulate in sediments. Thus, Factor 1 likely originates from the historical extensive use of mercury-based fish medications in aquaculture. Given mercury’s high toxicity—capable of causing autoimmune disorders, as well as lung and kidney failure—a strict ban on mercury-containing fish medications is essential to safeguard aquatic food safety.
Factor 2 is mainly characterized by Cd, Cr, Pb, Zn, and Cu, with Cd being the dominant contributor at 73.24%. The median concentration of Cd in the study area is similar to that of Chinese shallow sea sediments, while the mean value is slightly higher. The high dispersion and a maximum value 10 times greater than the national background indicate localized severe Cd pollution. This suggests that severe Cd pollution is confined to a small area, likely caused by anthropogenic activities. The spatial distribution of anomalously high Cd, Cr, and Pb concentrations corresponds well with Factor 2. Previous studies have identified Cd as a key indicator of agricultural activities (Chen et al., 2022a; Wang et al., 2022a; Wei et al., 2022). Cd is abundant not only in inorganic fertilizers like phosphate fertilizers, but also in feed additives frequently used in aquaculture (Zi et al., 2021). China’s mariculture industry has long relied on high-density, high-input practices. With a typical feed conversion rate of only 59%, approximately 40% of the feed remains and settles into the sediments (Huang et al., 2005). Consequently, sources such as aquaculture feed, agricultural fertilizers, wastewater discharge, atmospheric emissions, and materials from ship corrosion and paint peeling can all contribute to Cd accumulation (Jia et al., 2020; Feng et al., 2021; Chen et al., 2022b; Sapkota et al., 2008; Zhang et al., 2012; Dean et al., 2007; Yi et al., 2011). Factor 2 is widely distributed throughout the study area, particularly in the expansive shallow coastal zone between the estuaries of the Grandpa Sea Lagoon and the Sun River. This region falls primarily under the jurisdiction of Dong’ao Town, which, in recent years, has actively developed mariculture and livestock farming. Efforts have been made to establish the “Dong’ao Goose” industrial brand, resulting in a high concentration of aquaculture and livestock farms. The Cd enrichment in Factor 2 is therefore likely due to the extensive use of feed and its long-term accumulation. The Sun River serves as the primary outlet for municipal wastewater in Wanning City, with numerous sewage treatment facilities along its basin. Thus, the mild but persistent Cd anomaly near its estuary is likely caused by urban sewage discharge. Therefore, Factor 2 likely originates from a combination of urban sewage and feed inputs from aquaculture operations. Given the long-term accumulation potential of trace metals, enhanced monitoring of Cd pollution is warranted. Rational and efficient feeding practices should be adopted, along with the implementation of stricter wastewater treatment measures.
Factor 3 is characterized by loadings of As, Hg, Cd, Pb, Cu, and Cr, with arsenic (As) being the dominant element, contributing 79.5%. Both the mean and median concentrations of As in the study area exceed those found in Chinese shallow marine sediments. The low dispersion coefficient indicates the widespread presence of low-level As pollution across the study area, likely influenced by anthropogenic activities. The spatial distribution of elevated As concentrations closely aligns with that of Factor 3. Previous studies have shown that As is commonly found in high concentrations in fertilizers and pesticides (Fan, 2018; Liu et al., 2020). Additionally, compounds such as calcium arsenate and sodium arsenate are often used in herbicides and pesticides (Huang et al., 2022a, Huang et al., 2022b). Therefore, prolonged and intensive use of fertilizers, herbicides, and pesticides can lead to As accumulation and subsequent soil contamination. Arsenic from contaminated soils may be transported to nearshore marine environments via surface runoff and subsurface flow, resulting in As pollution in shallow marine sediments. In the study area, Factor 3 is predominantly distributed in the northern marine zone east of Shan’gen Town. Shan’gen Town is well known for its advanced tropical agriculture, producing fruits such as pineapple, lychee, and longan. Notably, it hosts the largest winter pineapple production base in the country. Therefore, Factor 3 likely originates from the application of pesticides and herbicides in agricultural practices. Considering the high toxicity and carcinogenicity of As, careful and scientifically guided use of pesticides and herbicides is essential.
Factor 4 is primarily characterized by loadings of Cr, Zn, Cu, Pb, As, and Hg, with Cr, Zn, and Cu contributing the most. The individual contributions of Cr, Zn, Cu, and Pb were 60.94%, 65.43%, 52.08%, and 40.78%, respectively. The spatial distribution of high-value zones for Zn, Cu, and Cr closely matches that of Factor 4. The mean concentrations of Cr, Zn, Pb, and Cu are comparable to those in Chinese shallow marine sediments, with dispersion coefficients below 1 (except for Cu). However, the maximum values are four to five times higher than the means, indicating localized pollution. This suggests that these elements are generally less influenced by human activities, although localized hotspots of contamination are present due to anthropogenic sources. Some studies have shown that the main sources of Pb are automobile exhaust (Yang et al., 2020), wear of metal alloys in engines (Harrison et al., 2003), tire wear (Xiao et al., 2021), and lead–zinc mine production activities (Chen et al., 2022c). In addition, leaded gasoline (Krishnakumar et al., 2020; Chandrasekaran et al., 2020) and ship mooring or excessive tourist activities (Wang et al., 2020a) can cause Pb pollution. Cr pollution comes from a wide range of sources, mainly ore mining, steel mill waste, coal combustion slag dumping, port and harbor terminals, industrial effluents (Krishnakumar et al., 2020; Wang et al., 2017; Gutiérrez-Mosquera et al., 2018; Nagarajan et al., 2013; Suresh et al., 2015; Bramha et al., 2014; Vetrimurugan et al., 2017; Peter et al., 2017), and many other sources, which may be related to the fact that most of the industrially produced materials mostly contain Cr elements. Cu is widely used in electric power, electronics, energy, petrochemical, machinery, metallurgy, transportation and emerging industries, and other fields (Li and Zhang, 2010; Wang et al., 2017; Fu et al., 2014; Chen et al., 2022d; Huang et al., 2007). Zn is more widely used and occupies an important position in the national economy. Zinc is widely used in the manufacture of castings, printing and dyeing industry, pharmaceutical industry, and rubber industry, including automotive products, daily-use hardware, paint, paper, car tires, ceramics, toys, flame retardants, anticorrosives, anti-inflammatory agents, anti-rust treatment agents, bleach, pesticides, oil, fungicides, compound nitrogen fertilizers (Zhou et al., 2019), and other areas of production and life, and its sources are more extensive. Factor 4 is predominantly distributed in the eastern section of the Grandpa Sea lagoon, including the Houhai and Wuchang harbor areas. This region hosts numerous ports and wharves and serves as a major hub for maritime traffic, such as the Wuchang First-Class Fishing Harbor in Wanning. Thus, Factor 4 is likely associated with waste generated from marine transportation activities. These findings underscore the need for improved waste management practices in marine transportation.
4 Conclusion
The average concentrations of As, Hg, Cu, Zn, Cd, Pb, and Cr in surface sediments of the study area comply with China’s Class I Marine Sediment Quality Standard, indicating an overall low level of contamination. However, localized areas of elevated As, Cu, Cr, and Pb concentrations suggest the presence of point-source or small-scale surface pollution that requires further attention.
The dominant sources of trace metal pollution in the study area were identified as follows: use of mercury-based fish medicine in aquaculture (Factor 1, 17.9%), feed input and municipal sewage discharge (Factor 2, 30.5%), pesticide application (Factor 3, 17.3%), and ship-related marine transportation activities (Factor 4, 34.3%). To mitigate trace metal accumulation in marine sediments, stricter regulations should be implemented, including banning mercury-based fish medicines, optimizing pesticide usage, controlling ship waste discharges and municipal effluents, and promoting efficient feeding practices.
Statements
Data availability statement
The raw data supporting the conclusions of this article will be made available by the authors, without undue reservation.
Author contributions
SW: Conceptualization, Methodology, Validation, Writing – original draft, Writing – review & editing. XW: Resources, Writing – original draft, Funding acquisition. ZW: Writing – original draft, Investigation. GG: Writing – original draft, Conceptualization, Formal Analysis, Methodology, Software, Supervision, Validation, Visualization, Writing – review & editing. LC: Investigation, Writing – original draft. ZH: Data curation, Investigation, Writing – original draft, Project administration, Resources. DF: Investigation, Writing – original draft. PL: Investigation, Writing – original draft, Data curation. XY: Investigation, Writing – original draft.
Funding
The author(s) declare that financial support was received for the research and/or publication of this article. This research was funded by the Science and Technology Innovation Foundation of the Survey Center of Comprehensive Natural Resources (KC20240019) and the Geological Survey Project of the China Geological Survey (DD20220993, DD20230413, and DD20240206317).
Acknowledgments
Thanks for the reviewers for their valuable feedback on the manuscript.
Conflict of interest
The authors declare that the research was conducted in the absence of any commercial or financial relationships that could be construed as a potential conflict of interest.
Generative AI statement
The author(s) declare that no Generative AI was used in the creation of this manuscript.
Correction note
This article has been corrected with minor changes. These changes do not impact the scientific content of the article.
Publisher’s note
All claims expressed in this article are solely those of the authors and do not necessarily represent those of their affiliated organizations, or those of the publisher, the editors and the reviewers. Any product that may be evaluated in this article, or claim that may be made by its manufacturer, is not guaranteed or endorsed by the publisher.
Supplementary material
The Supplementary Material for this article can be found online at: https://www.frontiersin.org/articles/10.3389/fmars.2025.1627805/full#supplementary-material
References
1
Bramha S. N. Mohanty A. K. Satpathy K. K. Padhi R. K. Sowmya M. (2014). Heavy metal content in the beach sediment with respect to contamination levels and sediment quality guidelines: A study at Kalpakkam coast, Southeast coast of India. Environ. Earth Sci.72, 4463–4472. doi: 10.1007/s12665-014-3346-y
2
Bu Q. Li Q. Zhang H. Cao H. Gong W. Zhang X. et al . (2020). Concentrations, spatial distributions and sources of heavy metals in surface soils of the coal mining city Wuhai, China. J. Chem.17 (2), 1–10. doi: 10.1155/2020/4705954
3
Cao L. L. Wang P. Tian H. T. He Y. S (2013). Distribution and ecological evaluation of heavy metals in multi-mediums of Dongzhai Harbor. Mar. Bulletin.32, 403–407. doi: 10.11840/j.issn.1001-6392.2013.04.007
4
Chai L. Wang Y. H. Wang X. Ma L. Cheng Z. X. Su L. M. et al . (2021). Pollution characteristics, spatial distributions, and source apportionment of heavy metals in cultivated soil in Lanzhou, China. Ecol. Indic.125, 107507. doi: 10.1016/j.ecolind.2021.107507
5
Chandrasekaran S. Pillai G. S. Venkatraman B. (2020). Spatial and heavy metal assessment in beach sands of the east coast of Tamil Nadu, India. Environ. Nanotechnology Monit. Management.14, 100324. doi: 10.1016/j.enmm.2020.100324
6
Chen H. N. Zhang C. H. Liu G. Q. Lao Q. B . (2022b). Evaluation on sediment pollution and potential ecological risks in Guangxi Beibu Gulf. Environ. Chem.41 (09), 2872–2879. doi: 10.7524/j.issn.0254-6108.2021051505
7
Chen H. Wu D. Wang Q. Fang L. Wang Y. Zhan C. et al . (2022d). The predominant sources of heavy metals in different types of fugitive dust determined by principal component analysis (PCA) and positive matrix factorization (PMF) modeling in Southeast Hubei: A typical mining and metallurgy area in central China. Int. J. Environ. Res. Public Health19, 13227. doi: 10.3390/ijerph192013227
8
Chen L. Zhou S. Wu S. Wang C. Li B. Li Y. et al . (2018). Combining emission inventory and isotope ratio analyses for quantitative source apportionment of heavy metals in agricultural soil. Chemosphere.204, 140–147. doi: 10.1016/j.chemosphere.2018.04.002
9
Chen M. Pan Y. X. Huang Y. X. Wang X. T. Zhang R. D . (2022a). Spatial distribution and sources of heavy metals in soil of a typical lead-zinc mining area, Yangshuo. Environ. Science.43, 4545–4555. doi: 10.13227/j.hjkx.202201127
10
Chen Y. Ning Y. Bi X. Liu J. Yang S. Liu Z. et al . (2022c). Pine needles as urban atmospheric pollution indicators: Heavy metal concentrations and Pb isotopic source identification. Chemosphere.296, 1134043. doi: 10.1016/j.chemosphere.2022.134043
11
Dean R. J. Shimmield T. M. Black K. D. (2007). Copper, zinc and cadmium in marine cage fish farm sediments: An extensive survey. Environ. Pollution.145, 84–95. doi: 10.1016/j.envpol.2006.03.050
12
Fan C. X. (2018). Specification for lake Sediment Survey (Beijing: Science Press).
13
Fei X. Lou Z. Xiao R. Ren Z. Lv X. (2020). Contamination assessment and source apportionment of heavy metals in agricultural soil through the synthesis of PMF and GeogDetector models. Total Environ.747, 141293. doi: 10.1016/j.scitotenv.2020.141293
14
Fei X. Lou Z. Xiao R. Ren Z. Lv X. (2022). Source analysis and source-oriented risk assessment of heavy metal pollution in agricultural soils of different cultivated land qualities. J. Cleaner Production.341, 130942. doi: 10.1016/j.jclepro.2022.130942
15
Feng X. B. Xiao K. Li H. L. Lin D. P . (2021). Distribution characteristics and pollution assessment of heavy metals in the surface sediments in the northern Hailing island sea areas, Guangdong province. Mar. Environ. Science.40, 507–514. doi: 10.13634/j.cnki.mes.2021.04.004
16
Fu K. An M. Song Y. (2023). Soil heavy metals in tropical coastal interface of Eastern Hainan Island, China: Distribution, sources, and ecological risks. Environ. Pollution.300, 119001. doi: 10.1016/j.ecolind.2023.110659
17
Fu J. Zhao C. Luo Y. Liu C. Kyzas G. Z. Luo Y. et al . (2014). Heavy metals in surface sediments of the Jialu River, China: Their relations to environmental factors. J. Hazardous Materials.270, 102–109. doi: 10.1016/j.jhazmat.2014.01.044
18
GB 18668-2002 . (2002). Marine sediment quality (Beijing: China Standard Press).
19
Guo X. N. Yu M. C. Meng Y. Yuan Q. K. Xie F. Y. Wang Y. B. et al . (2023). Morphological analysis and risk assessment of heavy metals in surface sediments of the Yellow River mainstream. Chin. J. Environ. Engineering.17 (7), 2433–2442. doi: 10.12030/j.cjee.202212136
20
Gutiérrez-Mosquera H. Shruti V. C. Jonathan M. P. Roy P. D. Rivera-Rivera D. M . (2018). Metal concentrations in the beach sediments of Bahia Solano and Nuquí along the Pacific coast of Chocó, Colombia: A baseline study. Mar. pollut. Bulletin.135, 1–8. doi: 10.1016/j.marpolbul.2018.06.060
21
Harrison R. M. Tilling R. Romero M. S. C. Harrad S. Jarvis K . (2003). A study of trace metals and polycyclic aromatic hydrocarbons in the roadside environment. Atmospheric Environment.37, 2391–2402. doi: 10.1016/s1352-2310(03)00122-5
22
He H. J. Gan H. Y. He J. X. Xia Z. Ruan M. Yang Y. P. (2017). Distribution characteristics of heavy metals in coastal sediments from southern Hainan Island and evaluation of ecological risk. Mar. Geology.33, 47–55. doi: 10.16028/j.1009-2722.2017.03008
23
Hu J. Zhu C. B. Long Y. C. Yang Q. Zhou S. Q. Wu P. et al . (2021). Interaction analysis of hydrochemical factors and dissolved heavy metals in the karst Caohai Wetland based on PHREEQC, cooccurrence network and redundancy analyses. Sci. Total Environment.770, 145361. doi: 10.1016/j.scitotenv.2021.145361
24
Huang C. C. Cai L. M. Xu Y. Wen H. H. Jie L. Hu G. C. et al . (2022a). Quantitative analysis of ecological risk and human health risk of potentially toxic elements in farmland soil using the Positive Matrix Factorization (PMF) model. Land Degrad. Dev.33, 1954–1967. doi: 10.1002/ldr.4277
25
Huang C. C. Cai L. M. Xu Y. H. Jie L. Chen L. G. Hu G. C. et al . (2022b). A comprehensive exploration on the health risk quantification assessment of soil potentially toxic elements from different sources around large-scale smelting area. Environ. Monit. Assess.194, 206. doi: 10.1007/s10661-022-09804-0
26
Huang Y. Deng M. Wu S. Japenga J. Li T. Yang X. et al . (2018). A modified receptor model for source apportionment of heavy metal pollution in soil. J. Hazardous Materials.354, 161–169. doi: 10.1016/j.jhazmat.2018.05.006
27
Huang S. S. Liao Q. L. Hua M. Wu X. M. Bi K. S. Yan C. Y. et al . (2007). Survey of heavy metal pollution and assessment of agricultural soil in Yangzhong district, Jiangsu Province, China. Chemosphere.67, 2148–2155. doi: 10.1016/j.chemosphere.2006.12.043
28
Huang H. H. Lin Q. Lin Y. T. Jia X. P. Li C. H. Wang W. Z. (2005). Spatial - temporal variation of large macrobenthic animals in cage culture sea area in Daya Bay. China Environ. Science.25, 412–416. doi: 10.1360/biodiv.050058
29
Jain C. K. Malik D. S. Yadav A. K. (2016). Applicability of plant-based biosorbents in the removal of heavy metals: a review. Environ. Processes.3, 495–523. doi: 10.1007/s40710-016-0143-5
30
Jia L. Liu W. T. Tang D. H. Cai P. J. Cui Z. A . (2020). Distribution characteristics and ecological risk assessment of heavy metals in surface sediments in Sanya Bay and surrounding waters. Mar. Geol. Front.36 (12), 22–31. doi: 10.16028/j.1009-2722.2020.029
31
Kong M. Peng F. Q. Zhang Y. M. Yin H. B. Liu Z. Cao J. Y. (2015). Occurrence characteristic and potential risk assessment of heavy metals in surface sediments of Circum-Chaohu Basin. China Environ. Sci.35 (06), 1863–1871. doi: 1000-6923(2015)06-1863-09
32
Krishnakumar S. Vidyasakar A. Anbalagan S. Godson P. S. Magesh N. S . (2020). Bioavailable trace metals and their ecological risks in the tourist beaches of the Southeast coast of India. Mar. pollut. Bulletin.160, 111562. doi: 10.1016/j.marpolbul.2020.111562
33
Li X. Z. (2008). Evaluation of total mercury in fishery environment and aquaculture organisms in Sandu Bay, Fujian Province, China, and the health risk of human exposure. China Aquat. Science.6), 961–969. doi: 1005-8737-(2008)06-0961-09
34
Li X. Bing J. Zhang J. Guo L. Deng Z. Wang D. et al . (2022a). Ecological risk assessment and sources identification of heavy metals in surface sediments of a river-reservoir system. Sci. Total Environment.842, 156683. doi: 10.1016/j.scitotenv.2022.156683
35
Li Y. Gao B. Dongyu X. Peng W. Zhang M . (2020). Hydrodynamic impact on trace metals in sediments in the cascade reservoirs, North China. Sci. Total Environment.716, 136914. doi: 10.1016/j.scitotenv.2020.136914
36
Li X. Y. Li P. Su Y. W. Shi M. M. Hu T. P. Mao Y. et al . (2022). Pollution and potential ecological risk assessment of heavy metals in surface sediments of Tangxun Lake. Environ. Sci.43 (02), 859–866. doi: 10.13227/j.hjkx.202105129
37
Li S. Zhang Q. (2010). Spatial characterization of dissolved trace elements and heavy metals in the upper Han River (China) using multivariate statistical techniques. J. Hazardous Materials176, 579–588. doi: 10.1016/j.jhazmat.2009.11.069
38
Liu Y. Guo W. Q. Wu Y. Q. (2023). Pollution characteristics, health risks and source analysis of surface soil heavy metals in Urban Parks of Datong City. Chin. J. Soil Sci. 54 (01), 180–191. doi: 10.19336/j.cnki.trtb.2022032901
39
Liu H. L. Nie L. S. Davaa S. Jin S. H. O. Wang X. Q. Chi Q. H. et al . (2020). Background values of 69 elements in catchment sediments of the Sino-Mongolian border area. Geosci. Frontiers.27, 202–221. doi: 10.13745/j.esf.sf.2020.4.4
40
Liu M. Zhang A. B. Fan D. J. Deng S. G. Wang L. Zhang X. L. et al . (2012). Environmental quality of heavy metals in surface sediments in the central region of the Bohai Sea. China Environ. Sci.32 (02), 279 –290. doi: 1000-6923(2012)02-0279-12
41
Lu A. X. Wang J. H. Qin X. Y. Wang K. Y. Han P. Zhang S. Z. (2012). Multivariate and geostatistical analyses of the spatial distribution and origin of heavy metals in the agricultural soils in Shunyi, Beijing, China. Sci. Total Environ.425, 66–74. doi: 10.1016/j.scitotenv.2012.03.003
42
Luo K. Li L. Long G. Y. Liu G. Xue Y. L. Pan W. H. et al . (2017). Heavy metal pollution and their ecological risk assessment in sediments from southern Hainan Island. J. Shanghai Ocean University.26 (01), 85–93. doi: 10.12024/jsou.20160701831
43
Lv J. Liu Y. Zhang Z. Dai J. (2013). Factorial kriging and stepwise regression approach to identify environmental factors influencing spatial multi-scale variability of heavy metals in soils. J. Hazard. Mater.261, 387–397. doi: 10.1016/j.jhazmat.2013.07.065
44
Ma D. Y. (1993). Pollution indicating effects and monitoring methodology of marine sediments. Mar. Sci. Bulletin.12, 89–97.
45
MacDonald D. D. Ingersoll C. G. Berger T. A. (2000). Development and evaluation of consensus-based sediment quality guidelines for freshwater ecosystems. Arch. Environ. Contamination Toxicology.39, 20–31. doi: 10.1007/s002440010075
46
Madrid L. Díaz-Barrientos E. Madrid F. (2002). Distribution of heavy metal contents of urban soils in parks of Seville. Chemosphere.49, 1301–1308. doi: 10.1016/s0045-6535(02)00530-1
47
Meng X. J. Huang C. Long J. Q. Yan L. Hu X. Xing J. F. et al . (2025). Characterisation of heavy metal elements and potential ecological risk assessment of in surface sediments of intertidal zones in southern Hainan Island. Mar. Sci. Bulletin.44, 66–77. doi: 10.11840/j.issn.1001-6392.2025.01.007
48
Nagarajan R. Jonathan M. P. Roy P. D. Anbalagan S. (2013). Metal concentrations in sediments from tourist beaches of Miri City, Sarawak, Malaysia (Borneo Island). Mar. pollut. Bulletin.73, 369–373. doi: 10.1016/j.marpolbul.2013.05.036
49
Paatero P. Tapper U. (1994). Positive matrix factorization: A non-negative factor model with optimal utilization of error estimates of data values. Environmetrics.5, 111–126. doi: 10.1002/env.3170050203
50
Peter T. S. Chandrasekar N. Wilson J. S. Selvakumar S. Krishnakumar S. Magesh N. S. (2017). A baseline record of trace elements concentration along the beach placer mining areas of Kanyakumari coast, South India. Mar. pollut. Bulletin.119, 416–422. doi: 10.1016/j.marpolbul.2017.03.040
51
Ren Y. J. Lin M. Liu Q. M. Zhang Z. H. Fei X. F. Xiao R. et al . (2021). Contamination assessment, health risk evaluation, and source identification of heavy metals in the soil-rice system of typical agricultural regions on the southeast coast of China. Environ. Sci. pollut. Res.28, 12870–12880. doi: 10.1007/s11356-020-11229-6
52
Rydberg J. Gälman V. Renberg I. Bindler R. Lambertsson L. Martínez-Cortizas A. (2008). Assessing the stability of mercury and methylmercury in a varved lake sediment deposit. Environ. Sci. Technology.42, 4391–4396. doi: 10.1021/es7031955
53
Sapkota A. Sapkota A. R. Kucharski M. Burke J. Mckenzie S. Walker P. et al . (2008). Aquaculture practices and potential human health risks: Current knowledge and future priorities. Environ. Int.34, 1215–1226. doi: 10.1016/j.envint.2008.04.009
54
Shao S. Hu B. Fu Z. Wang J. Lou G. Zhou Y. (2018). Source identification and apportionment of trace elements in soils in the Yangtze River Delta, China. Int. J. Environ. Res. Public Health15, 1240. doi: 10.3390/ijerph15061240
55
Sun S. J. Dong C. Y. Zhang H. Yang H. C. Huang Z. Z. Han Y. et al . (2024). Source and influence factors analysis of soil heavy metals based on PMF model and GeoDetector. Environ. Science.45 (9), 5474–5484. doi: 10.13227/j.hjkx.202309255
56
Sun L. Guo D. Liu K. Meng H. Zheng Y. Yuan F. et al . (2019). Levels, sources, and spatial distribution of heavy metals in soils from a typical coal industrial city of Tangshan, China. Catena.175, 101–109. doi: 10.1016/j.catena.2018.12.014
57
Sun Y. Yang J. Gong J. Duan Z. (2022). Contamination and source of metals in surface sediments from the Nandu River of Hainan Island, China. Mar. pollut. Bulletin.182, 114037. doi: 10.1016/j.marpolbul.2022.114037
58
Suresh G. Ramasamy V. Sundarrajan M. Jayakumar R. (2015). Spatial and vertical distributions of heavy metals and their potential toxicity levels in various beach sediments from a high-background-radiation area, Kerala, India. Mar. pollut. Bulletin.91, 389–400. doi: 10.1016/j.marpolbul.2014.11.007
59
Vetrimurugan E. Shruti V. C. Jonathan M. P. Padhi R. K. (2017). Metal concentration in the tourist beaches of South Durban: An industrial hub of South Africa. Mar. pollut. Bulletin.117, 538–546. doi: 10.1016/j.marpolbul.2017.02.036
60
Wang Y. Huang Q. Lemckert C. Ma Y . (2017). Laboratory and field-magnetic evaluation of the heavy metal contamination on Shilaoren Beach, China. Mar. pollut. Bulletin.117, 291–301. doi: 10.1016/j.marpolbul.2017.01.080
61
Wang W. Jiang R. Lin C. Wang L. Liu Y. Lin H. (2022b). Multivariate statistical analysis of potentially toxic elements in the sediments of Quanzhou Bay, China: Spatial relationships, ecological toxicity and source identification. Environ. Res.213, 113750. doi: 10.1016/j.envres.2022.113750
62
Wang S. P. Song Y. M. Liu S. Guo P. R . (2021). Research of the methylation and biological response of exogenous mercury in mariculture sediments. China Environ.l Sci.41 (06), 2871–2880. doi: 10.19674/j.cnki.issn1000-6923.2021.0290
63
Wang J. Wu H. Wei W. Xu C. Tan X. Wen Y. et al . (2022a). Health risk assessment of heavy metal(loid)s in the farmland of megalopolis in China by using APCS - MLR and PMF receptor models: Taking Huairou District of Beijing as an example. Sci. Total Environment.835, 155313. doi: 10.1016/j.scitotenv.2022.155313
64
Wang Q. Xie Z. Y. Li F. B. (2015). Using ensemble models to identify and apportion heavy metal pollution sources in agricultural soils on a local scale. Environ. Pollution.206, 227–335. doi: 10.1016/j.envpol.2015.06.040
65
Wang Y. Xin C. L. Yu S. Xue H. L. Zeng P. Sun P. A. et al . (2022c). Evaluation of heavy metal content, sources, and potential ecological risks in soils of southern hilly areas. Environ. Science.43, 4756–4766. doi: 10.13227/j.hjkx.202110172
66
Wang P. Zhang L. J. Lin X. Yan J. S. Zhang P. Zhao B. et al . (2020a). Spatial distribution, control factors and sources of heavy metals in the surface sediments of Fudu Estuary waters, East Liaodong Bay, China. Mar. pollut. Bulletin.156, 111279. doi: 10.1016/j.marpolbul.2020.111279
67
Wei J. Hu K. Xu J. Liu R. Gong Z. Cai Y. (2022). Determining heavy metal pollution in sediments from the largest impounded lake in the eastern route of China’s South-to-North Water Diversion Project: Ecological risks, sources, and implications for lake management. Environ. Res.214, 114118. doi: 10.1016/j.envres.2022.114118
68
Wijesiri B. Liu A. He B. Yang B. Zhao X. Ayoko G. et al . (2019). Behaviour of metals in an urban river and the pollution of estuarine environment. Water Res.164, 114911. doi: 10.1016/j.watres.2019.114911
69
Wu Q. Hu W. Wang H. Liu P. Wang X. Huang B. (2021b). Spatial distribution, ecological risk and sources of heavy metals in soils from a typical economic development area, Southeastern China. Sci. Total Environ.780, 146557. doi: 10.1016/j.scitotenv.2021.146557
70
Wu D. Ren C. Wu C. Li Y. I. Deng X. Li Q. (2021a). Mechanisms by which different polar fractions of dissolved organic matter affect sorption of the herbicide MCPA in ferralsol. J. Hazardous Materials.416, 125774. doi: 10.1016/j.jhazmat.2021.125774
71
Xiao H. Shahab A. Xi B. Chang Q. You S. Li J. et al . (2021). Heavy metal pollution, ecological risk, spatial distribution, and source identification in sediments of the Lijiang River, China. Environ. Pollution.269, 116189. doi: 10.1016/j.envpol.2020.116189
72
Yang J. Sun Y. Wang Z. Gong J. Gao J. Tang S. et al . (2022). Heavy metal pollution in agricultural soils of a typical volcanic area: Risk assessment and source apportionment. Chemosphere.304, 135340. doi: 10.1016/j.chemosphere.2022.135340
73
Yang A. Xing W. C. Wang X. X. Hu J. Liu X. L. Li J. et al . (2020). Source and risk assessment of heavy metals in surface sediments of rivers, lakes and their surrounding soils in central Tibet. China Environ. Sci.40 (10), 4557–4567. doi: 10.19674/j.cnki.issn1000-6923.2020.0506
74
Yi Z. Q. Yang Y. W. Zhang J. B. Sun X. L. Chen C. L . (2011). Seasonal change of contents of Cu, Zn , Pb and Cd and quality assessment in seawater of Zhanjiang Harbor. J. Guangdong Ocean University.31 (01), 73–79. doi: 10.3969/j.issn.1673-9159.2011.01.014
75
Zhang S. F. Lin M. Y. Wei C. L. Liu B. L. Zhang Z. J . (2010). Pollution assessment and potential ecological risk evolution for heavy metals in the sediments of Qinzhou Bay. Mar. Sci. Bull.29 (04), 450–454. doi: 1001-6932(2010)04-0450-05
76
Zhang W. Liu X. Cheng H. Zeng E. Y. Hu Y . (2012). Heavy metal pollution in sediments of a typical mariculture zone in South China. Mar. pollut. Bulletin.64, 712–720. doi: 10.1016/j.marpolbul.2012.01.042
77
Zhang H. Wu P. Yin A. Yang X. Zhang M. Gao C. (2017). Prediction of soil organic carbon in an intensively managed reclamation zone of eastern China: A comparison of multiple linear regressions and the random forest model. Sci. Total Environment.592, 704–713. doi: 10.1016/j.scitotenv.2017.02.146
78
Zhang H. Zhang F. Song J. Tan M. L. Kung H. T. Johnson V. C. (2021). Pollutant source, ecological, and human health risks assessment of heavy metals in soils from coal mining areas in Xinjiang, China. Environ. Res.202, 111702. doi: 10.1016/j.envres.2021.111702
79
Zhang Y. J. Zheng M. Cai J. Yan C. Q. Hu Y. T. Russel A. G. et al . (2015). Comparison and overview of PM2.5 source apportionment methods. China Sci. Bulletin.60, 109–121. doi: 10.1360/N972014-00975
80
Zhao Y. Y. E M. C. (1993). Abundance of chemical elements in Chinese shallow marine sediments. Sci. China Ser. B23, 1087–1090. doi: 10.1360/zb1993-23-10-1084
81
Zhao K. Zhang L. Dong J. Wu J. Ye Z. Zhao W. et al . (2020). Risk assessment, spatial patterns and source apportionment of soil heavy metals in a typical Chinese hickory plantation region of Southeastern China. Geoderma; International J. Soil Sci. 360, 114011. doi: 10.1016/j.geoderma.2019.114011
82
Zi X. Y. Zang M. Gu X. H. Kan K. C. Mao Z. G. Chen H. H. et al . (2021). Impact of enclosure culture on heavy metal Content in Surface Sediments of hongze lake and ecological risk assessment. Environ. Sci.42 (11), 5355–5363. doi: 10.13227/j.hjkx.202012131
Summary
Keywords
coastal shallow-marine sediments, trace metal pollution, source analysis, nemero multifactor pollution index, positive Matrix Factorization (PMF) model
Citation
Wang S, Wang X, Wang Z, Guo G, Chen L, Huang Z, Fu D, Li P and Yun X (2025) Characterization and source analysis of trace metal pollution in coastal shallow marine sediments, Wanning area, Hainan Island, China. Front. Mar. Sci. 12:1627805. doi: 10.3389/fmars.2025.1627805
Received
13 May 2025
Accepted
26 June 2025
Published
24 July 2025
Corrected
13 November 2025
Volume
12 - 2025
Edited by
Rakesh Kumar, Auburn University, United States
Reviewed by
Periyadan K. Krishnakumar, National Center for Wildlife, Saudi Arabia
Solomon Dan, Beibu Gulf University, China
Updates
Copyright
© 2025 Wang, Wang, Wang, Guo, Chen, Huang, Fu, Li and Yun.
This is an open-access article distributed under the terms of the Creative Commons Attribution License (CC BY). The use, distribution or reproduction in other forums is permitted, provided the original author(s) and the copyright owner(s) are credited and that the original publication in this journal is cited, in accordance with accepted academic practice. No use, distribution or reproduction is permitted which does not comply with these terms.
*Correspondence: Guangfei Guo, ggf@mail.cgs.gov.cn; Liang Chen, clcugb@163.com
†These authors have contributed equally to this work and share first authorship
Disclaimer
All claims expressed in this article are solely those of the authors and do not necessarily represent those of their affiliated organizations, or those of the publisher, the editors and the reviewers. Any product that may be evaluated in this article or claim that may be made by its manufacturer is not guaranteed or endorsed by the publisher.