 Harold DBS. Heorton
 Julienne C. Stroeve
 Gaëlle Veyssière
- 1Centre for Polar Observation and Modelling, Earth Sciences, University College London (UCL), London, United Kingdom
- 2Centre for Earth Observation Science, Clayton H. Riddell Faculty of Environment, Earth and Resources, University of Manitoba, Winnipeg, MB, Canada
- 3Alfred Wegener Institute, University of Bremen, Bremerhaven, Germany
- 4National Snow and Ice Data Center, Boulder, CO, United States
- 5British Antarctic Survey, Cambridge, United Kingdom
Arctic sea ice is projected to thin and reduce in extent significantly over the next century. Both sea ice and its overlying snow limit the amount of light that reaches the upper ocean, impacting the phenology of ocean primary productivity. Recent studies using in-situ data and pan-Arctic satellite observations emphasize the influence of current trends in sea ice and snow on the timing of under-ice, or ice residing algal blooms. This analysis is extended here using Climate Model Intercomparison Project (CMIP6) simulations to estimate future changes in under-ice light levels and to explore the driving factors. Under the SSP5-8.5 scenario, CMIP6 models project a significant reduction in sea-ice and snow thickness, causing light thresholds for algal blooms to be reached up to 60 days earlier by 2100 for regions such as the Chukchi Sea at higher latitudes. Areas such as the Labrador Sea at lower latitudes have limited changes due to relatively thinner sea ice and snow thicknesses. While this trend varies spatially and across models, snow thickness is a critical factor in high-latitude regions.
1 Introduction
As Arctic sea ice continues to thin and shrink in extent in response to anthropogenic warming, the amount of light entering the upper Arctic Ocean is increasing (Stroeve et al., 2024). During late winter, light is one of the primary drivers for ice algae blooms (Arrigo, 2017), and thus changes in the sea ice cover can have important implications for the entire marine ecosystem (Steiner et al., 2019). Previous studies have demonstrated methods to take existing satellite data products to map the amount of light entering the upper ocean through the sea ice cover (Stroeve et al., 2021, Stroeve et al., 2024), demonstrating that the reductions in snow cover play an out-sized role in increased light penetration.
Phytoplankton form the basis of the marine food web and play an important role in the global carbon cycle by absorbing atmospheric CO2. Phytoplankton are diverse globally, from larger macroalgae such as Rhodophyta, to single-celled microalgae such as diatoms which can reside on the underside of sea ice during low light conditions (Yuan et al., 2025; Hoppe et al., 2024). Phytoplankton are estimated to have absorbed approximately a quarter of anthropogenic emissions (Friedlingstein et al., 2023). There is a good agreement between remote sensing, modelling and in situ observations for the historical global CO2 ocean uptake, but future CMIP6 scenarios present significant differences in rates of oceanic primary production (Tagliabue et al., 2021). The uncertainty in modelled productivity rates is mainly due to the availability of nutrients driven by ocean circulation (Duarte et al., 2021), compounded by internal variability inherent within complex ocean microbiomes. The level of productivity is therefore a crucial component in future emission pathways, and also when evaluating the stability of ocean food chains and fisheries (Tittensor et al., 2018) Within the Arctic Ocean, the decrease in the extent of summer sea ice allows for more open ocean primary production (Fernandez-Mendez et al., 2015), but uncertainty is pronounced due to the presence of sea ice causing incomplete knowledge of nutrient cycling (Tuerena et al., 2022). Numerous outflowing river systems have also been shown to be a significant factor in Arctic Ocean productivity and add an additional source of variability (Terhaar et al., 2021). While prior investigations into historical and future Arctic primary production and food chain sustainability focus on the open ocean, the Arctic ecosystem is underpinned by algal growth on the underside of the sea ice cover which can grow underlow light conditions at high latitudes when no open ocean primary production occurs (Ardyna et al., 2020; Hoppe et al., 2024). Both ice algae and pelagic phytoplankton have been observed to bloom under sea ice even when open ocean conditions are present (Arrigo et al., 2012) with the majority the ice algae observed to be species of diatoms (Fernandez-Mendez et al., 2015; Arrigo, 2017; Hoppe et al., 2024). These diatoms provide an important food source to higher-order predators (Koch et al., 2023) and thus plays a crucial role in the Arctic Ocean primary productivity and the entire marine food web (Hollowed and Sundby, 2014; Combaz et al., 2025).
During Arctic winter months (e.g. above 66.5°N) the sun is below the horizon with no light available for photosynthesis and primary production. With the return of the sun, algal growth can begin in the open ocean, but because of the presence of sea ice, light availability is restricted under the ice cover. The sea ice and snow layers create a complex system of light scattering and absorption. Over bare sea ice, light can be scattered within up to 10 cm of the surface (Light et al., 2008). Within snow, this layer is thinner (Light et al., 2015, 3 cm), but with greater total radiation scattering (Warren, 2019). In regions with the thickest ice and snow cover, very little light reaches the upper ocean below the ice. However, there is growing evidence that blooms of ice algae can occur in low-light environments below sea ice (Hoppe et al., 2024), despite earlier studies suggesting larger light conditions were required (Horvat et al., 2022). Once the ice algae begins to grow, the blooms can persist provided sufficient nutrients remain near the surface (Castellani et al., 2017).
Due to the difficulty in creating year round Arctic wide observations of ocean biogeochemistry there has been a recent effort to improve models to fill this knowledge gap (Popova et al., 2012; Lee et al., 2016). These models typically deploy global climate models coupled in a configuration that includes the crucial sea ice and biogeochemistry components (Jin et al., 2016), tracking primary productivity, chlorophyll and zooplankton (Clement Kinney et al., 2023). These models have successfully reproduced the nutrient and chlorophyll distributions of in-situ observations, but due to their dependency on modelled ocean currents, development is needed to accurately represent the horizontal transport of zooplankton (Lee et al., 2016). The observed under sea ice algal bloom of Arrigo et al. (2012) has been successfully simulated using a regional Earth system model, with coupled atmosphere, ocean, sea ice, and biogeochemical components, forced on its boundary by an atmospheric reanalysis (Clement Kinney et al., 2023). The success of this model implies that the results from such models provide a strong source of information for the state of primary productivity in the Arctic Ocean. Recent advances suggest that productivity is light, rather than nutrient limited, and blooms in both ice algae and pelagic pytoplankton occur seasonally (Popova et al., 2012; Clement Kinney et al., 2020). However, it remains uncertain whether this limitation will persist with the projected changing sea ice state of the Arctic over the next century (Jin et al., 2016).
The aim of this study is to predict future trends in under-ice light availability due to the projected decrease in Arctic sea ice thickness (Notz and Community, 2020) and increased precipitation as rain rather than snow (McCrystall et al., 2021). While the focus here on light-limitation only has less sophistication than the fully coupled climate and biogeochemistry model of Clement Kinney et al. (2020), there is high complexity and thus uncertainty of running these simulations up to 2100. Therefore here we looked to provide insight to questions raised by Clement Kinney et al. (2023) on the future of light limitation in a changing Arctic using a similar approach to Stroeve et al. (2024). This was investigated by showing emergent spatial and temporal correlations and thus showing how ice algae growth seasons can change under the most extreme future changes to the Arctic Ocean as represented by the SSP5-8.5 emission scenario. In this paper we refer to ice algae as those organisms that reside within or on the underside of sea ice, typically observed to be diatoms (Hoppe et al., 2024). The results may have implications for pelagic species, though these are observed to bloom later in the spring (Arrigo et al., 2012).
Previous studies using an ensemble mean model projection from CMIP5 have shown that future sea ice changes will allow for a shift in the timing of ice algae blooms towards earlier in the season (Tedesco et al., 2019). Sea ice conditions from the most recent projections from the sixth assessment report of the Intergovernmental Panel on Climate Change (IPCC) (AR6) have been shown to perform better than their predecessors in terms of representing observed long-term changes (Notz and Community, 2020; Keen et al., 2021), and thus it is timely to reassess future changes in under-ice light conditions using individual simulations to capture spatial variability and correlations in sea ice and snow thicknesses. In this study, we estimate the timing of when enough light is available to trigger a sea ice algal bloom onset over the next century for an ensemble of CMIP6 model simulations. Section 2.1 outlines the CMIP6 model data used in this study. Section 2.2 describes the under-ice light model and Section 2.4 describes the snow and ice thickness distributions used. This model uses the latest insight into how to distribute snow across coarse model grid cells (Mallett et al., 2022) to account for areas of thin snow within a grid cell. This is essential, since a sub-grid cell snow depth distribution function is not explicitly considered within the sea ice component of prior model simulations (Lee et al., 2016; Keen et al., 2021). The results of the study are presented in Section 3.
2 Data and methods
2.1 CMIP6 models
To estimate the timing when enough light is available to foster the onset of ice algae blooms, data on the dominant controlling factors are required. In a simple light extinction model, such as used by Stroeve et al. (2024), these include: the amount of incoming solar radiation at the ocean surface, the albedo of interface between sea ice or snow and the atmosphere, the fraction covered by sea ice, sea ice thickness and the thickness of snow that has settled on the sea ice along with surface scattering layers that occur in both.
To assess future changes, we took model data from the SSP585 emission scenario, the most pessimistic scenario which results in an additional radiative forcing of 8.5 Wm–2 by 2100. To compute bloom-onset timing requires the use of daily sea ice and light fields that are consistent from a single model run. Taking an ensemble mean will reduce the crucial temporal variability. This limited our analysis to only 10 CMIP6 models (Supplementary Table S1). From these models we use the first ensemble member for daily sea ice concentration (siconc), thickness (sithick) and snow on sea ice thickness (sisnthick). During the analysis stage of this study the majority of these models only had daily sisnthick available for a single model ensemble. More ensemble members have since been uploaded and cross-variant analysis is now possible for future work.
Corresponding values for daily surface albedo and incoming shortwave radiation are either provided from sea ice variables (siflswdtop incoming radiation, siflswutop reflected/outgoing radiation) or from the atmosphere (rsds incoming radiation, rsus reflected/outgoing radiation), with care taken to check the sign conventions for each model (see Supplementary Table S1). For models where the shortwave is taken from sea ice data the sea ice albedo was calculated directly with the ratio of the outgoing (SWu) to incoming solar radiation (SWd) at the surface. For SW data taken from atmospheric component the mixed surface albedo is calculated with This value represents the averaged reflectance over a model grid cell containing both sea ice and ocean. In order to focus on the light available for ice algae growth, we converted the mixed albedo in these cases (see Supplementary Table S1) to the sea ice albedo using the relationship where is the assumed albedo of the open ocean fraction and C is the sea ice concentration.
Most CMIP6 output represent a mean value on a coarse grid cell. This is problematic for snow depth and ice thickness, which show large spatial variations within these spatial scales (Castro-Morales et al., 2014; Mallett et al., 2022). While some models include a sea ice thickness distribution, this information is not provided as a variable on a daily timescale. Since accurate prediction of sufficient light to initiate a bloom onset depends on the snow and ice thickness distribution, we applied a snow and sea ice thickness distribution as described in section 2.4.
The sea ice state as averaged for the entire Arctic Ocean for the 10 CMIP6 models is summarized in Figure 1. The key time period of interest for this study is March and April coinciding with the return of the Arctic sun. This time of year also coincides with the timing of the maximum sea ice area (defined as the area of sea ice coverage weighted by the ice concentration) (1(d)), though sea ice and snow thickness continue to increase through May (e and f).In general, the March/April sea ice area shows a more modest decline throughout the rest of the century compared to sea ice and snow thickness which decrease more rapidly (1e and f). There are two exceptions however, the CMCC-ESM2 and IPSL-CM6A-LR models show collapses in the sea ice area in 2060 and 2090, respectively. Since CMCC-ESM2 has considerably thinner ice than the other models, and thinner than current observations indicate are realistic (Landy et al., 2022), this model is removed from further analysis.
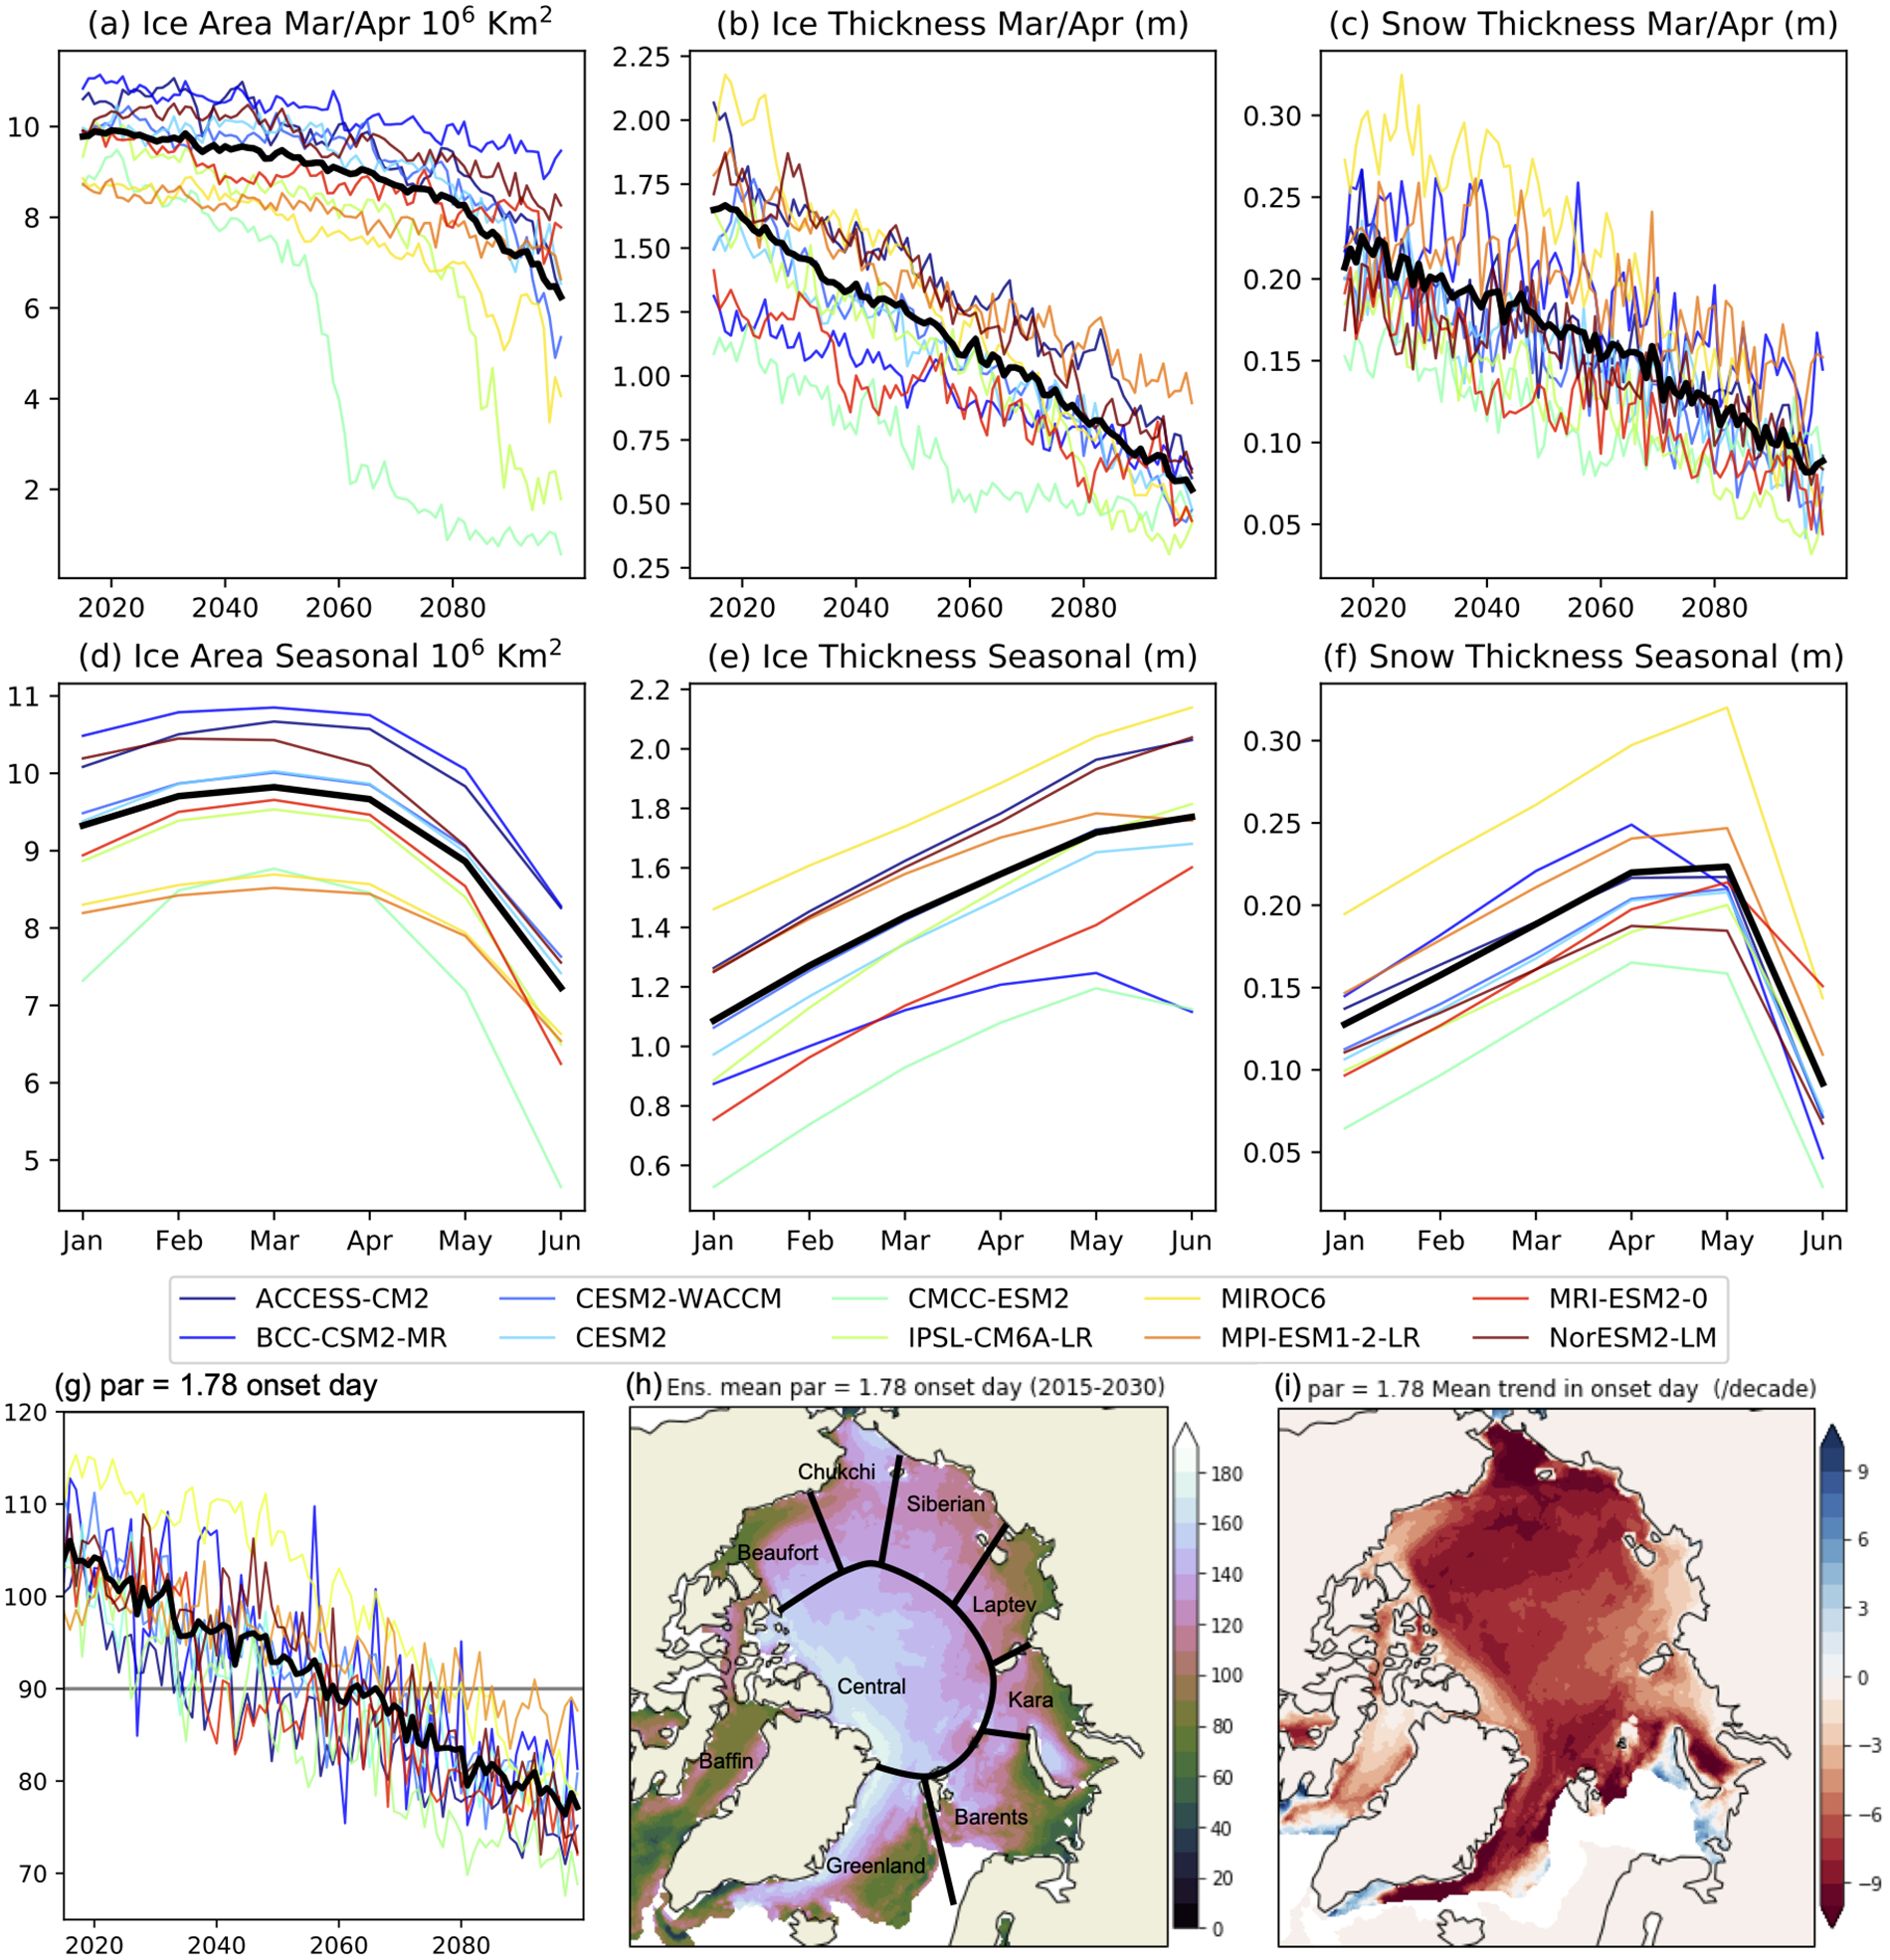
Figure 1. Sea ice state for the ensemble of models used for the sea ice study within scenario SSP5-8.5. Plots (a-c) show the average sea ice and snow state over the Arctic Basin in March and April. Plots (d-f) are the average seasonal cycles for the year 2015-2030. Plots (g-i) show the changing algal bloom onset day, (g) the Arctic wide average, (h) the mean onset day for 2015-2030, (i) the mean trend (days/decade) over 2015–2100 for a limit of par = 1.78 μ mol photons m–2 s–1. Plot (h) shows the regions used in later Figures. Note that the trend in (i) is per decade, while the stated total change in (h) and later Figures is for the total study period.
2.2 Under ice light model
To model under-ice light availability, we sought levels of Photosynthetically Active Radiation (PAR) that are known to allow for the growth of ice algae. There are a number of different studies that have attempted to define a minimum PAR level. Stroeve et al. (2021), Stroeve et al. (2024) for example based their bloom onset timings on a PAR value of 1.78 μ mol photons m–2 s–1 for four consecutive days. However, a new study using observations acquired at latitudes near 86N during the Multidisciplinary drifting Observatory for the Study of Arctic Climate (MOSAiC) expedition suggests PAR thresholds of 0.04 ± 0.02 μ mol photons m–2 s–1 are sufficient for ice algae blooms (Hoppe et al., 2024). Given that evidence exists for several different orders of magnitude of light levels needed for photosynthesis to occur, we used three different thresholds of 1.78, 0.415, and 0.04 μ mol photons m–2 s–1 for four consecutive days to determine the ice algae bloom onset timings.
2.3 Model equations
To model PAR levels at the sea ice ocean interface, we used the approach described by Stroeve et al. (2021), Stroeve et al. (2024) (Equations 1–6). The code developed for this study is available at https://github.com/CPOMUCL/EcoLight_process. The model considers the surface albedo( and vertical attenuation coefficients for short wave (SW) radiation, for a multiple level exponential decay. The model considers snow and sea ice as separate layers, each with their own. with the addition of a surface scattering layer (SSL) that can form in both the snow and sea-ice layer for the conditions described below. The transmitted broadband irradiance at the ocean-sea ice interface ( W ) is calculated from the value at the atmosphere-snow interface.( W ). We included the multiple snow () and ice () thickness fractions and the open ocean fraction (), along with their computed transmittances () separately with
for m snow thickness and n ice thickness categories. The values for each A are dependent on the thickness distribution as described in section 2.4.
For given snow and ice thickness categories we calculated the transmittance with.
with the surface albedo, and the radiation extinction rate for ice or snow. The snow extinction rate is given as a function of snow depth with:
for (scattering snow), relating to an observed transmittance of 0.3 for a scattering layer of depth m (Light et al., 2015) and (for deeper snow).
with for and an observed transmittance of 0.3 for a scattering layer of depth and for thicker sea ice (Light et al., 2008). The surface scattering layer in sea ice is found when radiation has been able to pass through any snow above. For sea ice with no snow above it, a surface scattering layer is observed to develop to a maximum depth of m for sea ice of a thickness of m (Castellani et al., 2022). There was observed to be no surface scattering layer for sea ice of a thickness with m. Adding to this the restriction that there will be no sea ice scattering layer for a fully developed snow scattering layer and allowing for the scattering layer depth to increase linearly between these restrictions, we give the following parameterisation for the sea ice surface scattering layer depth:
This parameterisation calculates the correct surface scattering layer for bare sea ice and allows for high transmittance for thin snow and ice conditions. This thin snow/ice implementation is crucial for the thinner sea ice and snow layers found in the future CMIP6 scenario used here compared to present day observations (Stroeve et al., 2021, Stroeve et al., 2024). A simplification of this scheme compared to Stroeve et al. (2024) is that there is no separation of wet and dry snow due to the inability to represent this with the used model data.
The intensity of light in the PAR spectral range () at the ice ocean interface was calculated using.
where the parameters set are due to observations of the relationship between the transmitted short wave (W ) and at the ice-ocean interface (Stroeve et al., 2021).
2.4 Snow and ice thickness distribution model
To represent the observed variability of snow and ice thickness over length scales shorter than model grid cells, we applied both a sea ice and snow thickness distribution. The ice thickness distribution was that of Castro-Morales et al. (2014) as used by Stroeve et al. (2021) with 15 thickness classes. The snow thickness distribution is as used by (Stroeve et al., 2024) and was the observational based skew-normal distribution of Mallett et al. (2022) as shown in Supplementary Figure S4. The skew-normal distribution was derived from north pole drifting station observations of ice thickness collected at 10-meter intervals across the Arctic Basin, using data recorded between 1955 and 1991. Here we implement the distribution with 10 thickness classes, covering standard deviations, with the standard deviation given as the mean snow depth per CMIP6 grid cell. We apply each snow thickness class to each ice thickness class with a total of combined classes modelled for each grid cell.
3 Results
Our estimates for under-ice light availability predicts an earlier onset of ice algae blooms across all seasonally sea ice-covered regions of the Arctic Ocean through 2100. This shift is driven by the overall reduction in both sea ice and snow thickness. The average trend in the onset day is linear (Figure 1g), reflecting the trend in both average snow and ice thicknesses (1b and c). On average, under sea ice algal blooms are predicted to occur 25 days earlier (2.9 days/decade) by the end on the century using a PAR threshold of 1.78 μ mol photons m–2 s–1. However, the trend is not consistent over the entire Arctic. The greatest changes are seen in the Beaufort, Chukchi and Kara Seas (1i and S1) with 7 days/decade for the ensemble average, peaking to 10 days/decade for the IPSL and MRI models (see Supplementary Figure S3). Using a lower PAR threshold of 0.04 μ mol photons m–2 s–1, the theoretical lowest limit of photosynthesis (Hoppe et al., 2024), there is no significant trend in onset day (Figures 2a, d). Our light transmission approach allows for this level of under-ice PAR to be reached for all CMIP6 ice and snow thicknesses once the sun returns. Using a PAR limit of 0.415 μ mol photons m–2 s–1, the spatial and temporal variability in ice algae bloom onset is dependent upon the snow and ice thickness, with reduced latitudinal dependence compared to a PAR threshold of 0.04 μ mol photons m–2 s–1 (Figures 2b, e); trends towards earlier bloom onset dates are seen throughout the Arctic Ocean from 2015 to 2100, though smaller magnitude than using a PAR threshold of 1.78 μ mol photons m–2 s–1 (Figures 2c, f).
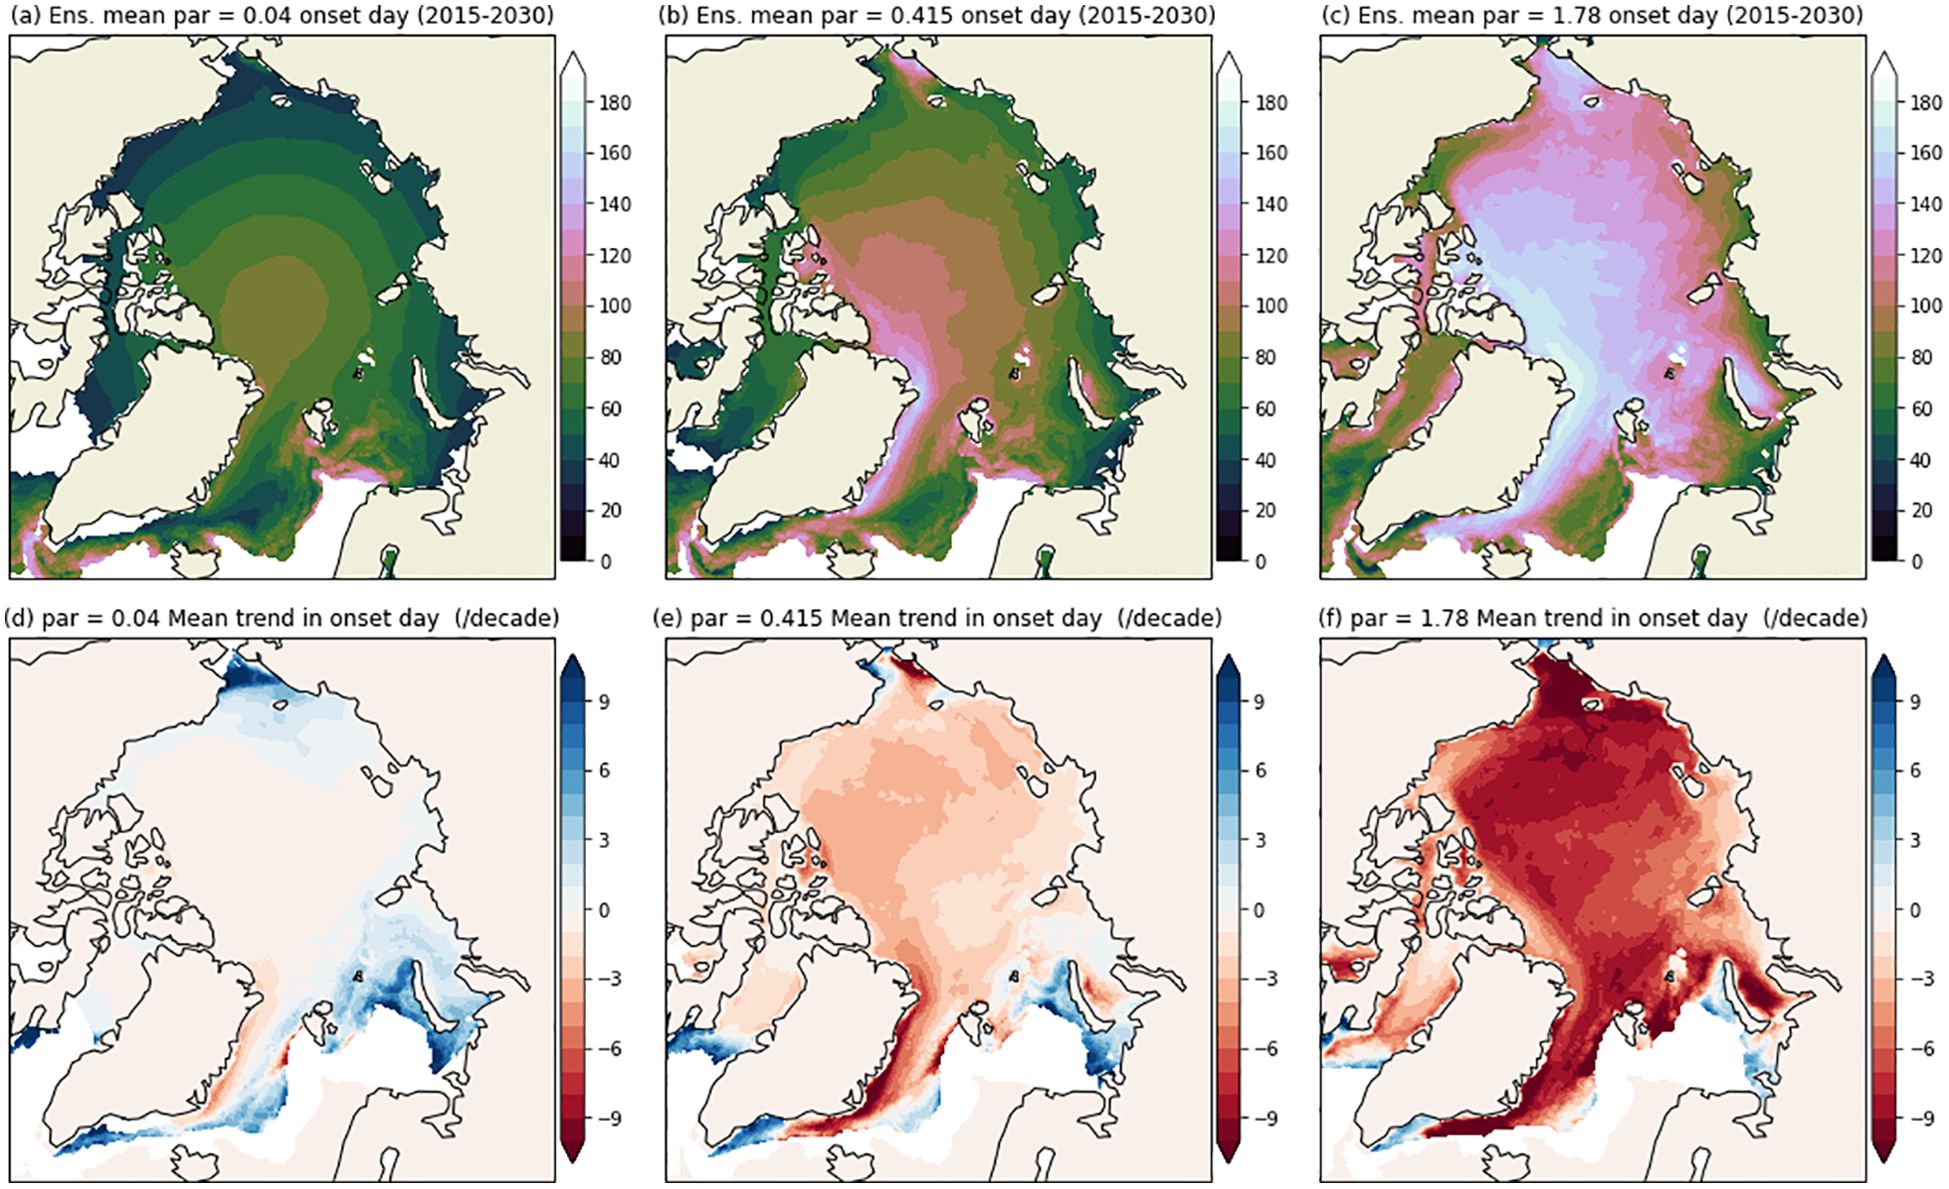
Figure 2. Maps of ensemble averaged estimated algal bloom onset day for the early period (2015-2030) (a–c) and ensemble mean trend in onset day (days/decade) over 2015-2100 bottom (d–f). Each column is for varying levels of PAR = (0.04, 0.415, 1.78) μ mol photons m–2 s–1.
3.1 Sea Ice and snow conditions drive change
To show the key forcing interactions that result in changes to the bloom onset day, detailed information for the Baffin/Labrador, Beaufort and Central Arctic regions (as defined by the National Snow and Ice Data Centre regional ice masks (Meier and Stewart, 2023)) are presented in Figure 3 with all Arctic regions shown in the Supplementary Figure S4. Sea ice and snow thickness (top two rows) show the largest interdecadal changes compared to the incoming solar radiation and the surface albedo or total absorbed solar radiation. While this is true for all three regions, the resulting changes in bloom onset date are not. This can be explained by considering the incoming SW radiation, used here as a proxy for PAR levels above the snow/sea ice cover. The seasonal cycle in SW is largely consistent throughout the century (and over the ensemble members, see Supplementary Figure S5) with a small increase at the end of the century due to changes in ozone and cloud cover/properties (Yamamoto et al., 2024). As no ice algae bloom is possible until light returns, the bloom onset in the Baffin/Labrador region is already near its earliest day of the year in 2015 (early March, see SW plot row). Any thinner ice and snow conditions at this point will allow more light to reach the underside of the sea ice, though the bloom conditions have already been met. The converse is true for the Beaufort and Central Arctic regions. For the period 2015-2030, snow and ice are thick enough such that 200–250 W , of incoming SW are required for sufficient light to reach the ocean below. As the snow and ice cover become thinner over the century, less incoming radiation is required, which allows for large shifts in bloom onset, up to ≈40 days earlier (see estimated onset days over the SW plots in Figure 3).
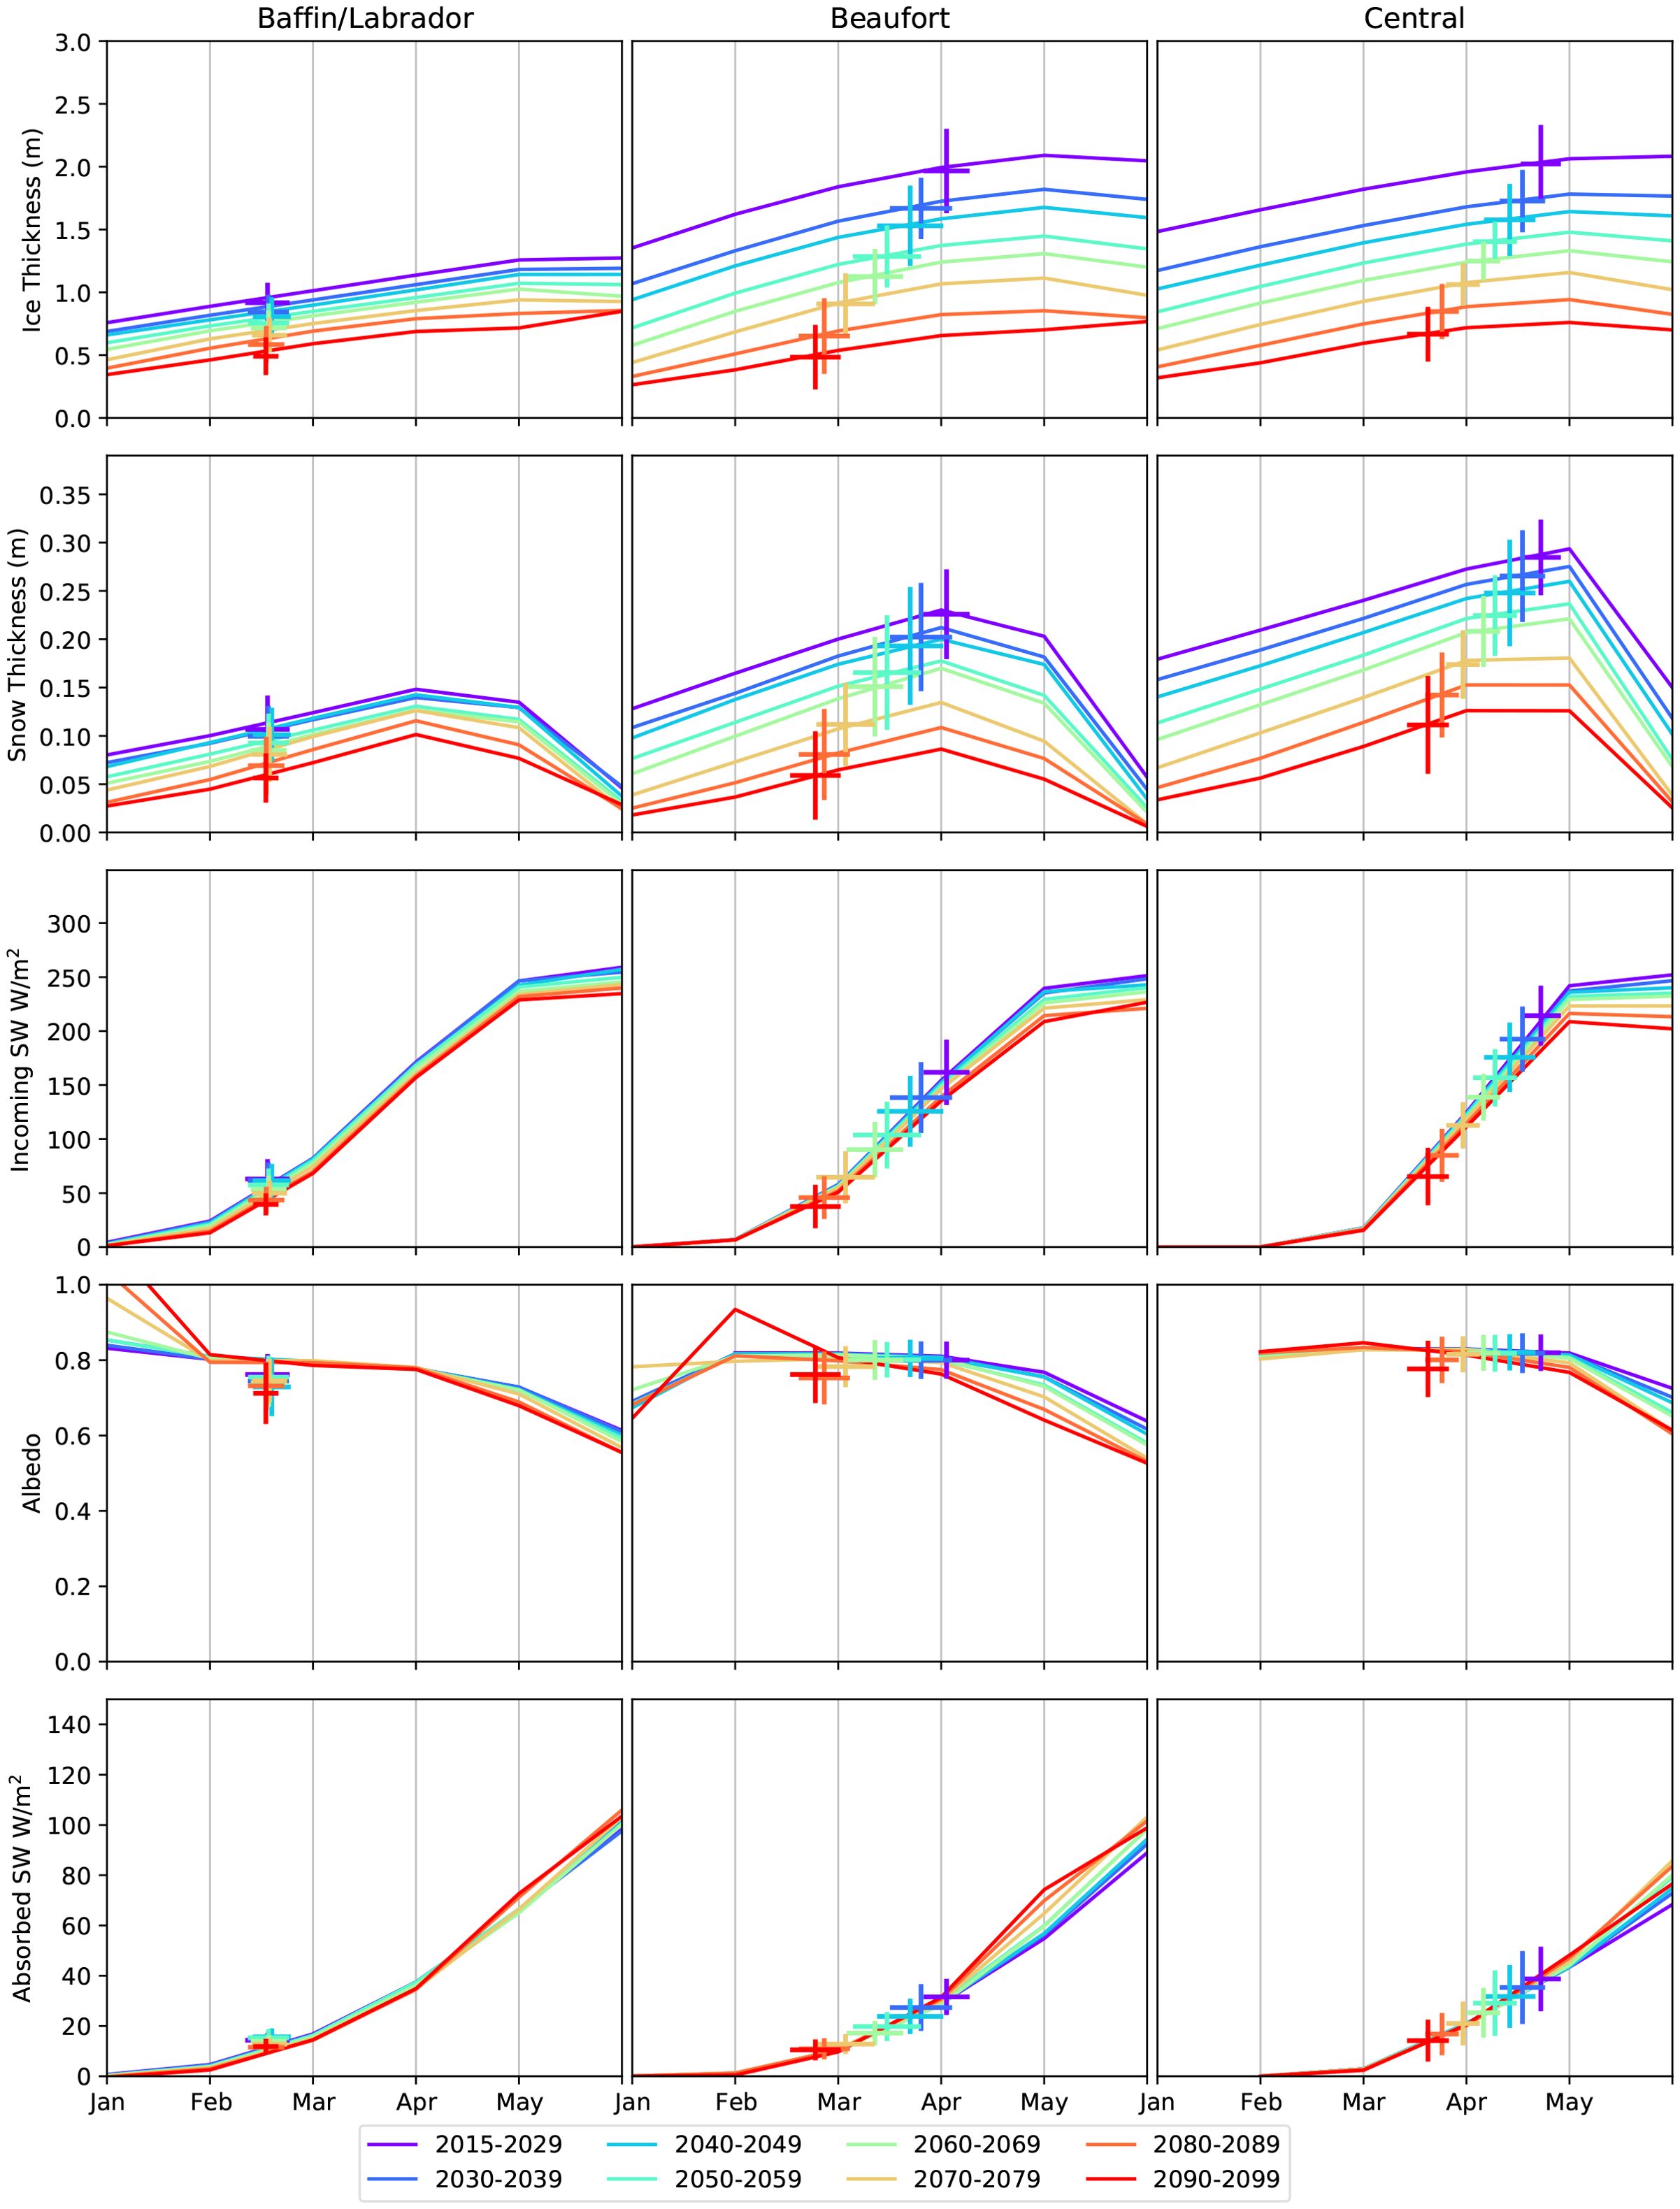
Figure 3. The changing sea ice conditions and estimated algal bloom onset dates for the CMIP6 SSP585 ensemble mean over 2015-2100. Three key regions have been chosen (see Figure 1h) to show contrasting changes. Each plot shows the ensemble mean seasonal cycle (lines, monthly data), with the distribution of estimated bloom onset dates and associated sea ice and solar radiation conditions overlayed as crosses. Each colour indicates the mean for time period shown in the legend. Similar plots for all regions of the Arctic and for each ensemble member over the period 2015–2030 are in Supplementary Figures S4, S5.
The relationship between snow and ice and the required incoming SW level also explains the decadal changes. Comparing the Beaufort and Central Arctic regions, the variability of snow and ice thickness in the two regions is similar over the period 2015-2030 (Figure 3; Supplementary Figure S4). However in the Central Arctic Ocean, bloom onset cannot occur until late May when incoming SW is near its peak, with variations in snow and ice thickness making small changes in onset date (under 15 days, Incoming SW plot of Supplementary Figure S5). However, in the Beaufort Sea, the onset day is distributed about April and May, during which SW conditions are variable. This creates a high sensitivity to the ice and snow thickness with an estimated onset day variable by 30 days for this period. While the modelled incoming SW is consistent across models, there is some variation in surface albedo. When considering the fraction absorbed at the surface, , as plotted on the bottom row of Figure 3, there is greater model spread (Supplementary Figure S5) though less average decadal variation (Figure 3). A notable outlier here is the BCC-CSM2 model, which has lower sea ice albedo values than the other models, giving high values for absorbed SW. However, the onset days for this model are not early compared to the ensemble average as the sea ice and snow are both thick enough to delay light reaching the ocean below.
3.2 Correlations across model ensembles
To investigate the drivers of changes to under sea light availability as shown in section 3.1, we look at the correlations between average forcing state across the 10 individual model ensembles. As each model ensemble has varying sea ice and snow thickness for each modelled year, we can investigate what changing conditions cause the greatest change in bloom onset date. Over the coming century there are small changes to the seasonal cycles in SW and albedo but significant changes in sea ice and snow thickness (Figure 3), both of which are prominent drivers of PAR transmittance (Equation 1). However, when investigating correlations between average Mar/April snow or sea ice thickness and regionally averaged onset date, snow thickness has higher correlations except for the Greenland Sea (right of Figure 4). When looking in detail at the correlation between snow thickness and algae bloom onset dates across the 9 ensemble members (left of Figure 4, where each year of each model is a separate point) the correlation varies across the Arctic and throughout the century.
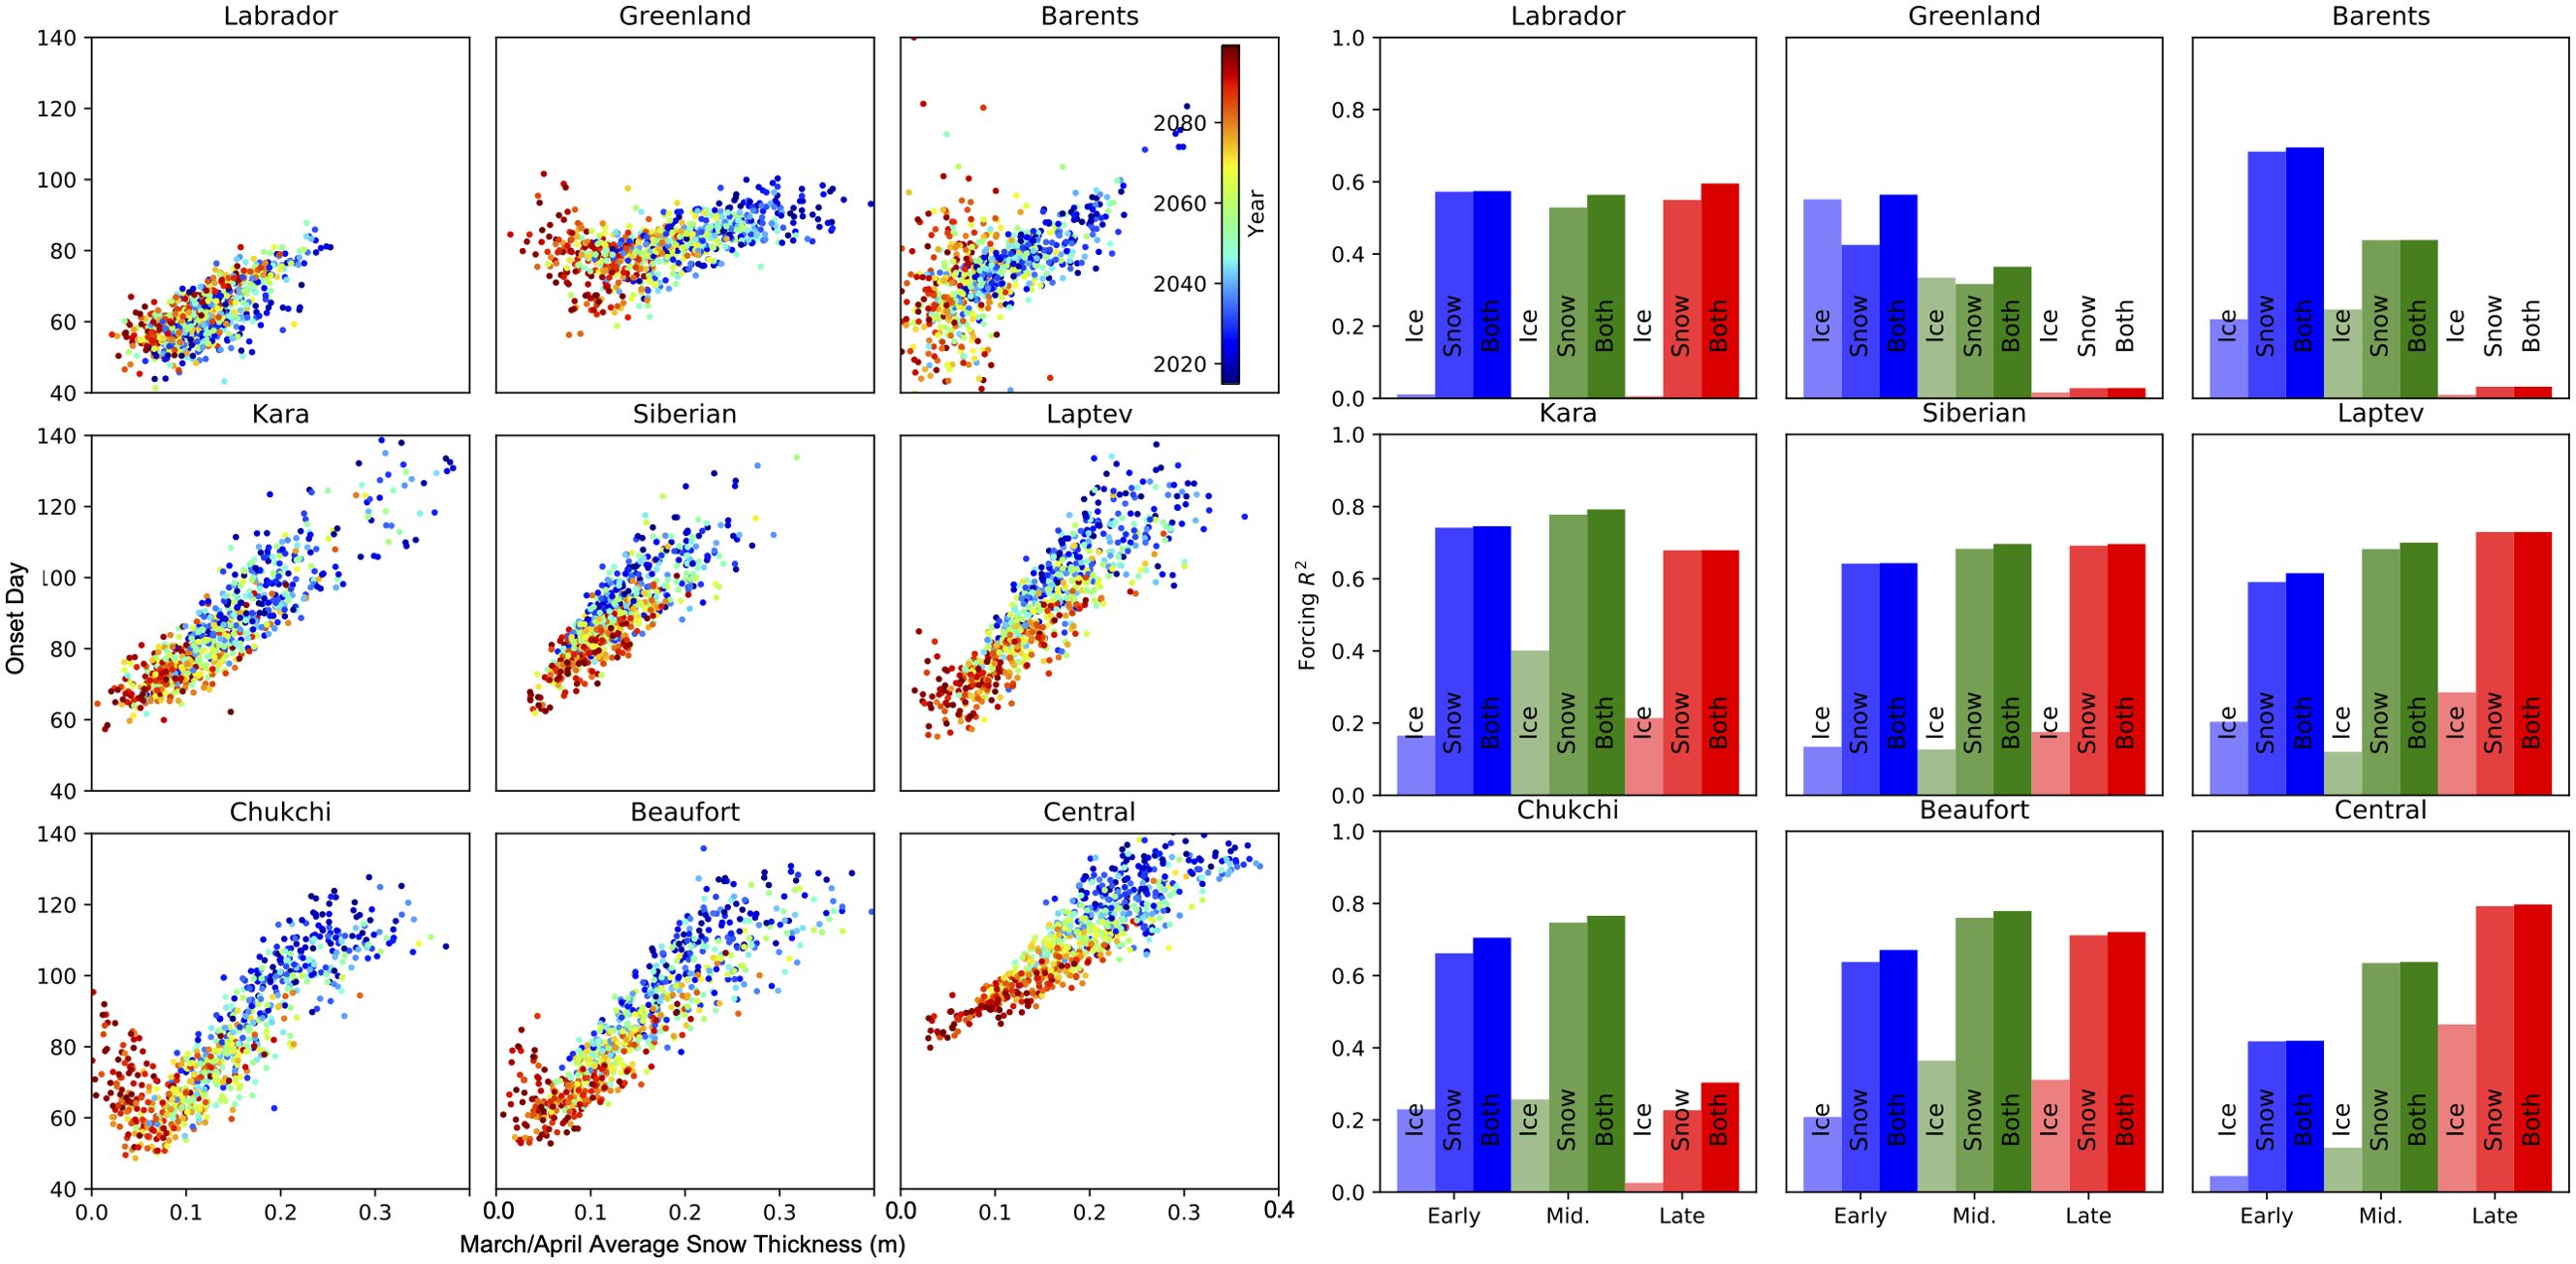
Figure 4. Mean correlation between algal bloom onset date and sea-ice and snow state for the 10 CMIP6 models under the SSP585 emission scenario. The scatter plots to the left show the mean onset date for each year and the mean Mar/April snow thickness for each region of the Arctic as shown in Figure 1h. A point is shown for each ensemble member (see Supplementary Table S1) coloured for the year as shown in the legend. The right hand side shows the regression over all ensemble members for the early (2015-2039), middle (2040-2064) and late (2065-2100) periods, between onset date and mean Mar/April sea-ice and snow thickness and the multilinear regression for both.
For low latitude regions (e.g. the Baffin/Labrador, Greenland and Barents seas), as discussed in section 5.1, present sea ice conditions allow blooms to occur as soon as the sun returns, with limited changes projected into the future (SW plot for the Greenland sea in Figure 3 and Supplementary Figure S4). For other regions, reducing snow thickness allows the onset day to occur up to 60 days earlier across the ensembles as the bloom onset transitions from being limited by melt date, to occurring with the returning sun. For the Greenland, Barents, Chukchi and Beaufort seas, the emergent correlation between algae bloom onset and ice and snow thickness weakens towards the end of the century (e.g. 2065–2100 in Figure 4, right side) due to ice free summers in some scenarios. As our model only considers the ice-covered part of the Arctic ocean, the onset dates in these cases occur when the sea ice cover returns.
Across the coming century the central Arctic shows an increasing correlation between onset timing and ice and snow conditions. This region is at the highest latitudes and has the largest future changes in snow and sea ice thickness, but does not have the greatest change in estimated onset date 3. Current conditions (shown by the early period values to the left of Figure 4) have limited correlation to onset date, as this can only occur when above surface incoming radiation reaches summer peak levels (discussed in section 5.1 and shown in SW plot of Figures 3, and Supplementary Figure S5), with the ensemble spread in ice and snow thicknesses causing relatively limited spread in calculated onset day. As snow thickness reduces throughout the middle to end of the century, the onset date in the Central Arctic shows increasing correlation to snow thickness (central plots in Figure 4). The thinner snow thickness allows the onset date to occur before the incoming SW reaches its peak.
4 Discussion
We have expanded recent satellite observation-based studies into how snow and sea ice thickness can be used to explain under sea ice algal bloom onsets (Stroeve et al., 2024, Stroeve et al., 2021). We have taken all available daily CMIP6 SSP585 scenario data to model the light available for an ice algae bloom to occur. Our results show patterns of spatial and time variation in both onset date and the key forcing controlling this date. The onset forcing can be summarised into three types: lower latitude ice covered seas (illustrated by the Baffin/Labrador region 3 and 4) with relatively thin January snow cover, with onset currently limited by the returning sun and with limited future changes; marginal Arctic Basin seas (illustrated by the Beaufort Sea in Figures 3 and 4 with other regions in Supplementary Figure S4) with onset date currently limited by snow thickness; the central Arctic with a thick snow and ice cover with current onset dates that can only occur when incoming solar radiation is at its maximum. As the state of the Arctic changes over the SSP5-8.5 emission scenario, the marginal Arctic Basin seas transition to having onset dates limited to the date of the returning sun, and the Central Arctic region onset day becomes controlled by the seasonal snow thickness.
Even though the most pessimistic SSP5-8.5 emission scenario has the greatest changes to the Arctic Ocean sea ice state, the results in this study are indicative of expected changes post 2100 given current projected warming levels. Since the regional variation in changes to under-ice light availability and limiting factors to algal bloom onset are consistent across the model ensembles and emerge by the middle of the century (see Figure 4), they can be expected to manifest under future Arctic sea ice and snow conditions.
While the response of under-ice light availability to changing snow and sea ice conditions is clear, there are other considerations important for algal primary productivity. Studies suggest that the initial population of algae is controlled by the freeze-up date of sea-ice, which will shift to one to two month later in the autumn/winter season for the SSP5-8.5 scenario (Keen et al., 2021). Winter ocean conditions can cause selection and adaptation within the algal population, affecting the size and health of initial populations and thus ability of the populations to bloom once light becomes available. The timing and location of freeze-up is also shown to be related to amount of algae at the ice underside due to water algae populations.
The snow distribution used here, while currently the best informed representation of sub-grid cell snow cover available, was created by the analysis of snow over multi-year sea-ice (Mallett et al., 2022). Half of present day Arctic sea ice is first-year ice, with this fraction increasing to the whole Arctic as the perennial ice cover disappears. Adding to this, our imposed sea ice and snow thickness distributions have no covariance. Whilst the thickest snow is observed to collect around the thickest ridges in multi-year sea ice (Shalina and Sandven, 2018), the crucial covariance between the thinnest first-year sea ice and snow are not known. A further complication to the sea ice cover that may become of increasing importance are melt-ponds that present a low albedo region and habitat for algae. While the current timing of melt-ponds are typically after our predicted timing of light availability [June and May respectively (Webster et al., 2022)], the onset of melt is expected to become earlier (Keen et al., 2021) and may be crucial - particularly at lower latitudes where our results suggest a limited change in onset timing, and due to how current large algal blooms are observed to occur during high melt-pond coverage (Arrigo et al., 2012). The same observations suggest that the increased mobility expected for sea ice over the next century will be less important. As the majority of this observed bloom occurred under the sea ice even when leads exposed the open ocean, it is the specific changes to the under-ice fraction that are of greatest importance.
Both observational and model based knowledge of the complete seasonal cycle of Arctic under sea ice algal growth is incomplete. In-situ and food chain evidence of ice algae shows its ubiquitousness and importance to food chain and primary production (Koch et al., 2023). Current knowledge of the nutrient cycling in the Arctic ocean and river runoff systems do not allow for accurate predictions of the algal growth cycle (Tuerena et al., 2022; Terhaar et al., 2021), thus the main knowledge of ice algae growth comes from predictions of light limited initial bloom timing (Stroeve et al., 2024; Arrigo, 2017; Castellani et al., 2017). Our results show two timing trends in future scenarios: limited changes to the timing of light availability for the earliest possible growth (PAR = 0.04 μ mol photons m–2 s–1), and large changes to the timing of light levels associated with algal blooms (PAR = 1.78 μ mol photons m–2 s–1) at high latitudes.
Since current primary productivity in the Arctic Ocean is limited by light availability (Clement Kinney et al., 2020), our results suggest as sea ice and its overlying snow cover continue to thin, there will be a lengthening of the high Arctic Ocean productivity season and a continuation of the current observed trend in increased under-ice productivity (Jin et al., 2016). However, this lengthening may in turn lead to a shift toward a nutrient limited regime, an increase in zooplankton or larger organisms and potentially an increase in carbon sequestration. Since the sea ice species of diatoms are a key source for the year-round food web, impacts of changes to the under-ice light regime can result in cascading impacts on wider fisheries (Kohlbach et al., 2016). To fully understand the implications of these results, future primary production models need to focus upon earlier bloom timings and the shorter time period between first growth and later blooms. Our results show that accurate representation of < 1 km snow and ice thickness distributions is crucial for these simulations.
5 Summary
The Arctic climate and sea-ice habitat has undergone a large transition over recent decades at a pace that is consistently predicted to be maintained over the coming century (Notz and Community, 2020), including the possibility of ice-free summers by 2050 (Jahn et al., 2024). These changes portend a dramatic shift in seasonal light conditions, with cascading impacts on biodiversity within the Arctic Ocean. Thus a better understanding of the seasonal changes expected and their drivers is needed to be able to predict how the marine ecosystem will respond.
While the full relationship between biodiversity and habitat is too complex to model in future scenarios, we are able to provide insights into a key aspect of primary productivity, the availability of light to initiate growth of ice algae. Under the SSP5-8.5 emission scenario, a consistent reduction in sea-ice and snow-on-sea-ice thickness occurs throughout the Arctic Ocean. Our results highlight that the thinning snow cover is the dominant factor that will affect the timing of blooms in ice algae. While simulations predict that Arctic sea ice cover persists when the polar sun returns each spring, algal blooms will be increasingly able to occur with the returning sun, while currently in much of the Arctic they are delayed by the surface snow cover.
Data availability statement
CMIP6 simulation data is freely available and was accessed from https://aims2.llnl.gov/search/cmip6/ . The code developed for this paper is freely available at https://github.com/CPOMUCL/EcoLight_process . Our calculated onset dates for each model are available at https://www.cpom.ucl.ac.uk/under_ice_par/.
Author contributions
HH: Data curation, Visualization, Writing – original draft, Methodology, Formal analysis, Investigation, Software, Writing – review & editing. JS: Project administration, Conceptualization, Supervision, Funding acquisition, Writing – original draft, Formal analysis, Writing – review & editing. GV: Writing – original draft, Investigation, Software, Formal analysis, Methodology, Writing – review & editing.
Funding
The author(s) declare financial support was received for the research and/or publication of this article. This work was partly funded through the NERC project (NE/R012725/1) Eco-Light, part of the Changing Arctic Ocean programme, jointly funded by the UKRI Natural Environment Research Council (UKRI NERC) and the German Federal Ministry of Education and Research (BMBF). This work was also funded by Horizon 2020 CRiceS grant number 101003826 and Canada 150 Research Chairs program, C150 grant number 50296.
Conflict of interest
The authors declare that the research was conducted in the absence of any commercial or financial relationships that could be construed as a potential conflict of interest.
Generative AI statement
The author(s) declare that no Generative AI was used in the creation of this manuscript.
Any alternative text (alt text) provided alongside figures in this article has been generated by Frontiers with the support of artificial intelligence and reasonable efforts have been made to ensure accuracy, including review by the authors wherever possible. If you identify any issues, please contact us.
Publisher’s note
All claims expressed in this article are solely those of the authors and do not necessarily represent those of their affiliated organizations, or those of the publisher, the editors and the reviewers. Any product that may be evaluated in this article, or claim that may be made by its manufacturer, is not guaranteed or endorsed by the publisher.
Supplementary material
The Supplementary Material for this article can be found online at: https://www.frontiersin.org/articles/10.3389/fmars.2025.1642506/full#supplementary-material
References
Ardyna M., Mundy C. J., Mayot N., Matthes L. C., Oziel L., Horvat C., et al. (2020). Under-ice phytoplankton blooms: shedding light on the “Invisible” Part of arctic primary production. Front. Mar. Sci. 7. doi: 10.3389/fmars.2020.608032
Arrigo K. R. (2017). “Sea ice as a habitat for primary producers,” in Sea ice, vol. 14. (New Jersey, USA: John Wiley & Sons, Ltd), 352–369. doi: 10.1002/9781118778371.ch14
Arrigo K. R., Perovich D. K., Pickart R. S., Brown Z. W., van Dijken G. L., Lowry K. E., et al. (2012). Massive phytoplankton blooms under arctic sea ice. Science 336, 1408–1408. doi: 10.1126/science.1215065
Castellani G., Karcher M., Stroeve J., Banas S. N., Bouman A. H., Brierley A., et al. (2022). Shine a light: Under-ice light and its ecological implications in a changing Arctic Ocean. Ambio 51, 307–317. doi: 10.1007/s13280-021-01662-3
Castellani G., Losch M., Lange B. A., and Flores H. (2017). Modeling Arctic sea-ice algae: Physical drivers of spatial distribution and algae phenology. J. Geophysical Research: Oceans 122, 7466–7487. doi: 10.1002/2017JC012828
Castro-Morales K., Kauker F., Losch M., Hendricks S., Riemann-Campe K., and Gerdes R. (2014). Sensitivity of simulated Arctic sea ice to realistic ice thickness distributions and snow parameterizations. J. Geophysical Research: Oceans 119, 559–571. doi: 10.1002/2013JC009342
Clement Kinney J., Frants M., Maslowski W., Osinski R., Jeffery N., Jin M., et al. (2023). Investigation of under-ice phytoplankton growth in the fully-coupled, high-resolution regional arctic system model. J. Geophysical Research: Oceans 128, e2022JC019000. doi: 10.1029/2022JC019000
Clement Kinney J., Maslowski W., Osinski R., Jin M., Frants M., Jeffery N., et al. (2020). Hidden production: on the importance of pelagic phytoplankton blooms beneath arctic sea ice. J. Geophysical Research: Oceans 125, e2020JC016211. doi: 10.1029/2020JC016211
Combaz T., Witte U., Brown T. A., and Archambault P. (2025). Importance of ice algae versus phytoplankton in the diet of megabenthic organisms under contrasting sea ice conditions (Canadian Arctic): A dual biochemical approach (SIA and HBIs). Front. Mar. Sci. 12. doi: 10.3389/fmars.2025.1574292
Duarte P., Meyer A., and Moreau S. (2021). Nutrients in water masses in the atlantic sector of the arctic ocean: temporal trends, mixing and links with primary production. J. Geophys. Res.-Oceans 126, e2021JC017413. doi: 10.1029/2021JC017413
Fernandez-Mendez M., Katlein C., Rabe B., Nicolaus M., Peeken I., Bakker K., et al. (2015). Photosynthetic production in the central Arctic Ocean during the record sea-ice minimum in 2012. Biogeosciences 12, 3525–3549. doi: 10.5194/bg-12-3525-2015
Friedlingstein P., O’Sullivan M., Jones M. W., Andrew R. M., Bakker D. C. E., Hauck J., et al. (2023). Global carbon budget 2023. Earth System Sci. Data 15, 5301–5369. doi: 10.5194/essd-15-5301-2023
Hollowed A. B. and Sundby S. (2014). Change is coming to the northern oceans. Science 344, 1084–1085. doi: 10.1126/science.1251166
Hoppe C. J. M., Fuchs N., Notz D., Anderson P., Assmy P., Berge J., et al. (2024). Photosynthetic light requirement near the theoretical minimum detected in Arctic microalgae. Nat. Commun. 15, 7385. doi: 10.1038/s41467-024-51636-8
Horvat C., Bisson K., Seabrook S., Cristi A., and Matthes L. C. (2022). Evidence of phytoplankton blooms under Antarctic sea ice. Front. Mar. Sci. 9. doi: 10.3389/fmars.2022.942799
Jahn A., Holland M. M., and Kay J. E. (2024). Projections of an ice-free arctic ocean. Nat. Rev. Earth Environ. 5, 164–176. doi: 10.1038/s43017-023-00515-9
Jin M., Popova E. E., Zhang J., Ji R., Pendleton D., Varpe Ø., et al. (2016). Ecosystem model intercomparison of under-ice and total primary production in the Arctic Ocean. J. Geophysical Research: Oceans 121, 934–948. doi: 10.1002/2015JC011183
Keen A., Blockley E., Bailey D. A., Boldingh Debernard J., Bushuk M., Delhaye S., et al. (2021). An inter-comparison of the mass budget of the Arctic sea ice in CMIP6 models. Cryosphere 15, 951–982. doi: 10.5194/tc-15-951-2021
Koch C. W., Brown T. A., Amiraux R., Ruiz-Gonzalez C., MacCorquodale M., Yunda-Guarin G. A., et al. (2023). Year-round utilization of sea ice-associated carbon in Arctic ecosystems. Nat. Commun. 14, 1964. doi: 10.1038/s41467-023-37612-8
Kohlbach D., Graeve M., A. Lange B., David C., Peeken I., and Flores H. (2016). The importance of ice algae-produced carbon in the central Arctic Ocean ecosystem: Food web relationships revealed by lipid and st able isotope analyses. Limnology Oceanography 61, 2027–2044. doi: 10.1002/lno.10351
Landy J. C., Dawson G. J., Tsamados M., Bushuk M., Stroeve J. C., Howell S. E. L., et al. (2022). A year-round satellite sea-ice thickness record from CryoSat-2. Nature 609, 517–522. doi: 10.1038/s41586-022-05058-5
Lee Y. J., Matrai P. A., Friedrichs M. A. M., Saba V. S., Aumont O., Babin M., et al. (2016). Net primary productivity estimates and environmental variables in the Arctic Ocean: An assessment of coupled physical-biogeochemical models. J. Geophysical Research: Oceans 121, 8635–8669. doi: 10.1002/2016JC011993
Light B., Grenfell T. C., and Perovich D. K. (2008). Transmission and absorption of solar radiation by Arctic sea ice during the melt season. J. Geophysical Research: Oceans 113, C03023. doi: 10.1029/2006JC003977
Light B., Perovich D. K., Webster M. A., Polashenski C., and Dadic R. (2015). Optical properties of melting first-year Arctic sea ice. J. Geophysical Research: Oceans 120, 7657–7675. doi: 10.1002/2015JC011163
Mallett R. D. C., Stroeve J. C., Tsamados M., Willatt R., Newman T., Nandan V., et al. (2022). Sub-kilometre scale distribution of snow depth on Arctic sea ice from Soviet drifting stations. J. Glaciology. 68(271), 1014–1026. doi: 10.1017/jog.2022.18
McCrystall M. R., Stroeve J., Serreze M., Forbes B. C., and Screen J. A. (2021). New climate models reveal faster and larger increases in Arctic precipitation than previously projected. Nat. Commun. 12, 6765. doi: 10.1038/s41467-021-27031-y
Meier W. N. and Stewart J. S. (2023). Arctic and antarctic regional masks for sea ice and related data products, version 1. Boulder, Colorado USA: National Snow and Ice Data Center. doi: 10.5067/CYW3O8ZUNIWC
Notz D. and Community S. (2020). Arctic sea ice in CMIP6. Geophys. Res. Lett. 47, e2019GL086749. doi: 10.1029/2019GL086749
Popova E. E., Yool A., Coward A. C., Dupont F., Deal C., Elliott S., et al. (2012). What controls primary production in the Arctic Ocean? Results from an intercomparison of five general circulation models with biogeochemistry. J. Geophysical Research: Oceans 117, C00D12. doi: 10.1029/2011JC007112
Shalina E. V. and Sandven S. (2018). Snow depth on Arctic sea ice from historical in situ data. Cryosphere 12, 1867–1886. doi: 10.5194/tc-12-1867-2018
Steiner N. S., Cheung W. W. L., Cisneros-Montemayor A. M., Drost H., Hayashida H., Hoover C., et al. (2019). Impacts of the changing ocean-sea ice system on the key forage fish arctic cod (Boreogadus saida) and subsistence fisheries in the western canadian arctic—Evaluating linked climate, ecosystem and economic (CEE) models. Front. Mar. Sci. 6. doi: 10.3389/fmars.2019.00179
Stroeve J., Vancoppenolle M., Veyssiere G., Lebrun M., Castellani G., Babin M., et al. (2021). A multi-sensor and modeling approach for mapping light under sea ice during the ice-growth season. Front. Mar. Sci. 7. doi: 10.3389/fmars.2020.592337
Stroeve J. C., Veyssiere G., Nab C., Light B., Perovich D., Laliberte,´ J., et al. (2024). Mapping potential timing of ice algal blooms from satellite. Geophysical Res. Lett. 51, e2023GL106486. doi: 10.1029/2023GL106486
Tagliabue A., Kwiatkowski L., Bopp L., Butenschon M., Cheung W., Lengaigne M., et al. (2021). Persistent uncertainties in ocean net primary production climate change projections at regional scales raise challenges for assessing impacts on ecosystem services. Front. Clim. 3. doi: 10.3389/fclim.2021.738224
Tedesco L., Vichi M., and Scoccimarro E. (2019). Sea-ice algal phenology in a warmer Arctic. Sci. Adv. 13, 2375–2548. doi: 10.1126/sciadv.aav4830
Terhaar J., Lauerwald R., Regnier P., Gruber N., and Bopp L. (2021). Around one third of current Arctic Ocean primary production sustained by rivers and coastal erosion. Nat. Commun. 12, 169. doi: 10.1038/s41467-020-20470-z
Tittensor D. P., Eddy T. D., Lotze H. K., Galbraith E. D., Cheung W., Barange M., et al. (2018). A protocol for the intercomparison of marine fishery and ecosystem models: Fish-MIP v1.0. Geoscientific Model. Dev. 11, 1421–1442. doi: 10.5194/gmd-11-1421-2018
Tuerena R. E., Mahaffey C., Henley S. F., de la Vega C., Norman L., Brand T., et al. (2022). Nutrient pathways and their susceptibility to past and future change in the Eurasian Arctic Ocean. Ambio 51, 355–369. doi: 10.1007/s13280-021-01673-0
Warren S. G. (2019). Optical properties of ice and snow. Philos. Trans. R. Soc. A: Mathematical Phys. Eng. Sci. 377, 20180161. doi: 10.1098/rsta.2018.0161
Webster M. A., Holland M., Wright N. C., Hendricks S., Hutter N., Itkin P., et al. (2022). Spatiotemporal evolution of melt ponds on Arctic sea ice: MOSAiC observations and model results. Elementa: Sci. Anthropocene 10, 72. doi: 10.1525/elementa.2021.000072
Yamamoto A. L. C., Correa M. D. P., Torres R. R., Martins F. B., and Godin-Beekmann S. (2024). Total ozone content, total cloud cover, and aerosol optical depth in CMIP6: Simulations performance and projected changes. Theor. Appl. Climatol 155, 2453–2471. doi: 10.1007/s00704-023-04821-6
Keywords: ocean algae, sea ice, CMIP6, light, snow
Citation: Heorton HDBS, Stroeve JC and Veyssière G (2025) Future under sea ice light availability and algal bloom timing from CMIP6 model simulations. Front. Mar. Sci. 12:1642506. doi: 10.3389/fmars.2025.1642506
Received: 06 June 2025; Accepted: 14 August 2025;
Published: 17 September 2025.
Edited by:
Paul E Renaud, Akvaplan niva AS, NorwayReviewed by:
Jinlin Liu, Tongji University, ChinaJaclyn Clement Kinney, Naval Postgraduate School, United States
Copyright © 2025 Heorton, Stroeve and Veyssière. This is an open-access article distributed under the terms of the Creative Commons Attribution License (CC BY). The use, distribution or reproduction in other forums is permitted, provided the original author(s) and the copyright owner(s) are credited and that the original publication in this journal is cited, in accordance with accepted academic practice. No use, distribution or reproduction is permitted which does not comply with these terms.
*Correspondence: Harold DBS. Heorton, aC5oZW9ydG9uQHVjbC5hYy51aw==