 Tyler A. Helble1*†
 Regina A. Guazzo1†
 Peter J. Dugan2
 Gabriela C. Alongi3
 Cameron R. Martin1
 Stephen W. Martin3
 E. Elizabeth Henderson1
- 1Naval Information Warfare Center Pacific, San Diego, CA, United States
- 2Naval Undersea Warfare Center, Newport, RI, United States
- 3National Marine Mammal Foundation, San Diego, CA, United States
Fin whale song consists of low frequency notes arranged in regular, repeating patterns of note type pairings and inter-note intervals (INIs). In the central North Pacific, fin whales use two downswept note types (A and B notes) with both singlet and doublet INIs that are interwoven throughout a song. These song patterns have been observed to change over time. Fin whale population size, structure, distribution, and connectedness are poorly understood, but monitoring their songs can help fill these knowledge gaps. In this study, we examine fin whale song patterns and their evolution across 12 years (2011–2023) with a focus on the most recent 5.5 years (2017–2023), expanding on our previous work. Between August 2017 and March 2023, automated detection, localization, tracking, and classification methods on 33 hydrophones at the Pacific Missile Range Facility (PMRF) off Kaua’i, Hawai’i enabled a detailed analysis of song patterns produced during 331 individual fin whale encounters that contained 130,402 notes. We categorized song patterns, quantified changes over time, and calculated cue rates in these fin whale tracks, detected between late fall and early spring. Five song patterns were observed, usually interwoven throughout a song with INIs of 30 s for A-A singlets, 17/32 s for A-A doublets, 34 s for B-B singlets, 16/23 s for B-B doublets, and 15/22 s for A-B doublets. A-B doublet has remained the dominant song pattern in this region and both A-B and B-A INIs have increased over time with the two INIs getting closer in recent years. While these five INI peaks persisted across seasons, certain INI distributions contained substantial variability and new patterns were observed. Our findings emphasize the need for nuanced acoustic analyses that account for note type and INIs. This analysis highlights the complexity of fin whale song and provides a robust foundation for long-term monitoring and comparative analyses across the North Pacific with song patterns serving as indicators of connectivity between different geographic regions. Ultimately this work can be applied to help define populations and the number of individuals in an area.
1 Introduction
Cetaceans rely on sound as a primary method of communication and sensing their environment. Many species of baleen whales, including fin whales (Balaenoptera physalus), sing low-frequency songs that travel great distances underwater and are thought to be male vocalizations associated with mating (e.g. Payne and Webb, 1971; Watkins et al., 1987; Croll et al., 2002). Increased understanding of baleen whale song can help inform conservation and management strategies. Passive acoustic monitoring allows for extended periods of data collection to detect the presence of whale vocalizations. If known and if stable, the cue rate (i.e. vocalization rate) is an important variable to convert the number of detected vocalizations into estimates of individual abundance in the monitored area (e.g. Marques et al., 2009, 2012). In addition, since song is a social behavior, it might be useful to differentiate between populations and assess their connectivity (geographic differences in fin whale song have been shown by Hatch and Clark, 2004; Delarue et al., 2009; Castellote et al., 2012; Helble et al., 2020a; Romagosa et al., 2024). Fin whale population size, structure, distribution, and connectedness are not well understood, but monitoring their songs can help fill these knowledge gaps, improving management decisions for this species.
Fin whale song is a low-frequency vocalization pattern detected in every ocean basin (e.g. Watkins, 1981; Watkins et al., 1987), and recent research has shown that fin whale song is much more complex than previously thought (Helble et al., 2020a; Guazzo et al., 2024). Notes are arranged with regular spacings, or inter-note intervals (INIs), between them that vary with the note type pairing (Helble et al., 2020a; Guazzo et al., 2024). These song patterns are interwoven within an individual’s song and change across song seasons, both gradually and suddenly (Helble et al., 2020a; Guazzo et al., 2024). In the North Pacific, this song has two low-frequency, downswept note types, sometimes referred to as pulses (e.g. Oleson et al., 2014; Širović et al., 2017; Weirathmueller et al., 2017). The B note is more broadband and has a higher peak frequency and the A note is less broadband and has a lower peak frequency (Helble et al., 2020a). While “classic” and “backbeat” have traditionally been the more common ways to identify B and A notes, respectively, we have chosen this nomenclature for reasons discussed further by Helble et al. (2020a) in Section 2.1. These notes are short in duration (approximately 1 s or less) with median peak frequencies measured in the central North Pacific of 23 Hz and 16 Hz and 3 dB bandwidths of 13 and 6 Hz for B and A notes, respectively (Helble et al., 2020a).
Both the note type pairing (A-B, A-A, or B-B) and its corresponding INI define the fin whale song pattern (Helble et al., 2020a). INIs have been observed in singlet (constant INI), doublet (two alternating INIs), and triplet patterns (a pattern of three INIs, at least two of which are unique) (Watkins, 1981; Watkins et al., 1987; Thompson et al., 1992; Delarue et al., 2013; Širović et al., 2017). Singlet song patterns generally consist of the same repeated note type, while doublets and triplets can have either one or both note types.
Fin whale song patterns have changed both gradually and suddenly. Several fin whale INIs have been observed to increase over time, sometimes gradually increasing over many years (Širović et al., 2017; Weirathmueller et al., 2017; Helble et al., 2020a; Best et al., 2022; Guazzo et al., 2024) and sometimes increasing more rapidly within a song season and then resetting to a lower value at the start of the next song season (Watkins et al., 1987; Hatch and Clark, 2004; Morano et al., 2012; Oleson et al., 2014; Širović et al., 2017; Guazzo et al., 2024). Individuals have been observed interweaving and switching between multiple song patterns within a song bout, so different song patterns are not necessarily indicative of different populations or even individuals (Helble et al., 2020a; Guazzo et al., 2024). Dominant song patterns have also suddenly been replaced by new song patterns (Širović et al., 2017; Helble et al., 2020a), which could be the result of a different population in the area or a change in song pattern preference by the same population.
Helble et al. (2020a) reported the song patterns of 115 fin whale encounters recorded on the U.S. Navy’s Pacific Missile Range Facility (PMRF) off Kaua’i, Hawai’i over 6.5 years from January 2011–July 2017. The goal of the current study was to examine fin whale song patterns and their evolution across 12 years (January 2011–March 2023), with a focus on the most recent 5.5 years (August 2017–March 2023). This work was made possible by the unique capabilities at PMRF, which allow for long-term passive acoustic monitoring and tracking of many marine mammals including fin whales. We expand on our previous work at this site (Helble et al., 2020a) by nearly doubling the length of our timeseries, refining our localization methods to track whales despite array changes, and documenting continued drift of fin whale INIs over this period including a decreasing separation of A-B and B-A intervals.
2 Methods
2.1 Study area and data description
The PMRF hydrophones are located to the northwest of Kaua’i, in the Hawaiian Islands (Figure 1). Acoustic recordings were made on 33 of the hydrophones at both 96 kHz and 6 kHz sampling rates. The 96 kHz data were down-sampled to 6 kHz for consistency. These bottom-mounted and cabled hydrophones, deployed at depths ranging from approximately 1,500 to 4,700 meters, formed a rectangular grid 21 km east/west and 58 km north/south. A previous study (Helble et al., 2020a) examined fin whale songs within the PMRF range from January 2011 to July 2017, while the current analysis focuses on data collected between August 2017 and March 2023 (recording effort shown in Figure 2). During the opportunistic recording periods, no U.S. Navy training exercises were conducted, and there were minimal other local anthropogenic sources of noise. In August 2017, an outage impacted multiple hydrophones for the remainder of the time period (see Helble et al., 2024, for more details). As a result, the array configuration during 2011–2017 differed from that during 2017–2023 (see Figure 1 in Helble et al., 2020a).
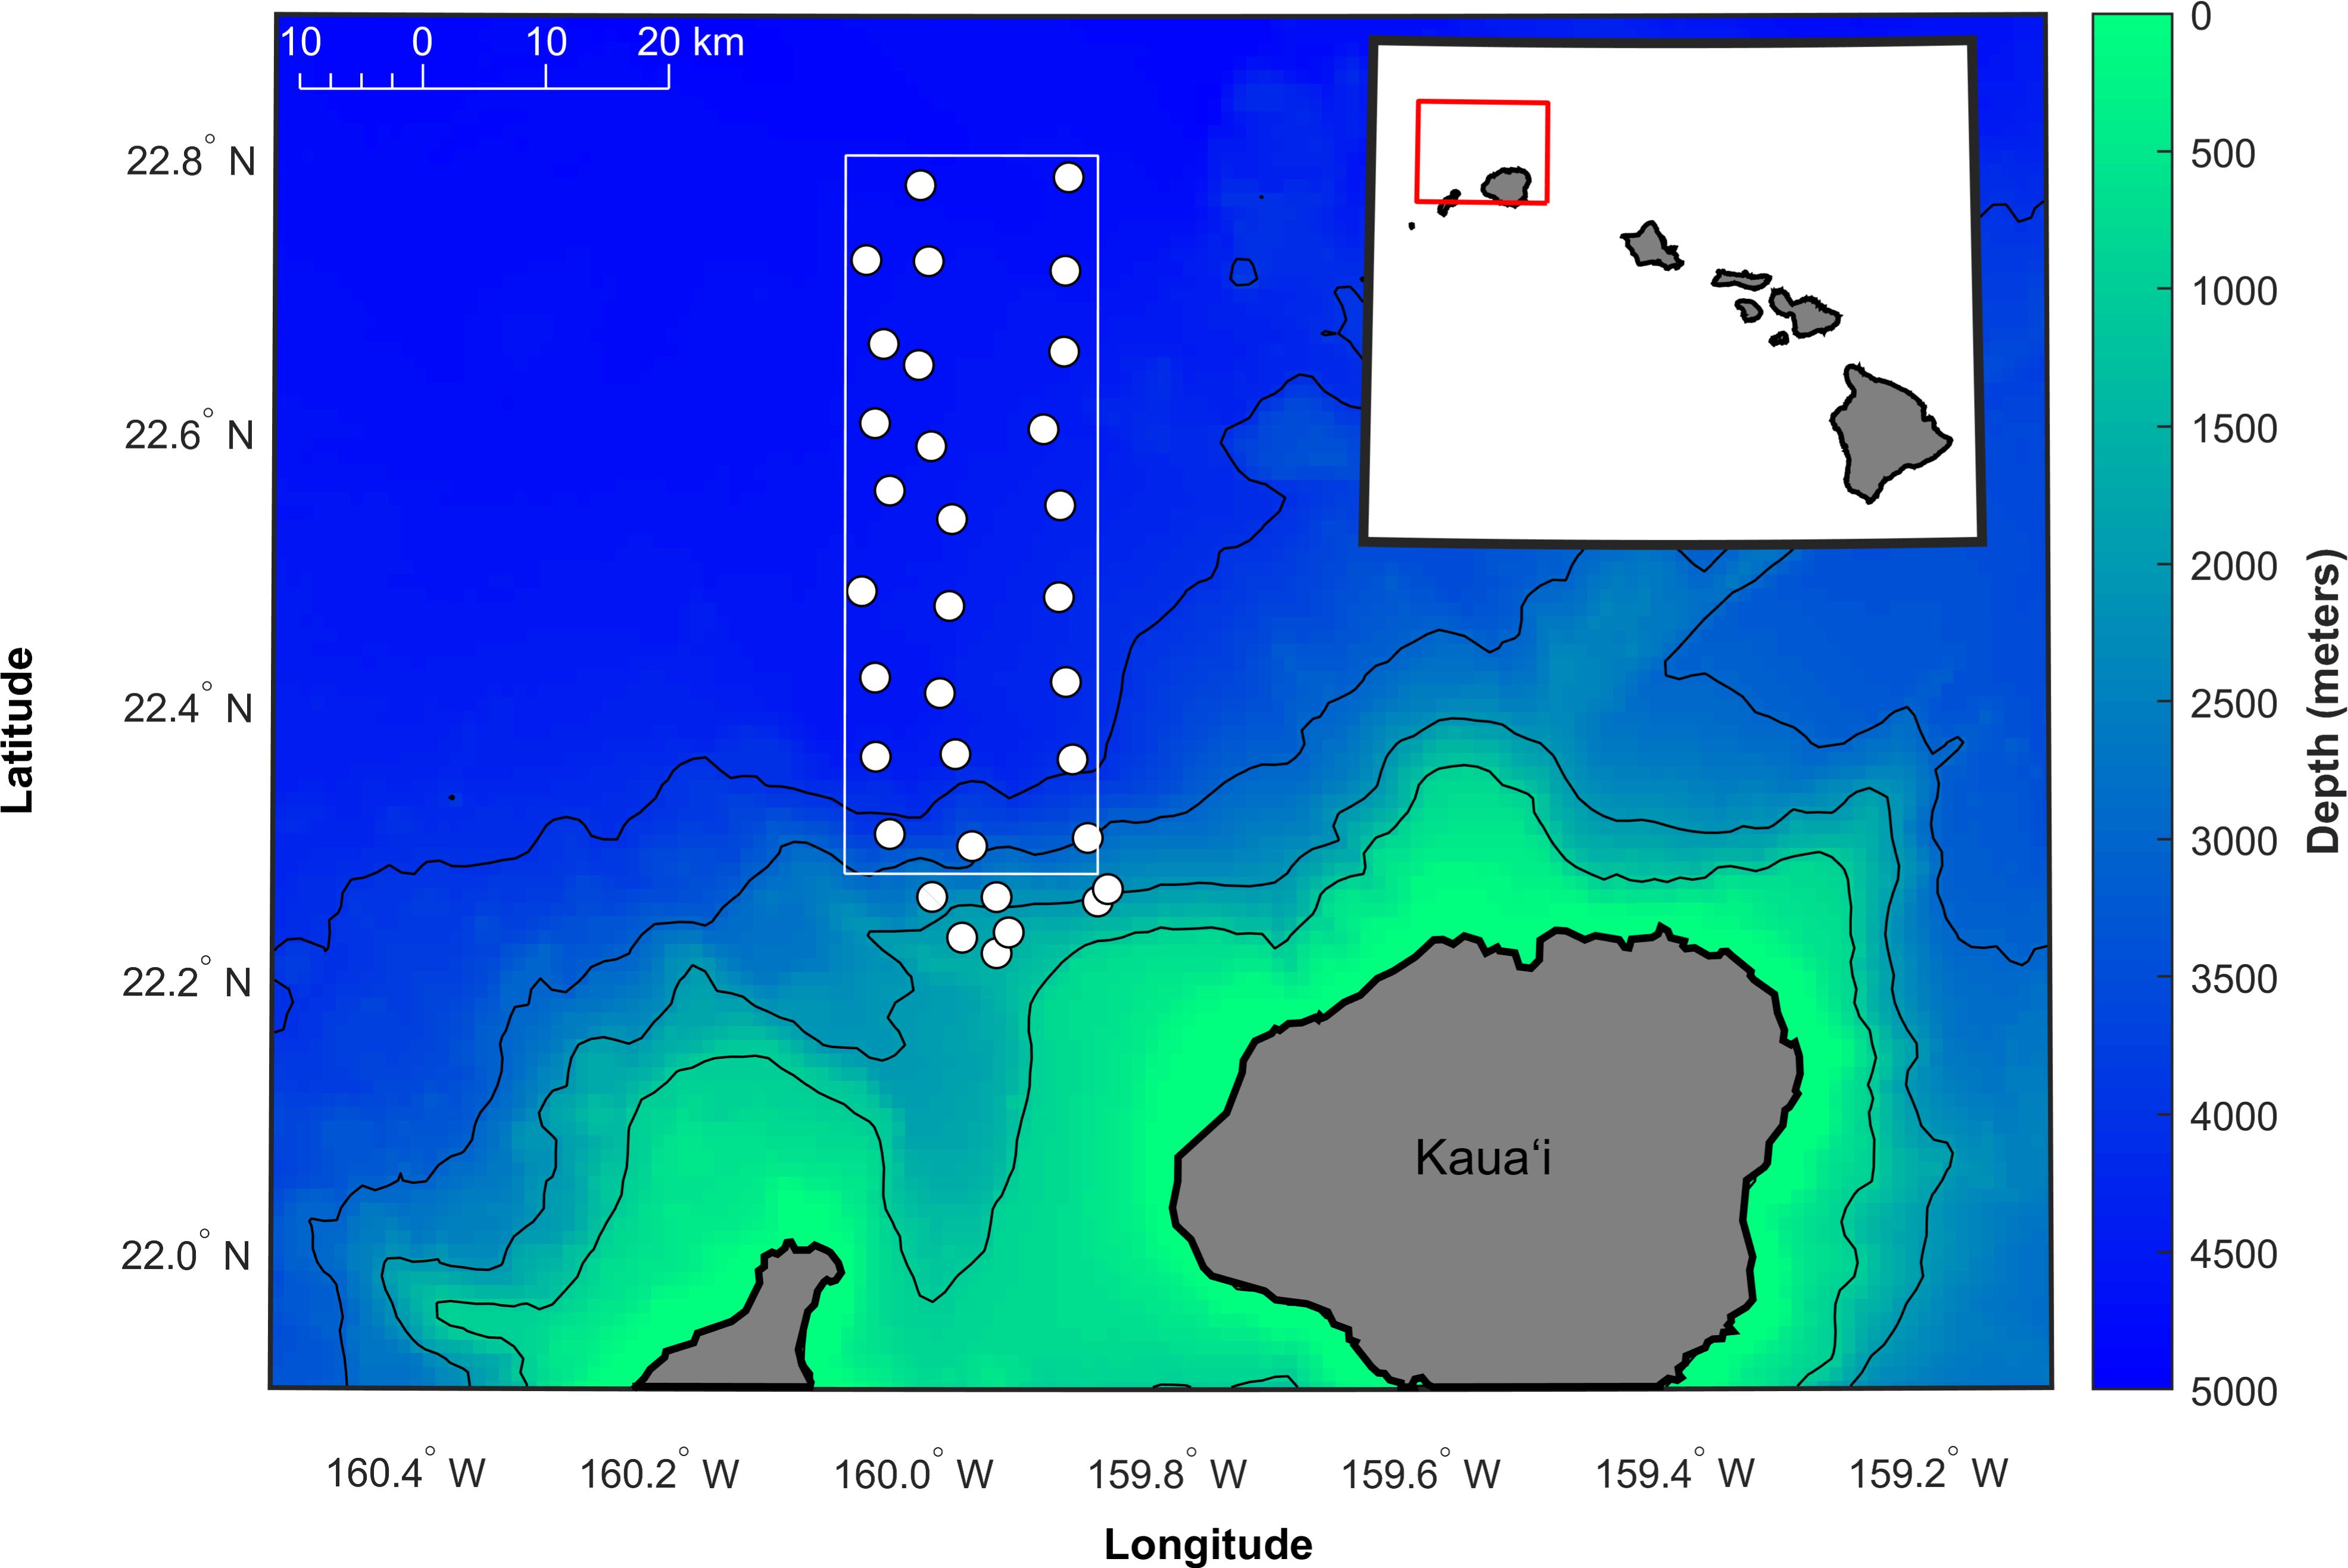
Figure 1. Map of the approximate locations of the 33 hydrophones used in this analysis (circles) at the Pacific Missile Range Facility (PMRF) off Kaua’i, Hawai’i. The study area of the array extends approximately 21 km to the east-west and 58 km to the north-south (boundaries shown by solid white box). Depth contours are every 1,000 m (1 km spatial resolution, Hawai’i Mapping Research Group, The School of Ocean and Earth Science and Technology, the University of Hawai’i at Manoa, http://www.soest.hawaii.edu/hmrg/multibeam/bathymetry.php). The red box in the inset map indicates the mapped area.
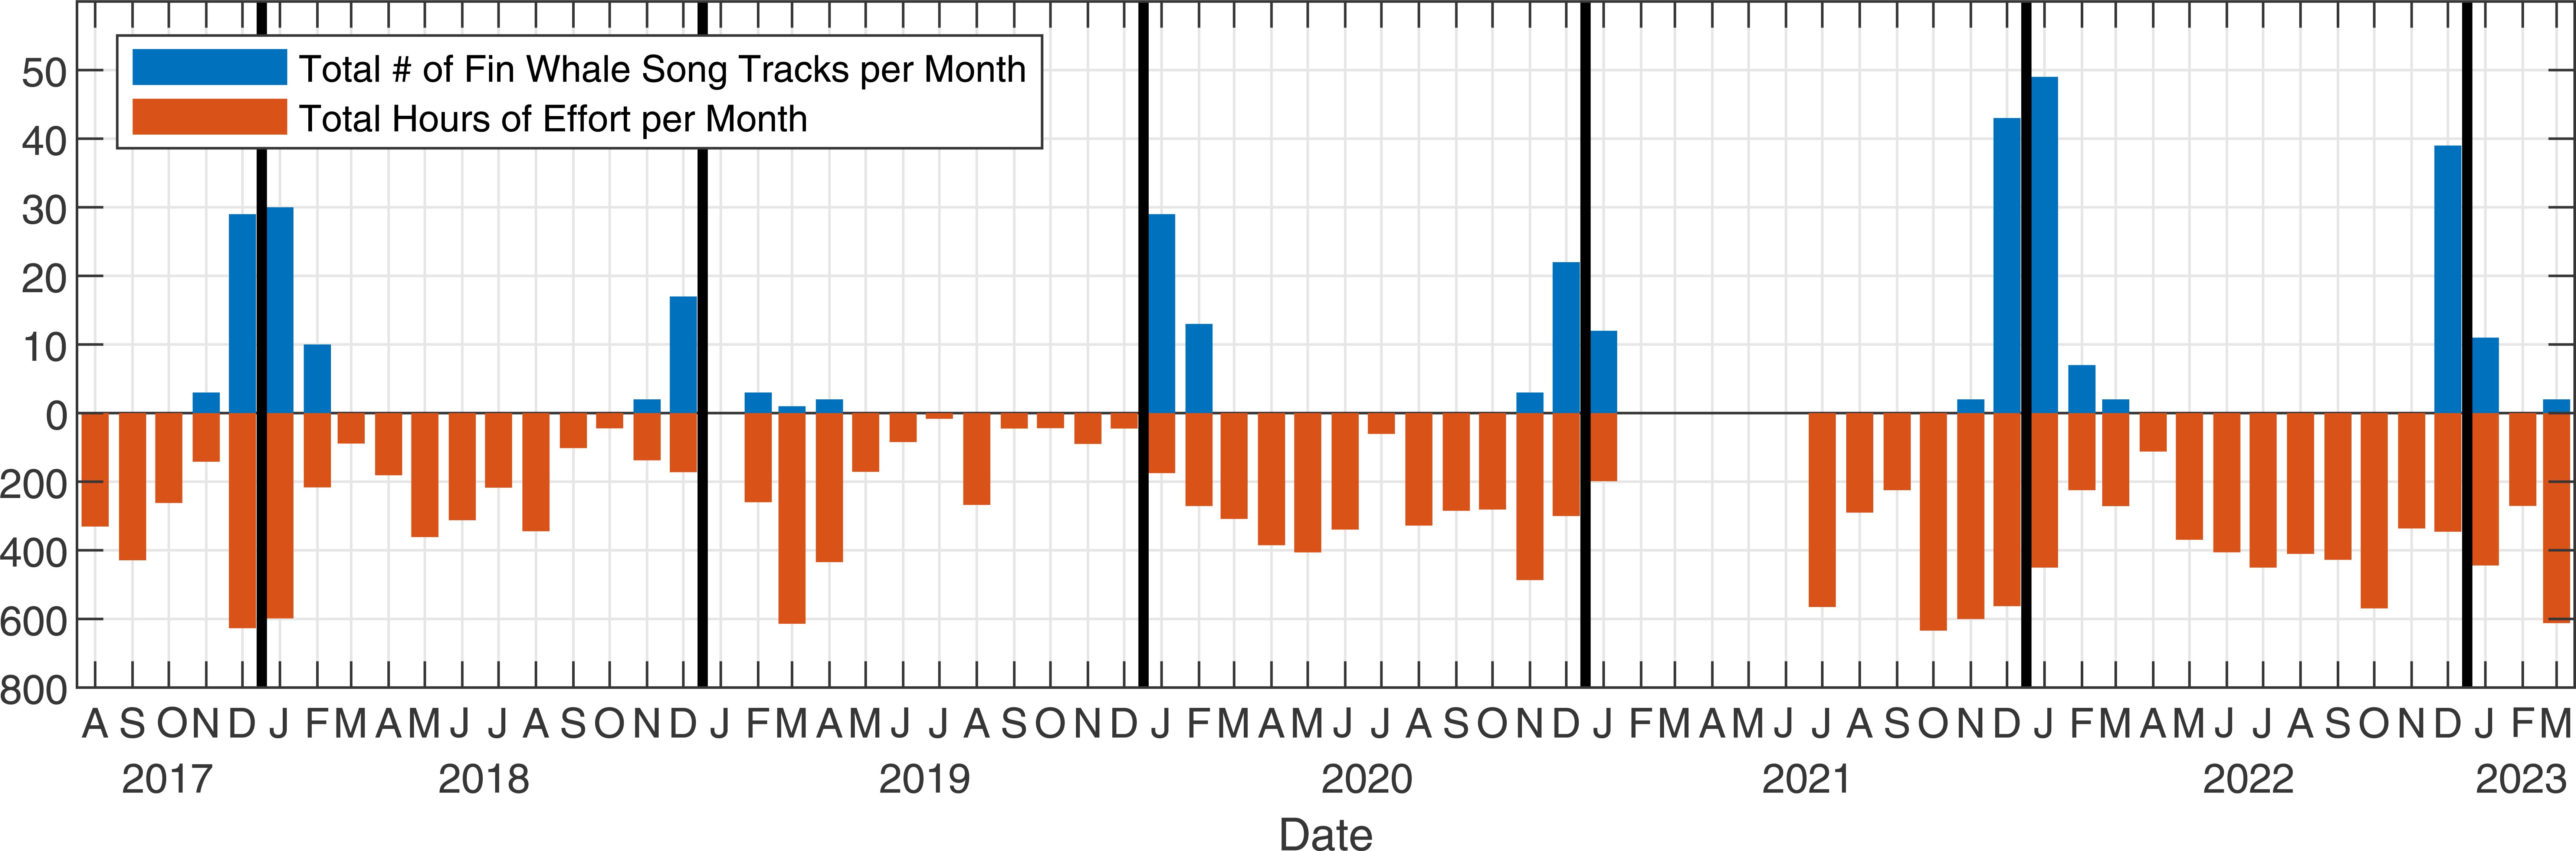
Figure 2. Recording effort in hours per month (orange) and number of fin whale song tracks per month (blue). To be included, fin whale acoustic tracks had to contain at least 100 sequential localized notes within the study area. Note the recording effort gap between February–June 2021 due to equipment failure.
2.2 Detection, localization, and tracking of fin whale notes
The detection, localization, and tracking procedures followed here were very similar to earlier work (e.g. Helble et al., 2015, 2020a, b). However, in this paper, we improved our localization process by increasing the number of hydrophones and the number and configuration of the subarrays. The methods that are identical to our previous publications are outlined below, while those that are unique to this study are described in detail.
The 33 hydrophones were organized into 33 subarrays, with each hydrophone functioning as a primary unit, supported by the four closest hydrophones. Each note was considered localized if it was detected on all hydrophones within a subarray and had a least-squared value (LSQ) of 0.01 or smaller (Helble et al., 2015). Each subarray has the ability to localize fin whale notes within the study area boundary (Figure 1). Subarrays located farthest from the whale’s position typically did not contribute to localizations due to low signal-to-noise ratios (SNRs), which caused the note to be missed on one or more hydrophones, or because the direct path solution was absent, resulting in a poor LSQ value for the localization. However, a typical fin whale note was often localized on multiple subarrays, resulting in duplicate localizations. When duplicate localizations existed, a single localization was retained using the subarray closest to the whale’s location (see Section 2.4). Using all 33 hydrophones and subarrays was necessary to achieve a high probability of detection and localization after the primary hydrophones of the four subarrays used in the 2011–2017 study failed (Helble et al., 2024). Accomplishing this task required additional computing resources and software development, which are discussed in more detail in Section 2.3.
The generalized power-law (GPL) detector (Helble et al., 2012) detected low-frequency signals between 10–50 Hz and was run separately on each of the 33 hydrophones. Templates were created by applying a 4096-point fast Fourier transform (FFT) using a Hamming window and a 87.5% overlap. Each template had a resulting time-frequency resolution of 85.3 ms and 1.46 Hz. Single-note templates were cross-correlated to calculate the time difference of arrival (TDOA) between hydrophone pairs. This technique has been previously applied in other studies of baleen whales on PMRF (e.g. Helble et al., 2016, 2020b; Guazzo et al., 2020; Helble et al., 2020a), and allows for accurate localization of each vocalization. The resulting localizations typically have positional standard deviations of under 60 m (Table 1 and Figure 5 of Helble et al., 2015), which facilitates clear distinction between singing whales separated by more than this distance.
Localized detections were grouped into tracks using a semi-automatic tracker (Klay et al., 2015), allowing for the analysis of individual whale song. Tracking extended well beyond the 21 km by 58 km study area displayed in Figure 1, but only vocalizations within this boundary were considered in the analysis. Restricting tracks to the defined study area ensured that nearly all notes were localized automatically, even under varying noise conditions, and that most notes had sufficient SNRs for accurate estimation of emission times. The tracker required that successive localizations were within 3 km and 40 minutes of each other. Singing fin whales typically vocalize every few seconds during a song bout, with intervals between bouts ranging from 2 to 120 minutes (Watkins et al., 1987). These 3 km and 40 minute thresholds helped cluster notes from a single whale while avoiding the merging of tracks from different individuals, although longer gaps in singing were unable to be linked. The total number of tracks in this study is an estimate of the number of individual fin whale encounters and does not necessarily represent unique whales.
2.3 Improvements to computer processing using Raven-X
The Raven-X software package was originally developed in 2016 (Dugan et al., 2016) and has been modified over the years for efficient execution of data mining algorithms on large collections of audio files. Developed in MATLAB (The MathWorks Inc., 2024), it leverages various toolboxes to provide a scalable solution capable of running on systems ranging from single laptops to large distributed server farms. A variety of machine learning and data mining tools have been implemented in Raven-X (Dugan et al., 2010a, b; Pourhomayoun et al., 2013a; Risch et al., 2013; Pourhomayoun et al., 2013b) including a popular approach for ambient sound analysis (Martin et al., 2021; Miksis-Olds et al., 2021).
Due to the nature of the data format (uncompressed audio often spanning days), the detection phase requires substantial memory and disk space. In addition, the recordings used two data-acquisition boards with separate clocks and the detections needed to be time-synchronized for localization. A customized package was added to Raven-X to allow the software to read these audio formats directly, preserving both sample and time fidelity.
In this study, each year of acoustic data was treated as a large, complex collection of sounds, subdivided into smaller Raven-X projects for manageability (Dugan et al., 2013). Raven-X achieves scalability by distributing a simple linear time-invariant (LTI) model across multiple CPUs (Dugan et al., 2014, 2015), enabling concurrent processing of multiple hours of audio and significantly reducing runtime (Dugan et al., 2013).
The audio stream was divided into one-hour blocks, each encapsulated in a date-time packet. Standard parallel processing routines were used to distribute these blocks across available CPU cores, with overlapping one-hour blocks to allow for detection of notes that extended across hour boundaries. Memory was managed individually for each core to maintain efficiency.
To manage system complexity, end-to-end processing was executed through a serialized pipeline. The GPL detection process was performed first using a parallel data mining instance, with each core responsible for a single hour of data at a time (Dugan et al., 2015). This process yielded a comprehensive set of detection reports and metadata. These outputs were aggregated and parallel processing continued with cross-correlation and localization (Dugan et al., 2013). Separate cores handled hydrophone pair cross-correlations and subarray localization tasks, maximizing computational efficiency.
We used a Supermicro X10DRi server equipped with two Xeon E5–2695 CPUs (2.10 GHz, 18 cores each) and 64 GB of RAM for this analysis. The raw acoustic data set totaled 42.2 TB and was accessed through a NEXSAN BEAST High-Density Storage system. The detection phase required approximately one month of processing time, followed by an additional month for cross-correlation and localization. Without the scalability and job management capabilities of Raven-X combined with the high-computing power of this system, processing a dataset of this magnitude would likely be prohibitively time-consuming.
2.4 Fin whale song analysis
This fin whale song analysis closely follows the methodologies described in Helble et al. (2020a) and Guazzo et al. (2024). For brevity, methods are summarized here; detailed descriptions can be found in those previous publications.
The study area was bounded by the white box drawn in Figure 1, which is defined by the longitude limits of 160.05°W and 159.85°W and the latitude limits of 22.275°N and 22.8°N. For each track, the longest continuous segment of localizations within the study area was kept for the song analysis. If the longest continuous segment did not have at least 100 notes, the track was discarded. Time of emission (TOE) was calculated for each note using:
where TOA is the time of arrival of the note on the primary hydrophone in the subarray as calculated by GPL, r is the slant range between the whale’s location and the hydrophone with the whale assumed to be at 30 m depth, and c is the assumed sound speed which in this case was 1,500 m/s. If multiple localizations along a track had TOEs within 4 s of each other, the detection from the closest subarray was kept. In practice, TOEs from duplicates due to multiple arrays were well within 1 s of each other, and fin whales rarely sing with INIs less than 10 s, and so eliminating duplicate detections was straightforward.
The INIs between successive notes in a track were calculated by subtracting their TOEs, and average values presented here are rounded to the nearest second:
Due to the high accuracy of both r/c (positional standard deviation of 60 m, see Helble et al., 2015) and TOA values in a variety of noise conditions (≤100 ms, see Helble et al., 2012), presenting INIs to the nearest second is appropriate. For a full discussion about sources of error, see section 2.3 in Helble et al. (2020a).
An automated classifier categorized each note localized along the track as either an A or B note based on the energy distribution across the different frequency bins (as in Helble et al., 2020a). Specifically, the sum of the GPL note template over the 10–23 Hz band was divided by the sum of the template over the 10–50 Hz band. If the proportion of energy in the lower band exceeded 0.83, then the note was categorized as an A note, otherwise the note was categorized as B (see Figure 3 in Helble et al., 2020a).
An analyst manually classified each track as being fin song or not by examining the GPL note templates and INIs. To be classified as fin song, the tracks had to consist entirely of A and/or B notes.
The peak INIs were estimated for each track. First, the INI was measured between each pair of notes by measuring the time between the start of the first note to the start of the next note. Intervals between subsequent notes were only counted as INIs if the value was less than 60 s. If the track contained at least 20 instances of a note type pairing (A-A, B-B, A-B, B-A), the peak(s) were estimated in the same way as Helble et al. (2020a) and Guazzo et al. (2024). Briefly, both single-term and two-term models were fit to the distribution of INIs, binned in 1-second bins. The single-term model was always used for A-B and B-A INIs since these patterns are inherently doublets, while for A-A and B-B INIs, the model with the least uncertainty was selected by comparing the 95% confidence interval widths of the coefficients. Please note that this method of selecting the single-term model for A-B and B-A INIs is the same as Guazzo et al. (2024) and different from Helble et al. (2020a). When the full 12 year dataset results are presented here, the peaks from 2011–2017 were recalculated using this updated method. The peaks of the models and the widths of those distributions at half the height of the peaks are reported (see Figure 4 in Helble et al., 2020a). This method is an objective and consistent way of determining if the note type pairing occurred in a singlet (single peak) or doublet (two peak) pattern for each track.
Linear models were fit to the peak INIs for each note type pairing to determine any changes across tracks over interannual timescales. For doublets, models were separately fit to the lower peak and upper peak from each track. We concluded that the INI changed over time if the 95% confidence interval of the slope did not include zero.
Cue rates were calculated by dividing the total number of notes in a track by the total elapsed time. The along-track cue rate is the vocalization rate of an individual whale while it is vocally active, which is defined in this case as a period of singing with no gaps greater than 40 min (see tracking parameters in Section 2.2). This cue rate is not the total population cue rate which would include non-vocalizing whales and times when whales were not vocally active. The along-track cue rate was calculated using the number of detected and localized notes, not corrected for probability of localization.
A subset of tracks were manually validated to determine the note false positive rate, misclassification rate, and miss rate. Here miss rate includes vocalizations missed at any of the steps in the data processing sequence (detection, localization, or tracking). A total of 50 tracks (15%) were manually validated. Three continuous recording periods were manually validated containing 20 tracks, and the remaining 30 tracks were randomly selected from the total. The 15% validated was chosen to balance the effort needed for manual validation while including enough tracks to ensure accurate false positive, misclassification, and miss rates. The start time and end time of the localized notes for the fin whale tracks were imported into the Raven Pro software package (Center for Conservation Bioacoustics, 2019) as selection tables, along with the corresponding spectrograms of the audio from the four closest hydrophones to the vocalizing whale. An analyst manually validated the notes in the track by adding missed notes, removing false detections, and changing the note type for misclassified notes. Signal arrival time patterns across the selected hydrophones, as well as arrival times of localized notes from other nearby tracks, were used to differentiate between fin whales singing at the same time. An additional 48 tracks that were not selected for validation but had INI patterns that did not follow a consistent pattern were spot checked to verify fin whale song (i.e., made of A and/or B notes). In practice, the automated detection, localization, and classification process performed well. Four tracks were removed (1 from the subset selected for manual validation, 3 from the subset spot checked for fin song) because they did not contain fin whale song. Of the 49 remaining tracks that were manually validated, the note false positive rate was 0.3%, the misclassification rate was 2.6%, and the miss rate was 6.2%.
3 Results
Between August 2017 and March 2023, a total of 793 days of recordings were collected on 33 hydrophones on PMRF. Notes were automatically detected, localized, and grouped into 331 fin whale song tracks containing 130,402 unique A and B notes and having a total duration of 997 hours. Fin whale song tracks were only present from late fall to early spring even though there was recording effort year-round (Figure 2). These tracks lasted a median of 2.4 hours (Q1 = 1.6, Q3 = 3.8). A and B notes were arranged in five different singlet and doublet INI patterns (A-A singlet, A-A doublet, B-B singlet, B-B doublet, and A-B doublet; Table 1). The majority of tracks (240, 72.5%) contained multiple song patterns, usually interwoven throughout the recording.
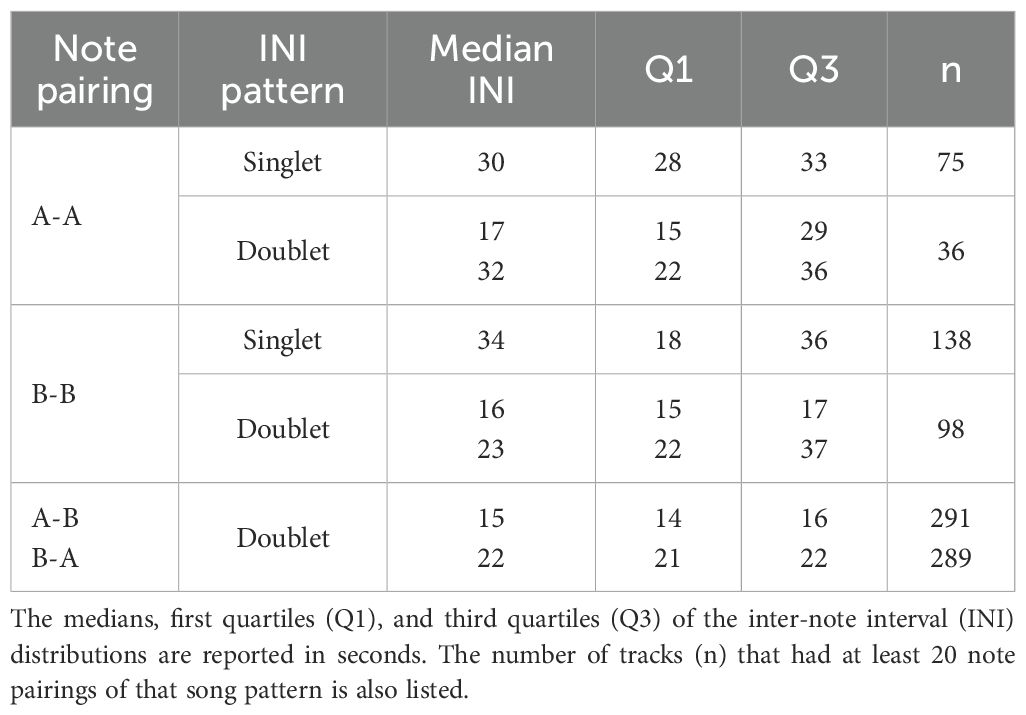
Table 1. Fin whale song patterns observed on the Navy’s Pacific Missile Range Facility (PMRF) off Kaua’i, Hawai’i.
Two example fin whale song tracks are presented (Figures 3 and 4). The first track shows a fin whale singing with primarily A-B doublet song (Figure 3). The peak INI for the A-B pairing was 16 s and the peak INI for the B-A pairing was 22 s. This fin whale was tracked for a total duration of 2.3 h. The track contained 379 notes and was composed of approximately 48% A-B pairings, 48% B-A pairings, 3% B-B pairings, and less than 1% A-A pairings.
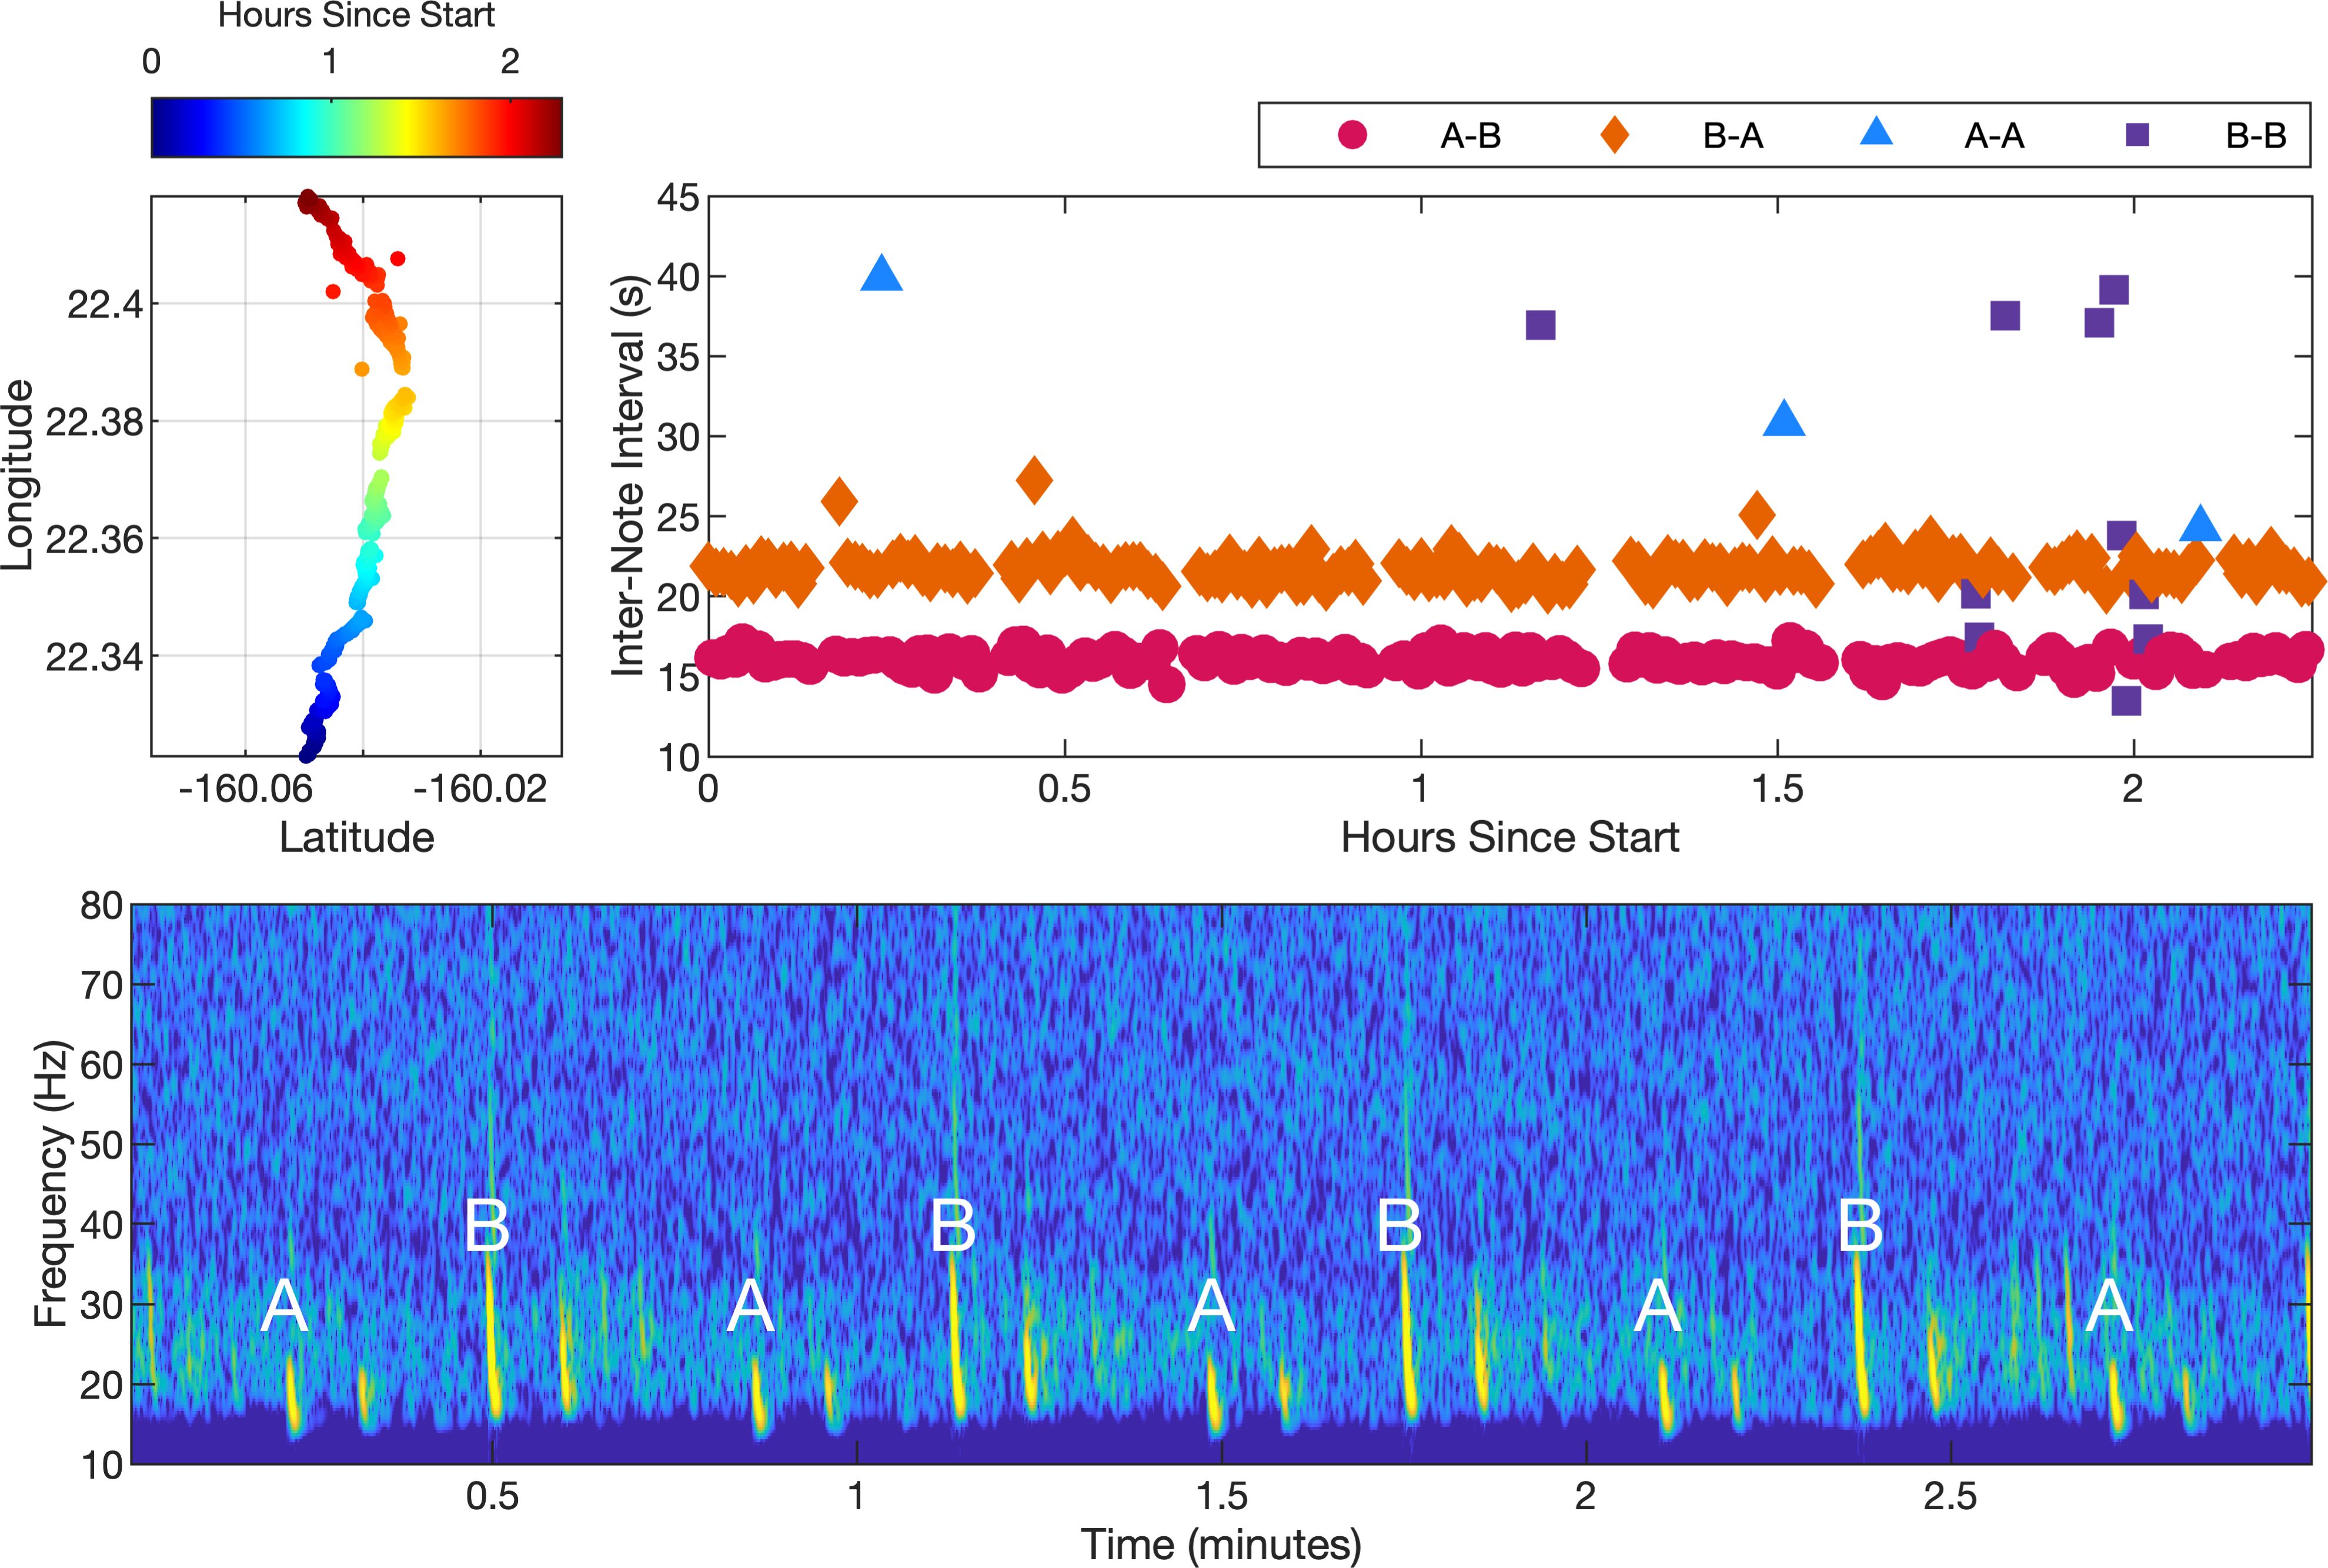
Figure 3. A fin whale song track containing primarily A-B doublet song starting at 16:23:42 UTC on 20 January 2023. The upper-left plot shows the coordinates of the track with the color indicating the elapsed time since the start of the track. The whale transited a distance of 10.6 km from south to north over 2.3 hours. The spectrogram shown in the lower plot illustrates a typical 3 min segment of the track. A multipath arrival can also be seen for each direct path arrival. The notes were recorded at a 6 kHz sampling rate. A 4096-point fast Fourier transform (FFT) with a Hanning window and 87.5% overlap was used to create the spectrogram. The INI for each note along the track is shown in the upper-right plot, with each pairing type noted by color and shape.
The second example track shows a fin whale singing with primarily B-B doublet song (Figure 4). The two INIs for the B-B doublet pairing were 17 s and 38 s. Although less prominent, A-B doublet song was also interwoven along the track, with peak INIs of 16 s for the A-B pairing and 22 s for the B-A pairing. This fin whale was tracked for a total duration of 3.1 h. The track contained 525 notes and was composed of approximately 8% A-B pairings, 8% B-A pairings, 83% B-B pairings, and less than 1% A-A pairings. As illustrated in the spectrogram of this track, when an A note occurred in a B-B dominant track, it often had a lower received level than the surrounding B notes, which was different from the received level for A notes during A-B dominant song. The implications of this are discussed further in Section 4.
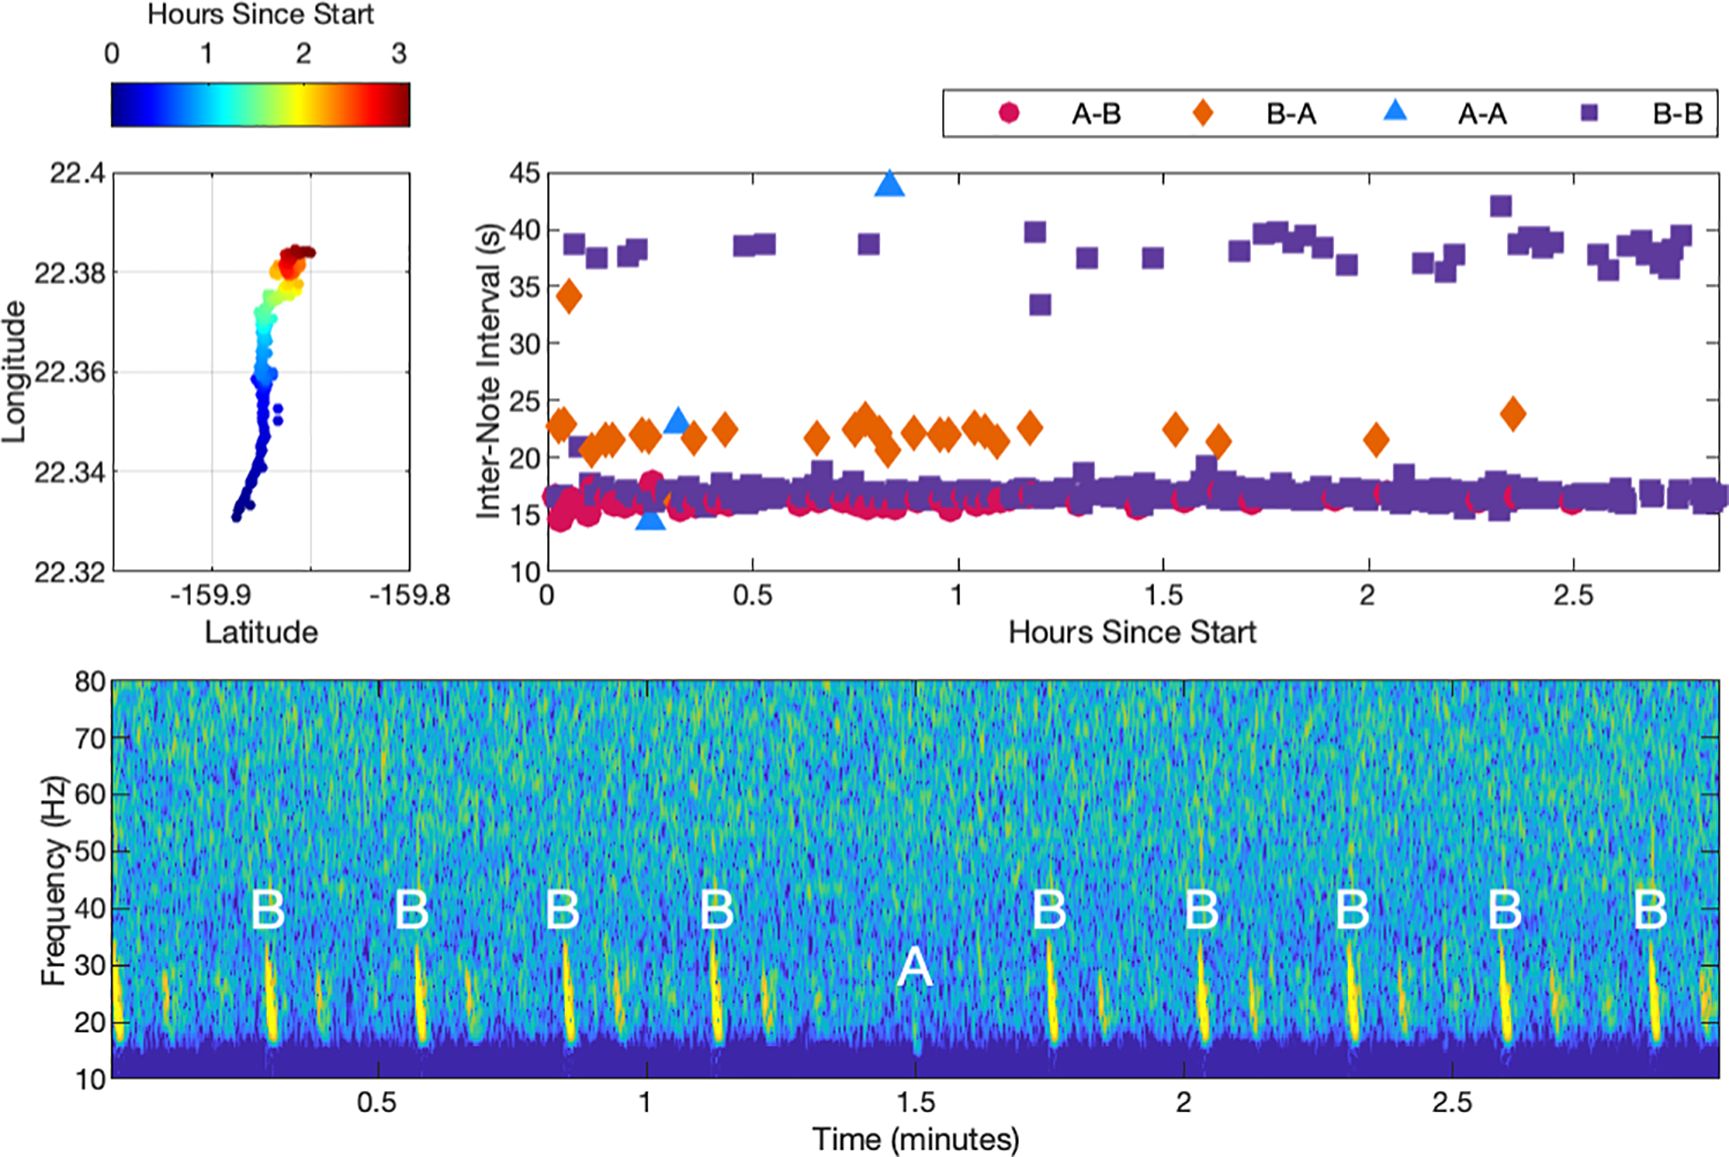
Figure 4. A fin whale song track containing primarily B-B doublet song starting at 11:36:32 UTC on 9 December 2022. The upper-left plot shows the coordinates of the track with the color indicating the elapsed time since the start of the track. The whale transited a distance of 7.0 km from south to north over 3 hours. The corresponding INIs are shown to the right of the track, with each pairing type noted by color and shape. The spectrogram highlights the occurrence of a weak A note in the series of B-B song, which is characteristic of some tracks with B-B song.
The INIs for each song pattern were generally stable within each track with clear, narrow peaks in the INI distributions (Figure 5; Supplementary Figures S1–S3). Within a season, INIs between tracks were consistent, but over longer time scales, the A-B doublet INIs increased. The slope for the A-B INI was 0.3 s/year across the 2017–2023 dataset (95% CI[0.2,0.5]) and 0.5 s/year across the combined 2011–2023 dataset (95% CI[0.4,0.5]). The slope for the B-A INI was 0.3 s/year (95% CI[0.2,0.4]) across the combined 2011–2023 dataset. The 95% CI of the slope for the B-A INI included 0 across the more recent 2017–2023 dataset signifying that the slope was not significantly different from zero at the 5% confidence level. Since the A-B INI is less than the B-A INI but had a greater slope, the INIs were more similar in 2023 than they were during the earlier years of this dataset. There were no clear overall trends in the A-A or B-B singlet or doublet song patterns. A-A doublets and the upper B-B doublet INI patterns had the most variability with the largest interquartile ranges (Table 1). The other song patterns had small interquartile ranges despite the trends over time for A-B doublets.
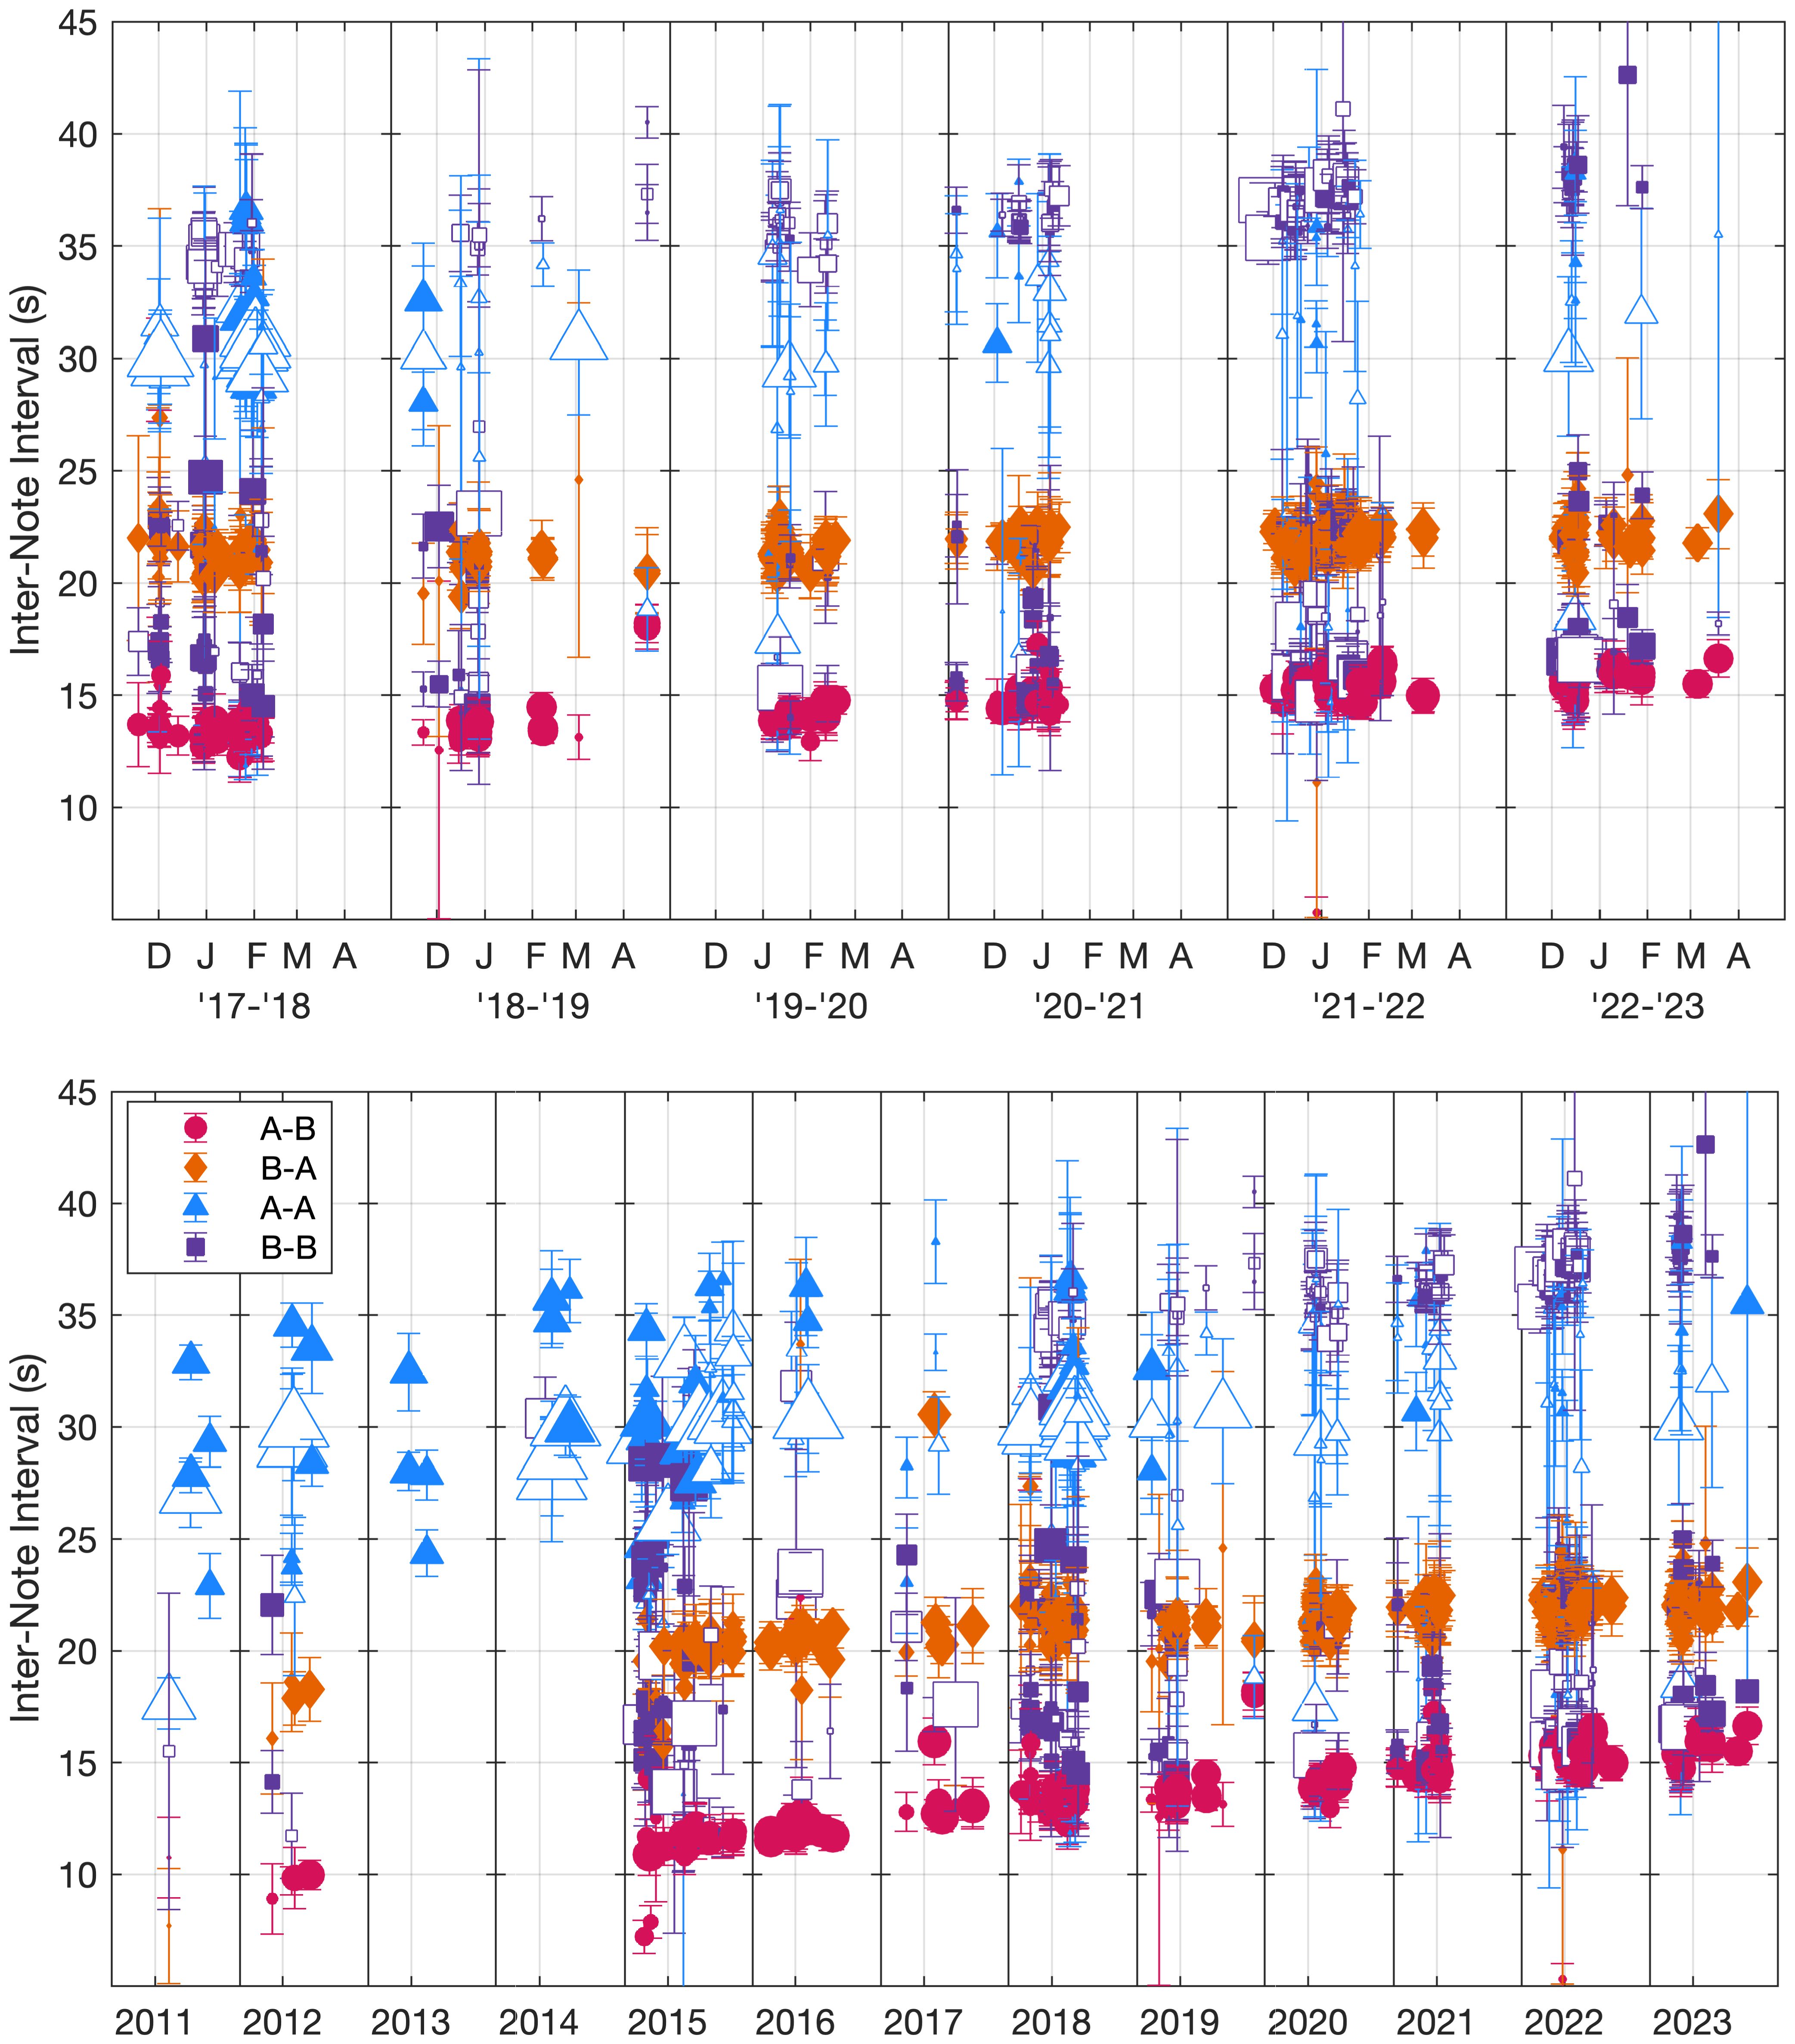
Figure 5. Peak inter-note interval (INI) values for each note pairing type in each track plotted as a function of time (2017–2023 plotted on top, 2011–2023 plotted below). Singlet (open markers) and doublet (filled markers) peaks are the maxima of the fitted Gaussian models with the width of each INI peak shown as error bars. The size of the marker indicates the proportion of the track that was that note type pairing (with at least 20 instances required to be plotted). As a reference, when only A-B doublet song is present, the size of the A-B and B-A markers is at their maximum which represents 50%. INIs greater than 60 s were not included in these calculations. See Supplementary Figures S1–S3 for more details.
The most common song type was A-B doublet. A total of 73% of tracks (240 tracks) contained multiple song patterns of at least 20 note pairings each (Figure 6). The 331 total tracks consisted of approximately 8% A-A pairings, 26% B-B pairings, 33% A-B pairings, and 32% B-A pairings. Every song season, the majority of tracks were dominated by A-B/B-A note pairings (i.e., A-B and B-A combined made up more than 50% of the note pairings in more than half of the tracks). The largest percentage of tracks that were A-A dominant was 24% in 2017–2018, and the largest percentage of tracks that were B-B dominant was 35% in 2022–2023.
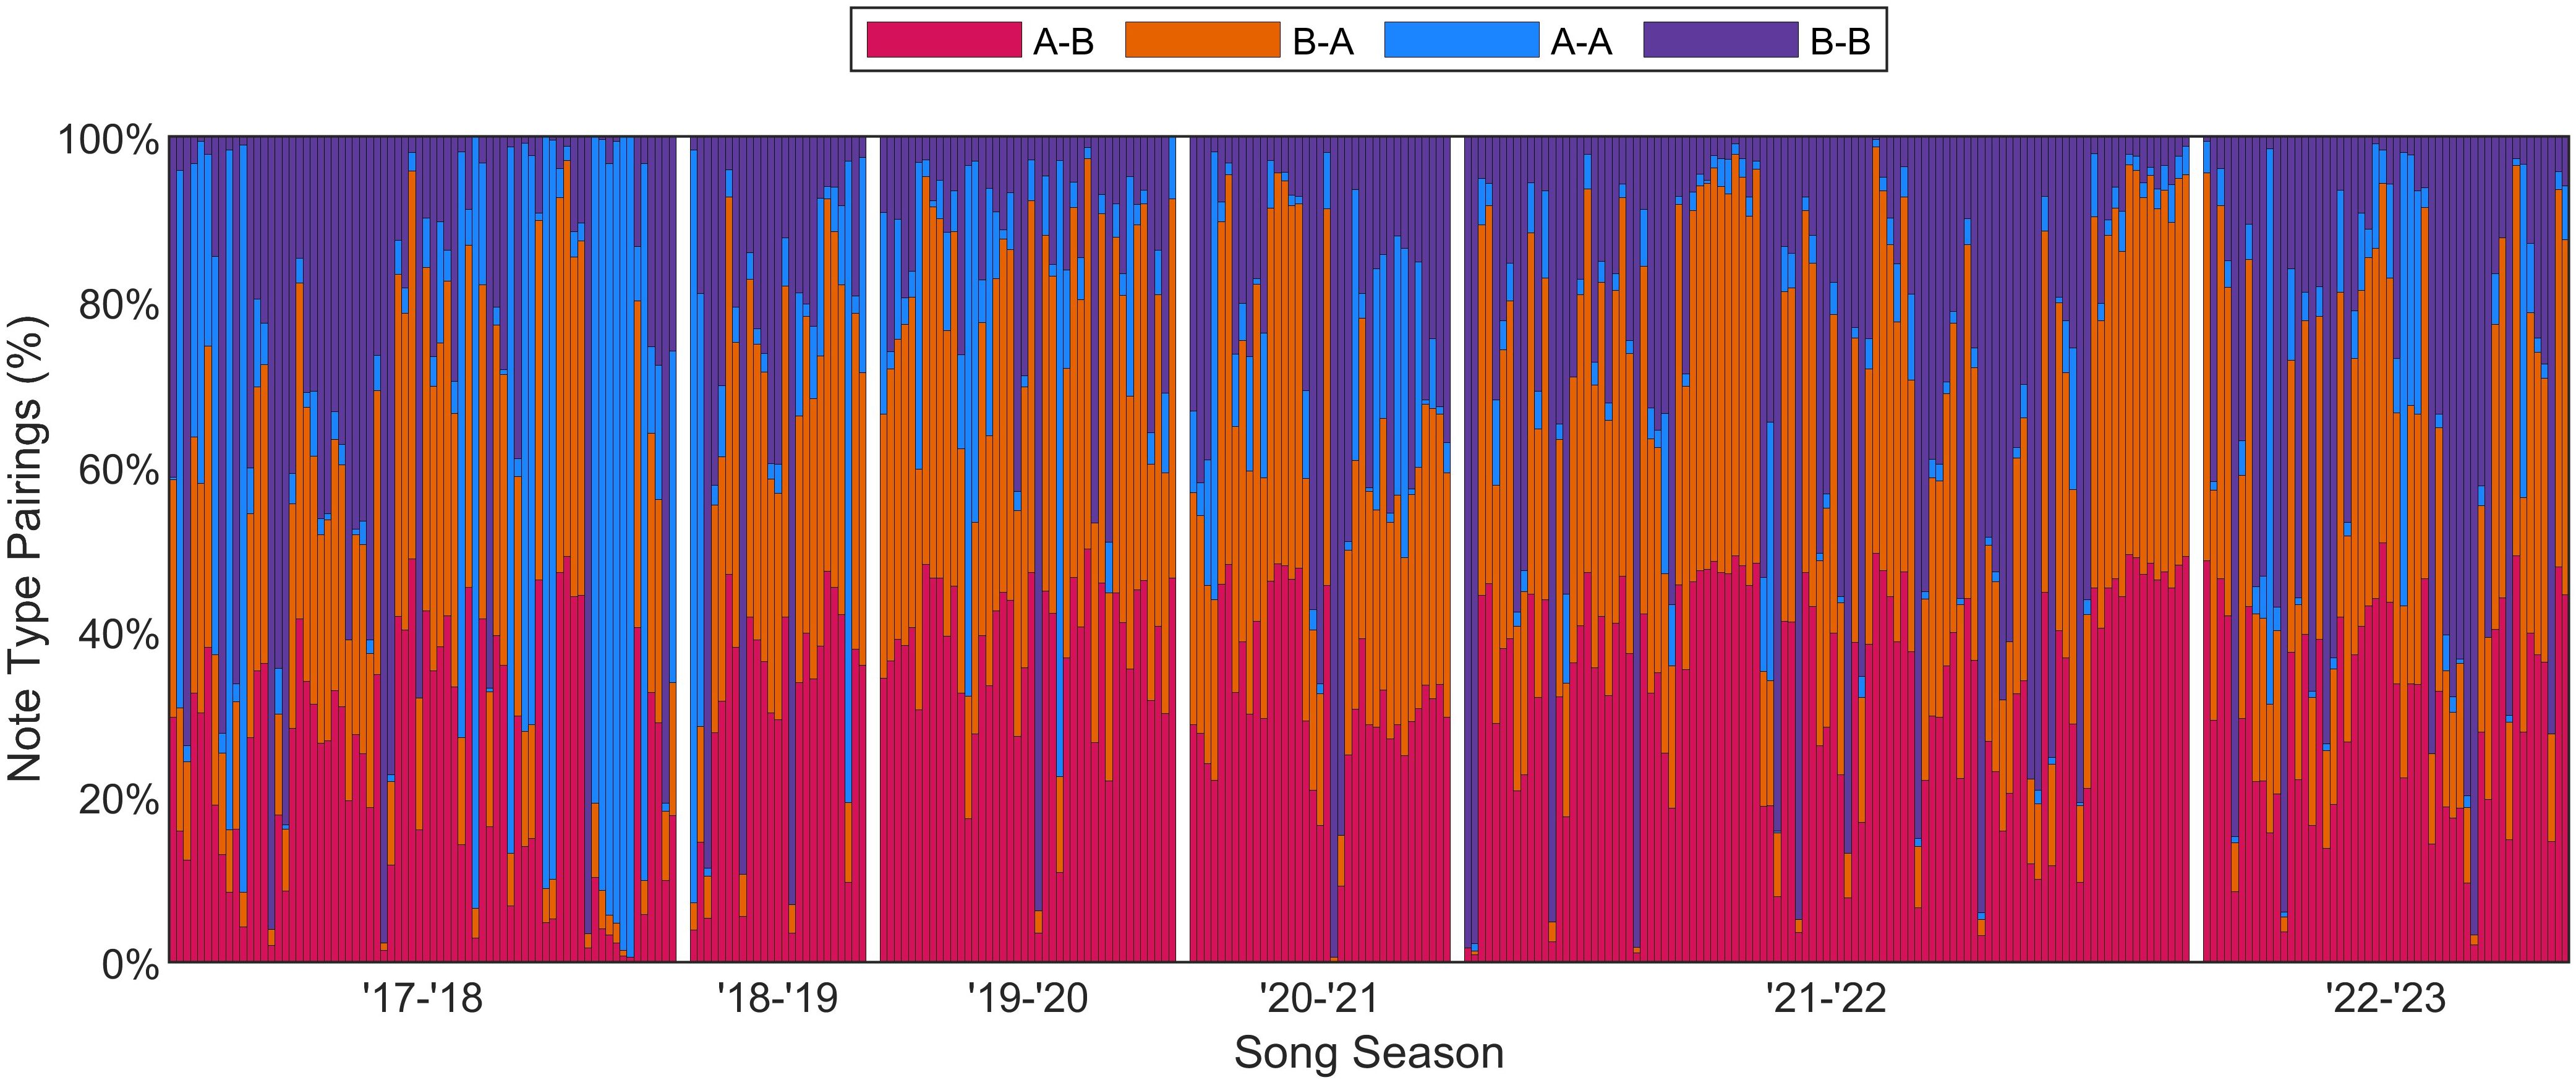
Figure 6. Percentage of different note pairings for each of the 331 fin whale tracks, spanning 2017–2023. Doublet and singlet songs are not differentiated in this plot. The tracks were seasonal and only occurred from November–April; each bar represents a track and white bars separate each season.
The along-track cue rate was variable between tracks (Figure 7). The median along-track cue rate for all 331 tracks was 134 notes/hour (Q1 = 106, Q3 = 153). Cue rate ranged from a minimum of 32 notes/hour to a maximum of 192 notes/hour. These values are based on the number of localized notes and are not corrected for miss rate (6.2%).
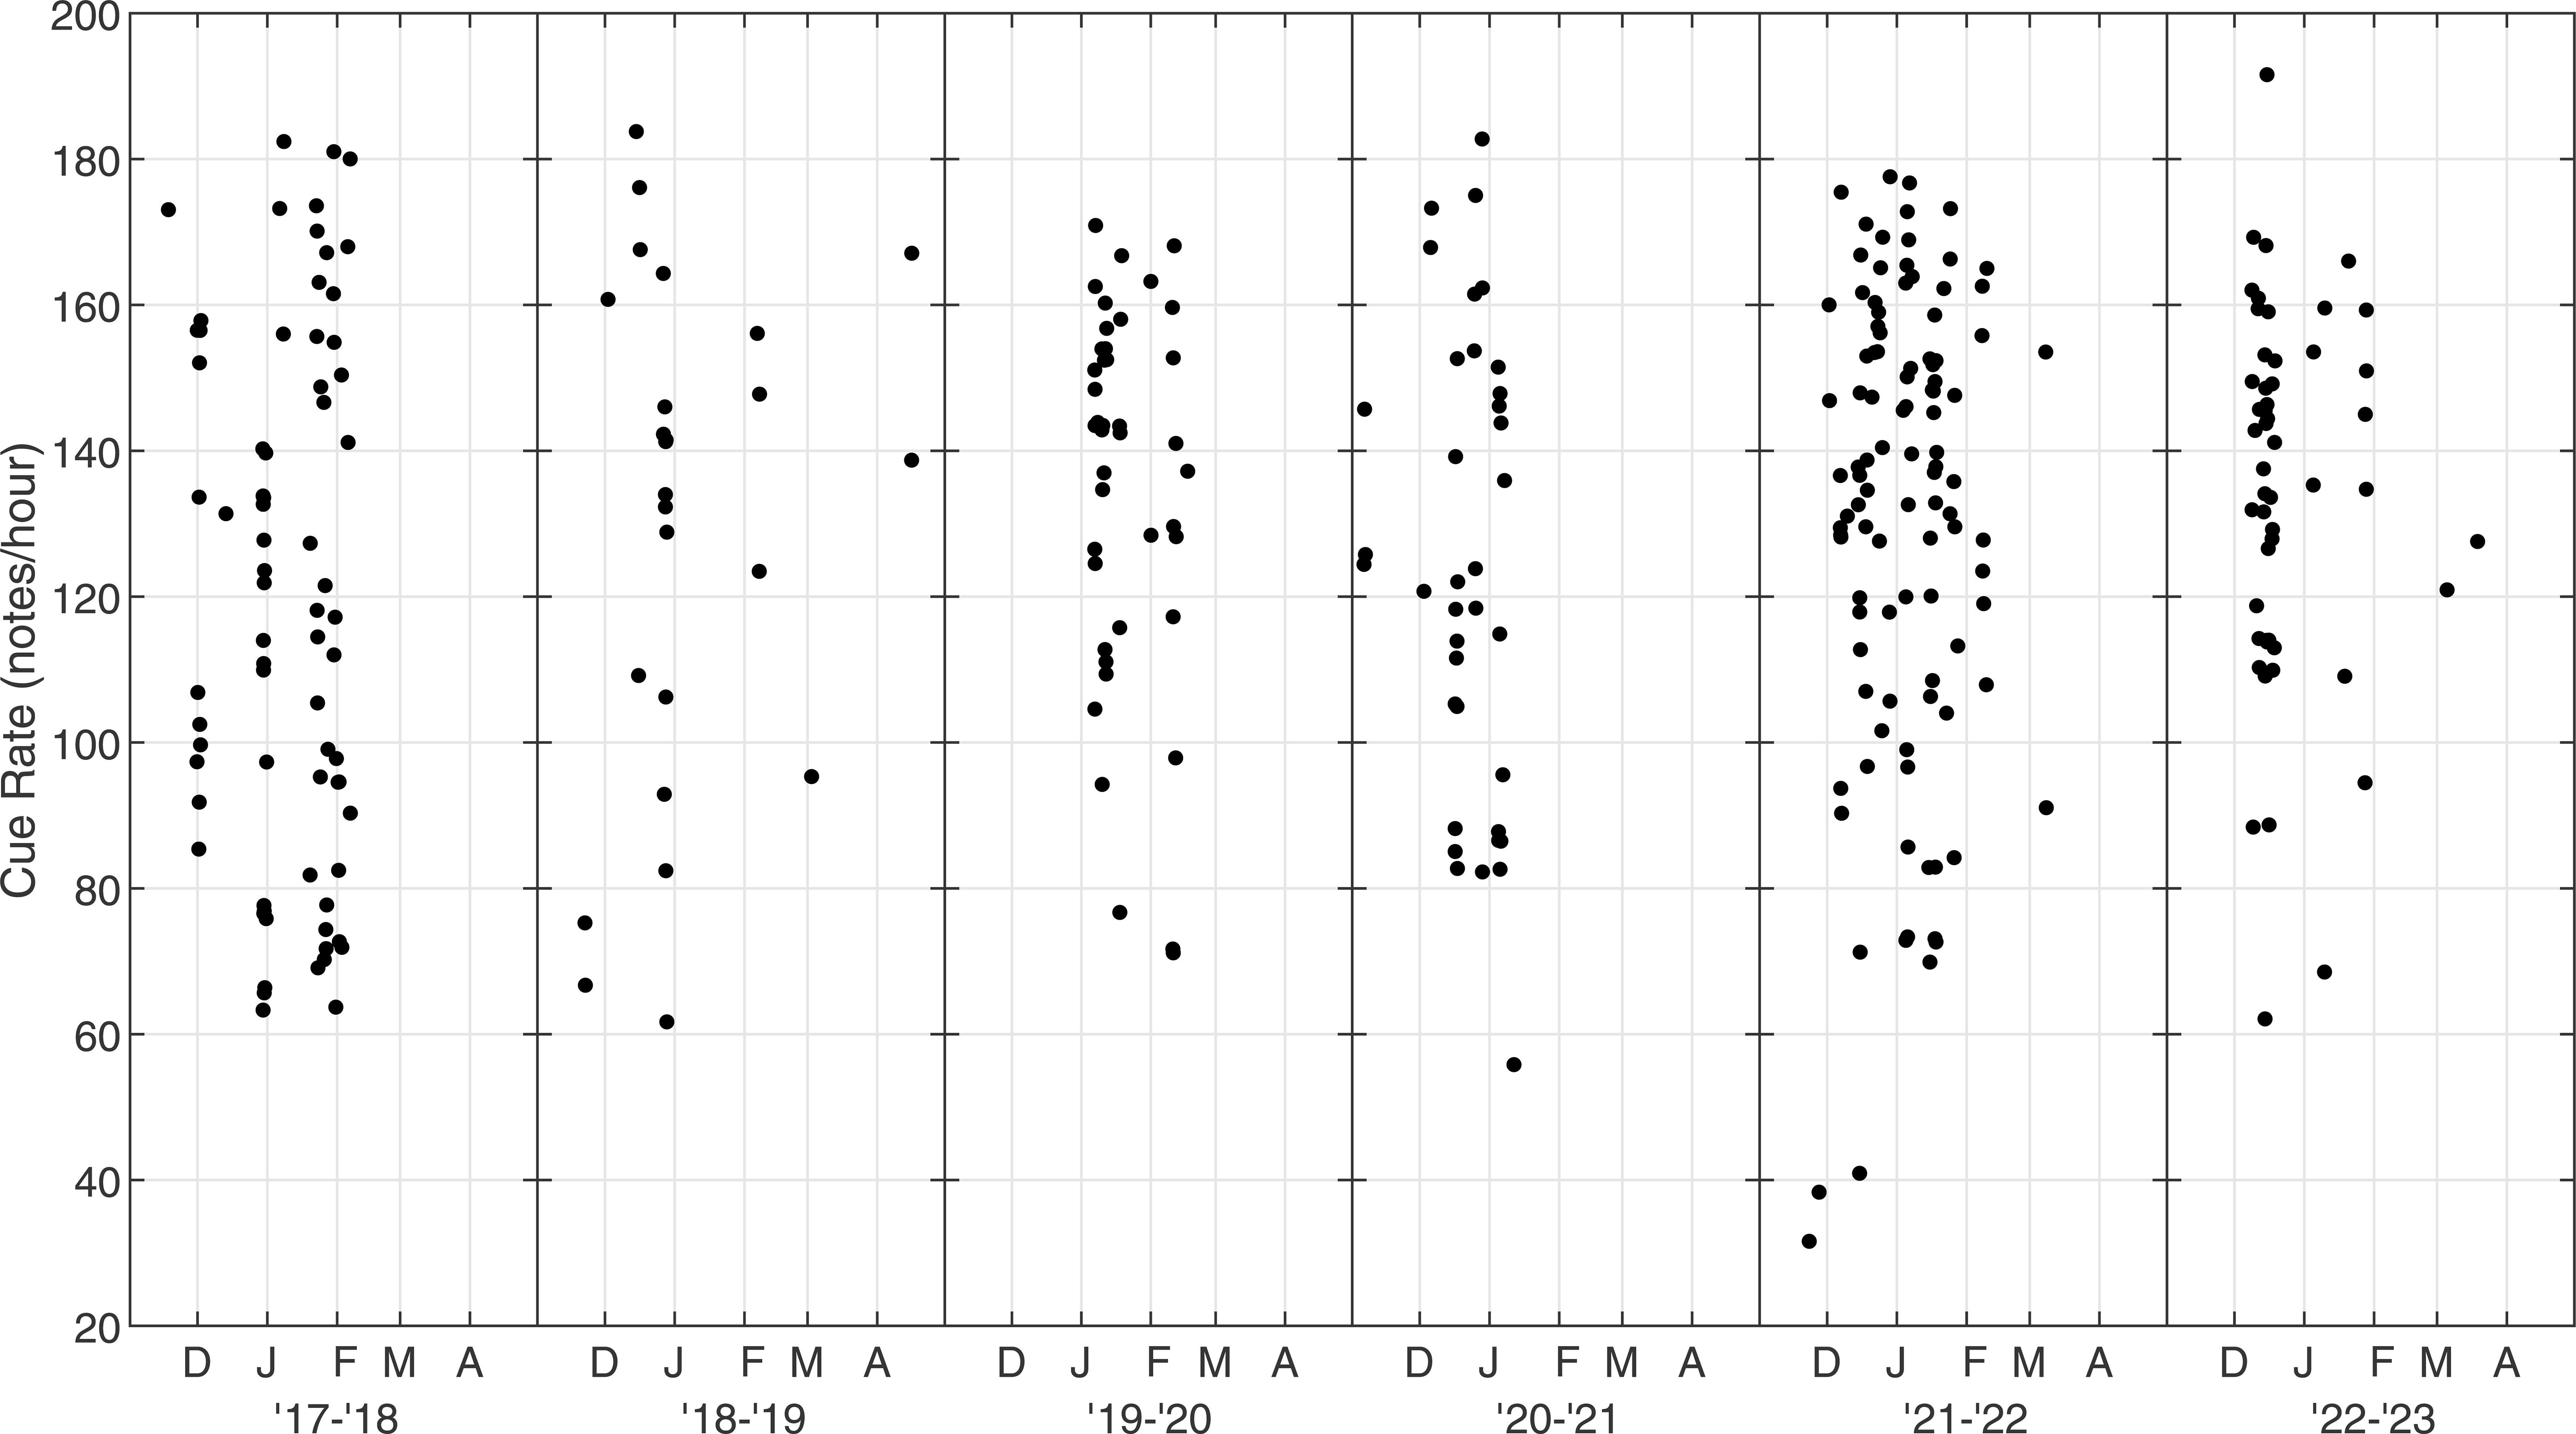
Figure 7. Along-track cue rate for fin whales on the Navy’s Pacific Missile Range Facility (PMRF) as a function of time. Cue rate was calculated as number of notes in a track divided by the total elapsed time of the track and is in units of notes/hour. Each season is plotted from November to May based on the earliest and latest fin whale detections.
4 Discussion
Vocalizing fin whales in Hawaiian waters continued to produce complex songs that demonstrate a gradual but persistent lengthening of the INIs in the A-B doublet song. INIs have increased in fin whale song worldwide, over both intra- and inter-annual timescales (e.g. Watkins et al., 1987; Morano et al., 2012; Oleson et al., 2014; Širović et al., 2017; Weirathmueller et al., 2017; Best et al., 2022; Romagosa et al., 2024; Guazzo et al., 2024). In this study, the A-B and B-A INIs lengthened at different rates, so the intervals became more similar over time. When analyzing the 2011–2017 period, the slope of the B-A INI was greater than the slope of the A-B INI (Helble et al., 2020a), but when looking at the full 12 year period, that pattern is reversed. Weirathmueller et al. (2017) also observed the shorter INI in a doublet pattern increasing at a faster rate than the longer INI in the eastern North Pacific, causing the shorter INI to approach the longer one from 2008–2013. In addition, the A-B doublet INIs of 15/22 s became closer to the B-B doublet INIs of 16/23 s. Between 2017–2023, the B-B singlet INIs had a wider distribution, greater variability between songs, and a greater median value than was observed between 2011–2017 by Helble et al. (2020a). The B-B singlet INI around 34 s tended to occur during song patterns that consisted of a single A note followed by multiple B notes when the A note was either skipped by the whale or missed due to its lower received level by the automatic detection, localization, or tracking process. Since it is linked to the B-A and A-B INIs, these B-B INIs may be lengthening over time too, although the high variability resulted in an unclear trend. The implications of these weaker A notes during B-B dominant song are discussed further below. While A-A note pairings were more rare in 2017–2023, the peak of the lower A-A doublet INI decreased from that reported by Helble et al. (2020a), although these INIs also showed high variability. A-A singlet INIs did not show an increasing trend over the most recent 5.5 years, or the full 12 year dataset, unlike that reported for 2011–2017 alone in Helble et al. (2020a). These complexities, taken as a whole, demonstrate the critical importance of distinguishing both note type and INI when analyzing fin whale song. If the note type is omitted, many of these subtle yet distinct characteristics would go unnoticed, potentially making it more difficult to distinguish populations or stocks through song analysis.
Across the full 12 year period, A-A was replaced by A-B doublet as the dominant song pattern in the 2014–2015 song season (Helble et al., 2020a) and has remained the dominant pattern in this region ever since. A-A has continued to become less popular. It is unknown how long A-A was the dominant note pairing, how long A-B doublet will remain the dominant song pattern, or what caused the switch. The proportion of B-B dominant tracks has varied, but B-B has never been the most common note pairing across the years monitored at PMRF, in contrast to the North Atlantic where B-B is the dominant note pairing observed (Guazzo et al., 2024). Širović et al. (2017) hypothesized that each song type is unique to a population and that changes in dominant song types represent a shift in the population in the monitored area, but we argue that since we observed all of the song patterns within individual tracks, the change in dominant song pattern does not imply members of a new population arrived.
It is important to note that the recording effort at PMRF has not been equal across time with some months and years having greater effort than others (Figure 2 in Helble et al., 2020a, and Figure 2 here). This uneven sampling could result in the dominant observed song patterns being different from the true distribution of song patterns. In addition, because the underlying distribution of these animals is unknown, we do not know whether or how often animals leave the study area and return creating multiple separate tracks. If animals repeatedly cross the study area and are included as separate tracks, this could bias our results so that the observed song pattern distribution is different from the true distribution of song patterns. This limitation is true of all passive acoustic monitoring studies if individuals cannot be identified by their calls and an underlying distribution is not known. Finally, the array configuration was different during the 2011–2017 period compared to the 2017–2023 period. For the purposes of categorizing and analyzing fin whale song patterns, the array configuration changes did not impact our results as quantified with the low miss, false, and misclassification rates.
As also evident in the 2011–2017 dataset, in the 2017–2023 dataset the majority of whales tracked (240 of 331) sang with multiple song patterns. For the most recent data, we did not observe any drastic changes in song pattern along the track, in contrast to a few of the examples presented in Helble et al. (2020a); rather, these tracks had multiple song patterns interwoven. Because PMRF allows for tracking of singing individuals, we are able to separate out songs coming from different parts of the array. As discussed in detail in Section 4 of Helble et al. (2020a), it does not seem probable that multiple whales are coordinating their singing in a tight group as suggested by Zhu and Wen (2024), due to the high timing precision of the song patterns and localization precision of the positions. When multiple individuals were tracked singing simultaneously, they each remained consistent in their individual song patterns and did not seem to alter their song pattern based on the other’s notes. No evidence of parallel tracks or tracks joining and splitting with individual whales singing different note types was observed. The tracks in this study add additional evidence that different song patterns are not necessarily indicative of different populations, stocks, or even individuals.
Whales singing B-B dominant song often wove A-B doublets throughout the song. However, the A notes tended to have a much lower intensity than the surrounding B notes (for example, see Figure 4). This unique phenomenon was not seen in A-B doublet dominant song, where the A and B notes had similar intensities. The PMRF range provides an advantage in that the song can be analyzed on the closest hydrophone to the whale at any given time, which, in this study, was a slant distance of at minimum the water depth, on average 5.3 km, and at most 7.1 km away. At these closest hydrophones, weak A notes could be seen by an analyst, but were not always detected on enough hydrophones to result in a localization. However, if such a song were to be observed from a single hydrophone system, which therefore cannot localize and limit the detection area, the weak A notes may be completely missed depending on the distance to the whale and/or noise conditions. When the A note is missed, the remaining B-B song may be mistakenly categorized as having an artificial peak in the INI at approximately 37 s (the sum of the B-A and A-B INIs). To complicate things even further, it appears that whales sometimes omitted the A note entirely (or it was of a low enough source level that we did not detect it even on the closest hydrophones). It is possible that this reduced intensity suggests that the A note is falling out of favor when interwoven with B-B song. However, a comprehensive source level analysis would be required to determine if the A note intensity is decreasing over time when produced in B-B dominant song, which is beyond the scope of this paper. Perhaps the weaker A note has some biological or communication significance, as farther conspecifics are less likely to hear the note than closer conspecifics.
Overall, the along-track cue rate remained relatively stable during 2017–2023, although there was a great deal of variability which might be due to differences in swimming behavior (e.g. Clark et al., 2019; Guazzo et al., 2021). The cue rate calculated here was also remarkably similar to that calculated for the 2011–2017 period (median of 134 notes/hour in 2017–2023 compared to 131 notes/hour in 2011–2017; Helble et al., 2020a), despite the dominant song patterns and INIs shifting, array changes, and validation differences. The along-track cue rate does not account for silent periods beyond 40 min, nor does it account for non-singing members of the population. These values would be required to translate an along-track cue rate to a density estimation.
Helble et al. (2020a) discussed the relationship between fin whale song patterns found in Hawai’i and those observed throughout the North Pacific over similar years. Since very little additional song analysis in the North Pacific has been published that covers our updated time span, our ability to connect these new results to other regions in the Pacific is currently limited. We hope that the extended song analysis presented here over the full time frame of 2011–2023 will provide that basis of comparison and inspire others to analyze fin whale song throughout the North Pacific in a similar way, giving further insight into the connectivity of song throughout the North Pacific.
Monitoring fin whale song can help to better understand connectivity of populations and the number of individuals in an area. While this study does not directly answer these questions, the information provided here can be used in future work to increase our understanding of this species. Even though individuals use multiple song patterns and thus the presence of different song patterns does not in itself signify a different population, we hypothesize that different populations may use different sets of song patterns, which then change over time. Some of this change may be due to random drift, while other changes may be due to cultural transmission as has been documented in humpback whales (Megaptera novaeangliae; e.g. Noad et al., 2000; Garland et al., 2011). We previously reported that some of the song patterns observed on PMRF were similar to some of those reported in the eastern North Pacific, but with delayed timescales, while others were different from those reported elsewhere (Helble et al., 2020a). Unfortunately, very little additional song analysis has been published in the North Pacific at the time of this writing, so no additional discussion is warranted on the connectedness of these new results to other regions of the Pacific. We encourage researchers studying fin whales to compare the song patterns they observe with those presented here, helping to provide further evidence on whether and how fin whales across different regions of the Pacific share songs. In addition, the along-track cue rates reported here can be applied to estimate the number of individuals in an area as more is learned about the proportion the population that sings and the proportion of time spent singing. Alternatively, tracks can themselves be cues in areas like PMRF where tracking is possible and can be applied to density estimation if the proportion of individuals that can be tracked is known.
In conclusion, fin whales sing with multiple patterns interwoven, defined by both note type and the spacing between notes. Within each song, these patterns are highly regular, but between songs and across time, they change. In this study, we expanded our timeseries of fin whale songs in Hawaiian waters to 12 years and reported how fin whale song has evolved over time. Increased understanding of these songs and their changes over time can help improve conservation and management strategies of a species in which population size, structure, distribution, and connectedness are not well understood.
Data availability statement
The datasets presented in this study can be found in online repositories. The names of the repository/repositories and accession number(s) can be found below: https://seamap.env.duke.edu/dataset/2324.
Ethics statement
Ethical approval was not required for the study involving animals in accordance with the local legislation and institutional requirements because study uses passive acoustic listening devices of wild marine mammals, and therefore does not affect the animal behavior in any way.
Author contributions
TAH: Conceptualization, Data curation, Formal analysis, Funding acquisition, Investigation, Methodology, Software, Validation, Project administration, Resources, Visualization, Writing – original draft, Writing – review & editing. RAG: Conceptualization, Data curation, Formal analysis, Funding acquisition, Investigation, Methodology, Software, Validation, Project administration, Visualization, Writing – original draft, Writing – review & editing. PJD: Data curation, Methodology, Software, Writing – original draft, Writing – review & editing. GCA: Data curation, Methodology, Software, Writing – review & editing. CRM: Data curation, Software, Writing – review & editing. SWM: Data curation, Methodology, Software, Writing – review & editing. EEH: Data curation, Project administration, Writing – review & editing.
Funding
The author(s) declare financial support was received for the research and/or publication of this article. This research was supported by the Office of Naval Research (Code 322, Award Number 02502-017-084463), U.S. Pacific Fleet (Code N465JR, Award Number N0007025WR0EP8F), and tool development necessary for this analysis was supported by the U.S. Navy’s Living Marine Resources Program (Award Number N0002524WR0041R).
Acknowledgments
The authors thank the personnel at PMRF, especially Eliseo Boloson, Bruce Comisap, Mike Dick, Jim Hager, Robin Higuchi, Bryson Kurokawa, Jon Winsley, and Jeffrey Yates, for obtaining recordings of acoustic data, as without the acoustic data this type of analysis would not be possible. We would like to dedicate this paper to the memory of Glenn Ierley, whose invaluable contributions to marine mammal science and unwavering support of our research lab profoundly influenced our work. He was a remarkable mentor and colleague whose passion for teaching inspired many. His legacy will continue to resonate in our research and in the hearts of all who had the privilege of knowing him.
Conflict of interest
The authors declare that the research was conducted in the absence of any commercial or financial relationships that could be construed as a potential conflict of interest.
Generative AI statement
The author(s) declare that no Generative AI was used in the creation of this manuscript.
Any alternative text (alt text) provided alongside figures in this article has been generated by Frontiers with the support of artificial intelligence and reasonable efforts have been made to ensure accuracy, including review by the authors wherever possible. If you identify any issues, please contact us.
Publisher’s note
All claims expressed in this article are solely those of the authors and do not necessarily represent those of their affiliated organizations, or those of the publisher, the editors and the reviewers. Any product that may be evaluated in this article, or claim that may be made by its manufacturer, is not guaranteed or endorsed by the publisher.
Supplementary material
The Supplementary Material for this article can be found online at: https://www.frontiersin.org/articles/10.3389/fmars.2025.1642598/full#supplementary-material
References
Best P., Marxer R., Paris S., and Glotin H. (2022). Temporal evolution of the Mediterranean fin whale song. Sci. Rep. 12, 13565. doi: 10.1038/s41598-022-15379-0
Castellote M., Clark C. W., and Lammers M. O. (2012). Fin whale (Balaenoptera physalus) population identity in the western Mediterranean Sea. Mar. Mamm. Sci. 28, 325–344. doi: 10.1111/j.1748-7692.2011.00491.x
Center for Conservation Bioacoustics (2019). Raven Pro: Interactive Sound Analysis Software (Version 1.6.1) [Computer software]. (Ithaca, NY: The Cornell Lab of Ornithology). Available online at: https://www.ravensoundsoftware.com/knowledge-base/how-to-cite-raven-pro/.
Clark C. W., Gagnon G. J., and Frankel A. S. (2019). Fin whale singing decreases with increased swimming speed. R. Soc Open Sci. 6, 180525. doi: 10.1098/rsos.180525
Croll D. A., Clark C. W., Acevedo A., Tershy B., Flores S., Gedamke J., et al. (2002). Only male fin whales sing loud songs. Cah Rev. 417, 809. doi: 10.1038/417809a
Delarue J., Martin B., Hannay D., and Berchok C. L. (2013). Acoustic occurrence and affiliation of fin whales detected in the northeastern Chukchi Sea, July to October 2007–10. Arctic 66, 159–172. doi: 10.14430/arctic4287
Delarue J., Todd S. K., Van Parijs S. M., and Di Iorio L. (2009). Geographic variation in Northwest Atlantic fin whale (Balaenoptera physalus) song: implications for stock structure assessment. J. Acoust. Soc Am. 125, 1774–1782. doi: 10.1121/1.3068454
Dugan P. J., Klinck H., Roch M. A., and Helble T. A. (2016). RAVEN-X: high performance data mining toolbox for bioacoustic data analysis (Ithaca, NY: Office of Naval Research Annual Report, Bioacoustics Research Program, Cornell Lab of Ornithology, Cornell University). doi: 10.48550/ARXIV.1610.03772
Dugan P. J., Klinck H., Zollweg J. A., and Clark C. W. (2015). “Data mining sound archives: a new scalable algorithm for parallel-distributing processing,” in 2015 IEEE International Conference on Data Mining Workshop (ICDMW) (Atlantic City, NJ: IEEE), 768–772. doi: 10.1109/icdmw.2015.235
Dugan P. J., Rice A. N., Urazghildiiev I. R., and Clark C. W. (2010a). “North Atlantic right whale acoustic signal processing: part I. comparison of machine learning recognition algorithms,” in 2010 IEEE Long Island Systems, Applications and Technology Conference (Farmingdale, NY: IEEE), 1–6. doi: 10.1109/lisat.2010.5478268
Dugan P. J., Rice A. N., Urazghildiiev I. R., and Clark C. W. (2010b). “North Atlantic right whale acoustic signal processing: Part II. improved decision architecture for auto-detection using multi-classifier combination methodology,” in 2010 IEEE Long Island Systems, Applications and Technology Conference (Farmingdale, NY: IEEE), 1–6. doi: 10.1109/lisat.2010.5478287
Dugan P. J., Zollweg J., Popescu M., Risch D., Glotin H., Lecun Y., et al. (2014). “High performance computer acoustic data accelerator: a new system for exploring marine mammal acoustics for big data applications,” in Proc. ICML unsupervised learning for bioacoustics. (Beijing, China). doi: 10.48550/arXiv.1509.03591
Dugan P., Pourhomayoun M., Shiu Y., Paradis R., Rice A., and Clark C. (2013). Using high performance computing to explore large complex bioacoustic soundscapes: case study for right whale acoustics. Proc. Comput. Sci. 20, 156–162. doi: 10.1016/j.procs.2013.09.254
Garland E. C., Goldizen A. W., Rekdahl M. L., Constantine R., Garrigue C., Hauser N. D., et al. (2011). Dynamic horizontal cultural transmission of humpback whale song at the ocean basin scale. Curr. Biol. 21, 687–691. doi: 10.1016/j.cub.2011.03.019
Guazzo R. A., Durbach I. N., Helble T. A., Alongi G. C., Martin C. R., Martin S. W., et al. (2021). Singing fin whale swimming behavior in the central North Pacific. Front. Mar. Sci. 8. doi: 10.3389/fmars.2021.696002
Guazzo R. A., Helble T. A., Alongi G. C., Durbach I. N., Martin C. R., Martin S. W., et al. (2020). Lombard effect: humpback whale song source levels increase as ambient ocean noise levels increase. J. Acoust. Soc Am. 148, 542–555. doi: 10.1121/10.0001669
Guazzo R. A., Stevenson D. L., Edell M. K., Gagnon G. J., and Helble T. A. (2024). A decade of change and stability for fin whale song in the North Atlantic. Front. Mar. Sci. 11. doi: 10.3389/fmars.2024.1278068
Hatch L. T. and Clark C. W. (2004). Acoustic differentiation between fin whales in both the North Atlantic and North Pacific Oceans, and integration with genetic estimates of divergence (Ithaca, NY: Paper SC/56/SD8 presented to the International Whaling Commission Scientific Committee).
Helble T. A., Alongi G. C., Guazzo R. A., Allhusen D. R., Martin C. R., Martin S. W., et al. (2024). Swimming and acoustic calling behavior attributed to Bryde’s whales in the central North Pacific. Front. Mar. Sci. 11. doi: 10.3389/fmars.2024.1305505
Helble T. A., Guazzo R. A., Alongi G. C., Martin C. R., Martin S. W., and Henderson E. E. (2020a). Fin whale song patterns shift over time in the central North Pacific. Front. Mar. Sci. 7. doi: 10.3389/fmars.2020.587110
Helble T. A., Guazzo R. A., Martin C. R., Durbach I. N., Alongi G. C., Martin S. W., et al. (2020b). Lombard effect: minke whale call source levels vary with natural variations in ocean noise. J. Acoust. Soc Am. 147, 698–712. doi: 10.1121/10.0000596
Helble T. A., Henderson E. E., Ierley G. R., and Martin S. W. (2016). Swim track kinematics and calling behavior attributed to Bryde’s whales on the Navy’s Pacific Missile Range Facility. J. Acoust. Soc Am. 140, 4170–4177. doi: 10.1121/1.4967754
Helble T. A., Ierley G. R., D’Spain G. L., and Martin S. W. (2015). Automated acoustic localization and call association for vocalizing humpback whales on the Navy’s Pacific Missile Range Facility. J. Acoust. Soc Am. 137, 11–21. doi: 10.1121/1.4904505
Helble T. A., Ierley G. R., D’Spain G. L., Roch M. A., and Hildebrand J. A. (2012). A generalized power-law detection algorithm for humpback whale vocalizations. J. Acoust. Soc Am. 131, 2682–2699. doi: 10.1121/1.3685790
Klay J., Mellinger D. K., Moretti D. J., Martin S. W., and Roch M. A. (2015). “Advanced methods for passive acoustic detection, classification, and localization of marine mammals,” (Newport, OR: Tech. rep). Available online at: https://apps.dtic.mil/sti/tr/pdf/AD1014245.pdf.
Marques T. A., Thomas L., Martin S. W., Mellinger D. K., Jarvis S., Morrissey R. P., et al. (2012). Spatially explicit capture–recapture methods to estimate minke whale density from data collected at bottom-mounted hydrophones. J. Ornithol. 152, S445–S455. doi: 10.1007/s10336-010-0535-7
Marques T. A., Thomas L., Ward J., DiMarzio N., and Tyack P. L. (2009). Estimating cetacean population density using fixed passive acoustic sensors: an example with Blainville’s beaked whales. J. Acoust. Soc Am. 125, 1982–1994. doi: 10.1121/1.3089590
Martin S. B., Gaudet B. J., Klinck H., Dugan P. J., Miksis-Olds J. L., Mellinger D. K., et al. (2021). Hybrid millidecade spectra: a practical format for exchange of long-term ambient sound data. JASA Express Lett. 1, 011203. doi: 10.1121/10.0003324
Miksis-Olds J. L., Dugan P. J., Martin S. B., Klinck H., Mellinger D. K., Mann D. A., et al. (2021). Ocean sound analysis software for making ambient noise trends accessible (MANTA). Front. Mar. Sci. 8. doi: 10.3389/fmars.2021.703650
Morano J. L., Salisbury D. P., Rice A. N., Conklin K. L., Falk K. L., and Clark C. W. (2012). Seasonal and geographical patterns of fin whale song in the western North Atlantic Ocean. J. Acoust. Soc Am. 132, 1207–1212. doi: 10.1121/1.4730890
Noad M. J., Cato D. H., Bryden M. M., Jenner M., and Jenner K. C. S. (2000). Cultural revolution in whale songs. Cah Rev. 408, 537–537. doi: 10.1038/35046199
Oleson E. M., Širović A., Bayless A. R., and Hildebrand J. A. (2014). Synchronous seasonal change in fin whale song in the North Pacific. PloS One 9, e115678. doi: 10.1371/journal.pone.0115678
Payne R. and Webb D. (1971). Orientation by means of long range acoustic signaling in baleen whales. Ann. New York Acad. Sci. 188, 110–141. doi: 10.1111/j.1749-6632.1971.tb13093.x
Pourhomayoun M., Dugan P., Popescu M., and Clark C. (2013a). “Bioacoustic signal classification based on continuous region processing, grid masking and artificial neural network,” in International Conference on Machine Learning (Atlanta, GA: arXiv). doi: 10.48550/ARXIV.1305.3635
Pourhomayoun M., Dugan P., Popescu M., Risch D., Lewis H., and Clark C. (2013b). “Classification for big dataset of bioacoustic signals based on human scoring system and artificial neural network,” in International Conference on Machine Learning (Atlanta, GA: arXiv). doi: 10.48550/ARXIV.1305.3633
Risch D., Clark C. W., Dugan P. J., Popescu M., Siebert U., and Van Parijs S. M. (2013). Minke whale acoustic behavior and multi-year seasonal and diel vocalization patterns in Massachusetts Bay, USA. Mar. Ecol. Prog. Ser. 489, 279–295. doi: 10.3354/meps10426
Romagosa M., Nieukirk S., Cascão I., Marques T. A., Dziak R., Royer J.-Y., et al. (2024). Fin whale song evolution in the North Atlantic. eLife 13, e83750. doi: 10.7554/elife.83750
Širović A., Oleson E. M., Buccowich J., Rice A., and Bayless A. R. (2017). Fin whale song variability in southern California and the Gulf of California. Sci. Rep. 7, 10126. doi: 10.1038/s41598-017-09979-4
Thompson P. O., Findley L. T., and Vidal O. (1992). 20-Hz pulses and other vocalizations of fin whales, Balaenoptera physalus, in the Gulf of California, Mexico. J. Acoust. Soc Am. 92, 3051–3057. doi: 10.1121/1.404201
Watkins W. A. (1981). Activities and underwater sounds of fin whales. Sci. Rep. Whales Res. Inst. 33, 83–117.
Watkins W. A., Tyack P., Moore K. E., and Bird J. E. (1987). The 20-Hz signals of finback whales (Balaenoptera physalus). J. Acoust. Soc Am. 82, 1901–1912. doi: 10.1121/1.395685
Weirathmueller M. J., Stafford K. M., Wilcock W. S. D., Hilmo R. S., Dziak R. P., and Tréhu A. M. (2017). Spatial and temporal trends in fin whale vocalizations recorded in the NE Pacific Ocean between 2003–2013. PloS One 12, e0186127. doi: 10.1371/journal.pone.0186127
Keywords: fin whale (Balaenoptera physalus), inter-note interval, calling rate, cue rate, song, bioacoustics, passive acoustic monitoring, big data and analytics
Citation: Helble TA, Guazzo RA, Dugan PJ, Alongi GC, Martin CR, Martin SW and Henderson EE (2025) Twelve years of fin whale song evolution in the central North Pacific. Front. Mar. Sci. 12:1642598. doi: 10.3389/fmars.2025.1642598
Received: 06 June 2025; Accepted: 10 September 2025;
Published: 14 October 2025.
Edited by:
Fannie W. Shabangu, Department of Forestry, Fisheries and the Environment, South AfricaReviewed by:
Brian S. Miller, Australian Antarctic Division, AustraliaMeghan Aulich, Curtin University, Australia
Copyright © 2025 Helble, Guazzo, Dugan, Alongi, Martin, Martin and Henderson. This is an open-access article distributed under the terms of the Creative Commons Attribution License (CC BY). The use, distribution or reproduction in other forums is permitted, provided the original author(s) and the copyright owner(s) are credited and that the original publication in this journal is cited, in accordance with accepted academic practice. No use, distribution or reproduction is permitted which does not comply with these terms.
*Correspondence: Tyler A. Helble, dHlsZXIuYS5oZWxibGUuY2l2QHVzLm5hdnkubWls
†These authors have contributed equally to this work and share first authorship