 Jeremy D. Prince1,2
 Indah Rufiati3*Wahyu Dita Septiani3
 Duranta Diandria Kembaren4
 Charlotte Louise Anne Gough3,5
- 1Biospherics P/L, South Fremantle, WA, Australia
- 2School of Veterinary and Life Sciences, Murdoch University, Murdoch, WA, Australia
- 3Blue Ventures Conservation, Bristol, United Kingdom
- 4Research Center for Biota Systems, National Research and Innovation Agency (BRIN), Bogor, Indonesia
- 5Centre for Ecology and Conservation, College of Life and Environmental Sciences, University of Exeter, Falmouth, Cornwall, United Kingdom
Cephalopod biology, which is characaterised by short lifespans, semelparous reproduction, rapid non-asymptotic growth, and seasonally fluctuating biomass, presents a particular challenge stock assessment. Small scale, data-poor artisanal octopus fisheries are an increasingly important source of food and income for coastal fishing communities but pose a particularly pernicious assessment challenge. We developed and tested a novel size-based data-poor assessment methodology, demonstrating its applicability with 17 Indonesian fisheries for Octopus cyanea. The Short-Lived Assessment Model (SLAM) is similar to Length-based Spawning Potential Ratio Assessment (LBSPR) and Length-based Integrated Mixed Effects (LIME) methodologies, in assuming that taxa share both growth curves and a relativity between maximum size and size of maturity. Incorporating a power curve form of growth typical of cephalopods and monthly time steps SLAM estimates selectivity at age schedules, monthly fishing mortality rates (F) and spawning potential ratio (SPR). A minimum of 12 monthly samples of catch at weight data (CAW) are required, but longer time series and additional indices of effort and/or catch will produce more reliable results. SLAM’s structure is flexible; with <24 months of CAW it parallels LBSPR in assuming equilibrium dynamics and constant monthly recruitment. With >24 months of CAW, a dynamic structure becomes possible similar to LIME, and seasonal recruitment patterns can be estimated.
1 Introduction
By some estimates, over 80% of the world’s fish stocks are unassessable with standard age-based stock assessment methodologies because they have insufficient biological information and fisheries data (Costello et al., 2012).
Cephalopod biology presents particular challenges for assessment due to the characteristically short lifespans (1–2 years), semelparous reproduction, rapid non-asymptotic growth, high rates of natural mortality, complex population structures, fluctuating biomass levels and high cost of ageing (Arkhipkin et al., 2021). While squid comprise most of the global cephalopod catches, cuttlefish and octopus contribute approximately ~10% each. International demand for octopus is growing and reported catches have doubled over the last three decades. Especially through developing countries, small-scale artisanal octopus fisheries are becoming increasingly important as a source of both food and income for many coastal communities. A trend likely to continue as more finfish stocks become either fully or over-exploited (Sauer et al., 2021). Small-scale, coastal octopus fisheries present a particularly pernicious assessment challenge due to the difficulty of sustaining data collection programs in remote disparate communities. Almost by definition they are data-poor and practically unassessable.
Length or weight compositions of catches form the basis of many data-poor assessment methodologies because they are simpler and easier to monitor than age compositions. In recent years several new approaches to size-based assessment have been developed specifically for stocks that exhibit asymptotic, or Von Bertalanffy growth (VBG), and for which length composition data are the primary data source available (Hordyk et al., 2015, 2016; Froese et al., 2018; Rudd and Thorson, 2018). Because of the ease of collecting catch size composition data these size-based assessment methods have been rapidly adopted globally, enabling the initial assessment of many previously un-assessable fisheries (Canales et al., 2021; Prince et al., 2023).
Previous length-based assessment models use individual life history parameters to derive age compositions from size data, to estimate biomass-based metrics of stock status. In contrast, Length-based Spawning Potential Ratio (LBSPR) assessment (Hordyk et al., 2015, 2016), Length-based Integrated Mixed Effects (LIME) assessment (Rudd and Thorson, 2018) and length-based pseudo-cohort analysis (LBPA) use life history ratios (LHR) to estimate directly from the catch size compositions, a metric of fishing pressure; spawning potential ratio (SPR) (Hordyk et al., 2015). With SPR being defined as the proportion of lifetime reproductive potential in a fished population, relative to the level expected in unfished populations (Mace and Sissenwine, 1993). A limitation of the original LBSPR methodology is that it relies on the assumption that stocks are close to an equilibrium state to produce ‘snapshot’ estimates of SPR, whereas the LIME and LBPA methodologies incorporate dynamic population assumptions, but then also require time series data. Unfortunately none of these recently developed sized-based assessment methodologies are applicable to cephalopods, because they assume asymptotic VBG growth over annual time-steps through a life-cycle, which is incompatible with non-asymptotic cephalopodic growth within an annual life- cycle.
So far, the most versatile and comprehensively applied cephalopod assessment methodologies have been depletion models, but these require accurate catch and effort data collected at short time steps to iteratively estimate within-season biomass trends. This renders them inapplicable to most cephalopod fisheries, which lack the infrastructure and resources needed to collect the data required (Arkhipkin et al., 2021; Sauer et al., 2021). Moreover, as Arkhipkin et al. (2021) observed, many methodologies estimate biomass-based reference points (RPs) because there is insufficient data to estimate fishing mortality (F). However, in the context of the rapid life history and terminal spawning of cephalopods, RPs like SPR, which index the escapement of spawning biomass to minimise the risk of recruitment overfishing, would be preferable.
The aim of this study was to develop a simpler new size-based assessment method for data-limited cephalopod fisheries. Accepting that the LBSPR, LIME and LBPA methodologies are inapplicable to cephalopods, this study never-the-less aimed to test whether a parallel approach might still be applicable. Those methods use the shape of growth curves and expected size compositions, characterised across entire taxa but scaled to local estimates of size of maturity, to assess the reproductive potential of adults surviving to reproduce (e.g. Prince et al., 2015). The assessment model described here incorporates cephalopodic growth and size distributions, to predict size compositions and on that basis estimate SPR trends.
We believe this novel size-based, assessment methodology for cephalopods will find generic utility with many previously un-assessable small-scale cephalopod fisheries. Here we describe its initial simulation testing, and application to data collected from 45 Indonesian villages fishing for the big blue octopus, The big blue octopus, Octopus cyanea is a relatively unstudied, medium-sized, diurnally active octopus that inhabits tropical sub- and intertidal reefs throughout the Indian and western Pacific Oceans, and provides the basis for many locally important coastal fisheries (Sauer et al., 2021). From 2010 to 2018, between 11,000 - 25,000 tonnes of O. cyanea, worth USD 100–50 million, were landed annually in Indonesia, making it one of the largest octopus producers in Asia (Cripps and Harris, 2018).
2 Methods
Based on our synthesis of the literature for O. cyanea and a size of maturity study in Indonesia we constructing an age-structured assessment model with monthly time steps which called the short-lived assessment model (SLAM). The theoretical performance of SLAM was evaluated using an operating model (OM) that was coded separately but followed the same structure. For this theoretical testing the OM was used to simulate data from octopus stocks being fished under a plausible range of simulated conditions. Those data were then analysed with SLAM and its results compared to the ‘known conditions’ used to generate the data. Finally, having collected time series of catch size composition from 45 Indonesian villages (Figure 1) we compiled 17 geographically contiguous datasets to which we appliec SLAM. In consideration of space and a broader readership, only an overview of our methods is presented here. A more detailed description of model structures and algorithms can be found in the online supporting documents.
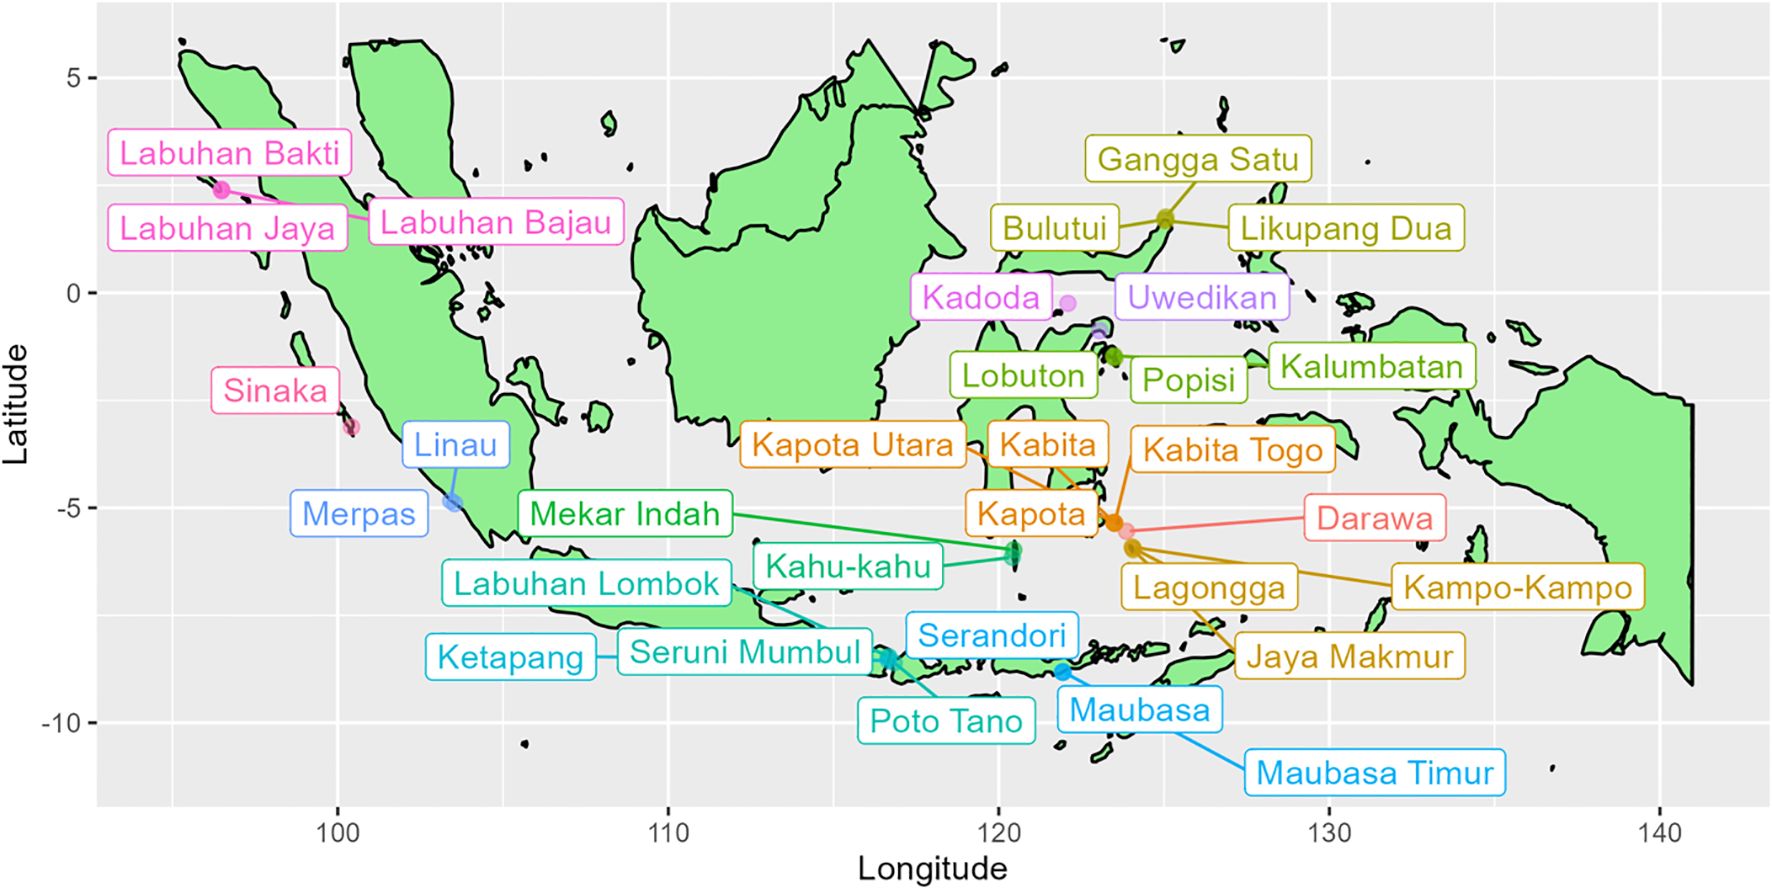
Figure 1. Map showing the location of 43 of the 45 Indonesian villages where octopus catch size composition data were collected and SLAM assessments completed. Location data for two villages (Grogos and Torosiaje) were unavailable for plotting. Village names of the same colour indicate adjacent villages for which catch composition data were aggregated, so that 17 assessment were completed in total.
The assumed context for applying SLAM is that a fishery that has operated for an extended period, but data has only been collected recently (i.e., data are not available since the fishery’s inception). The main data source is assumed to be a time series of monthly catch weight composition data (catch at weight; CAW), and a minimum of 12 months of data is required. If available, an index of fishing effort and/or an index of catch can also be used to fit the model. By default, these data are assumed to be relative indices of effort and/or catch over time, rather than absolute measures. An index of relative abundance, such as monthly average catch per unit effort (CPUE), can also assist. If all three time series are available, by default, the model fits to the time series of relative catch and the index of abundance (CPUE), as the effort trend is inferred from the other two time series. If absolute estimates of catch exist, the model can be extended to estimate absolute population size, but in its absence, the model estimates relative trends in abundance in addition to SPR.
SLAM requires the following biological information or assumptions as input parameters:
● mean weight at age schedule (with associated expected log-normal variability of weight at age).
● maturity at age.
● natural mortality at age.
● post-spawning mortality associated with each age class.
● steepness parameter of the Beverton-Holt stock recruitment parameter.
● expected level variance in log-normally distributed recruitment deviations.
2.1 Life history parameters
2.1.1 Longevity, natural mortality and spawning at age
We assume that the annual recruitment patterns commonly observed in O. cyanea fisheries reflect an underlying seasonality in spawning biomass, which to remain consistent over time as observed, implies that reproduction generally occurs around 12 months of age. Consequently, we assume an almost knife-edge spawning at age schedule , with almost all individuals spawning at the end of their first year of life and a maximum possible age of 14 months (Supplementary Figures S2–S8 or Supplementary Figures S1–S4). Reproduction is assumed to occur in the middle of the monthly time step, and all spawning individuals are assumed to die at the end of the same month [i.e., (Supplementary Tables S1–S3)].
SLAM requires information on the pre-spawning rate of natural mortality, but there are few published estimates for O. cyanea or any other octopus. Those that exist are commonly based on teleost-based correlations, and their applicability to short-lived semelparous cephalopods is questionable. Herwig et al. (2012) used Hoenig’s (1983) method based on maximum age to estimate a daily mortality rate that, assuming 30.4 days per month, corresponds to 0.88 month-1. This value appears too high to be consistent with a longevity of at least 12 months, perhaps because it represents mortality averaged over the entire lifespan rather than just the ‘before-spawning’ mortality rate. Silas et al. (2021) used the Pauly (1980) correlation between natural mortality, water temperature and fish length to estimate annual mortality rates equivalent to 0.178 – 0.207 month-1; which given a 12-month lifespan, appears more plausible. Although why a correlation based on teleost length should apply to the mantle length of octopus remains obscure. Furthermore, Roa-Ureta et al. (2020) modelled population dynamics over 15 fishing seasons to develop what they considered a robust estimate of average weekly pre-spawning natural mortality for red octopus (Enteroctopus megalocyathus) in southern Chile, which is the equivalent of 0.075 month-1. However, the evidence suggests that deeper, colder water species like E. megalocyathus tend to live longer than shallower, warmer water species like O. cyanea.
An alternative logic to illuminate these sparse observations can be supplied by the concept of optimum size, which is widely applied in fisheries biology, and posits that natural selection drives all species to optimise evolutionary fitness by ensuring cohorts mature asthey attain maximum biomass (optimum size) so as to maximise their reproductive output (Beverton and Holt, 1957). Assuming cephalopods are subject to the same evolutionary pressures, we plotted trajectories of relative biomass with age (months) for a range of natural mortality rates (0.05 – 0.45 month-1) and observed that cohort biomass is maximal around 12–14 months of age with 0.15 month-1 (Supplementary Figures S1–S3). This we assume to be the best approximation of the pre-spawning rate of natural mortality.
2.1.2 Weight at age
Herwig et al. (2012) fitted five growth models (i.e., exponential, linear, logarithmic, power and VBG) to weight at age data, and found the power function provided the best fit for O. cyanea. They found no significant difference in growth between males and females. The coefficients of the power function reported in Table 1 of Herwig et al. (2012) did not reproduce the mean weight at age curve shown in their Figure 1, which reported different values for the coefficients that also did not reproduce the plotted curve. Consequently, we re-digitised their data and re-fitted a power function, resulting in slightly different coefficients, but a similar line of best fit (Supplementary Figures S1–S5). The standard deviation of the log-normally distributed weight at age was estimated by Herwig et al. (2012) to be 0.48. We assume that, in relative terms, this general form of growth and magnitude of variability can be broadly applied to O. cyanea.
Herwig et al. (2012) draw attention to the variation in size at age and maturity that has been observed in various studies of O. cyanea. This variability is apparently associated with the ambient water temperature in differing locations, a factor also known to influence size at age and maturity in teleosts (Brown et al., 2004). To account for the differences in water temperature between Herwig et al. (2012)’s study site at Ningaloo reef and the more equatorial waters of our Indonesian study sites, we scaled Herwig et al. (2012)’s mean weight at age schedule using an Indonesian estimate of weight at maturity. For that purpose, data on the weight and stage of maturity were collected for 575 animals, and a proportion mature at weight ogive was estimated using a logistic regression with a general linear model (Supplementary Figures S1–S6). Assuming the same maturity at age schedule applies in both locations, we scaled the assumed Indonesian weight at age schedule to Herwig et al. (2012)’s schedule, using the proportional difference in the maturity at weight schedules. This resulted in a smaller assumed mean weight at age schedule for Indonesia compared to that estimated by Herwig et al. (2012) (Supplementary Figures S1–S7) which, with the deviation estimated by Herwig et al. (2012), we used in our assessment model and simulation testing (Supplementary Figures S1–S7; Supplementary Tables S1–S4).
2.1.3 Stock-recruit relationship
The stock assessment and monthly fishing optimisation models developed require an estimate of the steepness of the Beverton-Holt stock-recruit relationship. Steepness is difficult to estimate for most species, and we could find no published studies of steepness in octopus. Given that octopus populations are considered to be highly productive, we assumed a relatively high value of 0.85 for steepness of the stock-recruit relationship, similar to values assumed for forage fish (Hilborn and Walters, 2021). Similarly, likely values for the recruitment process error are unknown. A value of 0.4 was assumed for the simulation testing and applied to the case studies. If run assuming a steepness of 1.0 the model can be run as a per-recruit model, however, using that assumption in the fishing mortality optimisation routine (described below) will result in extremely high estimates of optimal fishing mortality, because the assumption will be that stable egg production results even from extremely low spawning biomass.
2.2 Model outputs
Arkhipkin et al. (2021) noted that in the context of cephalopods’ rapid life history and terminal spawning, it would be advantageous to estimate RPs that index the escapement of biomass so that the risk of recruitment overfishing can be minimised by conserving sufficient spawning. SLAM makes this possible by estimating monthly F and the corresponding SPR, as well as the selectivity at age schedule (assumed to be asymptotic and non-time-varying) and a seasonal (monthly) pattern in recruitment.
The structure of SLAM is flexible. With <24 months of catch at weight data available, the model assumes monthly recruitment occurs without process error and the model follows a similar structure to the LBSPR methodology, which assumes fisheries are at equilibrium. With >24 months of catch at weight data available, the equilibrium assumption can be relaxed and the model becomes more like the LIME methodology. In this mode SLAM estimates the seasonal (monthly) pattern in recruitment as monthly recruitment deviations, which are assumed to be log-normally distributed with a user-specified variance. Both estimation routines can be controlled by the model user, and either turned or fixed to user-specified values.
A Hyperbolic Absolute Risk Aversion (HARA) model (Mendelssohn, 1982), described in more detail in the supporting documents, was used to calculate the pattern of monthly fishing mortality that results in the highest utility of the resource. This follows the structure of the assessment model, with the exception that there is no process error on recruitment , and it runs until the population comes to its equilibrium state. The HARA optimisation model predicts the average fishing mortality for each calendar month that corresponds with the highest annual utility and is analogous to the FMSY metric. From the optimal average fishing mortality and estimated selectivity at age schedule, together with the life history parameters defined above, the optimal monthly spawning potential ratio is calculated.
The HARA model can be modified to account for various socio-economic aspects of the fishery. The estimate of annual utility is strongly influenced by the monthly utility parameter (). When the marginal utility of each unit of catch decreases as the total catch increases, and utility is highest when catches are evenly distributed throughout the year. When , the utility is the same whether catch is all taken in one month or spread out evenly throughout the year, and is simply the total annual catch corresponding with conventional maximum sustainable yield. If there is no seasonal pattern in recruitment the optimal monthly pattern in fishing effort depends entirely on variation in . The appropriate value for could be determined through interviewing fishers and other stakeholders, and might be used to account for seasonal constraints on fishing effort, such as weather conditions like monsoonal winds that prevent fishing so that potential catch in some seasons have low utility. In addition, if the value of the catch is related to the size of the landed octopus the equation for can be modified to include the relative value of the different size classes.
The code for the operating and assessment models described, along with a compiled version of the assessment model as an R package (SLAM; Short-Lived Assessment Model), are all available in a public repository: https://github.com/Blue-Matter/SLAM. Documentation for the SLAM package, including a User Manual, is available at: https://slam.bluematterscience.com
2.3 Simulation testing the short-lived assessment model
The operating model (OM) was developed following the structure of SLAM described above, but was coded separately from the assessment model using the R statistical computing environment (R Core Team, 2022). The OM was used to simulate the SLAM’s results under different seasonal recruitment patterns, and evaluate its ability to estimate the monthly fishing mortality, SPR, and seasonal recruitment. The simulation testing described here was prescribed by the limited time-line and resources available for this project. It focussed on providing an initial test of SLAM as a proof of principle, rather than the exhaustive documentation of its performance.
Two seasonal patterns in recruitment were considered (Constant and Pulse; Supplementary Figures S1–8). Each of these two recruitment scenarios were simulated 100 times, with the recruitment process error and observation processes of each simulation being stochastically sampled according to five monitoring scenarios (Supplementary Tables S2, S3) covering all possible combinations of the data that could be collected: catch at weight, catch, effort and abundance (i.e. CPUE). The combination of effort, catch and abundance was not simulated as this would be pseudo-replication as CPUE was generated from catch and effort data. For each of the five monitoring scenarios, time series of 12, 24, 36, 48, and 60-month durations were simulated. This resulted in a total of 50 scenarios simulated 100 times: five different combinations of monitoring data, available over five different time periods, for two different seasonal recruitment patterns.
From all 5,000 simulations, fishery data were generated assuming an effective sample size of 400 for the monthly samples of catch at weight, and a 15% coefficient of variation (CV) for the observed indices of catch, effort and index of abundance (Supplementary Tables S2, S3). The assessment model was applied to each simulation and results summarised as the median relative error (MRE) in estimated F and SPR for each scenario. Seasonal recruitment patterns estimated by SLAM were also compared to the ‘true seasonal pattern’ simulated by the OM. A more detailed description of the OM and the simulation testing conducted can be found in the online supporting documents.
2.4 Application of short-lived assessment model to case studies
This study used data collected from 45 Indonesian villages in between 2017 and 2023 (Figure 1). The data collected daily from sampled fishers included time spent fishing, fishing method, and the catch weight (kg), mantle length (cm), and sex of each octopus caught. The daily CAW data were aggregated into monthly samples combining both males and females. The CAW data were binned into 100g weight classes. There were few measurements >4 kg, although several few were considerably greater, all measurements >4 kg were aggregated into a maximum weight class of 4 kg. After the datasets from villages sharing the same fishing grounds were aggregated, there were 17 datasets that complied with the criteria described above to which SLAM could be applied (Figure 1).
At most sites, monthly catch and effort data could not be collected from most fishers the model was primarily fitted to CAW and relative catch trends. If available, mean monthly CPUE with standard deviations was calculated using a linear model of log-CPUE with individual fishers and Year: Month as covariate factors. The same biological parameters were assumed in the assessment model as for the simulation testing. Reference points were calculated using the HARA model with an assumed exponent value of 0.4.
The data used for the 17 assessments are the property of the various fishing communities and local organisations involved with collecting them and cannot be made freely available, however, access to some of them maybe negotiated on a case-by-case basis by corresponding with the authors.
3 Results
3.1 Simulation testing the short-lived assessment model
The key finding from our simulation testing is the apparent utility for fitting CAW data to expectations of population size distributions relative to size of maturity, however, SLAM’s reliability is critically dependent on both the number and length of the monitoring time series increases. Across the scenarios simulated, the relative error in the estimates of F and SPR declined by ~70% as the duration of the time series of data increased from 12 to 60 months (Figure 2). The greatest relative error was observed when there was just 12 months of CAW data (Figure 2; left). Adding additional time series of catch, effort and/or abundance did not have a large impact on the relative error when only 12 months of data was provided. As the length of the time series data increased, however, additional time series reduced the relative error of the estimates by ~50%. The lowest relative error was observed with >36 months of CAW, effort and abundance data (Figure 2; right).
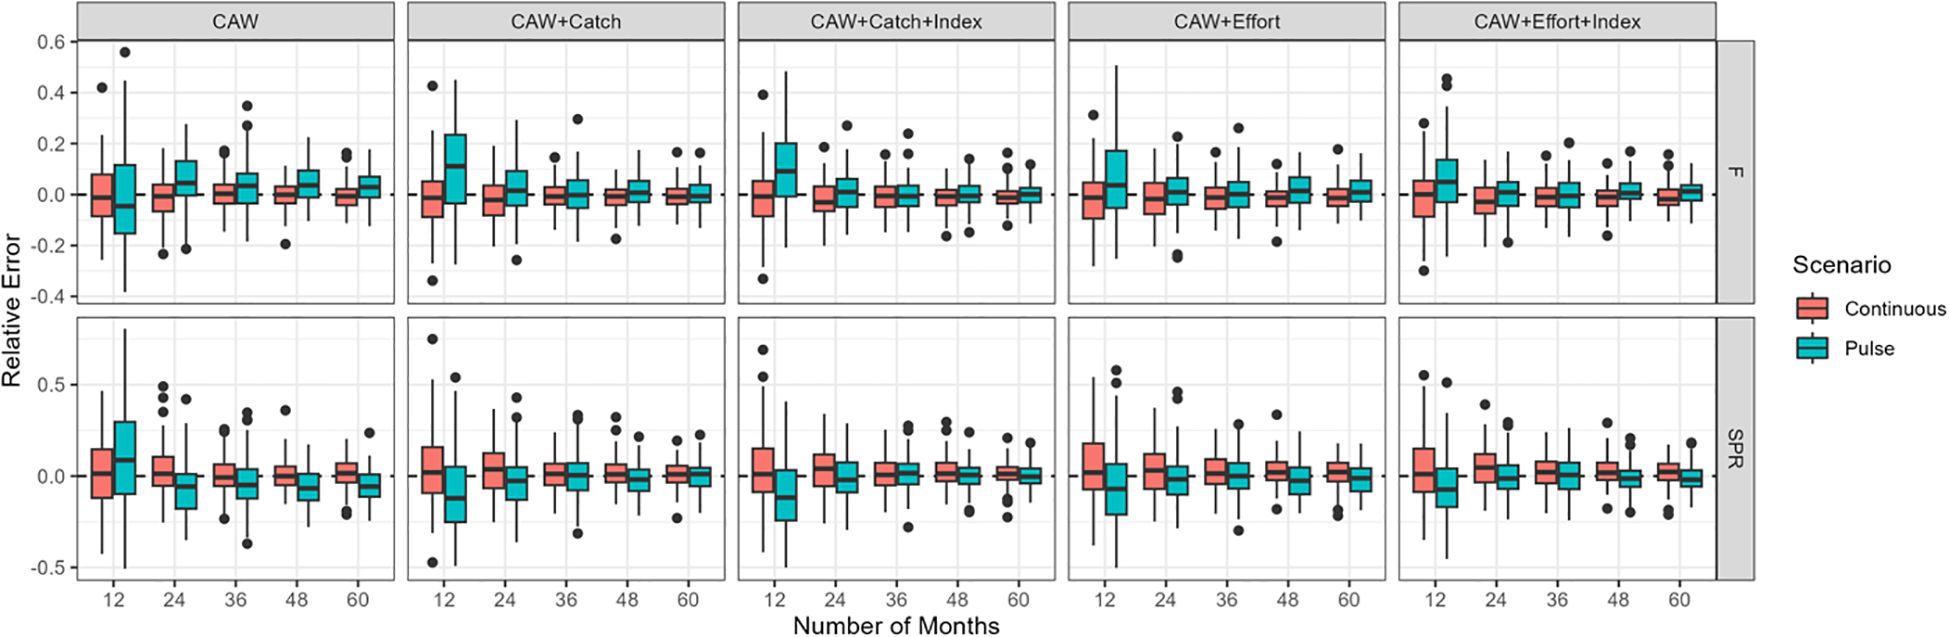
Figure 2. The relative error in fishing mortality (top row) and spawning potential ratio (bottom row) for two recruitment patterns (continuous – red or pulsed – blue) and 12–60 months of time-series data (x-axis). The five columns display the simulation results from five potential combinations of available time series data; 1) weight composition only (CAW), 2) CAW and an index of catch, 3) CAW and indices of catch and abundance (i.e. CPUE), 4) CAW and an index of fishing effort, and 5) CAW and indices of effort and abundance. The model was not fit to indices of effort, catch, and abundance, because the index of abundance is generated from the catch and effort data.
The relative error around the estimates of F and SPR were generally larger with the pulse recruitment scenarios (green), especially when only weight composition data was used (Figure 2).
3.2 Application of short-lived assessment model to case studies
Estimates of F varied widely across sites, and between months within the 17 sites (Figure 3); in some cases being >1.0 (Bulutui, Gangga Satu, Likupang Dua), but ~0 for all months in Uwedikan, and in some months at many sites including Labuhan Lombok. In contrast the estimated selectivity-at-age curves were quite similar for most of the sites, although larger at the site that includes Labuhan Lombok, and smaller at site that includes Jaya Makmur (Figure 4).
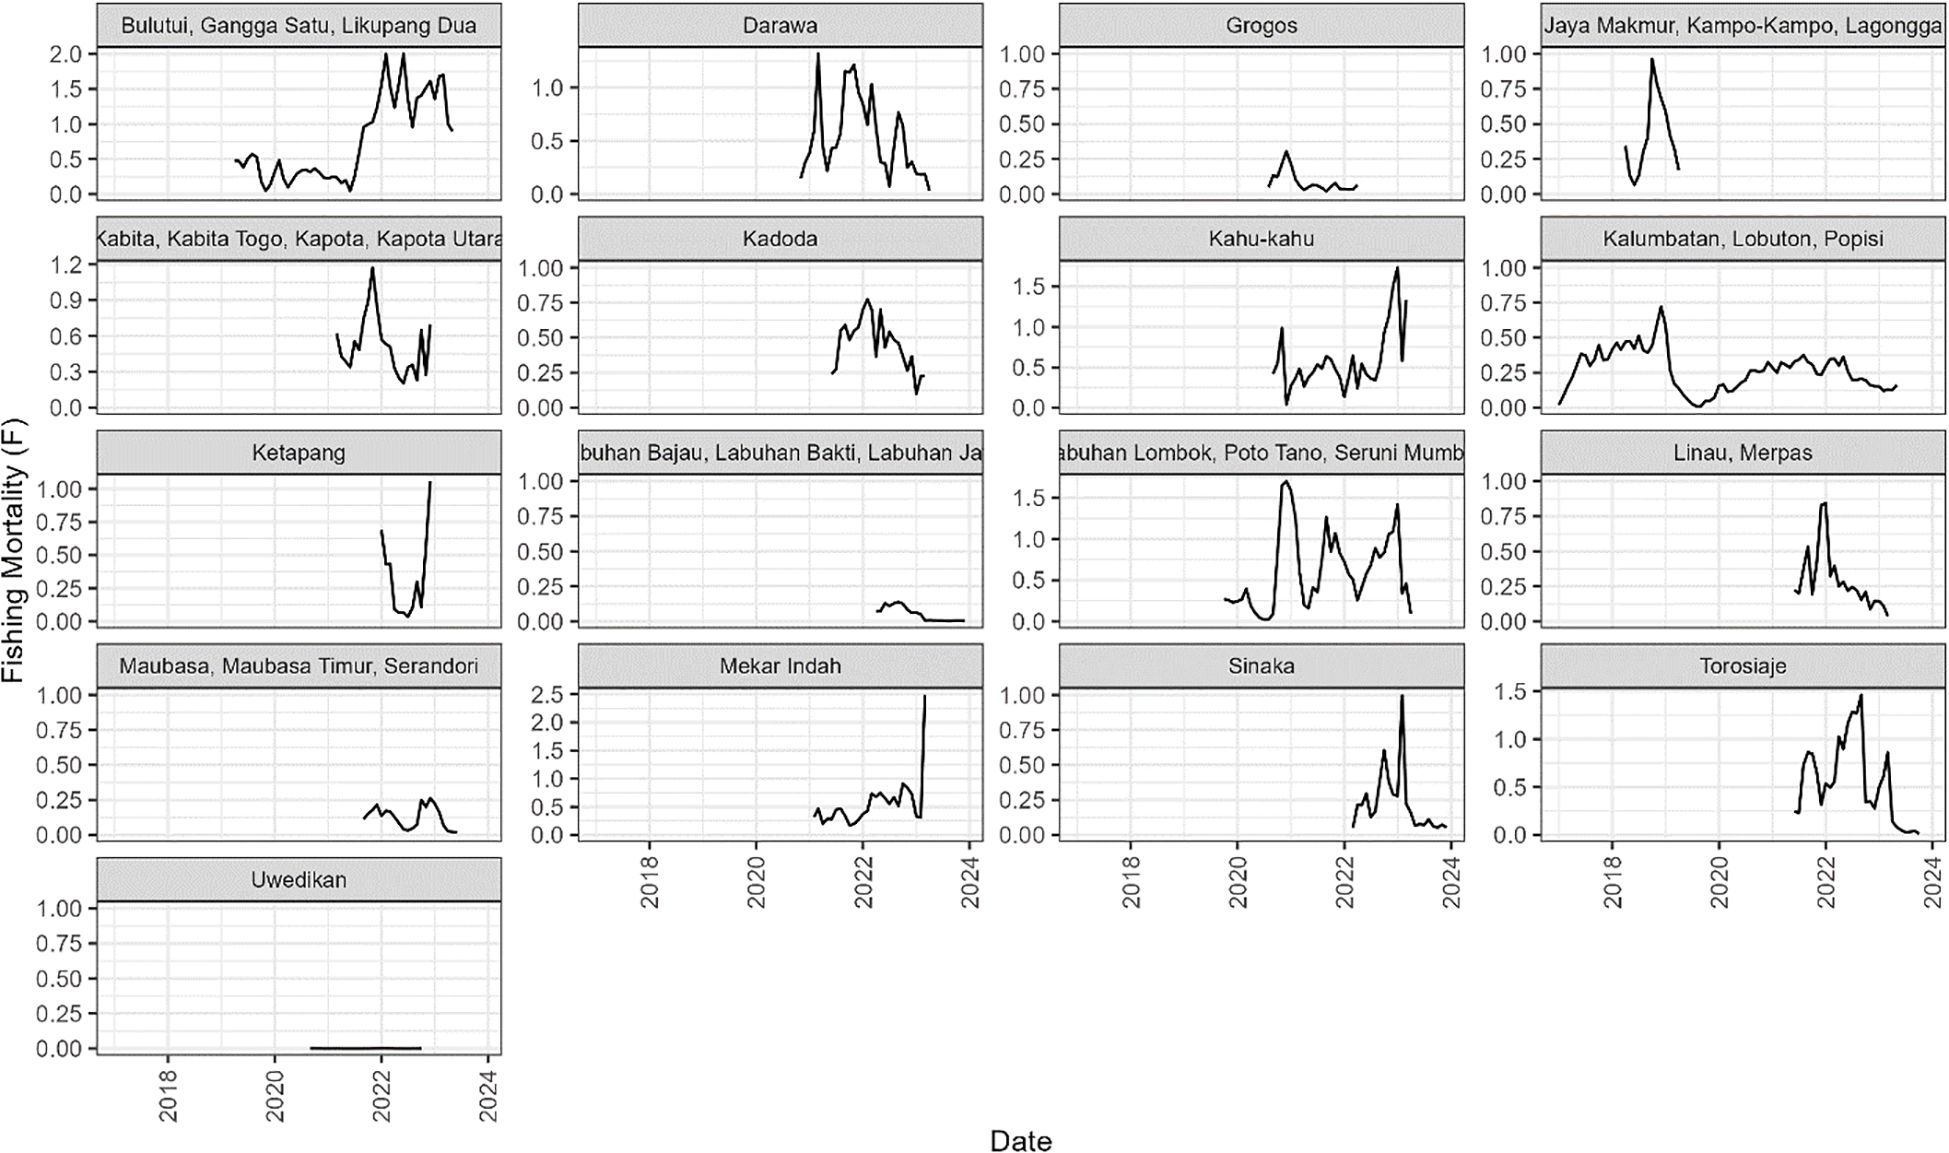
Figure 3. The estimated monthly fishing mortality from the 17 case study sites in Indonesia.
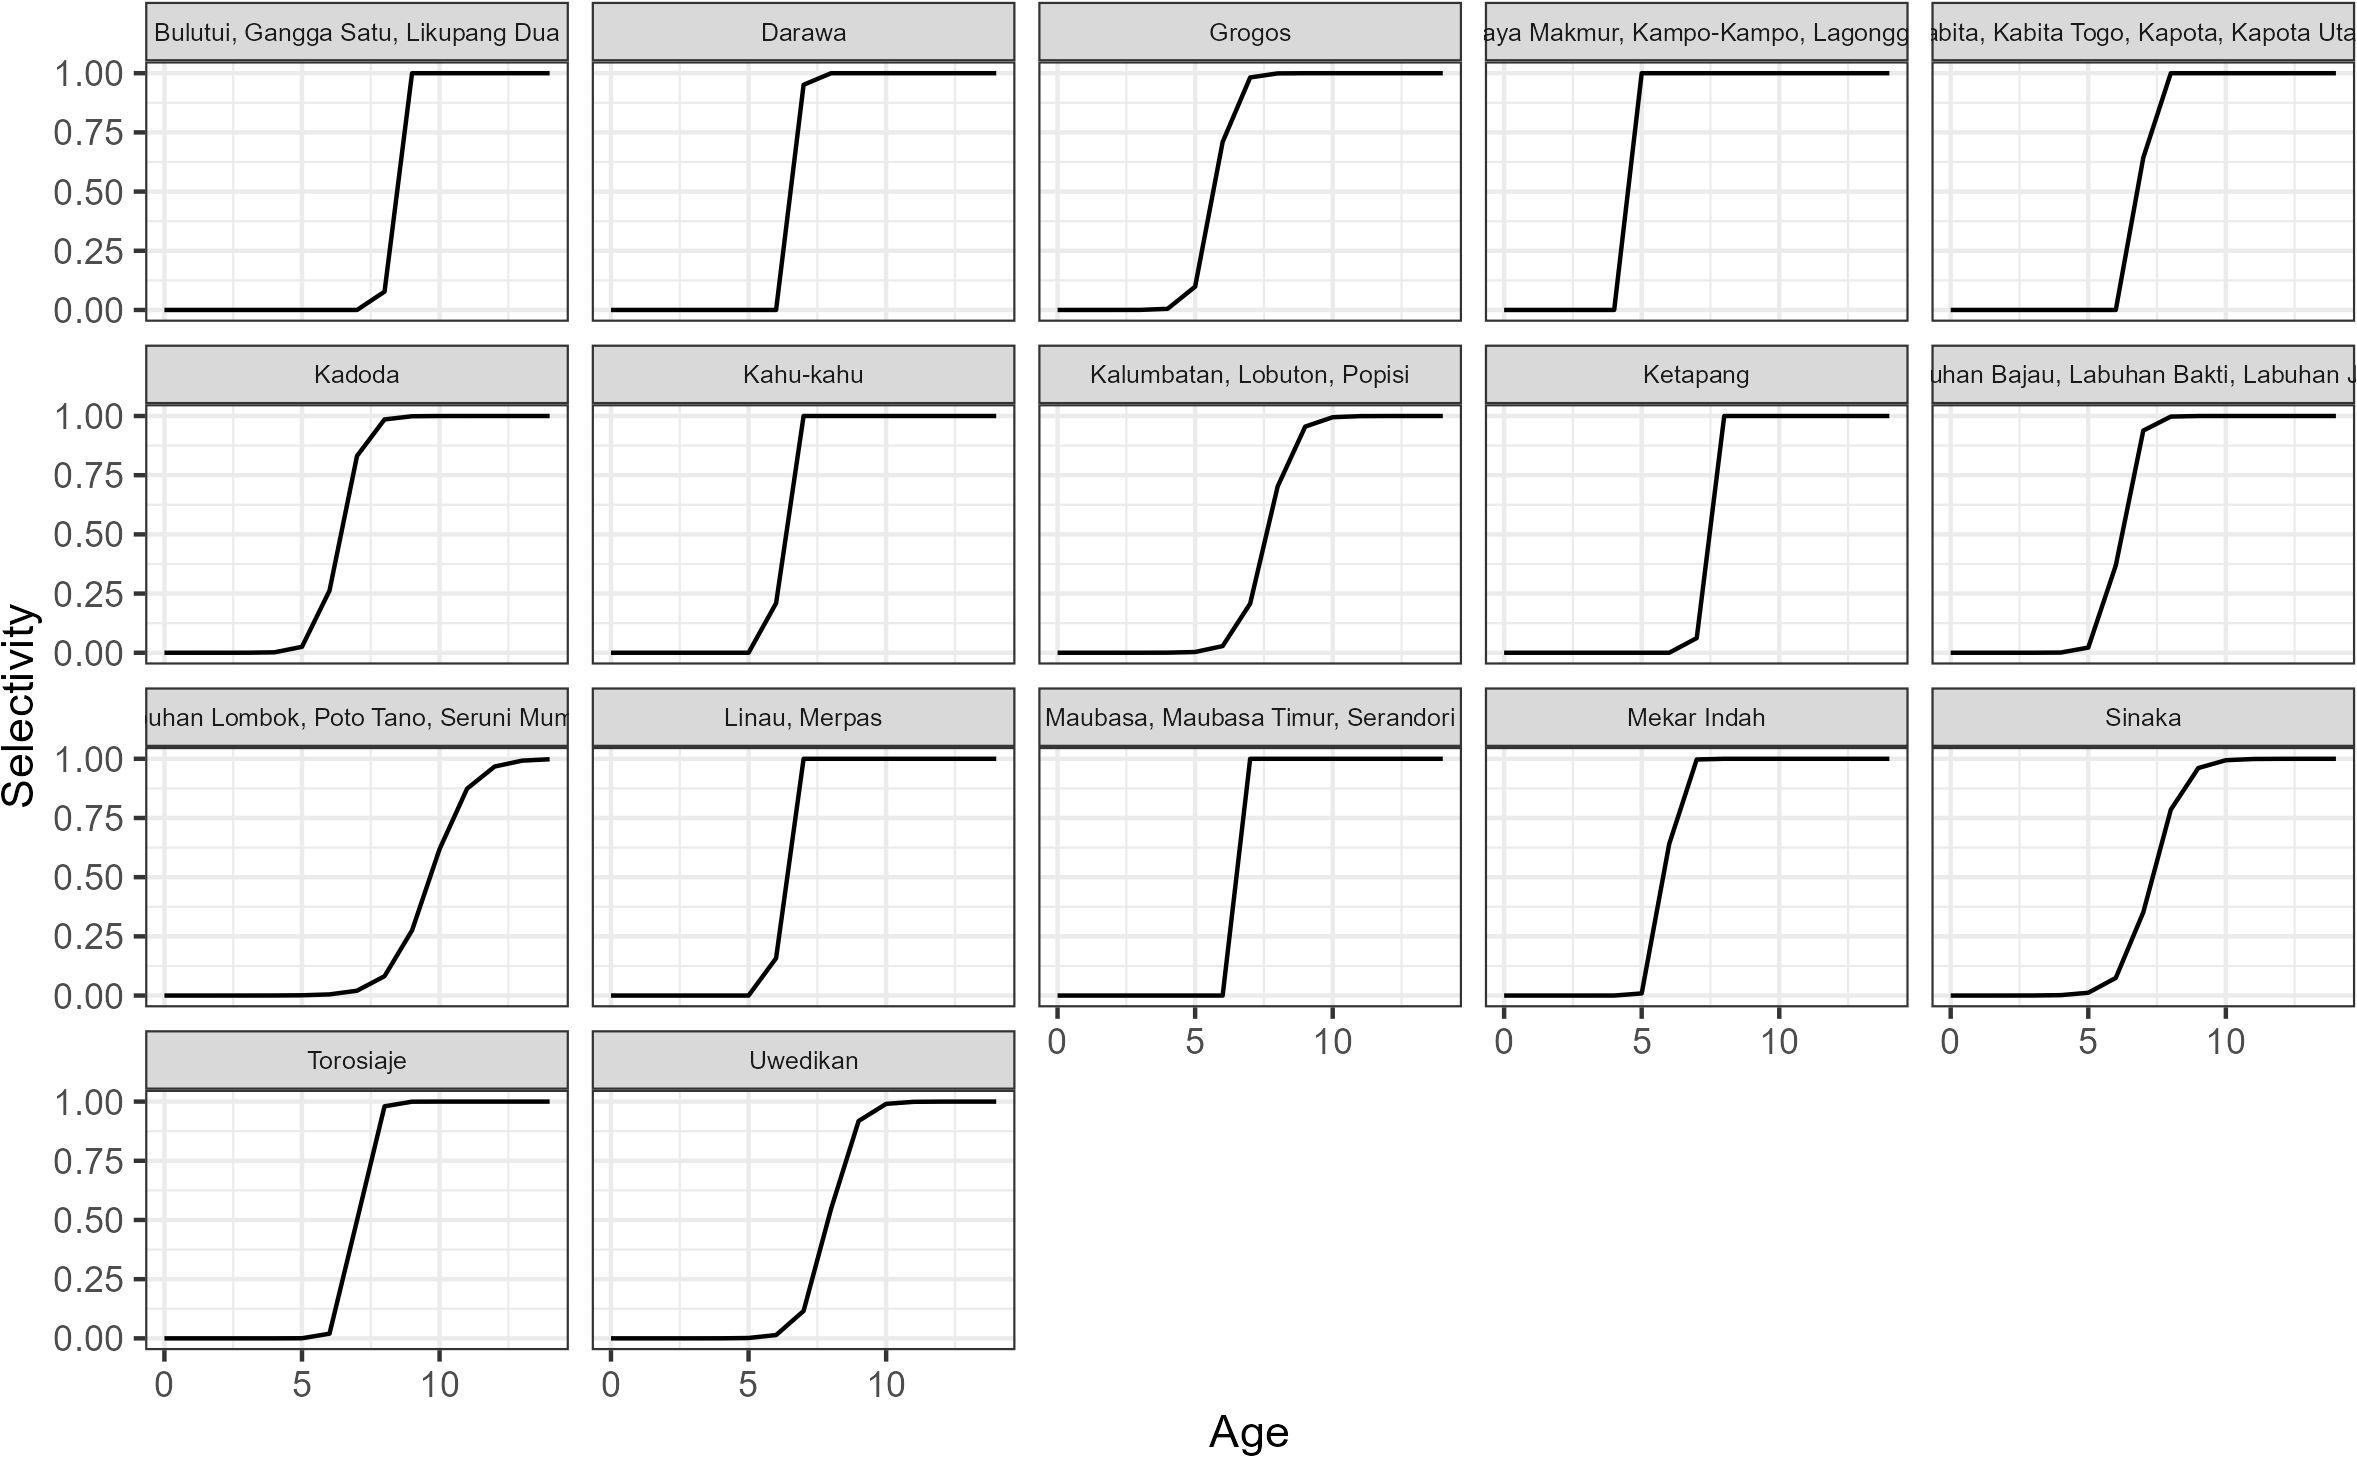
Figure 4. The estimated selectivity-at-age curves from the 17 case study sites in Indonesia.
The estimated trends in SPR within each site are essentially the mirror image of the trends in F as at each site SPR is the product of F and the selectivity at age curve, which is estimated to remain constant across the time series (Figure 5). The importance of the selectivity at age curve in determining SPR levels is illustrated by the site that includes Labuhan Lombok having the largest selectivity at age curve and relatively high SPR in contrast to the site that includes Jaya Makmur having the smallest selectivity at age curve and low SPR.
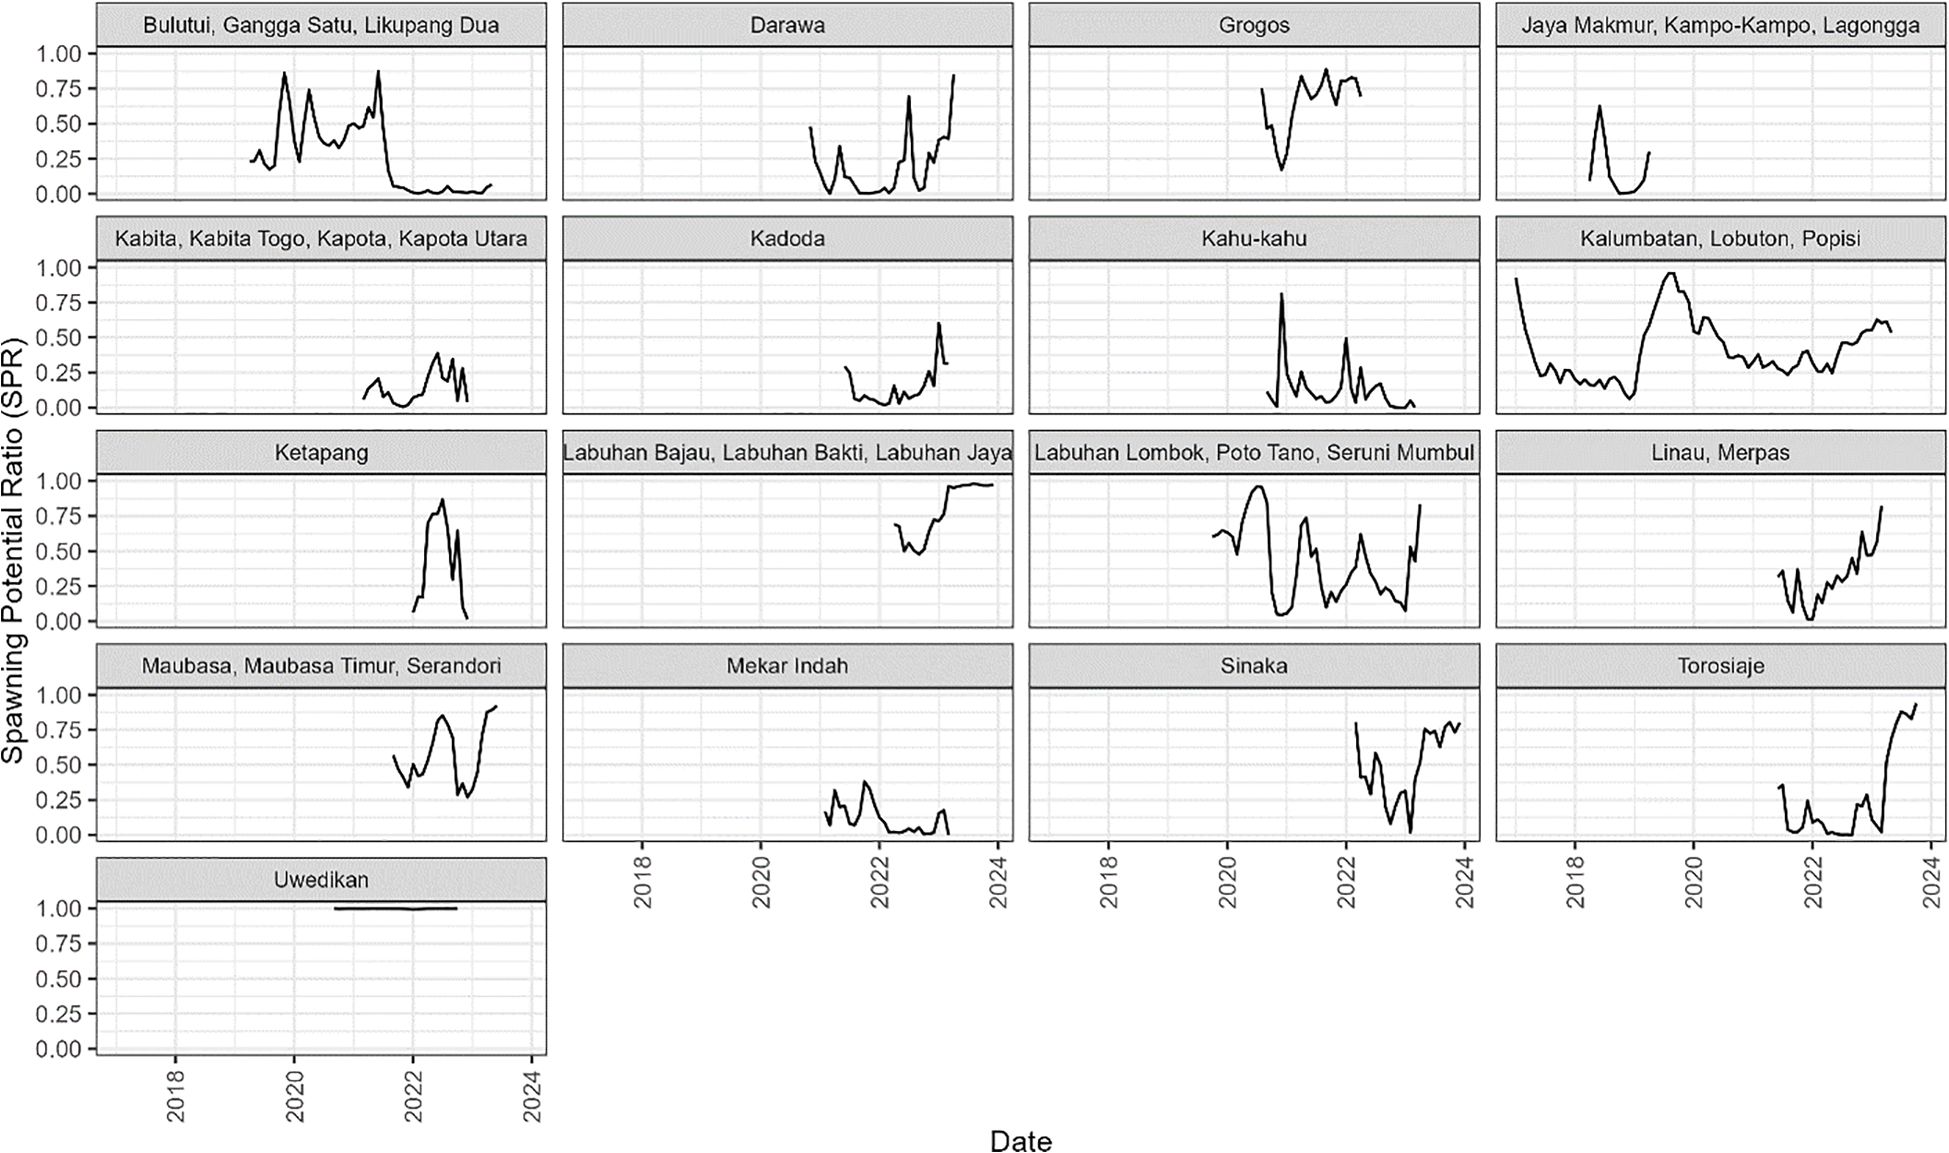
Figure 5. The estimated monthly spawning potential ratio (SPR) from the 17 case study sites in Indonesia.
The seasonal recruitment pattern was estimated to be relatively flat for most of the sites, although there was evidence of a recruitment pulse around February at some sites (Figure 6).
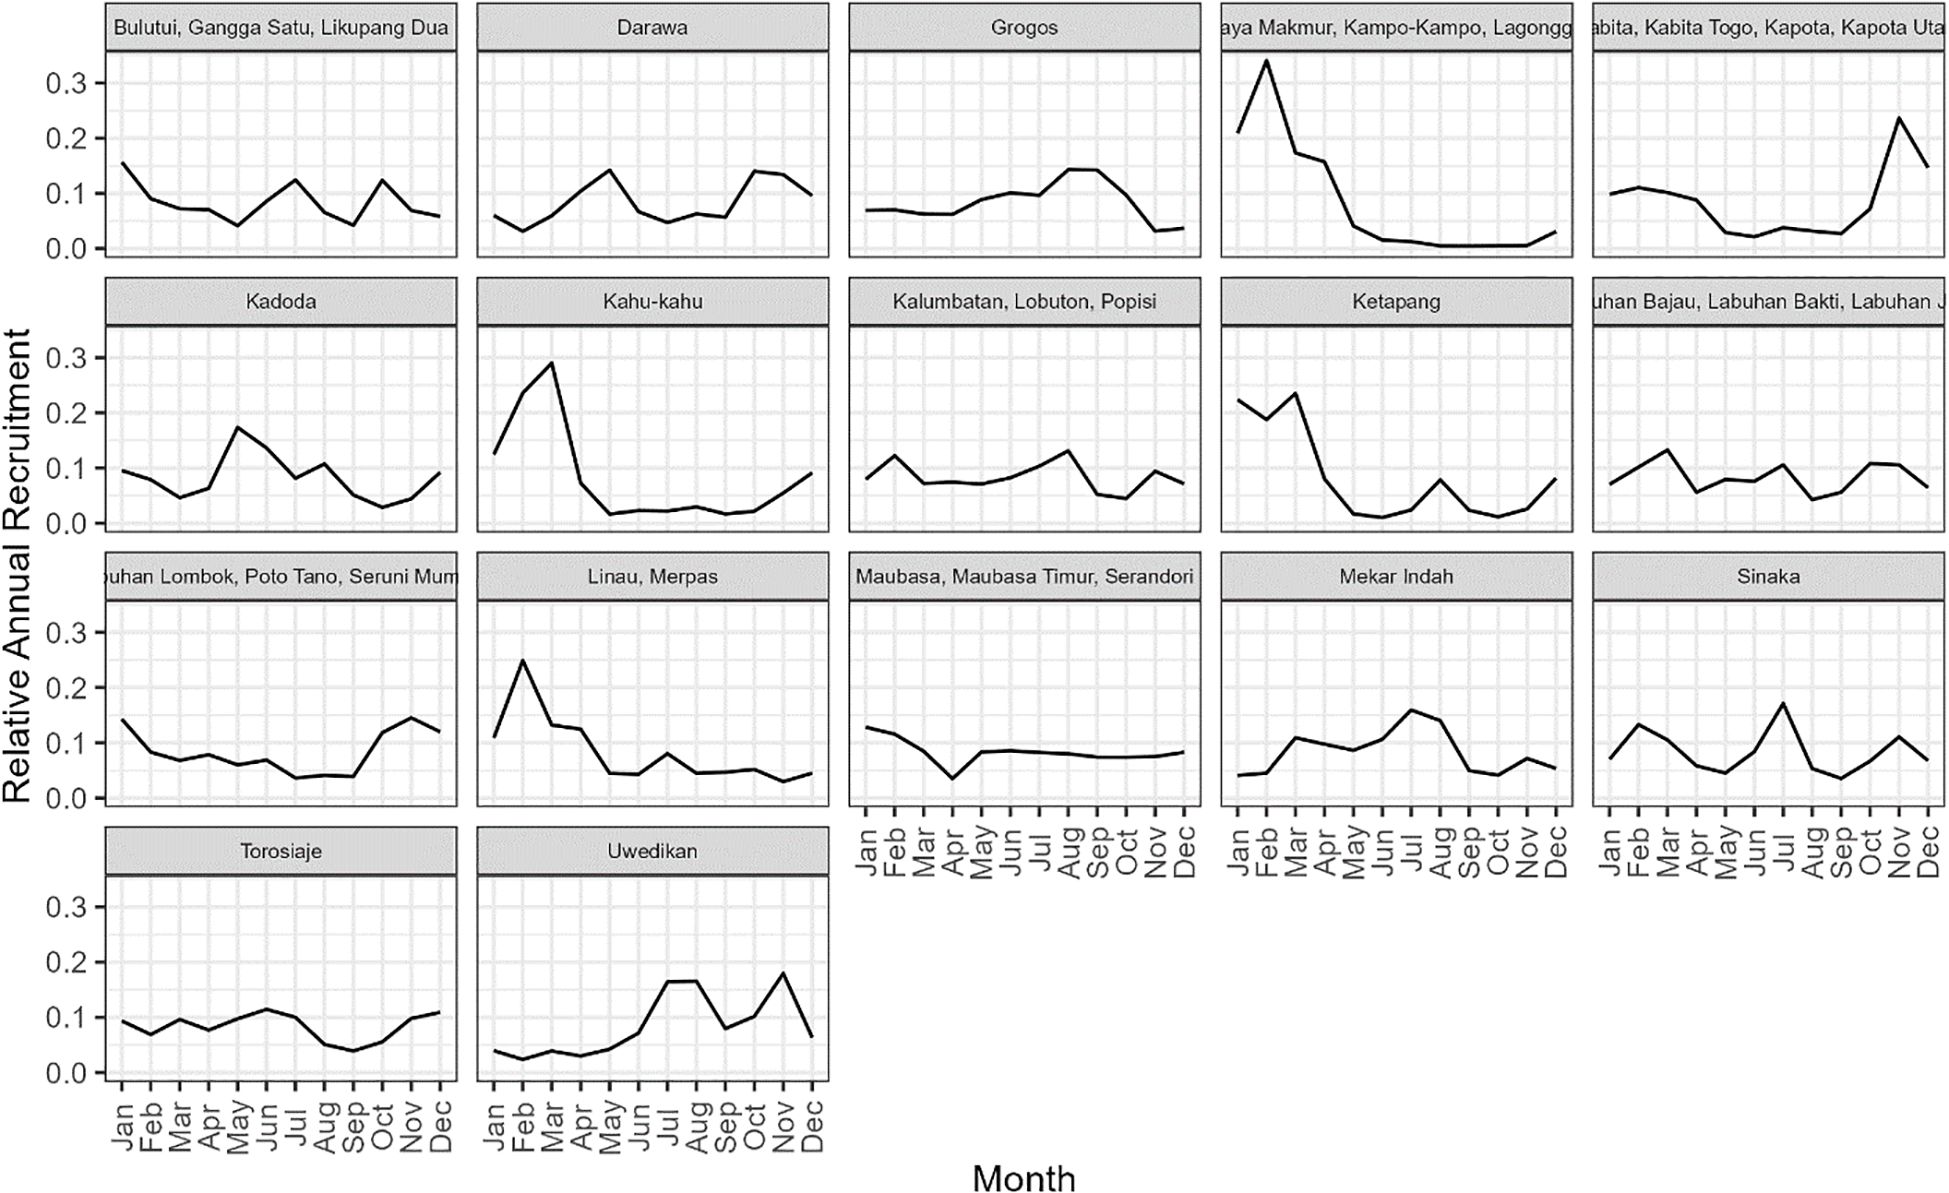
Figure 6. The estimated mean monthly recruitment pattern from the 17 case study sites in Indonesia.
For most sites, the HARA model predicted a relatively flat optimal fishing pattern throughout the year, suggesting that utility from the fishery is maximised with relatively constant fishing pressure throughout the year (Figure 7). The exceptions were the sites with a seasonal recruitment pulse (e.g., the site of Jaya Makmur and associated villages; Figure 7). In these sites, the HARA model predicted greater utility would be achieved by increasing the fishing effort around May, about three months after the February peak of recruitment (Figure 6) and a similar optimal pattern in SPR (Figure 7).
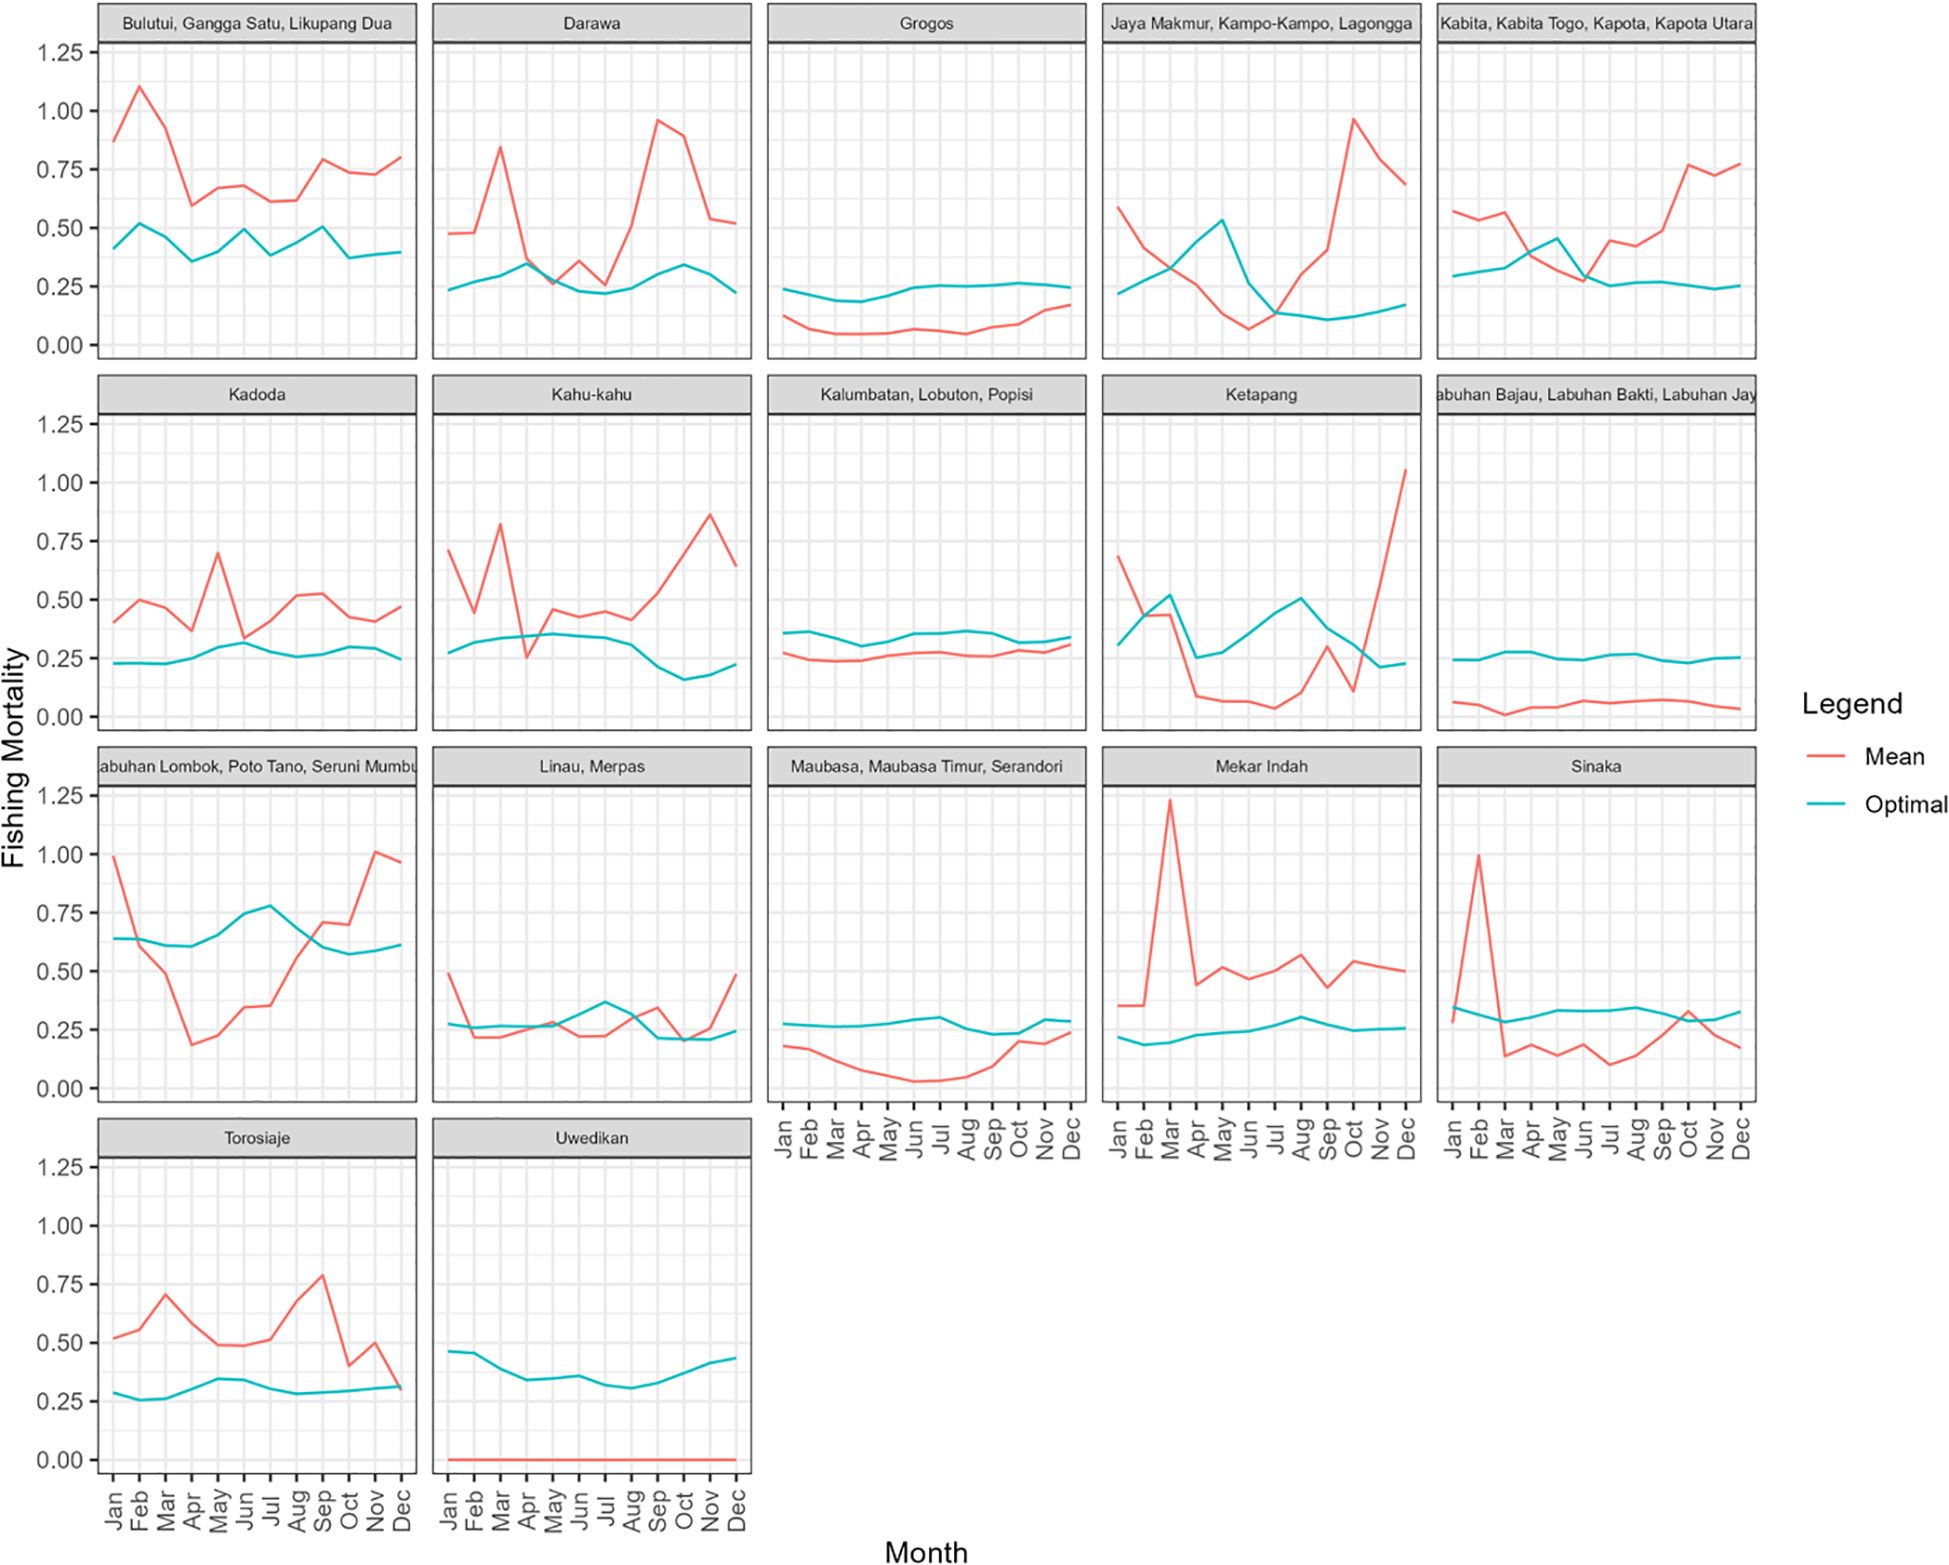
Figure 7. The estimated mean monthly fishing mortality (F; red) and the optimal monthly pattern estimated by the HARA model (blue) with a risk aversion parameter value of 0.4.
The observed data and the assessment model’s fit are shown in Supporting Document 2.
4 Discussion
The aim of this study was to develop, test, and demonstrate a size-based, assessment methodology with general applicability to data-poor cephalopod fisheries, which we have called SLAM. Our main purpose was to demonstrate the potential of an ‘LBSPR-like’ approach to cephalopods, by fitting CAW data to expected population size distributions scaled to size of maturity. As well as, to test SLAM’s utility with data collected from 45 Indonesian village-based fisheries for O. cyanea.
4.1 Simulation testing
Our simulation testing demonstrates that, under test conditions, SLAM has potential to reliably estimate F and SPR from monthly weight composition of the catch data (Figure 2). As to be expected, the key finding from our simulation testing is that the error in the estimates of F and SPR decrease as the length of the time series data increases, and with addition of indices of effort, catch, or abundance. The necessity for relatively lengthy, and preference for several time series of monthly data, makes SLAM similar to the more data-intensive LIME methodology, than the ‘snap-shot’ simplicity of LBSPR. While this greater requirement for data will undoubtedly restrict the application of SLAM to some extent, in the context of cephalopod biology this seems to be an unavoidable restriction. The simpler snap-shot approach of the original LBSPR is based on the assumption of populations being close to equilibrium. The dynamic nature of cephalopod biology necessitates a more complex fully dynamic model structure more like LIME, which in turns must be informed by more complex time series of data.
It should again be noted that our time-line and resources limited our simulation testing to simply being a proof of principle. Our simulation testing did not span the full range of uncertainties likely to be associated with data-limited octopus fisheries. For example, the simulated data was generated assuming reasonably large sample sizes, relatively low sampling error on the indices of catch, effort and abundance (CV = 15%), and a direct relationship between fishing effort and fishing mortality. We also have not considered uncertainty in the assumed life-history parameters, growth, maturity, natural mortality, or the spawner-recruitment relationship. Within the resources and time available for our project it was infeasible to fully explore all the possibly plausible sensitivity tests. Octopus biology is so poorly documented that simply bounding uncertainty around the central life history parameters is a challenging exercise. Nevertheless, these results still demonstrate that in principle the size-based SLAM model can estimate key indices for the escapement of breeding biomass with potential to facilitate managing the risk of recruitment overfishing.
None of this diminishes the fact that the uncertainty associated with the assumed life-history parameters, and the error associated with sampling, will likely be greater than considered here, so that results from datasets with only one or two years of available CAW data should be interpreted with caution, as should the results from our 17 case studies.
4.2 Application to case studies
In the context of the above caveats, we applied SLAM to 17 study sites revealing a range in the temporal patterns of F and SPR within, and between (Figures 3, 5). Some of this apparent variation may, however, serve to emphasise the results of our simulation testing which demonstrates the importance of extending time series and improving data.
For example, examining the villages with the most variable results (Figures 3, 5) reveals they tended to have smaller CAW samples, which often exhibited a degree of poly-modality that SLAM failed to fit accurately (e.g. Bulutui, Gangga Satu, Likupang Dua; Supplementary Figures S2–S8 and Uwedikan; Supplementary Figures S2–24) and/or relatively short time series data (e.g. Ketapang; Supplementary Figures S2–S16). The estimates from villages with the longest time series (Figures 3, 5) and consistently larger unimodal CAW samples (i.e. Kalumbatan, Lobuton and Popisi) were generally more consistent over time, and fits to the CAW data were closer (Supplementary Figures S2–S15). This observation only serves to emphasise the truism that improving data collection is the key to making the assessment of data-poor fisheries more reliable.
The primary assumptions underlying our application SLAM to the case studies, is that the power curve form of growth documented by Herwig et al. (2012), as well as that the relativity between size at maturity and maximum size, are likely to be typical for all our study sites when in a lightly exploited state.
A further underlying assumption in our application of SLAM is that geographic variation in growth, can be accounted for by scaling weight at age relationships, relative to observed differences in weight at maturity e.g., a 30% larger weight at maturity indicates a 30% larger average maximum size. These assumptions parallel the way LBSPR assessment uses the LHR to generically define growth curves for fish taxa, as well as to scale catch size compositions to local estimates size of maturity (Prince et al., 2015). This parallel application of teleost linked ideas might potentially provide a new model for how biological information derived from a relatively data-rich context (Herwig et al., 2012), might be used to inform the assessment of data-poor cephalopod fisheries.
Another assumption implicit in our approach is that the source of the estimates being used to provide the baseline against which SLAM compares our case studies are compared is relatively lightly fished. This assumption must be made explicit as it concerns our baseline for assessing stock status. In the case of Herwig et al. (2012)’s study of the Ningaloo Marine Park, this is probably a reasonably safe assumption, as there was no commercial or artisanal fisheries, and the recreational fishing primarily targets reef and pelagic fish.
A more far-reaching assumption relied upon here is that, in relative terms, the same form of power curve growth and the relativity in lightly exploited populations between size of maturity and maximum size is shared by different populations of O. cyanea across their range. Given that Prince et al. (2023) have demonstrated that entire families and genera of teleosts share the same LHR and thus similarly shaped growth curves and relativities between size of maturity and maximum size, it seems likely that all octopus share the same growth pattern and relativity between maturity and maximum size. Growth studies using daily growth increments being conducted at some of our case study sites might allow this premise to be tested, although the greater fishing pressure at our sites may complicate comparison with Herwig et al. (2012)’s relatively lightly exploited population.
Our application of a single estimate of weight at maturity to scale Herwig et al. (2012)’s growth curve to all our 17 case studies does, however, imply there are no regional differences in growth between our sites, which given their geographic distribution and the oceanographic complexity of Indonesia seems unlikely. The accuracy of our assessments would almost certainly be improved by scaling the form of growth to local estimates of weight of maturity for each site. This again leads us back to the truism that data-poor assessments will be improved by collecting more data.
4.3 Linking assessment model to management
Traditionally the management of cephalopod fisheries has focussed on managing catches (Arkhipkin et al., 2021; Caddy, 1983). This is problematic in the context of data-poor fisheries which struggle to monitor, let alone manage catches. Effort-based management systems are likely to be more effective for stabilising harvest rates in fisheries exploiting rapidly changing levels of biomass (Caddy, 1983). In the context of the rapid life history and terminal spawning of cephalopods, Arkhipkin et al. (2021) has suggested that it would be advantageous to estimate RPs that index the escapement of biomass so that levels of reproductive potential can be conserved sufficient to minimise the risk of recruitment overfishing.
In this respect, the SPR metric estimated by SLAM is a particularly useful RP. Originally developed to index the risk of recruitment failure; it incorporates the impact of size of selectivity together with F to index the proportion of unfished spawning biomass escaping the fishery (Mace and Sissenwine, 1993). As a management RP, the metric could be used simply to adjust the total amount of effort, or fishing capacity in a fishery to achieve target SPR levels. For example, taken at face value, the results suggest that the fishing mortality at the Kadoda site is about twice as high as the optimal level. This suggests that if fishing effort could be reduced by around half (Figure 7), with fewer fishing days or collectors, similar catches would result but the cost of fishing would be significantly reduced. On the other hand, these results suggest that fishing effort at the Grogos and Uwedikan sites could be increased (Figure 7). The SPR metric might also be used to inform management policies based on either permanently or rotationally closed areas. For example, assuming that closures were being applied at similar scales to that of component populations, as well as to areas containing habitat of relatively uniform quality, the proportion of fishing grounds closed to fishing could be assumed proportional to SPR. Similarly, in the context of assessed levels of F, management policy could also use minimum size limits, or gear restrictions, to adjust size selectivity and conserve basal target levels of SPR.
The caveat here is that, as with many other facets of octopus fisheries biology, little is known about the most appropriate SPR targets for cephalopods. The widely and generically applied RPs for SPR were developed originally in the context of teleost biology (Mace and Sissenwine, 1993). Theoretically, at least, cephalopods which are thought to be highly productive might potentially be managed to lower RPs (Clark, 2002).
4.4 Further research and development
While demonstrating in principle the utility of SLAM for the data-poor assessment of cephalopods, these results suggest the following priorities for further development and research;
4.4.1 Additional simulation testing
Further sensitivity tests could evaluate the performance of SLAM under a wider range of uncertainties than possible here. For example, its performance is likely to deteriorate with smaller monthly sample sizes of the weight composition data. Additionally, data sets may have patchy time series data, or larger variability in the observed indices of catch, effort and abundance. Further simulation testing should evaluate the performance of SLAM under a wider range of fishery dynamics and data collection scenarios. Uncertainty around assumed life history parameters also need to be more adequately addressed. Currently, SLAM assumes single ‘best’ estimates of parameters such as natural mortality, growth pattern, and maturity at age schedules. Further simulation testing could evaluate how estimates vary as assumed parameter values change.
4.4.2 Further developments of the assessment model
SLAM could also be extended into a Bayesian framework, which would allow input parameters to be provided as distributions that span uncertainty, rather than fixed values. Within a Bayesian framework, SLAM could propagate uncertainty through the assessment, and the resulting posterior distributions used to quantify the uncertainty around assessment results (e.g. F and SPR), as well as the extent to which the various estimates of life-history parameters are supported by the data.
SLAM could also be extended into a hierarchical framework, enabling it to share information across different but parallel data sets which can be assumed to experience similar oceanographic and/or biological conditions. For example, seasonal recruitment patterns were common across our study sites but at many sites the data were inadequate to resolve that effect. If that recruitment patter was considered likely to be similar across different sites, a hierarchical model could account estimate the seasonal recruitment pattern simultaneously from all data sets, rather than estimating them, or failing to estimate them independently for each site as is currently done. In this way, information from multiple data-limited applications could be used more effectively to inform the assessment of individual fisheries.
4.4.3 Data-rich studies to inform data-limited assessment
Cephalopod assessment in general would greatly informed by some well executed data-rich studies of relatively lightly fished, or preferably unfished octopus stocks, similar to the study of Herwig et al. (2012). Such studies should focus on estimating rates of natural mortality prior to spawning through direct observation and aging studies, rather than the application of potentially spurious teleost size correlations. Aiming to determine the extent to which life history characteristics are shared across cephalopod populations and taxa studies should focus on improving our knowledge of typical forms of growth, variability around size and age of maturity, and their relativity to unfished maximum size.
Ideally the performance of SLAM should be trialled alongside more data-rich depletion methods for octopus assessment. Beyond the world of simulation testing, such parallel testing would provide the ultimate test bed for both methodologies. Conducted together they could also provide an alternative means of directly estimating the pre-spawning rate of natural mortality; which has so far proved very challenging to define.
Data availability statement
The original contributions presented in the study are included in the article/Supplementary Material, further inquiries can be directed to the corresponding author/s.
Ethics statement
The manuscript presents research on animals that do not require ethical approval for their study.
Author contributions
JP: Conceptualization, Methodology, Project administration, Writing – original draft. IR: Data curation, Funding acquisition, Project administration, Writing – review & editing. WS: Data curation, Writing – review & editing. DK: Writing – review & editing. CG: Conceptualization, Funding acquisition, Writing – review & editing.
Funding
The author(s) declare financial support was received for the research and/or publication of this article. The Walton Family Foundation (Grant numbers 00108538 and 00101982).
Acknowledgments
We are grateful to Carl Walters and Adrian Hordyk for helpful comments and suggestions about model development, and Masumi Gudka for helpful critiques of this manuscript. For their collaboration with Blue Ventures staff we also grateful to: Arya Kusuma Dhani, Inayah, Petronela Mogi Padja, organisations AKAR, Ecosystem Impact (EI), Forum Kahedupa Toudani (FORKANI), Forum Nelayan Binongko (FONEB), Jaring Advokasi Pengelolaan Sumber Daya Alam (JAPESDA), Juang Laut Lestari (JARI), Komunitas Nelayan Wangi-Wangi (KOMANANGI), YAPEKA, Yayasan Alam Indonesia Lestari (LINI), Yayasan Baileo Maluku, Yayasan Citra Mandiri Mentawai (YCMM), Yayasan Pesisir Lestari (YPL), Yayasan Tananua Flores, and also to the fishing communities that supported these people and organisations in collecting their fisheries data: Darawa, Lohoa, Sombano, Kapota, Kapota Utara, Kabita, Kabita Togo, Wali, Jaya Makmur, Lagongga, Kampo-kampo, Bulutui, Gangga Satu, Likupang Dua, Popisi, Kalumbatan, Lobuton, Mekar Indah, Kahu-kahu, Poto Tano, Labuhan Lombok, Ketapang, Seruni Mumbul, Arubara, Maurongga, Podenura, Maubasa, Maubasa Timur, Kotodirumali, Serandori, Akoon, Grogos, Kidan, Kwamor Mata’ata, Maar, Namalomin, Gorua, Cendana, Merpas, Linau, Uwedikan, Kadoda, Torosiaje, Korit Buah, Sinaka, Labuhan Jaya, Labuhan Bajau and Labuhan Bakti.
Conflict of interest
Author JP was employed by Biospherics P/L.
The remaining authors declare that the research was conducted in the absence of any commercial or financial relationships that could be construed as a potential conflict of interest.
Generative AI statement
The author(s) declare that no Generative AI was used in the creation of this manuscript.
Any alternative text (alt text) provided alongside figures in this article has been generated by Frontiers with the support of artificial intelligence and reasonable efforts have been made to ensure accuracy, including review by the authors wherever possible. If you identify any issues, please contact us.
Publisher’s note
All claims expressed in this article are solely those of the authors and do not necessarily represent those of their affiliated organizations, or those of the publisher, the editors and the reviewers. Any product that may be evaluated in this article, or claim that may be made by its manufacturer, is not guaranteed or endorsed by the publisher.
Supplementary material
The Supplementary Material for this article can be found online at: https://www.frontiersin.org/articles/10.3389/fmars.2025.1647742/full#supplementary-material
References
Arkhipkin A. I., Hendrickson L. C., Payá I., Pierce G. J., Roa-Ureta R. H., Robin J.-P., et al. (2021). Stock assessment and management of cephalopods: Advances and challenges for short-lived fishery resources. ICES J. Mar. Sci. 78, 714–730. doi: 10.1093/icesjms/fsaa038
Beverton R. J. H. and Holt S. J. (1957). On the dynamics of exploited fish populations Vol. 19U.K. Ministry of Agriculture and Fisheries, Fisheries Investigations (Series 2) (New York, NY: Springer Science & Business Media), 533.
Brown J. H., Gillooly J. F., Allen A. P., Savage V. M., and West G. B. (2004). Toward a metabolic theory of ecology. Ecology 85, 1771–1789. doi: 10.1890/03-9000
Caddy J. F. (1983). “The cephalopods: factors relevant to their population dynamics and to the assessment and management of stocks,” in Advances in Assessment of World Cephalopod Resources, vol. 231. FAO Fisheries Technical Papers (FAO Publications, Rome), 416–457.
Canales C. M., Punt A. E., and Mardones M. (2021). Can a length-based pseudo-cohort analysis (LBPA) using multiple catch length-frequencies provide insight into population status in data-poor situations? Fisheries Res. 234, 105810. doi: 10.1016/j.fishres.2020.105810
Clark W. G. (2002). F35% revisited ten years later. North Am. J. Fisheries Manage. 22, 251–257. doi: 10.1577/1548-8675(2002)022<0251:FRTYL>2.0.CO;2
Costello C., Ovando D., Hilborn R., Gaines S. D., Deschenes O., and Lester S. E. (2012). Status and solutions for the world’s unassessed fisheries. Science 338, 517–520. doi: 10.1126/science.1223389
Cripps G. C. and Harris A. (2018). Small-scale octopus fisheries, Indonesia—A primer for fisheries stakeholders (Blue Ventures Conservation Report) (Blue Ventures). Available online at: https://blueventures.org/wp-content/uploads/2021/03/Small-scale_octopus_fisheries_Indonesia_-_online_version.pdf (Accessed November 1, 2024).
Froese R., Winker H., Coro G., Demirel N., Tsikliras A. C., Dimarchopoulou D., et al. (2018). A new approach for estimating stock status from length frequency data. ICES J. Mar. Sci. 75, 2004–2015. doi: 10.1093/icesjms/fsy078
Herwig J. N., Depczynski M., Roberts J. D., Semmens J. M., Gagliano M., and Heyward A. J. (2012). Using age-based life history data to investigate the life cycle and vulnerability of octopus cyanea. PloS One 7, e43679. doi: 10.1371/journal.pone.0043679
Hilborn R. and Walters C. J. (2021). Steep recruitment relationships result from modest changes in egg to recruit mortality rates. Fisheries Res. 237, 105872. doi: 10.1016/j.fishres.2020.105872
Hoenig J. M. (1983). Empirical use of longevity data to estimate mortality rates. Fishery Bull. 82, 898–903.
Hordyk A. R., Ono K., Prince J. D., and Walters C. J. (2016). A simple length-structured model based on life history ratios and incorporating size-dependent selectivity: Application to spawning potential ratios for data-poor stocks. Can. J. Fisheries Aquat. Sci. 73, 1787–1799. doi: 10.1139/cjfas-2015-0422
Hordyk A. R., Ono K., Valencia S., Loneragan N., and Prince J. (2015). A novel length-based empirical estimation method of spawning potential ratio (SPR), and tests of its performance, for small-scale, data-poor fisheries. ICES J. Mar. Sci. 72, 217–231. doi: 10.1093/icesjms/fsu004
Mace P. and Sissenwine M. (1993). “How much spawning is enough?,” in Risk evaluation and biological reference points for fisheries management, vol. 120 . Eds. Smith S. J., Hunt J. J., and Rivard D. (Ottawa, Canada: Canadian Special Publications in Fisheries and Aquatic Sciences), 101–118.
Mendelssohn R. (1982). Discount factors and risk aversion in managing random fish populations. Can. J. Fisheries Aquat. Sci. 39, 1252–1257. doi: 10.1139/f82-166
Pauly D. (1980). On the interrelationships between natural mortality, growth parameters, and mean environmental temperature in 175 fish stocks. J. du Conseil Int. pour l’ Explor. la Mer 39, 175–192. doi: 10.1093/icesjms/39.2.175
Prince J. D., Victor S., KloulChad V., and Hordyk A. (2015). Length based SPR assessments of eleven Indo-Pacific coral reef fish populations in Palau. Fisheries Res. 171, 42–58. doi: 10.1016/j.fishres.2015.06.008
Prince J. D., Wilcox C. W., and Hall N. (2023). How to estimate life history ratios to simplify data-poor fisheries assessment. ICES J. Mar. Sci 80,2619–2629. doi: 10.1093/icesjms/fsad026
R Core Team (2022). R: A language and environment for statistical computing. Available online at: https://www.R-project.org/ (Accessed October 29, 2025).
Roa-Ureta R. H., Henríquez J., and Molinet C. (2020). Achieving sustainable exploitation through co-management in three Chilean small-scale fisheries. Fisheries Res. 230, 105674. doi: 10.1016/j.fishres.2020.105674
Rudd M. B. and Thorson J. T. (2018). Accounting for variable recruitment and fishing mortality in length-based stock assessments for data-limited fisheries. Can. J. Fisheries Aquat. Sci. 75, 1019–1035. doi: 10.1139/cjfas-2017-0143
Sauer W. H. H., Gleadall I. G., Downey-Breedt N., Doubleday Z., Gillespie G., Haimovici M., et al. (2021). World octopus fisheries. Rev. Fisheries Sci. Aquaculture 29, 279–429. doi: 10.1080/23308249.2019.1680603
Silas M. O., Kishe M. A., Mshana J. G., Semba M. L., Mgeleka S. S., Kuboja B. N., et al. (2021). Growth, mortality, exploitation rate and recruitment pattern of Octopus cyanea (Mollusca: Cephalopoda) in the WIO rrgion: A case study from the Mafia Archipelago, Tanzania. West Indian Ocean J. Mar. Sci. 20, 71–79. doi: 10.4314/wiojms.v20i1.7
Keywords: Octopus cyanea, spawning potential ratio, data-poor assessment, octopus fisheries, short-lived assessment model
Citation: Prince JD, Rufiati I, Septiani WD, Kembaren DD and Gough CLA (2025) A novel size-based method for assessing the spawning potential ratio of data-poor octopus fisheries. Front. Mar. Sci. 12:1647742. doi: 10.3389/fmars.2025.1647742
Received: 16 June 2025; Accepted: 13 October 2025;
Published: 03 November 2025.
Edited by:
Fabio Carneiro Sterzelecki, Federal Rural University of the Amazon, BrazilReviewed by:
Natalie Anne Dowling, Oceans and Atmosphere (CSIRO), AustraliaPeilong Ju, Zhejiang Ocean University, China
Copyright © 2025 Prince, Rufiati, Septiani, Kembaren and Gough. This is an open-access article distributed under the terms of the Creative Commons Attribution License (CC BY). The use, distribution or reproduction in other forums is permitted, provided the original author(s) and the copyright owner(s) are credited and that the original publication in this journal is cited, in accordance with accepted academic practice. No use, distribution or reproduction is permitted which does not comply with these terms.
*Correspondence: Indah Rufiati, aW5kYWgucnVmaWF0aUBibHVldmVudHVyZXMub3Jn