 Fan Li1,2
 Haijie Gao
 Pengzhi Qi
 Xianzhe Cai
- 1School of Economics and Management, Zhejiang Ocean University, Zhoushan, China
- 2School of Management, Ocean University of China, Qingdao, China
- 3National Engineering Research Center For Marine Aquaculture, Zhejiang Ocean University, Zhoushan, China
Marine fisheries scientific and technological innovation level (MFSTIL) drives the modernization and sustainability of China’s fisheries. Based on the panel data of 11 coastal provinces and cities in China from 2011 to 2022, the article used the entropy weight-TOPSIS method, spatial econometric model (Standard Deviation Ellipse), Dagum Gini coefficient, Markov modified grey prediction model and other methods to analyze the spatiotemporal differentiation of China’s MFSTIL and its future development trend. The results show that: (1) China’s MFSTIL was generally good and grew steadily year by year from 2011 to 2022, but regional development was uneven; (2) The temporal evolution of MFSTIL has a sequence of “slow rise-rapid rise-steady rise”, and the differentials between regions also fluctuate upward; (3) The spatial pattern of MFSTIL is uneven in distribution, and there are “lagging areas” in the three major marine economic zones; in terms of evolution, it has the dynamic equilibrium characteristics of “northeast-southwest”, and the center of gravity of the standard deviation ellipse moves first to the northeast and then to the southwest; (4) The overall spatial variation in MFSTIL has increased year by year in recent years, with hyper-variance density contributing most significantly to regional differences; (5) The MFSTIL will maintain the growth trend of the previous 12 years in 2023-2030, and the ranking of provinces will change slightly. The gap between the northern and eastern regions will narrow, while their disparity with the southern region will widen, the absolute gap between regions cannot be ignored. In this regard, the article proposed following suggestions: (1) Implement targeted support strategies through special funds and the construction of industry-academia-research integration platforms to identify and empower regions lagging behind in innovation, thereby stimulating local scientific research and innovation capabilities; (2) Optimize the spatial layout of the three major marine economic zones, build integrated industrial chains, and achieve complementary regional development; (3) Establish a dynamic monitoring and early warning system based on big data and the Internet of Things to achieve real-time monitoring of resources, the environment, markets, and industries, thereby promoting sustainable and balanced development.
1 Introduction
Marine fishery is a core pillar industry of China’s maritime power strategy, ensuring food security through its “blue food system” function and driving growth in related industries, such as shipbuilding and biopharmaceuticals, through technology spillover effects. In 2024, China’s total marine production value reached 10.54 trillion yuan, with the added value of marine fisheries amounting to 488 billion yuan, accounting for 4.62%. This makes it China’s third-largest marine industry, behind marine tourism industry (15.3%) and maritime transport industry (7.77%) (Ministry of Natural Resources- PRC, 2025). However, the global COVID-19 pandemic that occurred in 2019 had a huge impact on the import and export of aquatic products, it has also restricted fishermen’s operations at sea (Chang et al., 2022). The stable growth trend that had been established in the marine fishery economy over many years has been disrupted. After the outbreak of the epidemic, the Ministry of Agriculture and Rural Affairs issued the “Notice on Doing a Proper Job in Fishery Ship Management and Other Related Matters during the Period of Pandemic Prevention and Control” and other related policies to mitigate the damage caused by the pandemic. Besides the pandemic, the extensive growth model has led to a series of resource and ecological issues in marine fisheries (Han et al., 2022; Li et al., 2023), while deficiencies such as a low-end industrial chain, insufficient innovation capacity, and inadequate marine resource development capabilities have become increasingly evident (Wang and Ning, 2017; Yang and Wang, 2024), significantly hindering the long-term growth of marine fisheries. Science and technology are important drivers of productivity, especially for traditional industries such as marine fisheries. Cutting-edge technology and advanced equipment can greatly improve production capacity and efficiency, and also promote the sustainable development of the marine fisheries industry (Xiao et al., 2022). In 2021, the Ministry of Agriculture and Rural Affairs of People’s Republic of China issued “the 14th Five-Year National Fisheries Development Plan”, which clearly stated that fisheries development should adhere to the following guiding principles: “ensure stable production and supply, enhance efficiency through innovation, promote green and low-carbon development, strengthen regulation and safety, and increase fishers’ prosperity”. It emphasized that China should focus on strengthening its independent innovation capabilities in fisheries science and technology. By leveraging advanced technologies and equipment of the new era, the country can improve the production conditions of marine fisheries, enhance resource utilization rates, and boost labor productivity, thereby further facilitating the sustainable development of China’s marine fisheries. Therefore, under the backdrop of building a maritime powerhouse, it is necessary to explore the evolutionary characteristics and future development trends of China’s marine fisheries scientific and technological innovation level (MFSTIL) to clarify the current status, issues, and trends in marine fisheries development. This holds significant guiding significance for achieving high-quality development in marine fisheries.
As the importance of the marine economy continues to grow within the national economy, an increasing number of scholars are turning their attention to technological innovation in the marine fisheries sector. Currently, academic research on technological innovation in marine fisheries primarily focuses on the following areas. First, studies evaluating the innovative driving capacity of marine fisheries. For example, Shen and Yu (2014) measured the innovation-driven ability of the marine fisheries industry from an industrial perspective, using five dimensions: “innovation foundation, industrial cluster environment, industrial research collaboration, and inter-industrial technology spillover effects”, providing valuable insights for industrial development. Wang and Ning (2017) utilized the Diamond Model, constructed an indicator system based on five dimensions: “production factors, market demand, industrial linkages, industrial competition, and government orientation”, and determined the comprehensive indicators through principal component analysis. Fu et al. (2022b) assessed the innovation capabilities of marine fisheries in China’s coastal regions from static and dynamic perspectives. Fu et al. (2022a) analyzed the spatiotemporal characteristics of innovation capabilities in marine fisheries in China’s coastal regions, summarizing the convergence patterns in the Bohai Rim, Yangtze River Delta, and Pearl River Delta. Second, studies on the influencing factors of marine fisheries scientific and technological innovation efficiency, such as Liu et al. (2022), based on measuring the efficiency of marine fishery science and technology innovation in Shandong Province, used the Tobit model to identify several factors affecting efficiency. Third, strategies and pathways for the development of marine fisheries scientific and technological innovation, which were first studied by Ni and Han (2009), primarily analyzing the status and issues of marine fisheries development at that time and proposed countermeasures for technological development in line with the policy background of marine fisheries modernization. Subsequently, Dong and Gao (2010) adopted Schumpeter’s innovation theory from the perspective of marine fisheries products, emphasizing the need for innovation in products, including fisheries technological innovation, by enhancing the conversion of fisheries science and technology achievements, extending the marine fisheries industry chain, and expanding the product system. Wang and Wang (2017) proposed three-pronged innovation pathways for Shandong Province’s marine fisheries from an ecological security perspective: scientific, technological, and industrialization dimensions. In addition to the above studies, relevant scholars discussed the importance of scientific and technological innovation in marine fisheries affairs: Gorospe et al. (2016) verified that technological innovation promotes marine fisheries management affair. Asche and Smith (2018) took fisheries and aquaculture as examples to illustrate that it is possible to solve various problems caused by resource scarcity through innovation in technology, policy, and markets. Lin et al. (2019) has verified that scientific and technological innovation is the major element behind the growth of the marine fisheries industry. Cromwell et al. (2025) point out the key role that digital technology plays in the traceability and transparency of the global fish supply chain. Some scholars have focused on policy hotspots, incorporating green elements into indicator systems to calculate the green innovation efficiency of marine fisheries (Fu et al., 2022c), and further validated the spatial spillover effects of several variables. Liu et al. (2023) also conducted similar measurement and evaluation studies. Based on the measurement of the MFSTIL, Feng et al. (2024) further studied the impact of scientific and technological innovation on the high-quality development of marine fisheries, while also verifying the mediating effect of marine green total factor productivity and marine industrial structure between the two. Other scholars have begun to focus on the integration of the marine fisheries industry chain and innovation chain (Di et al., 2024), studying the spatiotemporal differentiation of China’s marine fisheries industry chain and innovation chain, as well as the spatiotemporal evolution features of the integration and symbiosis of the “dual chains”, while also discussing the integration models and differentiated pathways of the marine “dual chains”.
In summary, current academic research on the theory of marine fisheries scientific and technological innovation is limited, with most studies focusing on the measurement and evaluation of the overall level of marine fisheries scientific and technological innovation. The subjects primarily target coastal regions of China or major fishing provinces such as Shandong, Guangdong and so on, with measurement methods including the entropy value method, entropy weight-TOPSIS method, and DEA method, among others. Evaluation methods include the Dagum Gini coefficient, Tiel index, and coupling coordination degree, among others. While existing research provides an important foundation for this study, there is still room for improvement: first, most existing literature adopts a holistic perspective to explore the development of scientific and technological innovation, but lacks relevant research from a specific perspective; second, existing studies primarily use historical data for empirical analysis, the spatiotemporal dynamics of marine fisheries’ scientific and technological innovation remain insufficiently studied, and research predicting the future trends of China’s MFSTIL also remains underdeveloped. To address these gaps, this paper draws on industry characteristics and realities, takes 11 coastal provinces (autonomous regions and municipalities) in China as the research object (China’s provincial-level administrative divisions include provinces, autonomous regions (ethnic minority autonomous regions), and municipalities (large cities under direct central government jurisdiction). All three have equal legal status but different functions), and constructs an evaluation index system to conduct a systematic evaluation of the spatiotemporal evolution patterns of MFSTIL and predicts its future trends. The possible contributions of this paper are mainly reflected in the following three aspects: (1) A comprehensive evaluation indicator system has been established to systematically assess the spatio-temporal characteristics of MFSTIL and conduct an in-depth analysis of its causes, providing decision-making support for promoting the balanced development of MFSTIL in China and worldwide; (2) Predictions of the future trends of MFSTIL reveal the pace and effectiveness of development in different regions, offering insights for the formulation of personalized policies; (3) An improved prediction model based on traditional gray theory, combined with Markov prediction methods, has been developed to correct residuals. Compared to other basic models, this model demonstrates higher accuracy and adaptability, providing methodological references for other studies.
2 Methods and data
2.1 Constructing the evaluation indicator system
Based on the unique characteristics and current development status of the marine fisheries industry, and drawing on existing evaluation indicator systems for scientific and technological innovation levels (Fu et al., 2022b; Feng et al., 2024), the study constructs an evaluation index system for the level of marine fisheries scientific and technological innovation based on three dimensions: scientific and technological innovation input, output, and environment, selecting 19 tertiary indicators. The index system were shown in Table 1.
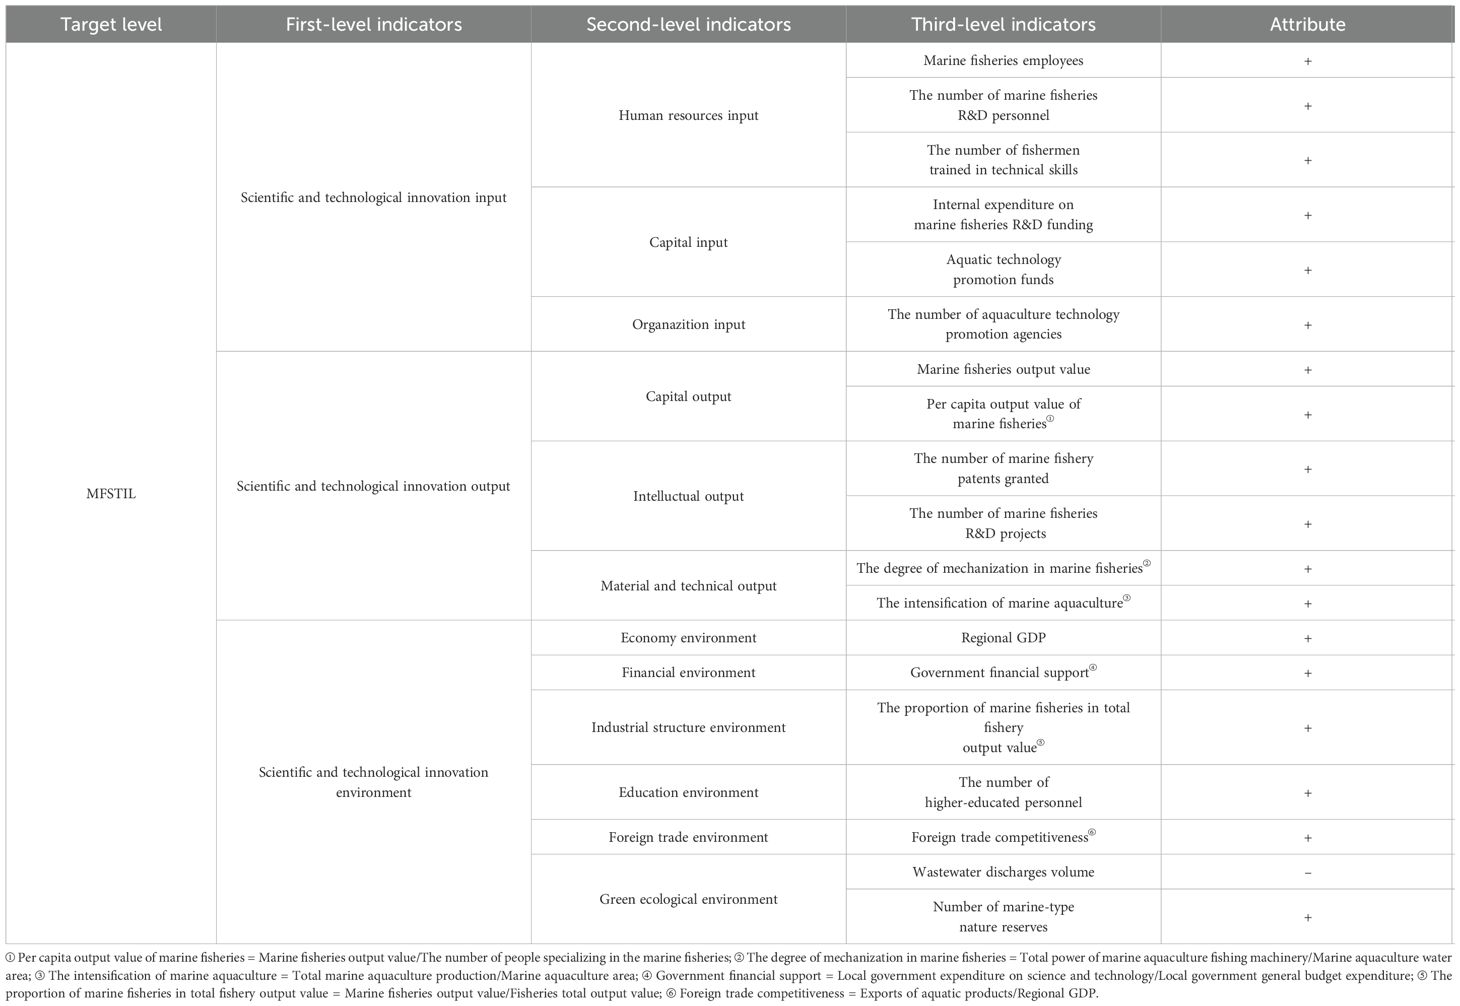
Table 1. Evaluation index system for the MFSTIL.
First, scientific and technological innovation input. Referring to the classic Cobb-Douglas production function theory (Cobb and Douglas, 1928), all outputs originate from factor inputs, and scientific and technological innovation activities are no exception. This study defines investment in scientific and technological innovation as the core elements, such as human, financial, and material resources, that must be allocated to promote innovation activities. These elements are not used to measure the broad scale of an industry, but rather serve as the direct driving force and fundamental guarantee for innovation activities. The scale and efficiency of their allocation determine the upper limit of innovation potential. In innovation theory, people are the carriers of knowledge and skills and the core subjects of innovation activities. The overall scale and structure of the employees constitute the knowledge base and talent pool for innovation, while R&D personnel represent the core force directly engaged in creative activities. Marine fishery technology research and development and promotion activities, especially basic and cutting-edge research, are characterized by high risk and long cycles. Therefore, substantial capital investment is necessary in the early stages of scientific and technological innovation activities to provide the material support needed to sustain these activities. Marine fisheries constitute a vital sector within the aquaculture industry, and their production technologies overlap to some extent with those of conventional aquaculture industries. Updates in aquaculture technologies play a significant role in promoting technological innovation and research activities in marine fisheries. So the promotion organazition of aquaculture technologies substantially elevates the comprehensive innovation ability in the marine fisheries sector. Therefore, this study selects marine fisheries employees, the number of marine fisheries R&D personnel, the number of fishermen trained in technical skills, internal expenditure on marine fisheries R&D funding, aquatic technology promotion funds, and the number of aquaculture technology promotion agencies to measure the innovation investment in marine fisheries.
Second, scientific and technological innovation outputs represent direct results formed after a series of transformations of innovation investments. It is the key to measuring the effectiveness and capacity of innovation activities. According to Schumpeter’s innovation theory, the essence of innovation is to introduce new production factors and production conditions into the production system. This study quantifies marine fisheries innovation outputs using three key dimensions: economic output, intellectual output, and material/technological output. Economic output refers to the economic benefits achieved by the marine fisheries industry through the empowerment of scientific and technological innovation, and it is also the ultimate goal of scientific and technological innovation activities. Intellectual output refers to various types of knowledge outputs obtained by marine fisheries research entities in scientific research, such as patents, research projects. These achievements are distinct from the core characteristics of general production activities. Material and technical output refers to various types of related production technologies and equipment developed by marine fisheries research institutions and enterprises, which can improve production efficiency and enhance industrial performance. These achievements are a comprehensive reflection of the effectiveness of technology application. Therefore, this paper selects marine fisheries output value, per capita output value of marine fisheries, the number of marine fishery patents granted, the number of marine fisheries R&D projects, the degree of mechanization in marine fisheries, and the intensification of marine aquaculture to measure the output of marine fisheries scientific and technological innovation.
Third, scientific and technological innovation environment reflects the institutional and infrastructural support systems that enable and sustain innovation activities in the studied regions, functioning as a critical external driver that facilitates continuous innovation and technological advancement in the industry. For an industry, important environmental factors include the economic environment, policy environment, industrial structure environment, cultural environment, foreign trade environment and green ecological environment. The economic environment is measured by GDP across regions, which indicates a region’s capacity to invest in R&D and absorb technological risks, as higher GDP areas tend to have stronger industrial ecosystems that nurture innovation. The policy environment is a crucial support for scientific and technological innovation activities. Specifically, for technological innovation in an industry, policies such as preferential tax policies for technology introduction can often greatly enhance the industry’s innovation capabilities (Wu and Zhong, 2020). The industrial structure environment is measured by the proportion of marine fisheries within the broader fisheries sector. It reflects the importance of marine fisheries in various regions, highlighting regional specialization and potential for innovation clustering. The education environment is assessed by the number of personnel with bachelor’s degrees or higher in aquatic product promotion institutions across regions, which can to some extent reflect the quantity and cultural literacy level of marine fisheries talent. The foreign trade environment can exposes regional industries to global technological spillovers and effectively stimulate their competitive vitality, explore market opportunities, facilitate the introduction, transfer, and innovation of advanced technologies, and promote industrial upgrading (Sheng, 2018; Wang et al., 2020). The green ecological environment is measured by wastewater discharges and the number of marine-type nature reserves. It reflects both the ecological burden imposed by human activities and the institutional efforts dedicated to environmental conservation. A sound ecological environment not only safeguards the natural foundations of marine fishery development, but also stimulates green technological transformation by imposing stricter environmental constraints and fostering demand for cleaner production, eco-friendly aquaculture, and sustainable innovation pathways (Jiang and Sun, 2025). Regions with more comprehensive marine ecological protections are more likely to support long-term innovation in environmentally sustainable fisheries technologies. Therefore, this paper selects regional GDP, government financial support, the proportion of marine fisheries in total fishery output value, the number of higher-educated personnel (bachelor’s degree or above) in aquatic technology promotion institutions, foreign trade competitiveness, wastewater discharge volume and the number of marine-type nature reserves to measure the marine fisheries scientific and technological innovation environment.
2.2 Research methods
2.2.1 Entropy weight-TOPSIS method
The entropy weight-TOPSIS method is a multi-attribute decision-making method that combines the entropy value method with the TOPSIS method and is widely applied in the calculation of multi-indicator evaluation systems (Gao et al., 2024; Erxin and Ying, 2025; Sha et al., 2025). When an evaluation system consists of multiple indicators, it is often challenging to integrate them due to differences in units of measurement and magnitude (Jin et al., 2024). Therefore, this paper first standardizes the original panel data, then uses the entropy method to calculate the weights of each indicator based on the panel data, and finally employs the euclidean distance method to calculate the relative proximity of each evaluation object to the ideal state, thereby determining the level of marine fisheries scientific and technological innovation for each sample region. The detailed calculation process can be seen as follows:
Step 1: Data standardization:
Let denote a certain evaluated indicator for a province, and its standardized value be .
In the Equations 1, 2, i and j represent the i-th province and the j-th indicator.
Step 2: Calculate the proportion of the j-th indicator for the i-th province:
In the Equation 3, represents the proportion of the j-th indicator in province i.
Step 3: Calculate the information entropy of the j-th indicator:
In Equation 4, represents the information entropy of the j-th indicator.
Step 4: The information entropy redundancy is calculated based on the information entropy:
In the Equation 5, represents the information entropy redundancy of the j-th indicator. The larger the information entropy redundancy, the larger the weight of the indicator.
Step 5: Calculate the weight of the j-th indicator:
In the Equation 6, is the weight of the j-th indicator.
Step 6: Establish a weighted matrix V based on the weights:
In the Equation 7, is the weighting matrix.
Step 7: Calculate the positive and negative schemes based on the weighting matrix:
In the Equations 8, 9, and are the positive and negative schemes for each indicator.
Step 8: Calculate the Euclidean distance:
In the Equations 10, 11, and are the Euclidean distances between the i-th province and the positive and negative schemes, respectively.
Step 9: Calculate the relative proximity (MFSTIL):
In the Equation 12, is the relative proximity. It is between 0 and 1, the higher expresses the higher MFSTIL.
2.2.2 Standard deviational ellipse
Lefever first created the Standard Deviational Ellipse (SDE) in 1926. Utilizing geospatial analysis methods, this research examines the spatial distribution features of both socioeconomic and environmental factors. And this method is widely applied across sociology (Rogerson, 2021), economics (Razzaq et al., 2024), ecology (Cai et al., 2025; Wang C. et al., 2025) and other fields. The basic components of the SDE include the centroid, azimuth, major axis, and minor axis. The center of gravity reflects the spatial distribution pattern of geographical elements, the azimuth demonstrates their primary directional trend, and the dispersion levels along dominant and subordinate directional trends are measured by the major and minor axis. The detailed computational steps are as follows (Wang et al., 2022):
In the Equations 13–16, represents the spatial location, denotes the weight; denotes the weighted mean center; the parameter θ denotes the SDE azimuth, it measured the clockwise angle from geographic north to its major axis of the SDE; denote the coordinate deviations of each study object’s location from the average center; and represent the standard deviations along the x axis and y axis, respectively.
2.2.3 Dagum Gini coefficient
To analyze disparities in regional economic development levels, Dagum introduced the Gini coefficient and its decomposition method in 1997. This approach has been widely applied to measure the primary sources of regional differences. Therefore, this paper employs Dagum’s Gini coefficient method to conduct a differential analysis of MFSTIL across China’s three major coastal marine economic zones. The relevant calculation steps are as follows:
In the Equations 17–22, denotes the overall Gini coefficient, n represents the number of provinces, k indicates the number of regions, is the average MFSTIL for the coastal regions, is the MFSTIL for the i-th province within region j; denotes the intra-regional Gini coefficient for region j; denotes the inter-regional Gini coefficient between regions j and h; , , ; , it assesses the degree of mutual influence between MFSTIL across regions, represents the difference in MFSTIL between region j and region h, is defined as the hyper-variable first moment; denotes the contribution from within-region variation, denotes the contribution from between-region variation, and denotes the contribution from hyper−variance density.
2.2.4 Grey prediction model
Julong Deng introduced Grey system theory and its associated methods in 1982. Its model imposes no special restrictions on modeling data and applies to situations characterized by “limited data” and “poor information”. It focuses on partially known information, utilizing effective information to achieve a comprehensive understanding of future changes in system operations. The grey theory and its affiliated methods have been widely applied to various fields such as economics (Li et al., 2019; Wang Z. et al., 2025), ecology (Song and Mei, 2022), medicine (Tu et al., 2023) and so on. Due to limitations in sample size, this paper introduces the GM(1,1) model to conduct time series forecasting of the future trends in MFSTIL for 11 coastal provinces and cities in China and performs post-hoc error tests to assess model accuracy. Follows are the calculation steps related to the traditional model (Deng, 2002):
In the Equation 23, original dataset was expressed as a non-equidistant sequence related to time (t) as X(0):
In the Equation 24, cumulate to generate AGO X(1):
Based on the AGO , construct a first-order differential equation:
In the Equation 25, α is the development coefficient,and μ is the grey action amount.
In the Equations 26, 27, construct the constant term vector and the cumulative matrix B:
In the Equation 27, is the whitened background value in the interval ; is the whitened background value in the interval ; are the time intervals between two consecutive dynamic inspections at times , respectively.
n the Equation 28, solve for the grey parameters (α and μ) by using the least squares method:
In the Equation 29, substitute the grey parameters α and μ into the Equation 25 to obtain the discrete response function:
Since obtained from the GM(1,1) model is a cumulative value, the predicted value must be restored to :
In the Equation 30, is the forecast value for period k, it must be compared with the original value, then a residual test must be performed on the model to determine its degree of accuracy. If the model accuracy is low, the original model needs to be improved.
To address the issue of insufficient model accuracy in some provinces, this paper adopts a GM(1,1) model based on Markov residual correction, whose core idea is to predict the residual sequence in the traditional GM(1,1) model. Additionally, to correctly predict the symbol of the residuals for future years, a Markov prediction method is introduced. This ultimately corrects and reduces the errors in the traditional model, thereby improving the model’s accuracy. The relevant calculation steps are as follows (Sun et al., 2005; Deng et al., 2024):
Based on the Equation 30, construct a sequence of residuals:
In the Equation 31, is the residual sequence. Perform traditional GM(1,1) forecasting on the residual sequence, obtain the output value of the residual sequence , the final prediction residual sequence can be expressed as:
In the Equation 32, is the prediction residual sequence, and the is the residual correction coefficient (Equation 33):
Since the symbol of the residual value for future time cannot be determined, the Markov prediction method is introduced. The residual state can only be positive or negative, if the residual is positive at ti, the state is recorded as “1”; otherwise, it is recorded as “0”. Then obtain the state transition matrix P:
In the Equation 34, P is the state transition matrix, represents the probability of state “1” transfer to state “1”, represents the probability of state “1” transfer to state “0”, represents the probability of state “0” transfer to state “1”, represents the probability of state “0” transfer to state “0”.
In the Equation 35, confirm the original state vector π(0):
In the Equation 36, confirm the symbol for the t-th period:
Lastly, the Markov modified prediction value is as follow:
In the Equation 37, is the final prediction value of the MFSTIL. The grey prediction model flowchart presented in Figure 1. The model accuracy levels are referenced in Table 2.
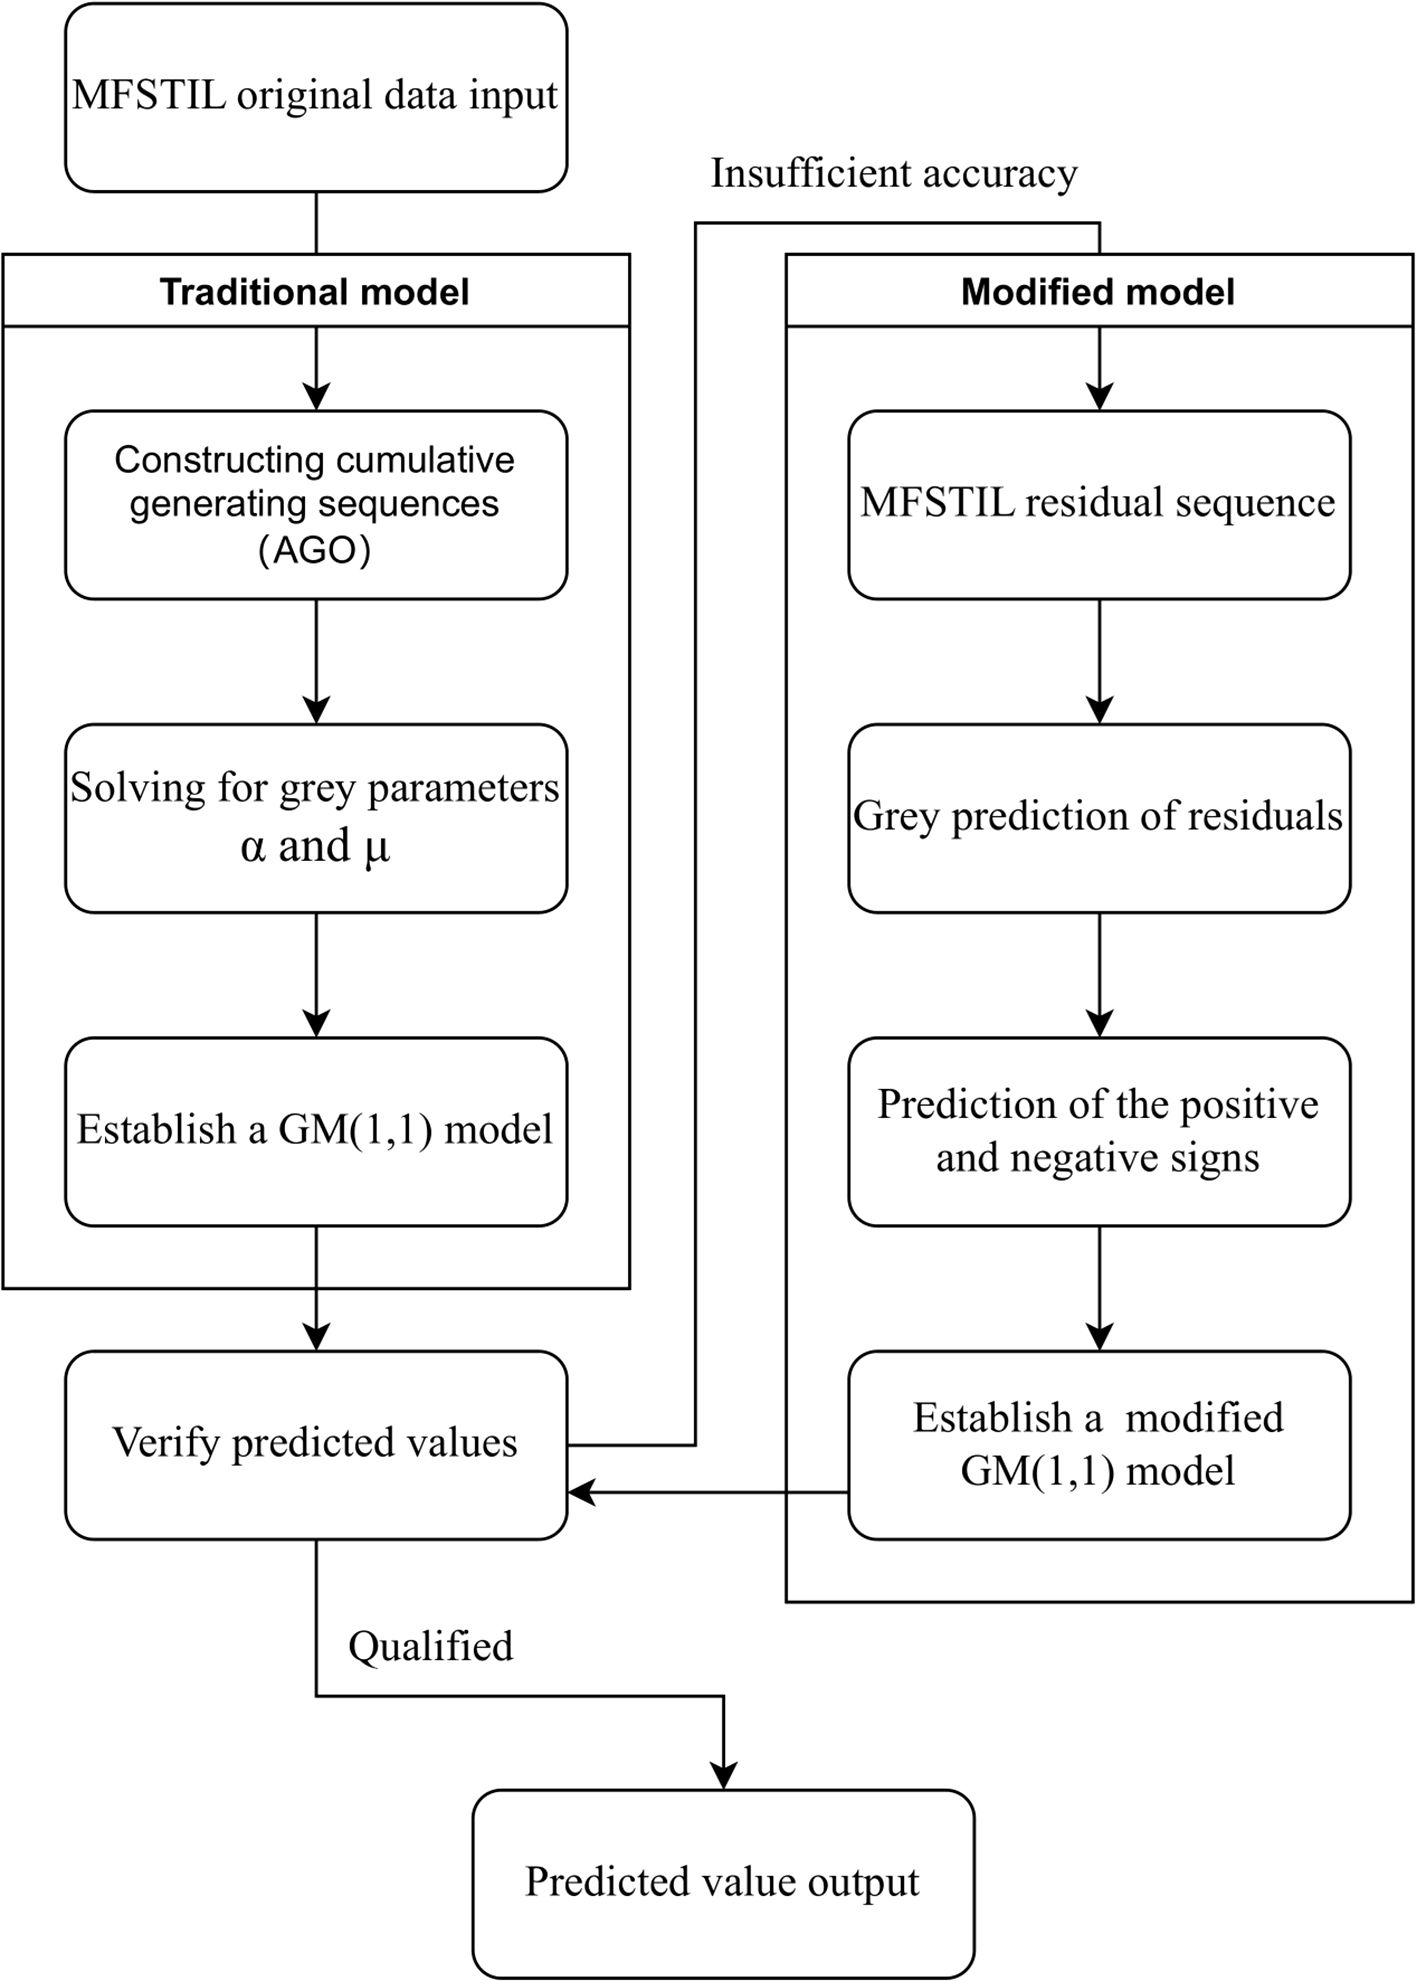
Figure 1. Flow chart of the Markov residual correction grey prediction model.
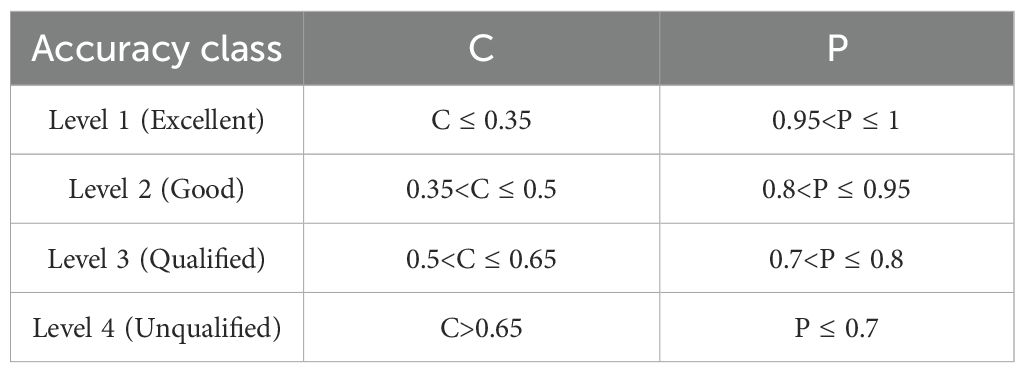
Table 2. Accuracy inspection grade reference table.
2.3 Data sources
Given considerations of data accessibility, completeness, and consistency, this research utilizes panel data from 11 Chinese coastal provinces (autonomous regions, and municipalities) covering 2011 to 2022. The original data is collected from the “China Fishery Statistical Yearbook”, “China Ocean Statistical Yearbook”, “China Statistical Yearbook”, and relevant government websites. Some indicators were calculated from the original data, and data for certain years and regions were missing, which were supplemented using linear interpolation methods. For data processing, this study followed the methods used in previous research (Gao et al., 2018; Ji et al., 2022), the number of marine fisheries R&D personnel, internal expenditure on marine fisheries R&D funding, the number of marine fisheries patent granted, and the number of marine fisheries R&D projects were estimated by multiplying the respective figures by the proportion of marine fisheries output in the total marine production value.
3 Spatiotemporal differentiation of MFSTIL
3.1 Temporal evolution of MFSTIL in China
Using the aforementioned entropy-weighted TOPSIS method, the MFSTIL in China’s 11 coastal provinces was calculated, with the results shown in Table 3. Overall, the MFSTIL in China has been steadily increasing, but the growth rate remains limited, rising from 0.2222 in 2011 to 0.2918 in 2022. The average annual level is 0.2492 and the average annual growth rate is 2.85%. This indicates that the the MFSTIL has significantly improved under the support of various policies benefiting the fisheries sector. From the aspection of the three major marine economic zones (referred to as “northern”, “eastern”, and “southern”), its overall pattern shows a gradient of “southern (0.3538) > northern (0.2656) > eastern (0.2440)”. Among these, the southern MFSTIL has shown the fastest growth rate, with a growth rate as high as 37.72% during the study period, and it has a higher value than the average value (0.2918) of coastal regions. However, the northern and eastern regions are close to the average level, showing a weaker growth trend.
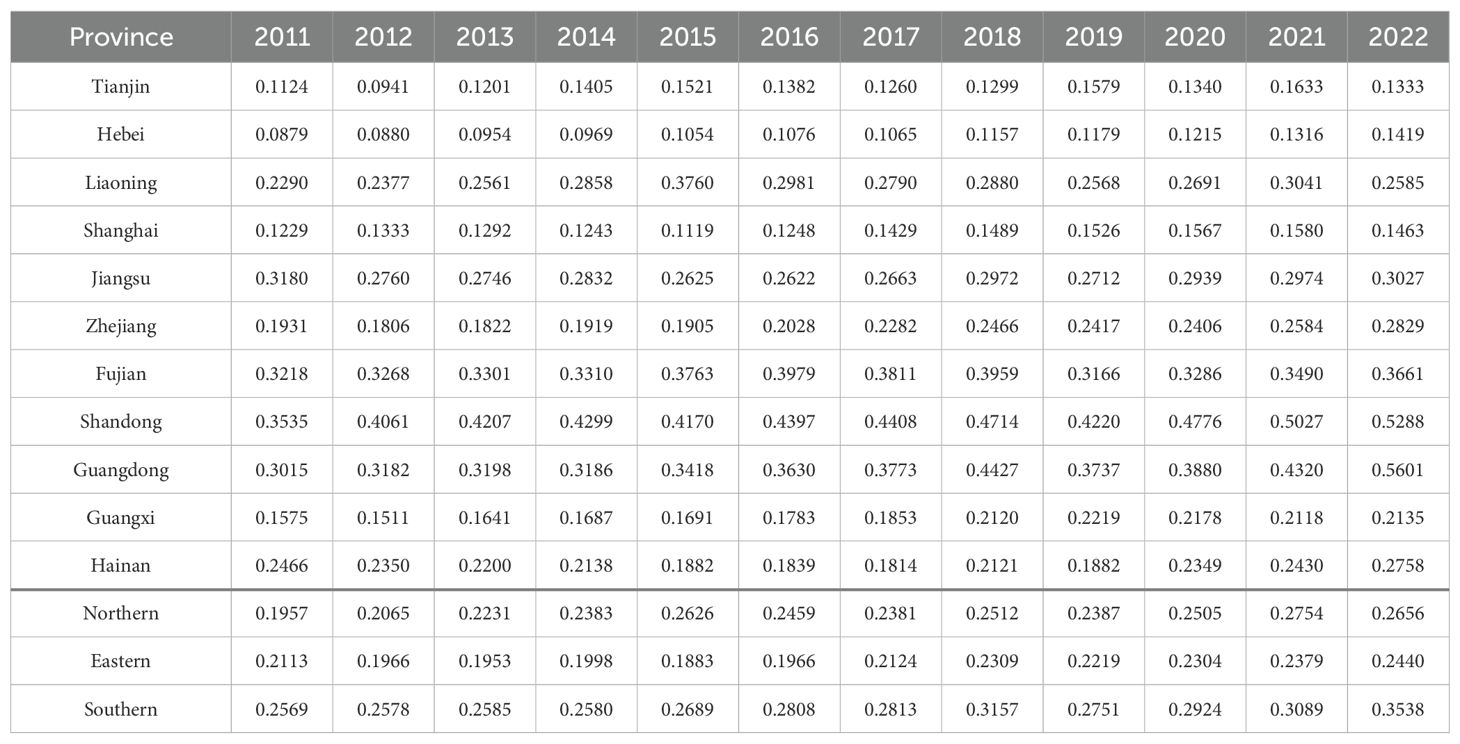
Table 3. The MFSTIL of 11 coastal provinces in China from 2011 to 2022.
The reasons are as follows: (1) In the southern region, Guangdong Province and Fujian Province lead in marine fisheries scientific and technological innovation, with Guangdong ranking first nationwide. This achievement is not only attributable to relatively favorable natural endowments (e.g., the vast fishing grounds in the South China Sea and suitable water temperature conditions), but also closely linked to the high priority accorded to southern coastal fishery technology by the national and local governments. In recent years, the implementation and enforcement of policy documents such as the “Notice of the General Office of the People’s Government of Fujian Province on Printing and Distributing the Action Plan for the Transformation and Upgrading of Marine Aquaculture” and the “Opinions of the General Office of the People’s Government of Guangdong Province on Accelerating the High-Quality Development of Modern Fisheries” have greatly improved the scientific and technological innovation environment in southern area and provided strong impetus for scientific and technological innovation and development. In addition to domestic policy drivers, the southern region faces more cross-border fishery disputes and international pressure due to its proximity to the South China Sea. Several international fisheries agreements that China adheres to (e.g., “United Nations Convention on the Law of the Sea” and “United Nations Fish Stocks Agreement”) place higher demands on the sustainability, safety, and monitoring transparency of marine fishing activities. In this context, to address the increasingly serious challenges of marine rights protection and resource sustainability, the southern region has taken the lead in promoting new smart fishery measures such as offshore aquaculture equipment, shipborne electronic monitoring systems (EMS), and satellite positioning fishing vessel management. These institutional pressures have stimulated increased regional investment in science and technology; (2) While the MFSTIL of the northern region is slightly higher than average, it exhibits a pronounced polarization trend. Shandong has traditionally been a major fishing province, boasting abundant marine fisheries resources and significant policy support. In contrast, although Liaoning also has a large marine fisheries scale, its marine fisheries industry primarily relies on traditional marine fishing and extensive aquaculture, with limited technological empowerment and an incomplete policy guidance mechanism, thereby restricting its potential for technological innovation development. The technological innovation levels of Tianjin and Hebei are the lowest along the coast. This is because Tianjin has a limited maritime area and a small fisheries scale, while Hebei has relatively poor marine ecology (Han et al., 2022) and scarce marine resources.These factors are unfavorable for the growth and progress of marine fisheries scientific and technological innovation in Tianjin and Hebei, thereby exacerbating the developmental inequalities of marine fisheries science and technology in the northern region. It is worth noting that the central government has gradually increased its policy investments in ecological restoration of northern nearshore waters. For example, the “Action Plan for Comprehensive Management of the Bohai Sea” aims to address the long-standing ecological issues in the Bohai Sea by implementing measures such as marine pollution control, ecological protection and restoration, and increased financial investments. These efforts have to some extent improved the ecological foundation and created conditions for future scientific and technological innovation and industrial development. However, significant results have not yet been achieved in the short term; (3) The eastern region ranks at the bottom in terms of marine fisheries scientific and technological innovation development, possibly because the marine and biological resources in the eastern seas are relatively scarce compared to the South China Sea region (Yin et al., 2011; Chang et al., 2021; Zhang et al., 2025). Additionally, the region’s development priorities are primarily focused on high-value-added manufacturing and the digital economy, resulting in relatively limited technological investment in marine fisheries, particularly traditional aquaculture and fishing industries. Additionally, certain policies have indirectly hindered the development of marine fisheries, such as China’s strict “ecological red line controls” and international requirements for the “sustainable use of fishery resources”. As a result, the eastern region has gradually strengthened its management of fishing quotas and fishing moratoriums. These internal and external factors have objectively compressed the production capacity of traditional fishing industries and collectively weakened the intrinsic motivation for technological innovation in marine fisheries.
As shown in Figure 2, the average values of MFSTIL in 11 coastal provinces of China exhibit phased characteristics in their temporal evolution. In summary, this development can be roughly divided into three phases: a slow growth phase (2011–2015), a rapid growth phase (2016–2018), and a stable growth phase (2019–2022). During the 2011–2015 period, the MFSTIL in China grew slowly, given that the policy during this stage prioritized conserving fishery resources and maintaining marine ecosystem sustainability. For example, “the National 12th Five-Year Plan” emphasized to construct a “blue ocean”, which slowed down the pace of fisheries industrial technology revolution to some extent. From 2016 to 2018, China’s MFSTIL developed rapidly. In 2016, “the 13th Five-Year National Fisheries Development Plan” was released, clearly proposing to accelerate the modernization of fisheries, promote fisheries industial technology innovation. What’s more, intensified policy backing from local authorities has accelerated the commercialization and practical deployment of fisheries-related technological innovations. From 2019 to 2022, the outbreak of COVID-19 brought severe damage to the marine fisheries industry, leading to a decline in the level of technological innovation in the sector. After suffering a major impact from COVID-19, the Chinese government quickly took measures and introduced various policies on epidemic prevention and control, resumption of work and production, to stabilize the marine fishery industry. During the post-2019 period, the “14th Five-Year National Fisheries Development Plan” proposed to promote the high-quality development of fisheries and strengthen institutional backing for marine fisheries innovation, with industries such as aquatic seed industry, aquatic product processing industry, and deep-sea aquaculture industry showing promising prospects.
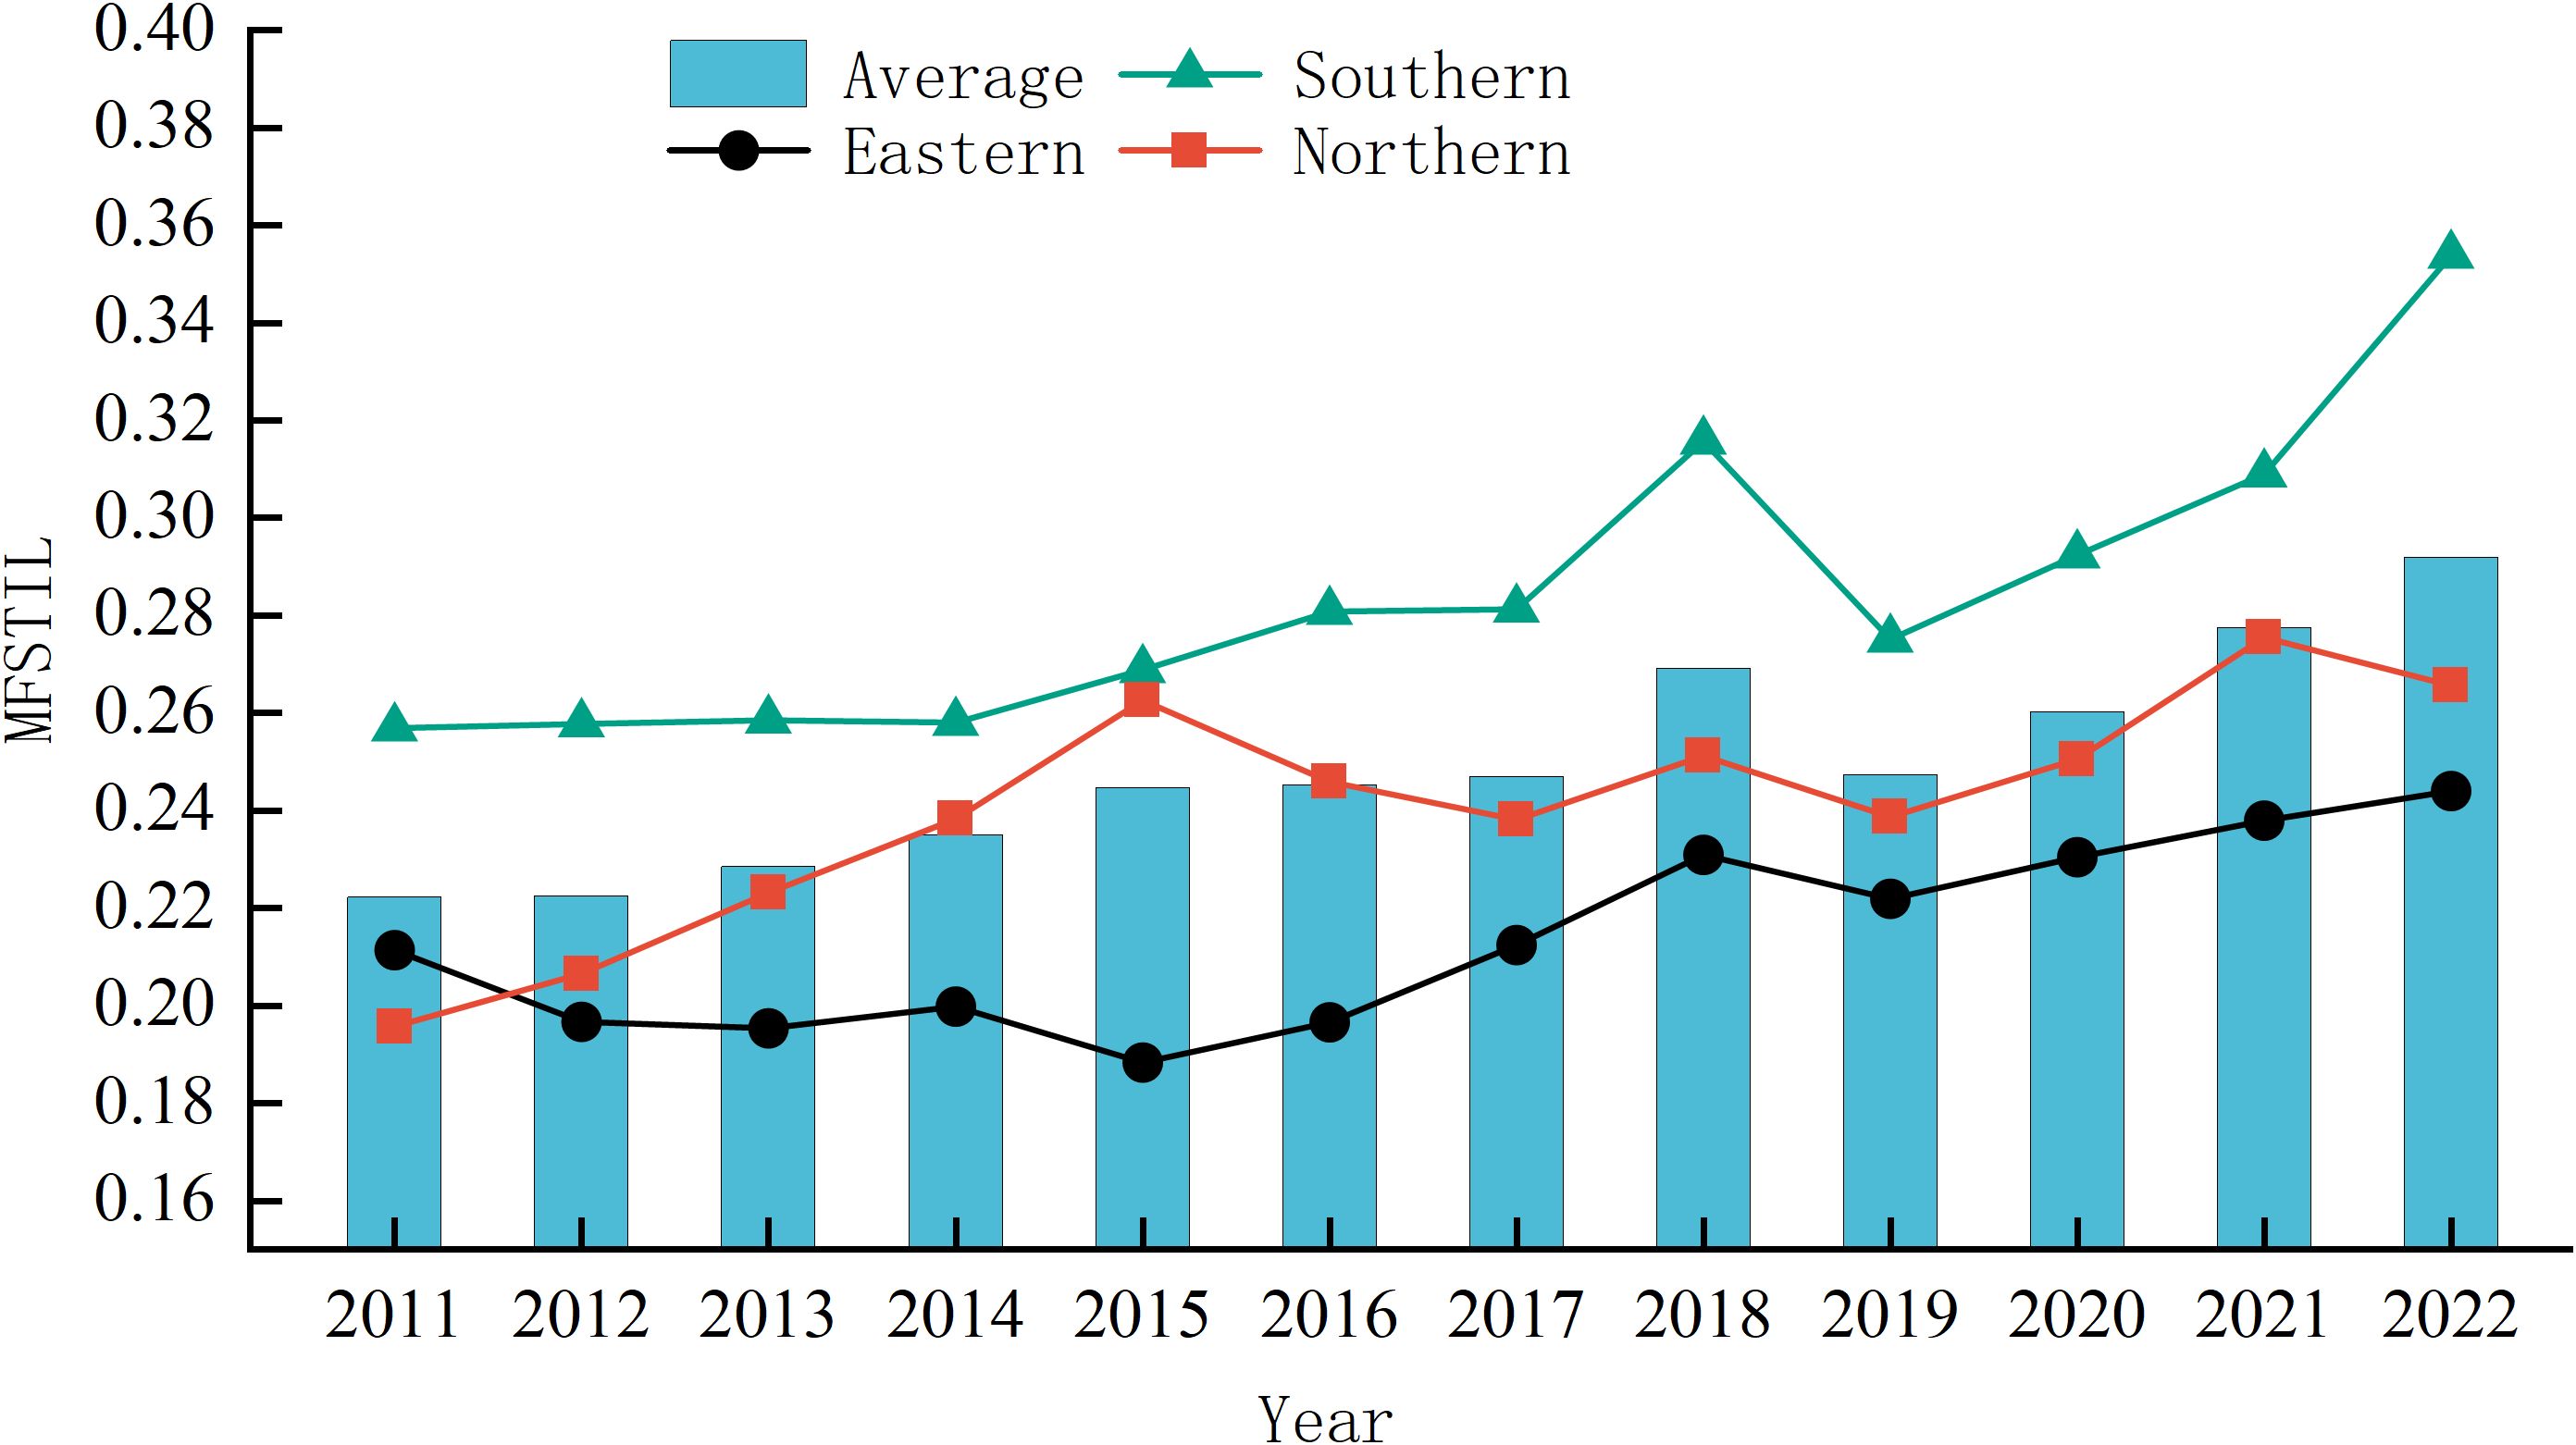
Figure 2. MFSTIL of 3 major marine economy zone in China from 2011 to 2022.
The regional disparity in China’s MFSTIL has also shown a trend of increasing fluctuations. During the study period, the regional disparity expanded from 0.2656 in 2011 to 0.4268 in 2022. Among these, the disparity was smallest in 2011 at 0.2656, exceeded 0.3 starting in 2012, and reached its peak in 2022, at 0.4268. Coastal regions in China exhibit significant chronological differences in fisheries science and technology innovation, which is highly correlated with the timing of each region’s emphasis on marine fisheries and science and technology innovation.
3.2 Spatial differentiation of MFSTIL in China
3.2.1 Spatial distribution characteristics
To better describe the spatial characteristics of MFSTIL across coastal regions, this paper employed the natural breakpoint method (Yang et al., 2023) to classify China’s MFSTIL into five categories: low, relatively low, moderate, relatively high, and high. The corresponding interval ranges are (0.0879, 0.1429], (0.1429, 0.2028], (0.2028, 0.2880], (0.2880, 0.3880], and (0.3880, 0.5601], respectively. As shown in Figure 3, MFSTIL for China’s 11 coastal areas for four years was visualized using ArcMap 10.8 software.
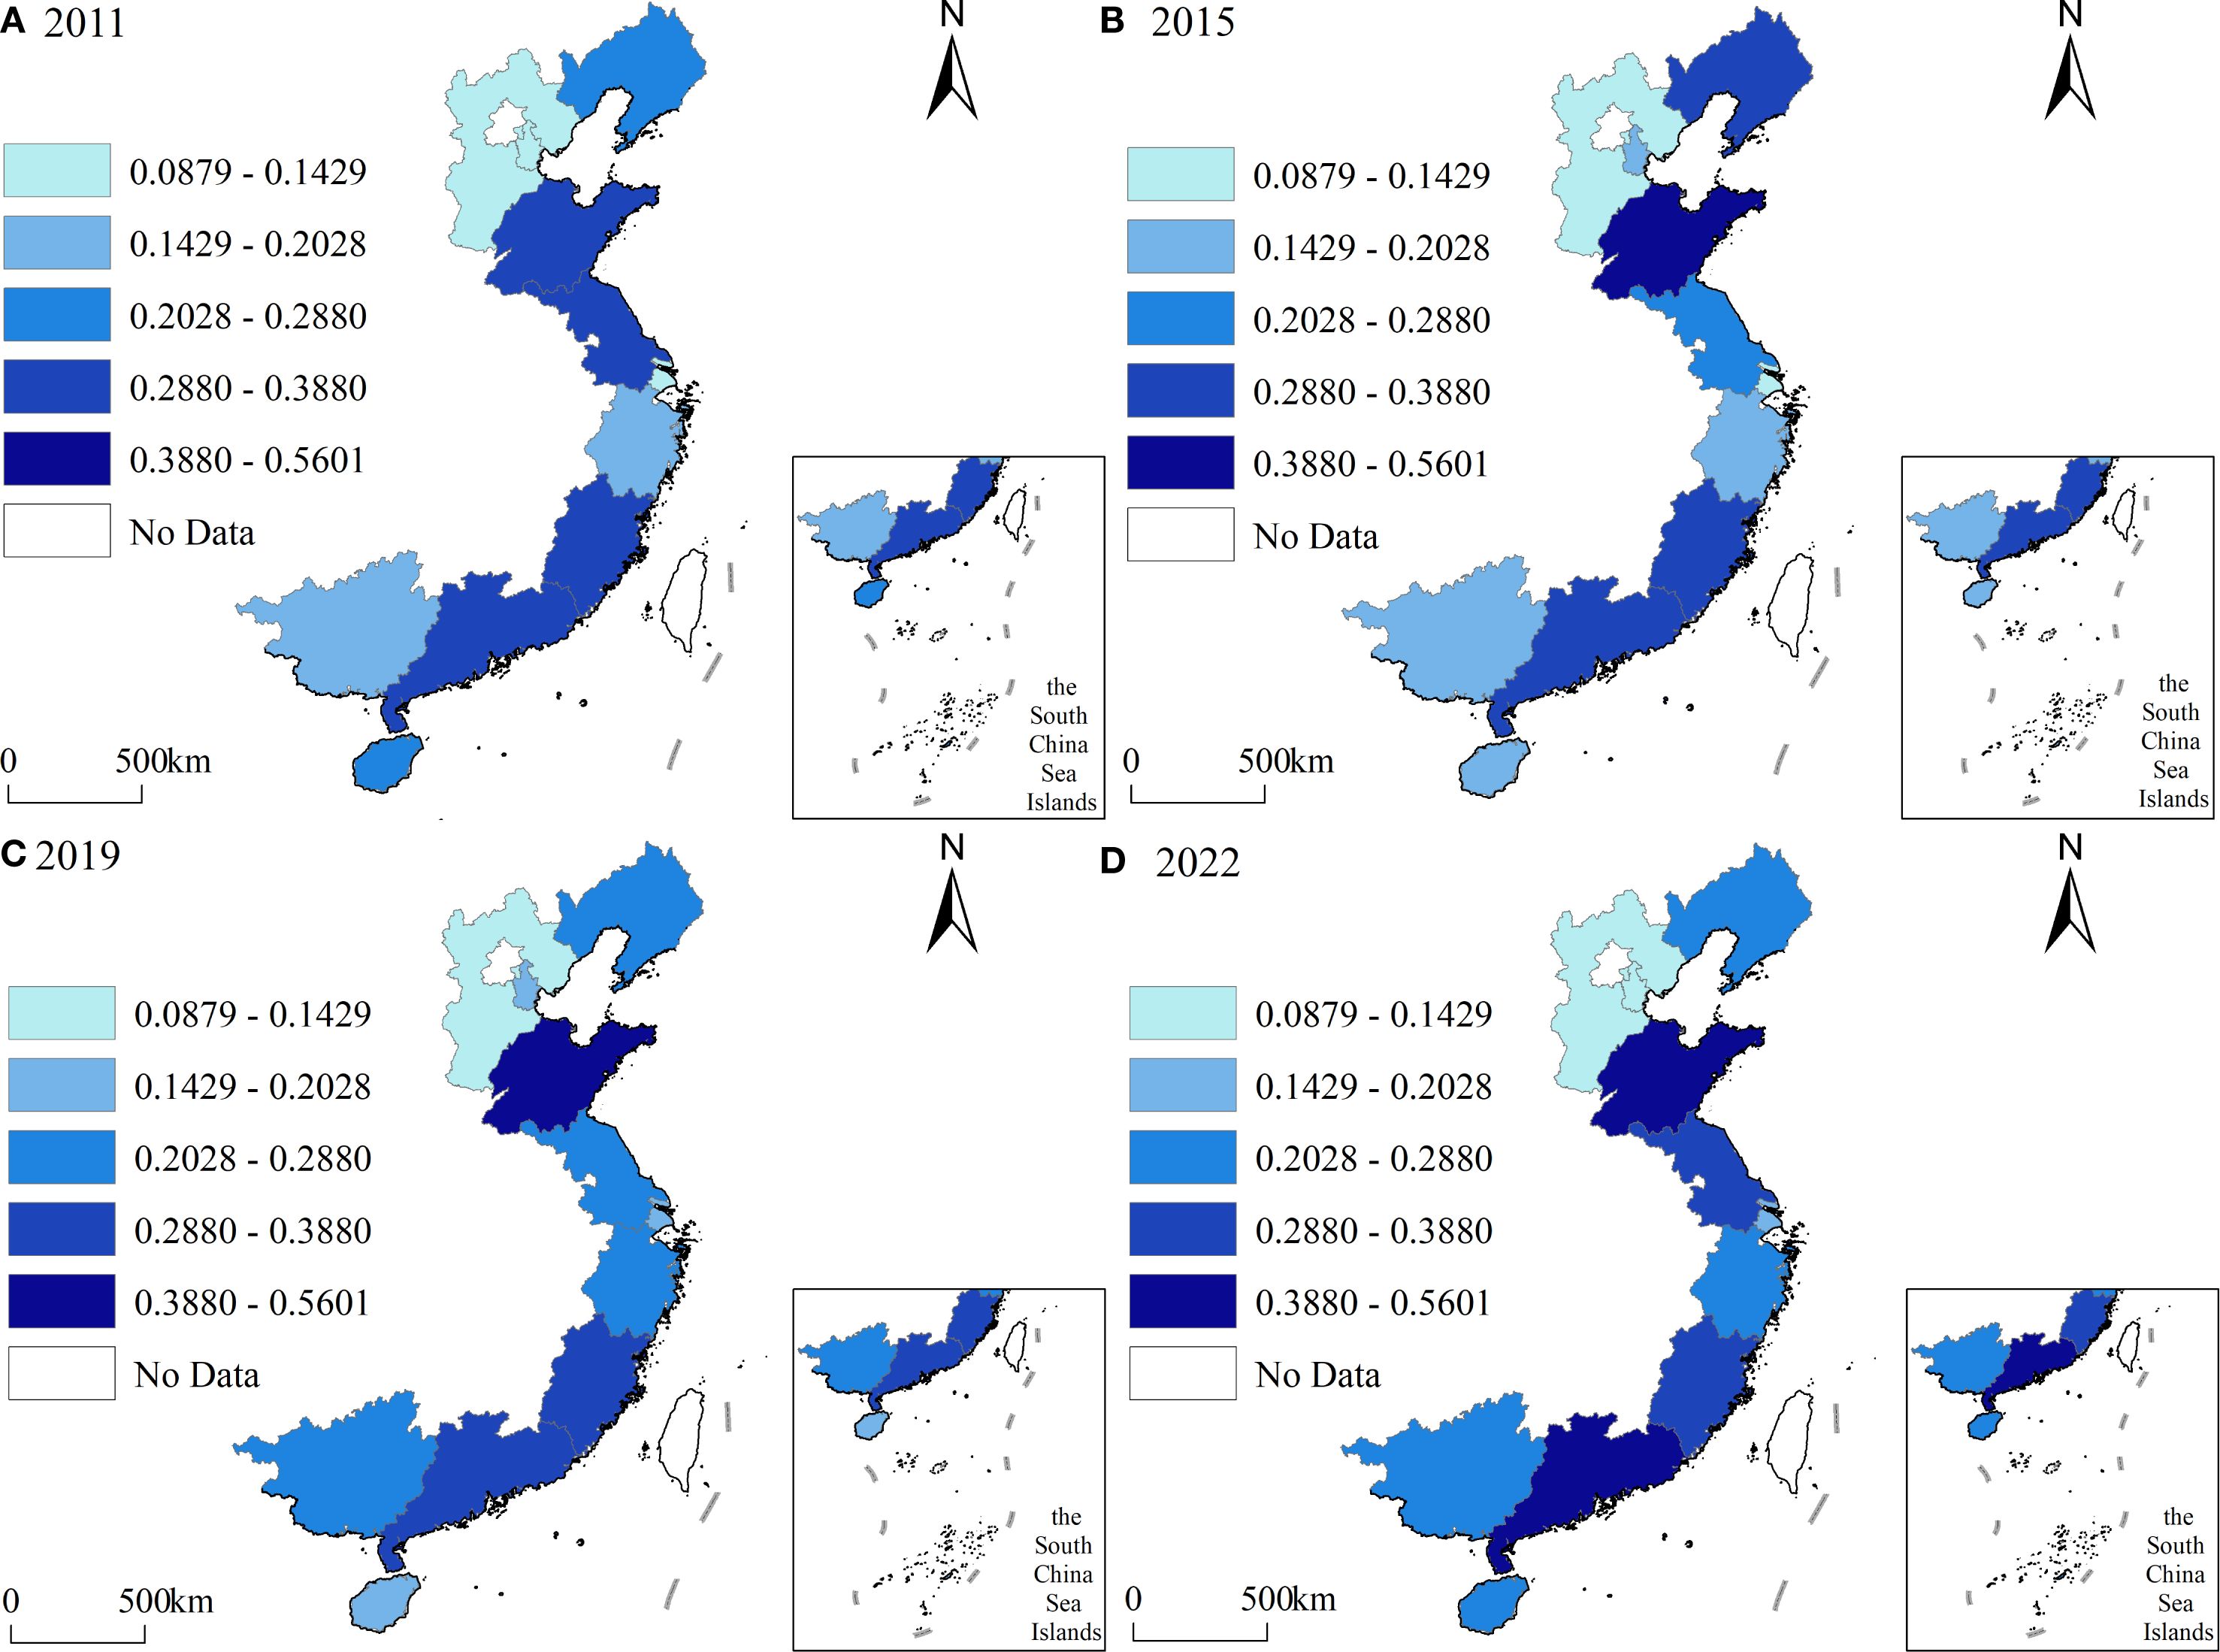
Figure 3. Spatial pattern of the MFSTIL of 11 coastal provinces in China from 2011 to 2022. (A) represents 2011, (B) represents 2015, (C) represents 2019, (D) represents 2022.
Overall, the number of regions in China with medium MFSTIL, relatively high MFSTIL, and high MFSTIL is gradually increasing, while the number of regions with relatively low and low levels is gradually decreasing. Specific characteristics are as follows:
1. From 2011 to 2022, some provinces exhibited a solidification of their levels. Hebei maintained a consistently low level throughout the study period. This indicates a persistent weakness in technological input, talent accumulation, and innovation capacity in the marine fishery sector. Hebei’s inland-oriented economic structure and limited coastline may have constrained the development of marine fishery-related innovation.
2. Some provinces experienced significant fluctuations in their levels. Tianjin fluctuated between low and relatively low level 7 times during the study period, with the final level remaining at low. This reflects deficiencies in policy continuity and innovative resource allocation, which need to be improved for greater stability. Liaoning fluctuated between moderate and relatively high levels, with the final level remaining at moderate. Liaoning has a strong traditional industrial base, which provides some support for marine fisheries, but due to ecological and industrial structure constraints, it is difficult to achieve breakthroughs in the short term. Fujian moved between relatively high and high levels, remained stable at a relatively high level since 2019, indicating consistently strong innovation momentum, supported by a robust marine industry and government backing in areas such as deep-sea aquaculture and smart fisheries. Jiangsu fluctuated between moderate and relatively high levels, with the final level remaining at relatively high. Owing to its economic development level and technological empowerment advantages, Jiangsu’s MFSTIL is expected to reach even higher levels in the future. Hainan fluctuated between relatively low levels and moderate level, it started at the moderate level, ended at the moderate level as well. Hainan fluctuated between moderate and relatively low levels, with the final level remaining at low level. Hainan is close to the South China Sea and is rich in resources, but it has a relatively weak foundation for innovation. It has been designated as a national pilot region for marine economic development, indicating significant potential for future growth.
3. Except for the aforementioned regions, the MFSTIL of all other regions showed upward trends. Shandong showed the most significant and stable upward movement trend. It moved upward to a high level in 2012 and kept stable at a high level. This is mainly due to its strong fisheries foundation and continuous policy support. Guangdong moved from an relatively high level in 2011 to a high level in 2018. However, it was not until 2020 that Guangdong stabilized at a high level. Similar to Shandong, Guangdong also has rich fishery resources and a strong economic foundation, and still has considerable potential for future development. Zhejiang has steadily moved upward from relatively low to moderate level, stabilizing at a moderate level sicne 2016. Zhejiang is located in the Yangtze River Delta region and enjoys favorable policy support and a well-developed digital economy system, which is conducive to the development of a technology-enabled fishery system. Guangxi shows a trend of upward transfer but at a slower pace, moving up to the moderate level in 2018. Guangxi is China’s closest port of call to ASEAN, with a long coastline. It should make full use of its geographical advantages to accelerate the development of a land-sea integrated marine economy and thereby enhance its innovation capabilities. Shanghai moved from low level in 2011 to relatively low level in 2017, and ultimately remained at relatively low level. It needs to leverage its leading national economic and financial advantages, while empowering the marine fishery industry with advanced technological products to enhance MFSTIL.
4. The southern area has moved up one level from the moderate level to the relatively high level, approaching the high level. The northern area have moved up one level from the relatively low level to the moderate level. The eastern region was at a moderate level in 2011, declined to a lower level in 2012, returned to a medium level in 2017, and steadily improved, finally reached to the moderate level.
3.2.2 Spatial evolution characteristics
The spatial distribution characteristics and dynamic trends of MFSTIL across 11 China’s coastal areas were well captured by standard deviation ellipse (SDE) analysis. This study utilized ArcMap 10.8 software to investigate the spatial evolution trajectory of MFSTIL in China from 2011 to 2022, based on the SDE and center of gravity migration trajectories. The SDE was generated using a standard deviation of 68% of the data. The calculation results are shown in Table 4 and Table 5.
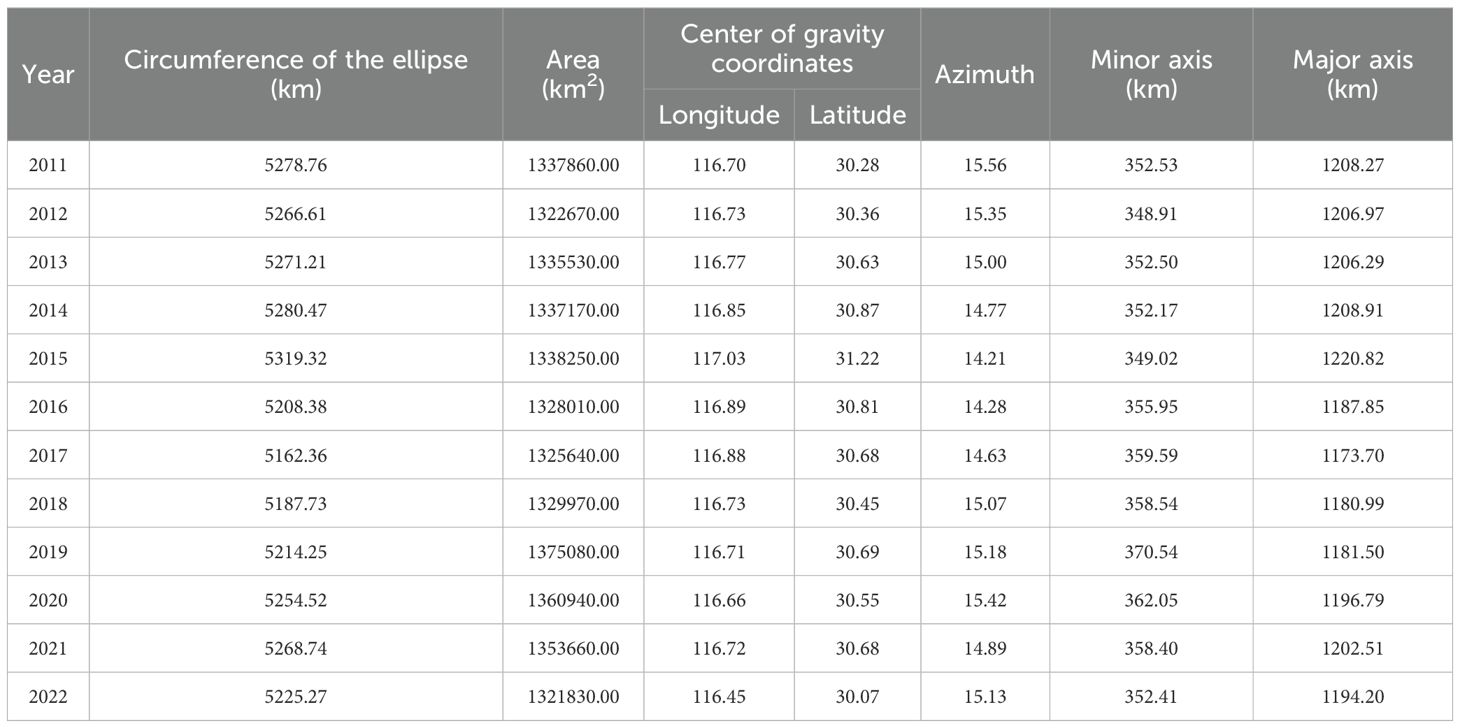
Table 4. SDE parameters of the MFSTIL of 11 coastal provinces in China from 2011 to 2022.
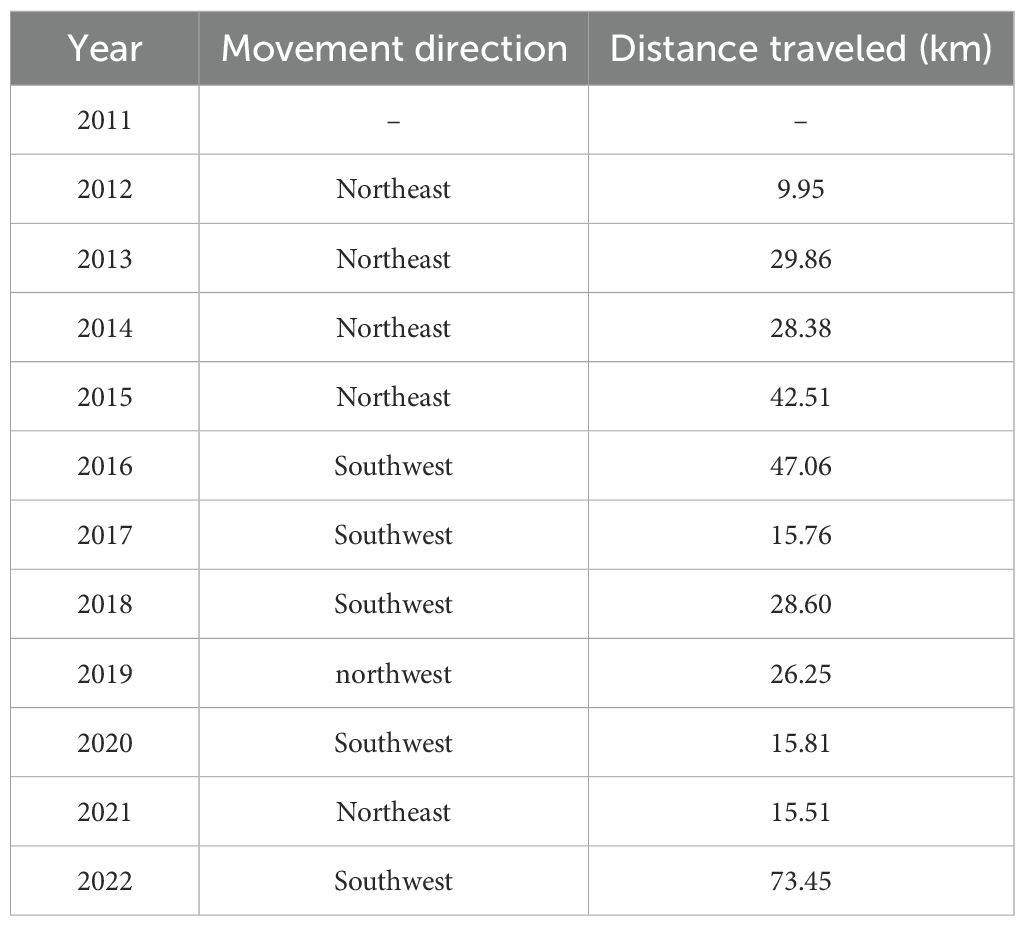
Table 5. SDE center of gravity movement direction and speed.
Overall, MFSTIL exhibits distinct spatial evolutionary characteristics, with the center of gravity of the SDE consistently located within the range of 116.45°E to 117.03°E and 30.07°N to 31.22°N, and is concentrated in Anqing in Anhui Province (Figure 4), i.e., the Yangtze River Delta region. It first shifts northeastward and then southwestward, exhibiting a distinct “northeast-southwest” directional characteristic. The spatial distribution is relatively stable and generally covers areas with higher MFSTIL.

Figure 4. SDE and its center of gravity migration trajectory of the MFSTIL of 11 coastal provinces in China from 2011 to 2022.
Based on parameters such as the shape, major and minor axis, and area of the SDE, as well as the trajectory characteristics of the center of gravity, the article divides the spatial evolution of marine fisheries science and technology innovation into three stages: 2011–2015, 2016–2018, and 2019–2022. Specifically:
(1) From 2011 to 2015, the perimeter and area of the SDE slightly increased, the center of gravity moved northeastward at a speed of 22.14 km/annual, covering a total distance of 110.71 km, with the azimuth rotating counterclockwise from 15.56° to 14.21°, and the major axis increased from 1208.27 km to 1220.82 km, the short axis decreased from 352.53 km to 349.02 km. The SDE exhibited a divergent expansion trend along the primary trend (northeast-southwest) and a contraction trend along the secondary trend (northwest-southeast). During this phase, the Bohai Rim region was in the policy dividend period of the National 12th Five-Year Plan. During this period, the government successively proposed strategies such as the “Maritime Power” and “Belt and Road” initiatives, which were conducive to the development of the marine industry. Strategic plans such as the “Shandong Peninsula Blue Economy Zone Development Plan” and the “Liaoning Coastal Economic Belt Development Plan” in the north brought significant fiscal investments, systematically guiding the flow of innovative elements and promoting the development of high-tech industries in the upstream sectors of the marine fisheries industry, such as marine equipment manufacturing and biological breeding. Meanwhile, the establishment of scientific and technological platforms such as the Qingdao National Laboratory for Marine Science and Technology created a strong “magnetic attraction effect” drawing top-tier domestic and international talent and projects to relocate northward, thereby reinforcing the technological aggregation effect in the northeastern direction. As a result, the center of gravity shifting toward the northeastern direction.
(2) From 2016 to 2018, the perimeter of the SDE decreased while its area increased, with the center of gravity moving southwestward at a rate of 30.47 km/annual, slowing annually, covering a total distance of 91.42 km, with the azimuth rotated clockwise from 14.28° to 15.07°, and the major axis decreased from 1187.85 km to 1180.99 km, the short axis increased from 355.95 km to 358.54 km. The SDE exhibited a contracting trend in the primary direction and a divergent expansion trend in the secondary direction. During this period, the “13th Five-Year Plan for National Marine Economic Development Plan” emphasized strengthening the protective development of South China Sea resources, which generated significant demand for advanced technologies such as marine ranching, deep-sea aquaculture, and ecological restoration, thereby injecting demand-side momentum into innovative activities in southern provinces. Hainan, Guangdong, and other regions were included in the core zone of the “Maritime Silk Road” bringing significant policy benefits in infrastructure, international cooperation, and trade facilitation, creating an open innovation environment, and promoting the flow of technology, capital, and talent. Additionally, in 2018, the construction of the Hainan Free Trade Port was in its initial planning phase, with policy expectations attracting a large influx of technological resources to the south, greatly stimulating southern innovation vitality and shifting the focus toward the southwest.
(3) From 2019 to 2022, the perimeter of the SDE increased while its area decreased. The center of gravity moved repeatedly toward the north and south at a speed of 32.76 km/annual, covering a total distance of 131.03 km, the azimuth rotated counterclockwise from 15.18° to 15.13°, and the major axis increased from 1181.50 km to 1194.20 km, the short axis decreased from 370.54 km to 352.41 km. The SDE exhibited a divergent expansion trend in the primary trend and a contraction trend in the secondary trend. This phase was relatively complex due to its position at the intersection of the closing phase of the National 13th Five-Year Plan and the opening phase of the National 14th Five-Year Plan. During the 13th Five-Year Plan period, the northern regions, especially the areas near the Bohai Sea, faced strict ecological red line restrictions due to high marine aquaculture density and poor environmental conditions, as outlined in policies such as the “Several Opinions on Establishing the Bohai Sea Marine Ecological Redline System”. However, this also played a role in promoting industrial restructuring in the north, prompting provinces with a traditional advantage in nearshore aquaculture to shift the focus of their technological innovation efforts from “scale expansion” to “quality improvement and efficiency enhancement”, such as the industrial upgrading of traditional fisheries and the intelligent transformation of processing supply chains. As a result, the focus of technological innovation initially shifted northwestward. During the National 14th Five-Year Plan period, the planning has placed greater emphasis on “expanding blue economic space” “building modern marine pastures” and “developing deep-sea aquaculture”. Additionally, the “Marine Power” strategy emphasizes differentiated development (Chang, 2022), making southern provinces with vast South China Sea waters and suitable climates the primary battleground for attracting capital and technology for prospective layout. As a result, the focus has shifted overall toward the southwest during this phase.
Additionally, changes in the shape of SDE, azimuth and center of gravity migration also reflects the resilience of China’s marine fisheries innovation elements to disturbances: (1) Short-term policy incentives can only trigger minor adjustments in development direction and cannot alter the fundamental orientation of the axis. (2) The high-tech systems related to the marine fisheries industry, such as aquaculture vessels, marine sensors, and advanced research institutions, rely on existing port layouts. The cost of relocation is too high, inhibiting the short-term transfer of innovation elements.
3.2.3 Spatial difference decomposition
To gain a deeper understanding of regional disparities in China’s MFSTIL, this study employed the Dagum Gini coefficient and its decomposition method. Using Stata software, this study calculated and decomposed the Gini coefficients for China’s MFSTIL and its three major marine economic zones from 2011 to 2022. Table 6 reveals that the overall Gini coefficient exhibits fluctuating patterns but shows a pronounced upward trend toward the end of the study period, indicating that regional disparities in China’s MFSTIL have gradually widened in recent years.
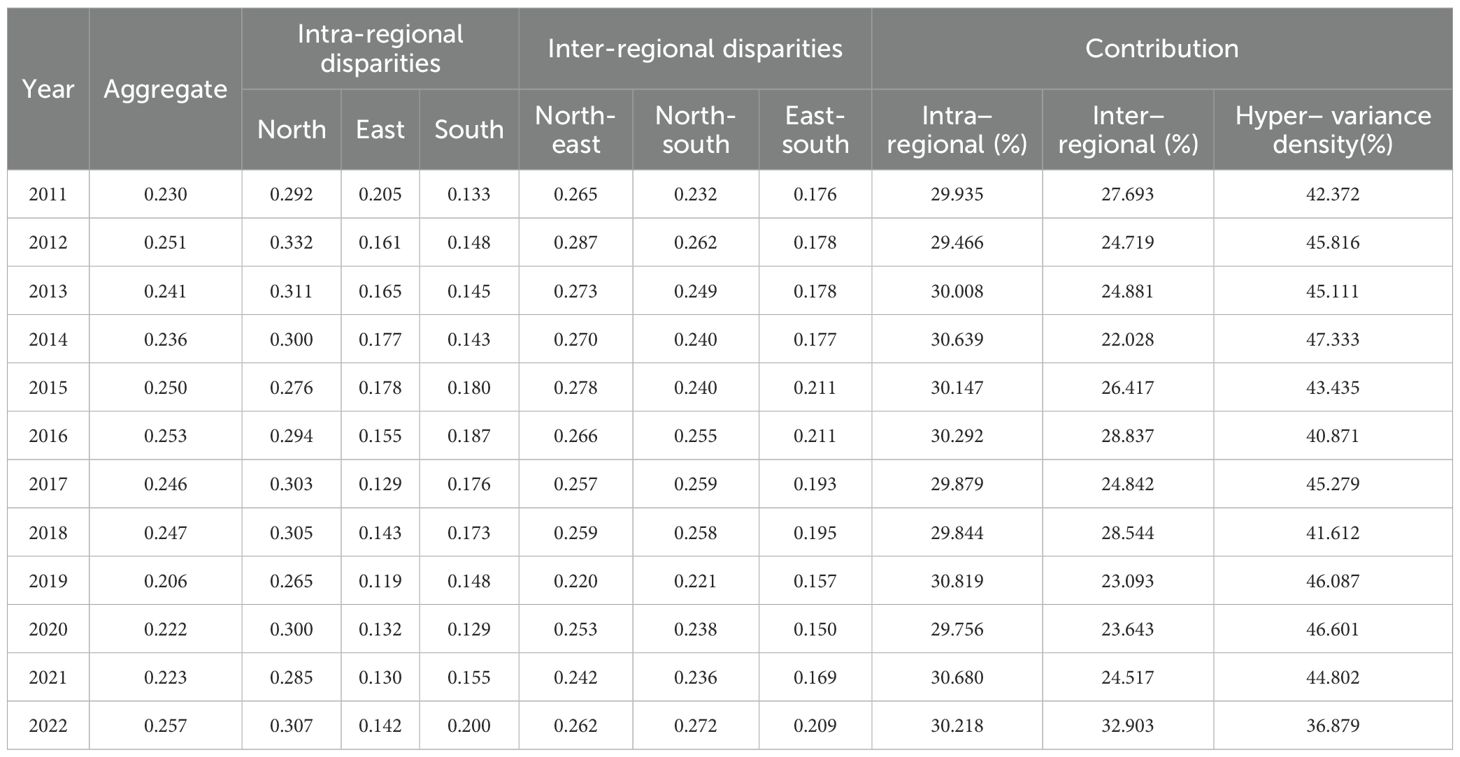
Table 6. Gini coefficient and decomposition results for MFSTIL in China from 2011−2022.
Specifically: (1) Regarding intra-regional disparities, the southern region exhibits the smallest intra-regional differences, the eastern region shows moderate intra-regional disparities, and the northern region displays the largest intra-regional gaps. Intra-regional disparities in the northern region exhibited minor fluctuations, consistently hovering around 0.29. The eastern region showed greater variability, with an overall downward trend from 0.205 in 2011 to 0.142 in 2022. Conversely, the southern region demonstrated an increasing trend, rising from 0.133 in 2011 to 0.200 in 2022. (2) Regarding inter-regional disparities, the innovation gap between the northern and eastern regions remained relatively stable, hovering near an average of 0.261 with no discernible trend. The inter-regional disparity between the north and south exhibits a fluctuating upward trend, increasing from 0.232 in 2011 to 0.272 in 2022. The disparity between the east and south follows a “U”-shaped pattern, reaching its minimum in 2020 before rising rapidly. (3) The primary source of regional disparities in China’s MFSTIL stems from hyper-variance density (average value: 43.850%). This indicates that the intersecting and overlapping distribution of MFSTIL across regions constitutes the main driver of overall inequality. In other words, units with high innovation levels and those with low innovation levels are not strictly clustered within “high-level regions” and “low-level regions”, respectively. Instead, there exists significant cross-regional distribution and mutual penetration. As aforementioned, Shandong—a leader in innovation—is located within the northern marine economic zone, which has a relatively low average innovation level, while Guangxi—a region with lower innovation levels—is situated in the southern marine economic zone, which boasts the highest average innovation level. The average contribution rate of intra-regional differences is 30.140% and has remained relatively stable over the years, indicating its impact on MFSTIL should not be overlooked. Urgent measures are needed to address imbalances within the three major marine economic zones. Inter-regional differences exhibit the lowest average contribution rate at 26.010%, yet show an overall fluctuating upward trend, reaching 32.903% in 2022. This indicates they also exert a certain influence on MFSTIL, with their impact increasing annually in recent years.
4 Prediction of China’s MFSTIL
To successfully achieve the objectives outlined in “the National 14th Five-Year Plan” to “promote the modernization of marine fisheries and enhance the quality and efficiency of the marine fisheries economy”, and to establish a robust basis for further enhancing MFSTIL and cultivating marine new quality productive forces for the upcoming “15th National Five-Year Plan”, it is necessary to predict and analyze the development of MFSTIL in China from 2023 to 2030. This study used the MFSTIL of 11 coastal provinces in China as the original data, and employed the GM(1,1) model to predict the MFSTIL of the study regions from 2023 to 2030. Additionally, the MFSTIL of the three major marine economic zones and the overall level are calculated separately. Table 7 reports the final calculation results. As shown in Table 7, the forecast results for all 11 regions passed the post-hoc error test. It should be noted that this study adopted an improved Markov residual modified GM(1,1) model to enhance the accuracy of Tianjin, Liaoning, Shanghai, Jiangsu, Fujian, Shandong, Guangxi, and Hainan. Therefore, the constructed forecast model has high accuracy and can be used for future predictions.
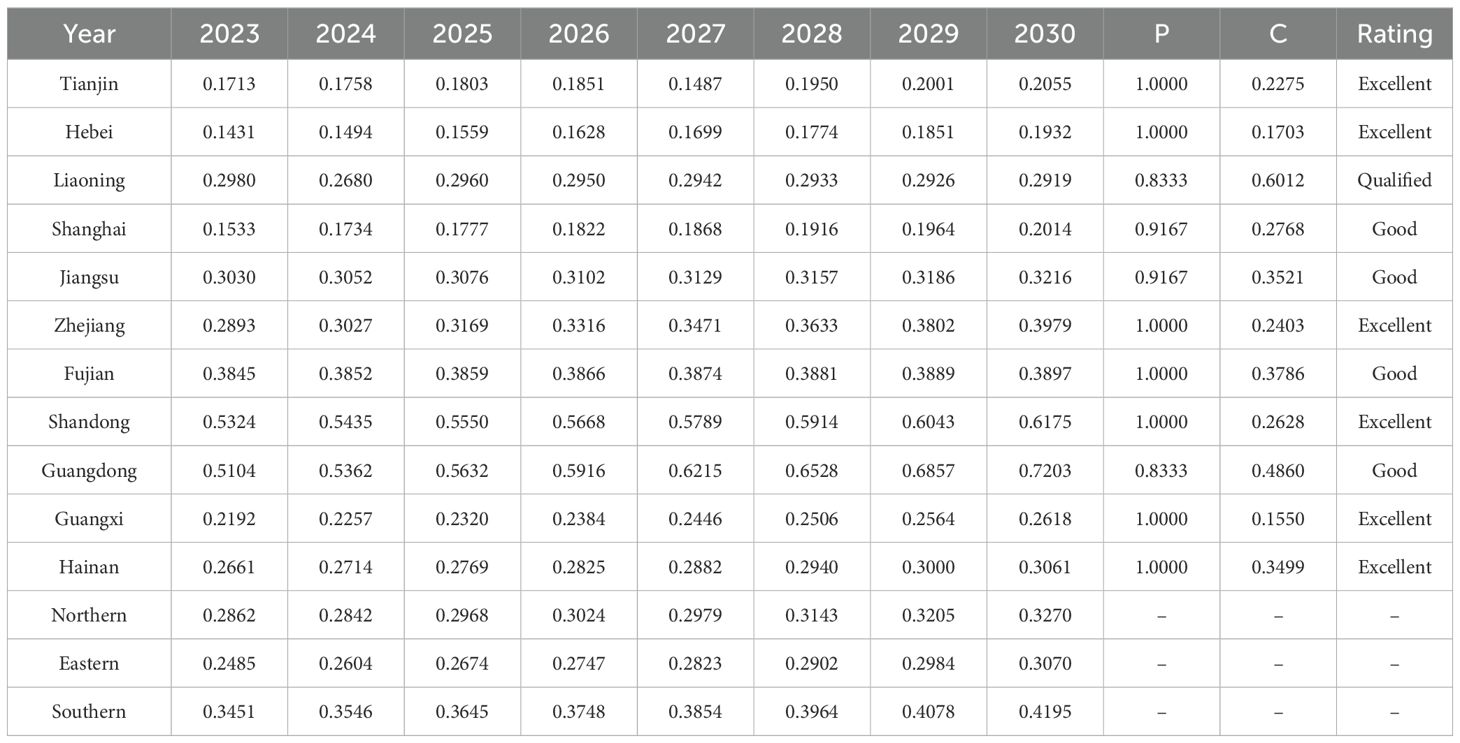
Table 7. Prediction results of the MFSTIL of 11 coastal provinces in China from 2023 to 2030.
As shown in Table 7, the overall level of marine fisheries scientific and technological innovation in China’s coastal regions will increase from 0.2973 in 2023 to 0.3552 in 2030, growing at an annualized rate of 2.78% over the forecasting period. This is broadly consistent with the growth rate observed between 2011 and 2022, indicating that the overall trend remains steadily upward and continues the evolutionary characteristics of the previous 12 years. By region, the three major marine economic zones continue to maintain a gradient pattern of “southern (0.4195) > northern (0.3270) > eastern (0.3070)”, with the gap between the northern and eastern regions continuing to decrease (from 0.0377 to 0.0251), the gap between the southern region and the northern region continuing to increase (from 0.0588 to 0.0773), the gap between the southern region and the eastern region gradually increasing as well (from 0.0966 to 0.1024).
From a regional perspective, southern region will maintain leading position. However, Guangdong’s lead over Shandong is growing larger and larger. Guangdong surpassed Shandong for the first time in 2022, but its lead is not significant. Between 2023 and 2026, the gap between the two regions will not be significant, but in subsequent years, Guangdong will gradually expand its lead. By 2030, Guangdong will have achieved an absolute leading position, demonstrating that its marine fisheries independent scientific and technological innovation capabilities will have reached an advanced level. This is mainly due to Guangdong’s mature marine industry, especially in marine equipment manufacturing and logistics, but it is necessary to promote sustainable industrial development and guard against over-exploitation of South China Sea resources. Fujian will remain in a relatively high position, however, its ranking has dropped one place to fourth. This indicates that Fujian’s investment in scientific and technological innovation is sustainable, but it is also necessary to focus on protecting marine biodiversity and balancing economic growth needs with environmental sustainability. Hainan is expected to maintain its sixth place ranking. The province’s geographical advantages and its status as a key pilot region for marine economic development offer enormous growth potential. However, as an island province, it needs to strengthen its investment in talent, attract innovative capital, and consolidate its innovative achievements in a timely manner. Guangxi’s ranking will remain unchanged at eighth place. Although its development is stable, its growth rate is slow. It needs to leverage its geographical advantage as an important hub along the Belt and Road Initiative, capitalize on its strengths in port infrastructure and maritime logistics, and further expand the scale of its marine fisheries science and technology innovation.
The northern area will rank second, but lags significantly behind the south. Shandong will rank second, owing to its rich fishery resources and strong marine research institutions, which continuously provide material and resource support and technological empowerment to the industry chain. However, as one of China’s largest fishery economies, it must also practice the concept of green development and strengthen ecological protection. Liaoning’s ranking will remain unchanged at seventh. It relies on traditional fisheries and needs to accelerate the transition to more efficient and cleaner smart fisheries, leverage the advantages of Dalian’s marine processing and port R&D clusters, and promote industry-academia-research cooperation. Tianjin’s ranking will improve slightly, from eleventh to nineth. The narrow coastline and industrial-based economic structure have indeed limited the development of marine fisheries. Tianjin needs clearer and more consistent policy signals to guide science and technology innovation activities related to marine fisheries in order to raise its level of innovation more quickly. Hebei will drop from tenth to eleventh place. With its limited coastline and industry-dominated economy, coupled with poor marine ecology, it needs to focus on ensuring green development of its industries while implementing policies to promote technological innovation in the fisheries sector.
The eastern region will rank third, but not far behind the north. Zhejiang will rank third in 2030, up two places. It has been highly effective in the field of “digital fisheries”, adopting technologies such as IoT-enabled monitoring, precision feeding systems, and AI-assisted inventory assessment at an early stage, thereby improving production efficiency and environmental performance. It has fully leveraged the geographical advantages of the Yangtze River Delta and converted basic scientific research results into actual production capacity. Jiangsu will rank fifth, down one place. It has a strong economic foundation and educational capabilities, as well as large areas of wetlands and tidal flats. It should make full use of its talent pool to develop environmentally friendly technologies and protect ecosystems. Shanghai will rank tenth, down one place. Its industrial structure is dominated by the secondary and tertiary industries, and traditional marine fisheries account for a small proportion of the marine economy, making it difficult to obtain substantial policy and financial support. However, it should leverage its own strengths in biotechnology, IT, and other fields to empower the marine fisheries industry and direct technological resources toward it.
Overall, the level of scientific and technological innovation will increase in all provinces, but at different rates, and regional disparities will widen. In order to promote balanced development across regions, provinces need to take measures tailored to local conditions to develop their potential, and the government also needs to intervene in a timely manner to avoid serious imbalances.
5 Conclusion and policy recommendations
The study focuses on 11 coastal provinces (autonomous regions and municipalities) in China, establishing an evaluation index system for the level of marine fisheries scientific and technological innovation. First, to measure the MFSTIL in China from 2011 to 2022, the entropy weight-TOPSIS method was employed, and its temporal variation characteristics were analyzed. Furthermore, using ArcMap 10.8 software combined with the SDE method, the spatial evolution characteristics were analyzed. Finally, a short-term forecast (from 2023 to 2030) for China’s MFSTIL was conducted using the GM(1,1) model based on Markov residual correction. The results indicate: (1) Overall, China’s MFSTIL is good, manifesting a steady upward trend from 2011 to 2022, though the growth rate is limited. The development speeds and states among regions are uneven, with the three major marine economic zones showing a decreasing gradient pattern from south to north and east; (2) In terms of temporal evolution, the improvement in MFSTIL exhibits a phased characteristic of “slow-rapid-stable”, while regional differences also fluctuate and increase annually; (3) In terms of spatial distribution, all three major marine economic zones have regions with strong marine fisheries scientific and technological innovation capabilities, but due to constraints such as policies, ecological environment, marine resources, and innovation vitality, there are obvious “lagging areas”. Overall, most regions have potential for future development and a trend toward upgrading to higher levels. In terms of spatial evolution, the shape of the SDE and its parameters indicate that the MFSTIL has consistently followed a “northeast-southwest” steady-state development pattern. The center of the SDE has consistently moved within a small area in Anqing City, exhibiting a distinct “first northeast, then southwest” trajectory. Corresponding to the shape of the SDE, this indicates that the evolution of the spatial pattern exhibits dynamic equilibrium characteristics, which also serves as a spatial annotation for China’s marine economy transitioning from “nearshore extensive farming” to “offshore precision aquaculture”; (4) In terms of spatial difference decomposition, the primary source of spatial variation in MFSTIL is hyper-variance density, indicating that the cross-regional distribution and overlap of units with varying innovation levels constitute the main cause of inequality among units. Intra-regional variation is a secondary yet stable and significant contributing factor, with the northern region exhibiting the largest and most stable internal variation, the eastern region showing a continuous decline, and the southern region displaying an increasing trend—revealing the issue of unbalanced development within each marine economic zone. The inter-regional disparities between the northern and eastern regions remains relatively stable. Inter-regional disparities between the north and south exhibit a fluctuating upward trend, while those between the east and south display a distinct “U”-shaped pattern; (5) In terms of predictive analysis, from 2023 to 2030, the development of MFSTIL will generally continue the evolutionary trend of the previous 12 years, exhibiting an annual upward trend. A gradual reduction has been observed in the developmental divergence separating northern and eastern regions, but the gap with the south has become increasingly. Additionally, there have been minor changes in the rankings among provinces, primarily reflected in the significant progress will make in Tianjin and Zhejiang, while Hebei, Shanghai, Jiangsu, and Fujian will have seen slight declines. Although all regions have shown steady improvement, there are evident differences in increasing speeds between 11 coastal areas, with absolute gaps being particularly pronounced. All regions need to adopt targeted measures to continuously promote the improvement of scientific and technological innovation levels.
According to the aforementioned findings, this paper put forward 3 policy suggestions:
1. Implement a targeted support strategy to enhance the intrinsic innovative capacity of “innovation laggards”. China currently faces significant imbalances in the development of marine fisheries science and technology innovation. Within each marine economic zone, there are regions with shortcomings in terms of talent, technology, and capital, which have become “innovation laggards” constraining the nation’s overall innovative capabilities. In response, we should abandon a “one-size-fits-all” approach to support and instead adopt a “targeted” strategy. The government should take the lead in identifying and targeting these innovation “lagging areas”, allocate special funds, and introduce preferential policies to guide marine and fisheries research institutes, universities, and leading enterprises to allocate resources to these regions, jointly building “industry-academia-research” integrated innovation platforms tailored to local conditions. Through these measures, urgently needed high-level professional marine fisheries talent and cutting-edge marine fisheries technology can be introduced to the region. Through project collaboration and on-site research, the innovative vitality of local enterprises and talent can be stimulated, enabling them to transition from mere technology recipients to active participants in innovation activities. This will fundamentally bridge the innovation gap and lay a solid foundation for the entire marine fisheries sector.
2. Optimize the spatial layout of the marine fisheries sector and promote coordinated development among the three major marine economic zones. The development of China’s marine fisheries should not be confined by administrative boundaries but should be based on national strategy, with a coordinated layout within the macro framework of the three major marine economic circles: the Bohai Rim, the Yangtze River Delta, and the Pearl River Delta. The urgent task is to break down regional barriers and promote the formation of a new industrial landscape characterized by complementary advantages and differentiated development. Specifically, regions with strong research capabilities, such as Shandong and Fujian, can be guided to focus on basic research such as germplasm innovation and disease prevention and control; regions with superior port conditions and developed transportation networks, such as Zhejiang, can focus on developing industries like deep processing and cold chain logistics; regions with strong ecological carrying capacity, such as Guangdong, can be encouraged to develop smart ecological aquaculture. By constructing cross-regional industrial chains and supply chains, with key fishing port economic zones and marine industrial parks as nodes, the comparative advantages of different regions can be leveraged to connect them, ultimately forming a “point-to-area” linked development pattern, maximizing the scale and synergy effects brought by optimized spatial layout.
3. Establish a dynamic monitoring and early warning mechanism to promote sustainable and balanced development through targeted policies. The ultimate goal of innovation-driven development is to achieve high-quality and sustainable industrial development, which requires policy-making to possess high adaptability and foresight. Therefore, it is crucial to establish a dynamic monitoring and early warning system covering multiple dimensions such as resources, environment, market, and industry. This system should utilize modern information technologies such as big data and the Internet of Things to track key indicators in real time, including fishery resource reserves, changes in the marine ecological environment, fluctuations in the supply and demand of aquatic products, and the operational status of enterprises. Based on this data platform, decision-making departments in various regions can identify potential risks, seize development opportunities, and implement precise policies: when resources are nearing depletion, decisively adjust fishing intensity, reasonably implement marine ecological restoration measures, and promptly improve fishing moratorium and rest periods; effectively guide social capital when the market shows signs of overheating; promptly address weaknesses in the industrial chain. This data-driven closed-loop management model will ensure that China’s marine fisheries industry remains on the fast track of innovation-driven development, achieving a harmonious balance between economic, social, and ecological benefits.
This paper uses comprehensive methods to measure, evaluate, and predict the level of scientific and technological innovation in China’s marine fisheries, there are still some shortcomings: (1) Due to data availability, some R&D indicators were estimated by multiplying the respective figures by the proportion of marine fisheries output in the total marine production value. Although this method has a certain degree of validity, it still contains errors. For instance, in Tianjin, marine R&D focuses on high-tech sectors such as marine engineering and logistics, with marine fisheries accounting for a smaller proportion. Applying a proportional scaling approach may overestimate certain indicators. In Shandong, fisheries constitute a significant share of marine output, and its marine R&D leans toward modern fishing technologies like marine biotechnology and engineered seawater aquaculture. Consequently, using proportional scaling may underestimate certain indicators. There is room for expansion and improvement of the indicator system. (2) The grey prediction models are widely used in various fields, and grey prediction models based on Markov residual correction greatly improve the accuracy of the model. However, this method assumes that future trends will remain consistent with the past and overlooks potential significant external changes, such as policy adjustments or environmental shifts. In future research, it is essential to further deepen and expand the analysis of MFSTIL. First, with advancements in technology and the diversification of measurement methods, a comprehensive and rational index system can be established, incorporating metrics such as marine fisheries carbon sink, marine fishery carbon emission and smart fishing equipment, to comprehensively reflect the characteristics of scientific and technological innovation. Future research may discuss how to improve the MFSTIL under the dual carbon goals from the perspective of enhancing environmental efficiency. Second, by focusing on regional differences, the driving mechanisms of scientific and technological innovation influenced by factors such as policy, resource endowments, and industrial structure can be explored and verified, enabling more precise policy implementation. Additionally, expanding the temporal and spatial scope of research, conducting horizontal comparisons of international MFSTIL, and analyzing the trends and patterns of marine fisheries development in various countries over time can help summarize experiences, learn from others’ strengths, and address weaknesses. This approach facilitates the integration of internal and external dual circulation, thereby enhancing China’s international competitiveness in marine fisheries. Lastly, with the enrichment and advancement of forecasting methods, future forecasting research should integrate external influencing factors, such as policy, climate, and ecological indicators, to develop a forecasting model capable of providing early warnings of external signals, thereby addressing the limitations of most current models. In summary, relevant research should focus on practical strategic needs, closely align with China’s national conditions, and thoroughly explore how to integrate marine industries, regional economies, and technological elements to provide theoretical support for further achieving the symbiotic integration of the marine fisheries industry chain and innovation chain.
Data availability statement
The original contributions presented in the study are included in the article/Supplementary Material. Further inquiries can be directed to the corresponding author.
Author contributions
FL: Funding acquisition, Methodology, Writing – original draft, Writing – review & editing. HG: Methodology, Software, Writing – original draft, Writing – review & editing. DQ: Conceptualization, Writing – original draft. PQ: Funding acquisition, Writing – original draft. YH: Writing – review & editing, Methodology. XC: Conceptualization, Writing – review & editing.
Funding
The author(s) declare financial support was received for the research and/or publication of this article. This work was supported by Major Program of National Fund of Philosophy and Social Science of China (grant numbers 22&ZD152); Science Fund for Distinguished Young Scholars of Zhejiang Province (grant number LR22D060002).
Conflict of interest
The authors declare that the research was conducted in the absence of any commercial or financial relationships that could be construed as a potential conflict of interest.
Generative AI statement
The author(s) declare that no Generative AI was used in the creation of this manuscript.
Any alternative text (alt text) provided alongside figures in this article has been generated by Frontiers with the support of artificial intelligence and reasonable efforts have been made to ensure accuracy, including review by the authors wherever possible. If you identify any issues, please contact us.
Publisher’s note
All claims expressed in this article are solely those of the authors and do not necessarily represent those of their affiliated organizations, or those of the publisher, the editors and the reviewers. Any product that may be evaluated in this article, or claim that may be made by its manufacturer, is not guaranteed or endorsed by the publisher.
Supplementary material
The Supplementary Material for this article can be found online at: https://www.frontiersin.org/articles/10.3389/fmars.2025.1647837/full#supplementary-material
References
Asche F. and Smith M. (2018). Viewpoint: induced innovation in fisheries and aquaculture. Food Policy 76, 1–7. doi: 10.1016/j.foodpol.2018.02.002
Cai H., Yu J., and Guo Y. (2025). Spatial and temporal distribution and evolution of traditional villages in xin ‘an river basin of China based on geographic detection and remote sensing technology. Ecol. Indic. 171, 113239. doi: 10.1016/j.ecolind.2025.113239
Chang Y. (2022). Toward better maritime cooperation—A proposal from the Chinese perspective. Ocean Dev. Int. Law 53, 85–104. doi: 10.1080/00908320.2022.2068704
Chang Y., Zhang X., and Khan M. (2022). The impact of the COVID-19 on China’s fisheries sector and its countermeasures. Ocean Coast. Manage. 216, 105975. doi: 10.1016/j.ocecoaman.2021.105975
Chang Y., Zhang X., and Liu S. (2021). Is there a need for a regional fishery agreement in the south China sea? Hong Kong Law J. 51, 573. Available online at: https://heinonline.org/HOL/LandingPage?handle=hein.journals/honkon51&div=30&id=&page=.
Cobb C. and Douglas P. (1928). A theory of production. Am. Econ. Rev. 18, 139–165. Available online at: chrome-extension://efaidnbmnnnibpcajpcglclefindmkaj/https://www.aeaweb.org/aer/top20/18.1.139-165.pdf.
Cromwell J., Turkson C., Dora M., and Yamoah F. (2025). Digital technologies for traceability and transparency in the global fish supply chains: A systematic review and future directions. Mar. Policy 178, 106700. doi: 10.1016/j.marpol.2025.106700
Deng J. (2002). Grey prediction and grey decision (Wuhan: Huazhong University of Science and Technology Press).
Deng Y., Li X., Li Z., Hou K., and Xiao J. (2024). Track quality index and its sub items prediction based on markov residual corrected grey model. Railway Eng. 64, 37–42. doi: 10.3969/j.issn.1003-1995.2024.06.06
Di Q., Liang C., Chen X., Chen K., and Jia W. (2024). Mechanism, evolution model and path of “double chain” integration of marine fishery under the symbiosis theory. Econ. Geogr. 44, 133–143. doi: 10.15957/j.cnki.jjdl.2024.09.014
Dong Z. and Gao Q. (2010). Research on development of marine fishery in China based on the innovation theory of Schumpeter. Chin. Fish. Econ. 28, 24–29. doi: 10.3969/j.issn.1009-590X.2010.04.005
Erxin T. and Ying Z. (2025). Investigating preferences and influencing factors of age-friendly housing environments across different age groups using the Delphi-Kano model and entropy weight TOPSIS method. Front. Archit. Res. 14, 899–913. doi: 10.1016/j.foar.2024.10.007
Feng M., Guan H., Wang Y., and Liu Y. (2024). Research on the impact mechanism of scientific and technological innovation on the high-quality development of the marine economy. Front. Mar. Sci. 11. doi: 10.3389/fmars.2024.1341063
Fu X., Ku H., Wu W., Wang L., Chen H., Lin C., et al. (2022a). Spatial-temporal differentiation and convergence analysis of marine fishery innovation ability in China. Fish. Res. 254, 106393. doi: 10.1016/j.fishres.2022.106393
Fu X., Wang L., Lin C., Wu W., Ku H., Jiang S., et al. (2022b). Evaluation of the innovation ability of China’s marine fisheries from the perspective of static and dynamic. Mar. Policy 139, 105032. doi: 10.1016/j.marpol.2022.105032
Fu X., Wu W., Lin C., Ku H., Wang L., Lin X., et al. (2022c). Green innovation ability and spatial spillover effect of marine fishery in China. Ocean Coast. Manage. 228, 106310. doi: 10.1016/j.ocecoaman.2022.106310
Gao T., Chang F., and Gao S. (2018). Structural transformation and updating of marine economic industry in Qingdao: based on innovation efficiency of science and technology. Manage. Rev. 30, 42–48. doi: 10.14120/j.cnki.cn11-5057/f.2018.12.005
Gao Y., Qin R., Jin G., Zhang R., Chen S., and Xu Y. (2024). Comprehensive evaluation of Chinese baijiu solid-state distillation operating conditions effect on aroma compounds distillation based on entropy weight-TOPSIS analysis. Food Biosci. 58, 103705. doi: 10.1016/j.fbio.2024.103705
Gorospe K., Michaels W., Pomeroy R., Elvidge C., Lynch P., Wongbusarakum S., et al. (2016). The mobilization of science and technology fisheries innovations towards an ecosystem approach to fisheries management in the Coral Triangle and Southeast Asia. Mar. Policy 74, 143–152. doi: 10.1016/j.marpol.2016.09.014
Han Z., Tong Y., and Wang G. (2022). Spatial-temporal differentiation and evolution trend of marine ecological security in China. Geogr. Sci. 42, 1166–1175. doi: 10.13249/j.cnki.sgs.2022.07.004
Ji J., Dong H., and Yin X. (2022). Science and technology innovation, technology promotion and total factor productivity of mariculture industry. Ocean Dev. Manage. 39, 3–9. doi: 10.20016/j.cnki.hykfygl.20220427.001
Jiang J. and Sun H. (2025). Marine environmental regulation and green technology innovation: evidence from enterprises in coastal areas of China. Front. Mar. Sci. 11. doi: 10.3389/fmars.2024.1509506
Jin X., Wang Y., and Yin K. (2024). Research on the measurement and spatiotemporal evolution characteristics of new quality productive forces in China’s marine economy. Front. Mar. Sci. 11. doi: 10.3389/fmars.2024.1497167
Li X., Cao Y., Wang J., Dang Y., and Yin K. (2019). A summary of grey forecasting and relational models and its applications in marine economics and management. Mar. Econ. Manage 2, 87–113. doi: 10.1108/MAEM-04-20190002
Li J., Ren J., Ma X., and Xiao G. (2023). Environmental efficiency of ports under the dual carbon goals: taking China’s Bohai-rim ports as an example. Front. Mar. Sci. 10. doi: 10.3389/fmars.2023.1129659
Lin X., Zheng L., and Li W. (2019). Measurement of the contributions of science and technology to the marine fisheries industry in the coastal regions of China. Mar. Policy 108, 103647. doi: 10.1016/j.marpol.2019.103647
Liu Y., Guo L., Wang P., and Fu X. (2022). Research on scientific and technological innovation efficiency and its influencing factors of marine fishery in Shandong Province. Chin. Fish. Econ. 40, 73–81. doi: 10.3969/j.issn.1009-590X.2022.01.010
Liu Y., Lu Y., and Fu X. (2023). Study on the evaluation of green innovation efficiency of marine fisheries based on super-efficient SBM model—taking Shandong province as an example. Chin. Agr. Account. 33, 100–103. doi: 10.13575/j.cnki.319.2023.19.019
Ministry of Natural Resources- PRC (2025). The 2024 China marine economy statistical bulletin. Available online at: https://gi.mnr.gov.cn/202502/t20250224_2881344.html (Accessed February 18, 2025).
Ni G. and Han L. (2009). Roles of R&D in the case of China’s marine fisheries modernization. Chin. Fish. Econ. 27, 74–79. doi: 10.3969/j.issn.1009-590X.2009.05.013
Razzaq A., Sharif A., Yang X., and Dogan E. (2024). Influence mechanism of electricity price distortion on industrial green transformation: a spatial analysis of chinese regions. Energy Econ. 130, 107308. doi: 10.1016/j.eneco.2024.107308
Rogerson P. (2021). Historical change in the large-scale population distribution of the United States. Appl. Geogr. 136, 102563. doi: 10.1016/j.apgeog.2021.102563
Sha X., Tang H., and Wang Y. (2025). Research on the measurement and spatio-temporal evolution of marine new-quality productivity in China. Front. Mar. Sci. 12. doi: 10.3389/fmars.2025.1551481
Shen J. and Yu W. (2014). Research on innovation drive of China’s traditional strong marine industry —a case study of marine fishery. J. Ocean Univ. China (Social Sciences) 2, 23–28. Available online at: https://kns.cnki.net/kcms2/article/abstract?v=mA0k7fYtKv7IBEmWKyLbpuODTct-SZ1cARlQ4OvTjHj8J8hi81hQB94vNYn2OiQ0NCwhXvfQIhTH0Ss0yGehGqxCRjaFS6SPJvbdRdX4R_sCNl0KKs5CDcSn7SP49G2bF2uLm0WOH0rCHDW4pVLWLuCUeEzMxcmQ&uniplatform=NZKPT.
Sheng H. (2018). Evolution and prospect of China’s foreign trade strategy since Reform and Opening Up. China Bus. Mark. 32, 58–67. doi: 10.14089/j.cnki.cn11-3664/f.2018.11.007
Song Y. and Mei D. (2022). Sustainable development of China’s regions from the perspective of ecological welfare performance: analysis based on GM(1,1) and the malmquist index. Environ. Dev. Sustainability 24, 1086–1115. doi: 10.1007/s10668-021-01485-y
Sun C., Wang C., Zhang J., and Liu Y. (2005). Improvements and applications of residual grey prediction models. Stat. Decision 3, 19–20. doi: 10.13546/j.cnki.tjyjc.2005.05.010
Tu C., Pan Q., Jiang C., Tu Y., and Zhang S. (2023). Trends and predictions in the physical shape of chinese preschool children from 2000 to 2020. Front. Public Health 11. doi: 10.3389/fpubh.2023.1148415
Wang Z., Cai Z., and Li Y. (2025). Prediction and analysis of China’s coastal marine economy: an innovative grey model with the best-matching data-preprocessing techniques. Front. Mar. Sci. 12. doi: 10.3389/fmars.2025.1551352
Wang S., Chen F., Liao B., and Zhang C. (2020). Foreign trade, FDI and the upgrading of regional industrial structure in China: based on spatial econometric model. Sustainability 12, 815. doi: 10.3390/su12030815
Wang N., Fu X., and Wang S. (2022). Spatial-temporal variation and coupling analysis of residential energy consumption and economic growth in China. Appl. Energy 309, 118504. doi: 10.1016/j.apenergy.2021.118504
Wang C., Ibrahim H., Wu F., and Chang W. (2025). Spatial and temporal evolution patterns and spatial spillover effects of carbon emissions in China in the context of digital economy. J. Environ. Manage. 373, 123811. doi: 10.1016/j.jenvman.2024.123811
Wang J. and Ning L. (2017). Study on the evaluation and path of the innovation ability of marine fishery in China Province. J. Guangdong Ocean Univ. 37, 17–23. doi: 10.3969/j.issn.1673-9159.2017.05.003
Wang J. and Wang J. (2017). Study on marine fisheries science and technology innovation and its path of development from the perspective of ecological security: a case of Shandong province. Chin. Fish. Econ. 35, 88–92. doi: 10.3969/j.issn.1009-590X.2017.04.014
Wu C. and Zhong J. (2020). Has preferential tax policy for technology imports improved industrial innovation capacity? A quasi-natural experiment based on China’s catalogue for technologies encouraged to import. Contemp. Financ. Econ. 9, 101–113. doi: 10.13676/j.cnki.cn36-1030/f.2020.09.010
Xiao W., Kong H., Shi L., Boamah V., and Tang D. (2022). The impact of innovation-driven strategy on high-quality economic development: evidence from China. Sustainability 14, 4212. doi: 10.3390/su14074212
Yang S., Su L., Kong R., and Wang H. (2023). Farmer income quality: logical construction, measure evaluation and dynamic Evolution. Chin. Rural Econ. 8, 18–36. doi: 10.20077/j.cnki.11-1262/f.2023.08.002
Yang W. and Wang Y. (2024). Development and utilization of marine resources in China: problems and countermeasures. Environ. Protect 52, 13–16. doi: 10.14026/j.cnki.0253-9705.2024.12.017
Yin K., Huang N., and Wang B. (2011). Research on the evaluation of the comprehensive strength of marine resources in China. Ocean Dev. Manage. 28, 29–33. doi: 10.20016/j.cnki.hykfygl.2011.09.007
Keywords: marine fishery, scientific and technological innovation level, spatiotemporal differentiation, standard deviation ellipse, Dagum Gini coefficient, grey prediction model
Citation: Li F, Gao H, Qi D, Qi P, He Y and Cai X (2025) Spatiotemporal differentiation and prediction analysis of China’s marine fishery scientific and technological innovation level. Front. Mar. Sci. 12:1647837. doi: 10.3389/fmars.2025.1647837
Received: 16 June 2025; Accepted: 11 September 2025;
Published: 30 September 2025.
Edited by:
Xuemei Li, Ocean University of China, ChinaReviewed by:
Yen-Chiang Chang, Dalian Maritime University, ChinaChao Liu, Ministry of Natural Resources, China
Yue Jin, Ningbo University, China
Copyright © 2025 Li, Gao, Qi, Qi, He and Cai. This is an open-access article distributed under the terms of the Creative Commons Attribution License (CC BY). The use, distribution or reproduction in other forums is permitted, provided the original author(s) and the copyright owner(s) are credited and that the original publication in this journal is cited, in accordance with accepted academic practice. No use, distribution or reproduction is permitted which does not comply with these terms.
*Correspondence: Xianzhe Cai, MjAyNDAwOTdAempvdS5lZHUuY24=