 Youta Sugai1*
 Masayuki Ushio2
 Junya Hirai1Masumi Hasegawa-Takano1,3,4†
 Takayoshi Fujiwara1,3†Mako Takada1,3
 Kaho Mori1,3
 Hideki Fukuda1
 Hiroaki Saito1
 Koji Hamasaki1
 Susumu Hyodo1
 Susumu Yoshizawa1,3
- 1Atmosphere and Ocean Research Institute, The University of Tokyo, Kashiwa, Chiba, Japan
- 2Department of Ocean Science, The Hong Kong University of Science and Technology, Kowloon, Hong Kong SAR, China
- 3Graduate School of Frontier Sciences, The University of Tokyo, Kashiwa, Chiba, Japan
- 4Institute for Extra-Cutting-Edge Science and Technology Avant-Garde Research, Japan Agency for Marine-Earth Science and Technology, Yokosuka, Kanagawa, Japan
To clarify the differences in the effect of environments on community structures and in distribution patterns between marine prokaryotes and microbial eukaryotes, microbial communities were investigated spatially and seasonally in the surface layer of the subtropical Kuroshio region using environmental DNA (eDNA) metabarcoding analysis. Prokaryotic communities were primarily different between seasons and dominated by Flavobacteriales (33.4 ± 11.6%) and Synechococcales (25.0 ± 21.2%) during spring and autumn, respectively. For eukaryotes, diverse dinoflagellates including Syndiniales were frequently dominant (46.7 ± 8.2%) regardless of seasons, and the horizontally and vertically collected eDNA samples successfully captured the spatially heterogeneous dominance of Copelata (34.3–36.4%) and Doliolida (60.3–67.3%) at shallower depths (10–50 m) and Spumellaria (39.4–94.9%) at deeper depths (100–150 m). A large proportion (64.6%) of the variance in the community structure of prokaryotes was explained by physical conditions and chlorophyll (chl.) a concentration, which indicates that the physical environments of water masses and resource supply by phytoplankton mainly shape prokaryotic communities. On the other hand, the effect of physical conditions on community structure was much smaller for eukaryotes (10.7%) compared to prokaryotes (29.6%), and the variance was most (24.7%) explained by chl. a concentration but largely (64.6%) unexplained. This result suggests that food environments and other factors including parasitic interactions determine eukaryotic communities rather than physical conditions. The communities of prokaryotes and some eukaryotes such as Dinophyceae and Spirotrichea showed relatively similar spatio-temporal distributions probably due to their symbiotic and trophic interactions and were detected commonly. In contrast, the distinct and unique distributions of other heterotrophic eukaryotes such as Doliolida were observed, indicating their sporadic and massive blooms in favorable environments for each community. The comparison of these distribution patterns across taxonomic and trophic levels implicates the ecological roles of microbial communities in maintaining the stable structure and functions of marine ecosystems and changing the structure of the microbial food web locally.
1 Introduction
Microbial communities support marine pelagic ecosystems through energy transfer to higher trophic levels as the base of the food web (Azam et al., 1983; Glibert and Mitra, 2022) and material cycles as the drivers of various biogeochemical processes (Joye et al., 2022; Levine et al., 2025). Marine microbial communities consist of taxonomically and ecologically diverse groups such as heterotrophic bacteria, autotrophic protists (phytoplankton), and metazoans (zooplankton), which form complex biological interactions via symbiotic, predatory, and parasitic relationships (Guillou et al., 2008; Kiørboe, 2024). Understanding the structure and distribution of microbial communities is useful to gain insight into their functions and ecological roles in the ocean. It is also essential to elucidate factors affecting microbial structure and distribution in order to predict the responses of microbial communities and marine ecosystems to future environmental changes.
The structures and distributions of the communities of prokaryotes and microbial eukaryotes in marine environments have been investigated conventionally by different methodologies. Prokaryotic communities have been examined by metabarcoding analysis (the amplification and high-throughput sequencing of a genetic marker region) using seawater samples (Sogin et al., 2006; Zinger et al., 2011; Ghiglione et al., 2012). On the other hand, eukaryotic communities have been examined traditionally by microscopic analysis using seawater and plankton net samples (Harzi et al., 1998; Levinsen et al., 1999) or latterly by metabarcoding analysis using plankton net samples (Lindeque et al., 2013; Hirai et al., 2015). Since the microscopic observation of plankton based on their morphological characteristics takes an enormous amount of time and effort and requires expert knowledge and experience (Ruppert et al., 2019), a relatively limited number of samples can be analyzed by microscopic analysis, which hinders the understanding of the spatio-temporal variation in eukaryotic community structure. In addition, unlike seawater samples taken at a specific location and depth, the horizontal and vertical tows of a plankton net collect the spatially integrated samples, and the local distribution of eukaryotic communities can be missed. These differences in sampling and analytical methods between marine prokaryotes and eukaryotes have provided the dataset of microbial communities with spatially and temporally different resolutions, preventing a fair comparison of their structures and distributions.
Recent advances in molecular techniques have enabled the comprehensive analysis of marine microbial communities including both prokaryotes and eukaryotes by conducting the metabarcoding of environmental DNA (eDNA) in seawater samples (Zhang et al., 2018; Sawaya et al., 2019; Sildever et al., 2023), which refers to a mixture of genomic DNA in environments derived from organisms such as prokaryotic cells and eukaryotic tissues (Taberlet et al., 2012). Although conventional methods (described above) and the metabarcoding analysis of eDNA show the complementary results of plankton communities (Abad et al., 2016; Djurhuus et al., 2018), eDNA metabarcoding provides an efficient means to analyze a large number of samples (Chavez et al., 2021). Because eDNA metabarcoding analysis enables the examination of organisms across multiple trophic levels using the same sample and consistent methods, prokaryotic and eukaryotic communities can be investigated and compared fairly at the same resolutions (Djurhuus et al., 2020; Truelove et al., 2022).
The components of microbial communities are closely associated with each other through complex biological interactions across trophic levels (Needham and Fuhrman, 2016; Arandia-Gorostidi et al., 2022). Thus, the examination of both prokaryotes and eukaryotes is required to elucidate mechanisms affecting their structures and distributions. The eDNA metabarcoding studies including the global-scale surveys have investigated the community structure and diversity of microbial communities in various oceanic regions (Sunagawa et al., 2015; de Vargas et al., 2015) and reported that they were determined by abiotic (water temperature and salinity) and biotic (interactions among organisms) factors (Lima-Mendez et al., 2015; Holman et al., 2021; Wang et al., 2024). For example, prokaryotic communities correlated with water temperature in surface waters on a global scale (Sunagawa et al., 2015), indicating that physical conditions mainly dictate their structure. However, information about the effect of environments on the spatio-temporal variation in eukaryotic community structure and the distribution patterns of eukaryotic communities is relatively limited (Djurhuus et al., 2020; Logares et al., 2020). Eukaryotes show greater ecological diversity encompassing a broad range of sizes (nano-, micro-, and meso-sized) and trophic strategies (e.g. mixotrophy and parasitism) compared to prokaryotes (Guillou et al., 2008; Mitra et al., 2023). Because size and trophic strategies are critical to biological interactions (Baird and Suthers, 2007; Ward et al., 2012), the relative importance of physical conditions for eukaryotic communities may not be as great as for prokaryotic communities due to stronger impact of biological interactions. Thus, the effect of environments on community structures and distribution patterns are considered different between prokaryotes and eukaryotes, which reflects their distinct ecological roles in marine environments.
Environmental effect on marine microbial communities can be studied effectively in the subtropical Kuroshio region for its physically and biologically dynamic environments. The Kuroshio Current is the western boundary current of the North Pacific Ocean and transports subtropical waters from the North Pacific Subtropical Gyre (Saito, 2019). Along the continental slope of the East China Sea, the Kuroshio Current flows northeastward into the Western North Pacific through the Tokara Strait. The current, the surrounding shelf, and offshore waters interact with each other, leading to the formation of complex water masses with large physical environmental gradients (Chen et al., 1995; Ito et al., 1995). Diverse, spatially and seasonally different microbial communities were reported in subtropical waters around the current (Liu et al., 2022; Endo et al., 2023; Wu et al., 2024), which makes this region the important spawning and nursery grounds of a variety of pelagic fish (Takasuka et al., 2014; Okazaki et al., 2019). Due to these abiotic and biotic environments, the subtropical Kuroshio region is appropriate to investigate environments affecting microbial community structure in marine environments.
Therefore, the present study aimed to clarify the differences in the effect of environments on community structures and in distribution patterns between prokaryotes and microbial eukaryotes in the subtropical Kuroshio region of the Western North Pacific Ocean. Field investigations were conducted at the multiple depths of stations on transect lines across the Kuroshio Current during two distinct seasons to cover a wide range of environmental conditions. Using the eDNA metabarcoding analyses of the 16S and 18S rRNA genes, prokaryotic and eukaryotic communities were examined, respectively, and environmental effect on the spatial and seasonal variations in their structures was evaluated. Furthermore, potential biological interactions among microbial communities were explored by comparing their distribution patterns across multiple trophic levels, implicating their distinct ecological roles in marine environments.
2 Materials and methods
2.1 Study area and samplings
This study was conducted in the subtropical Kuroshio region of the Western North Pacific Ocean during the KH-22–5 research cruise (spring 2022) on the R/V Hakuho-Maru (Figure 1A) and during the KS-22–15 research cruise (autumn 2022) on the R/V Shinsei-Maru (Figure 1B). Samplings were carried out at 12 stations on the NA (Stations NA1–NA6) and T (Stations T1–T6) transect lines during spring and at 5 stations (Stations 3, 5–8, and E1) during autumn (Supplementary Table 1). Sampling stations were established in the East China Sea, on the Kuroshio Current, and in the open ocean across the Kuroshio Current for both research cruises, but surveys were not possible on the Kuroshio Current during autumn due to unfavorable weather conditions. The position of the Kuroshio Current during the study period was obtained from the Japan Coast Guard (Quick Bulletin of Ocean Conditions, https://www1.kaiho.mlit.go.jp).
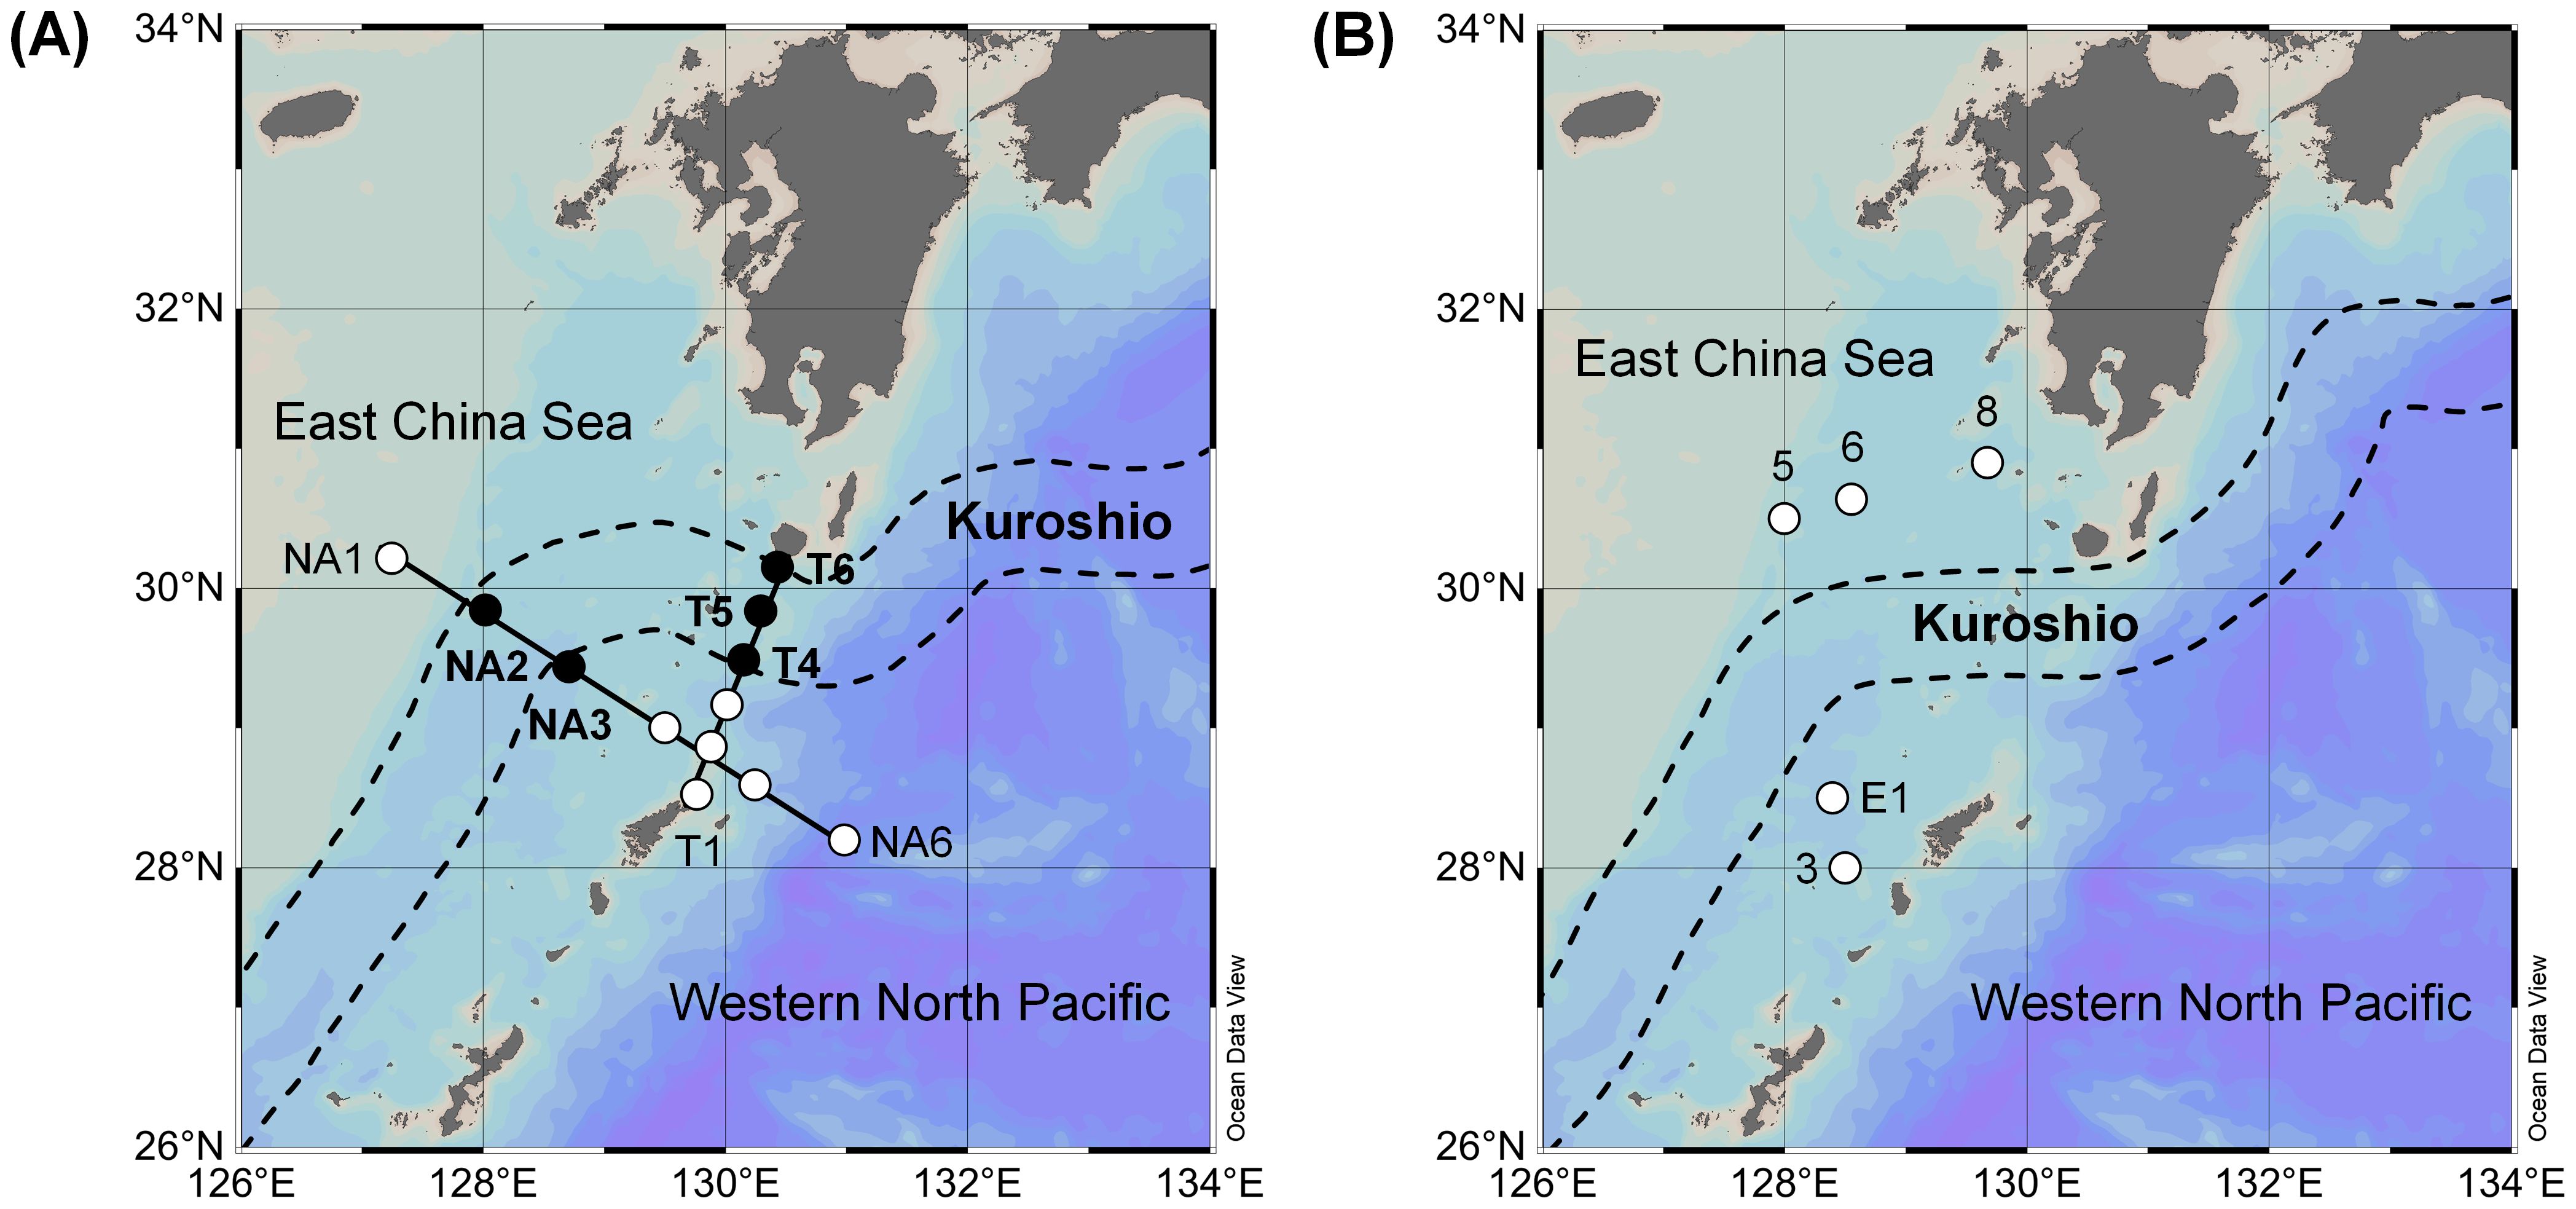
Figure 1. Sampling locations during the (A) KH-22-5 (spring 2022) and (B) KS-22-15 (autumn 2022) research cruises. Closed circles represent stations on the Kuroshio Current.
Seawater was taken from four depths (10, 50, 100, and 150 m) for eDNA analysis and from 11 (10, 20, 30, 40, 50, 60, 80, 100, 125, 150, and 200 m during spring) or seven (10, 30, 50, 100, 150, 200 m and chlorophyll maximum during autumn) depths (< 200 m) for chlorophyll (chl.) a analysis using Niskin bottles (General Oceanics) equipped on a CTD-carousel system (SBE 911 plus CTD, Sea-Bird Scientific). For eDNA analysis, seawater samples (65 samples in total) were collected in 7-L plastic bags (Rontainer 5RH, Sekisui Seikei) after they were rinsed three times. Seawater (mean ± standard deviation: 6.85 ± 0.76 L) was immediately filtered through a 0.22-µm pore size cartridge filter (Sterivex SVGP01050, Merck) using a digital peristaltic pump (Masterflex 07528-10, Cole-Parmer) at a rotation speed of 60 rpm. The plastic bags and other materials (e.g. silicon tubes) were all sterilized before use to prevent contamination, and blank samples were also collected by filtering ultrapure water instead of seawater. After adding 2 mL of stabilization solution (RNAlater AM7024, Thermo Fisher Scientific) with 5-mL disposable syringes to avoid DNA degradation, the cartridge filters were stored at –20 °C until further analysis. The details of this filtration process were described by Yu et al. (2022).
For chl. a analysis, seawater samples were collected in 125-mL plastic bottles (Nalgene 2004-0004, Thermo Fisher Scientific) and immediately filtered through glass fiber filters (Whatman GF/F, GE Healthcare Life Sciences). After chl. a pigment on the filters was extracted with 5 mL of N,N-dimethylformamide at –20 °C for 24 h under the dark condition (Suzuki and Ishimaru, 1990), chl. a concentration was measured using a fluorometer (10 AU, Turner Designs) (Welschmeyer, 1994).
2.2 eDNA metabarcoding analysis
DNA was extracted from the cartridge filters and eluted in 50 µL of elution buffer using DNeasy PowerWater Sterivex Kit (14600-50-NF, Qiagen) after the stabilization solution was removed. The concentration of DNA extracted from blank samples was under the detection limit. Following an early-pooling protocol of Ushio et al. (2022), the 16S (V4–V5 region) and 18S (V4 region) rRNA genes of each sample were amplified in four replicates using 515F-Y/926R (Quince et al., 2011; Parada et al., 2016) and E572F/E1009R (Comeau et al., 2011) universal primer sets (with the sequences of the sample-specific tags and sequencing primers) for prokaryotes and microbial eukaryotes, respectively. The compositions of PCR mixtures and the thermal cycle conditions are shown in Supplementary Table 2, and PCR negative controls (H2O instead of template DNA) were also prepared. The 1st PCR product of each sample was purified with ExoSAP-IT Express (75001, Thermo Fisher Scientific) and pooled at equimolar concentration. After purification with AMPure XP Reagent (A63881, Beckman Coulter), the 2nd PCR was performed to append adapter sequences. The 2nd PCR product was purified again with AMPure XP Reagent, and the target-sized DNA was excised using E-Gel SizeSelect II Agarose Gel (G661012, Thermo Fisher Scientific). The amplicon libraries were sequenced (2 × 250 bp PE) using a NovaSeq 6000 system (illumina).
2.3 Data analysis
Sequence data were demultiplexed and processed (e.g. primer trimming, quality filtering, error correction, and merging) by the dada2 plugin (Callahan et al., 2016) of QIIME 2 (Bolyen et al., 2019), which generates the table of amplicon sequence variants (ASVs). Because some ASVs were detected in negative controls, the numbers of the reads of the ASVs in negative controls were subtracted from those in seawater samples. Then, the numbers of the reads of each sample were rarefied to the minimum number of reads among all samples (10,000 for both prokaryotic and eukaryotic samples) through random sampling to prevent the effect of sequence depth. The coverages of the rarefied samples were almost consistent for prokaryotic (99.96 ± 0.04%) and eukaryotic (99.97 ± 0.02%) communities. After rarefaction, rare ASVs (relative abundance < 0.1%) and ASVs present in only one sample were removed for robust statistical analysis. Taxonomy was assigned to each ASV with the greatest possible resolution at a confidence threshold of 70% using the SILVA 138 reference database (Yilmaz et al., 2014). ASVs classified as the non-target organisms (e.g. chloroplasts for prokaryotic samples and prokaryotes for eukaryotic samples) were removed.
The diversity of prokaryotic and eukaryotic communities was assessed by ASV richness and Shannon index. Cluster (hierarchical) and non-metric multidimensional scaling (nMDS) analyses were conducted based on the Bray-Curtis similarity matrix among samples calculated from microbial relative abundance data at the order level to classify samples into several groups. On the basis of the number of groups formed as well as the complexity of the community structures of prokaryotes and microbial eukaryotes, similarity level used for grouping was determined. The nMDS analysis was also performed using similarities among microbial taxa in order to compare their distribution patterns. Moreover, to evaluate the effect of water temperature and salinity (explanatory variables) on the variation in microbial community structure (response matrix), the distance-based linear model (DistLM) analysis was conducted using the similarity matrix among samples. In addition to water temperature and salinity, chl. a concentration was also used as an explanatory variable, assuming that the relationships between chl. a concentration and prokaryotic or eukaryotic communities partly reflect the potential interactions between phytoplankton and heterotrophic prokaryotes or eukaryotes. Before the analysis, the explanatory variables were square-root-transformed, normalized, and checked for multicollinearity. The best model was determined based on stepwise selection and the adjusted R2 criterion, and significance was assessed by 10,000 permutations. The relationships between the explanatory variables and microbial community structure were visualized by the distance-based redundancy analysis (dbRDA) ordination and vector overlay. These analyses were performed in the statistical software PRIMER ver. 7 with a package PERMANOVA+ (Anderson et al., 2008; Clarke and Gorley, 2015).
3 Results
3.1 Physical conditions and chl. a concentration
On the NA Line, water temperature (17.1–17.3 °C) and salinity (34.58) were low and vertically uniform at Station NA1 located in the East China Sea (Figure 2A). Salinity showed high values (34.68–34.78) in the surface layer (< 150 m) of Stations NA4–NA6 in the open ocean. On the Kuroshio Current, high water temperature (21.0–22.1 °C and 21.6 °C) and low salinity (34.57–34.58 and 34.58) were observed at shallower depths (< 100 m and < 40 m at Stations NA2 and NA3, respectively). At deeper depths of the both stations, water temperature decreased gradually, and salinity increased irregularly. Generally, chl. a concentration was high near the surface and decreased with depth. In the surface layer, high chl. a concentration (0.14–0.75 µg L–1) was observed at Stations NA1 and NA3, and low values (0.09–0.55 µg L–1) were observed at Stations NA4–NA6. At Station NA2, chl. a concentration showed high values (0.26–0.61 µg L–1) at shallower depths but decreased sharply at deeper depths.
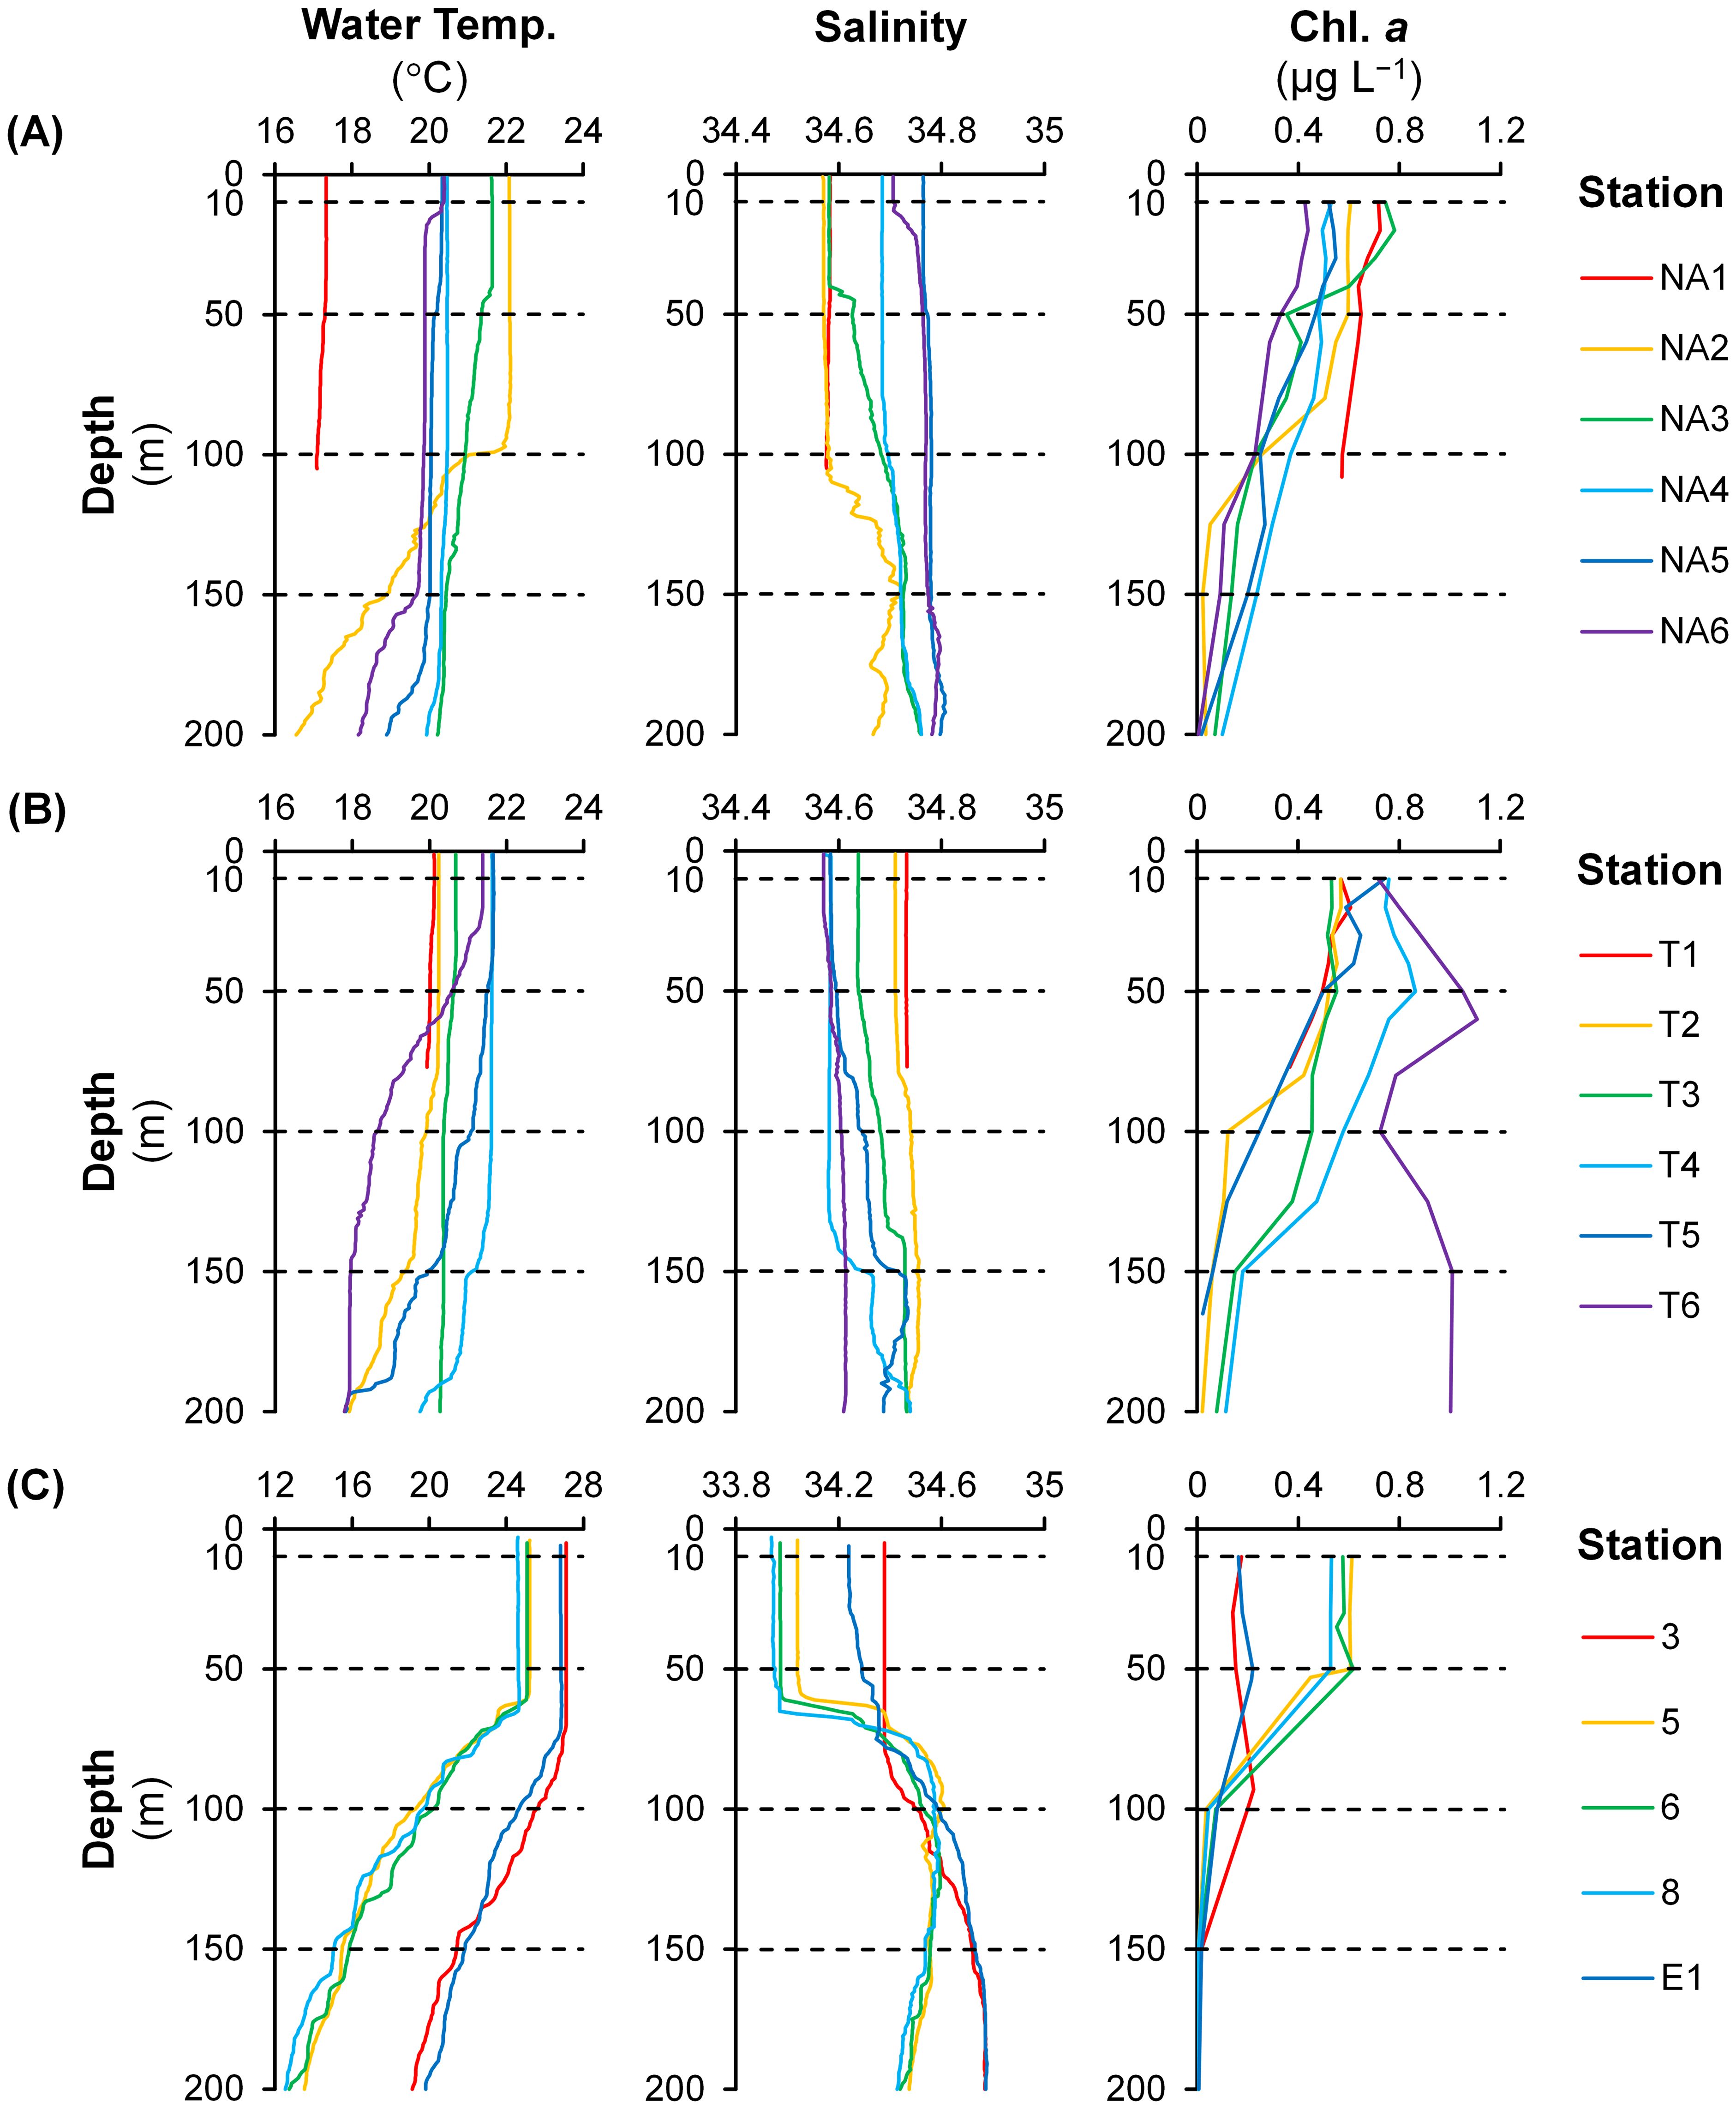
Figure 2. Vertical profiles of water temperature, salinity, and chlorophyll a concentration (chl. a) on the (A) NA and (B) T Lines during the KH-22-5 (spring 2022) and (C) during the KS-22-15 (autumn 2022) research cruises (note different scales between research cruises for water temperature and salinity). Dashed lines indicate depths where environmental DNA samples were collected.
On the T Line, water temperature was low (19.4–20.7 °C), and salinity was high (34.64–34.76) in the surface layer (< 150 m) of Stations T1–T3 in the open ocean (Figure 2B). In contrast, on the Kuroshio Current (at Stations T4–T5), high water temperature (20.4–21.7 °C) and low salinity (34.57–34.67) were observed at shallower depths (< 140 m). Similar to Stations NA2–NA3, water temperature and salinity at Stations T4–T5 decreased and increased, respectively, at deeper depths. At Station T6 located on the Kuroshio Current as well, water temperature showed a high value (21.4 °C) at shallower depths (< 20 m) but decreased sharply at deeper depths whereas salinity remained vertically uniform and low (34.57–34.61) in the surface layer. Chl. a concentration was generally high near the surface except at Station T6 where high values (0.72–1.11 µg L–1) were observed even at deeper depths. Chl. a concentration in the surface layer showed low values (0.06–0.61 µg L–1) at Stations T1–T3 and high values (0.06–0.86 µg L–1) at Stations T4–T5. Chl. a concentration was considerably low (0.06 µg L–1) at deeper depths of Station T5.
During autumn, the water column was strongly stratified due to heavy precipitation (e.g. 16.0–25.0 mm at Stations 5–8) during the study period (Figure 2C). Low water temperature (24.6–25.2 °C) and salinity (33.94–34.07) were observed at shallower depths (< 60 m) of Stations 5–8 in the East China Sea. On the other hand, water temperature (26.8–27.1 °C) and salinity (34.24–34.38) showed high values at shallower depths (< 70 m) of Stations 3 and E1 in the open ocean. At deeper depths, water temperature decreased sharply at the five stations. A gradual increase in salinity was observed at deeper depths of Stations 3 and E1 while salinity increased irregularly below shallower depths at Stations 5–8. Chl. a concentration at Stations 5–8 was high (0.45–0.62 µg L–1) at shallower depths and decreased sharply at deeper depths. At Stations 3 and E1, the maximum of chl. a concentration (0.22 µg L–1) was observed at 90 m and 50 m, respectively.
3.2 Structures and diversity of microbial communities
To characterize the microbial communities of different seasons, locations, and depths, samples were classified into several groups according to the similarity of prokaryotic or eukaryotic community structure at the order level among samples. For prokaryotes, cluster analysis divided 65 samples into six groups (a–f) with the similarity of 69% (Supplementary Figure 1A), and similarity distances among samples and groups were shown by nMDS analysis (Figure 3A). Similarly, the similarity of 59% was used for microbial eukaryotes, which formed nine groups (A–I) (Figure 3B, Supplementary Figure 1B).
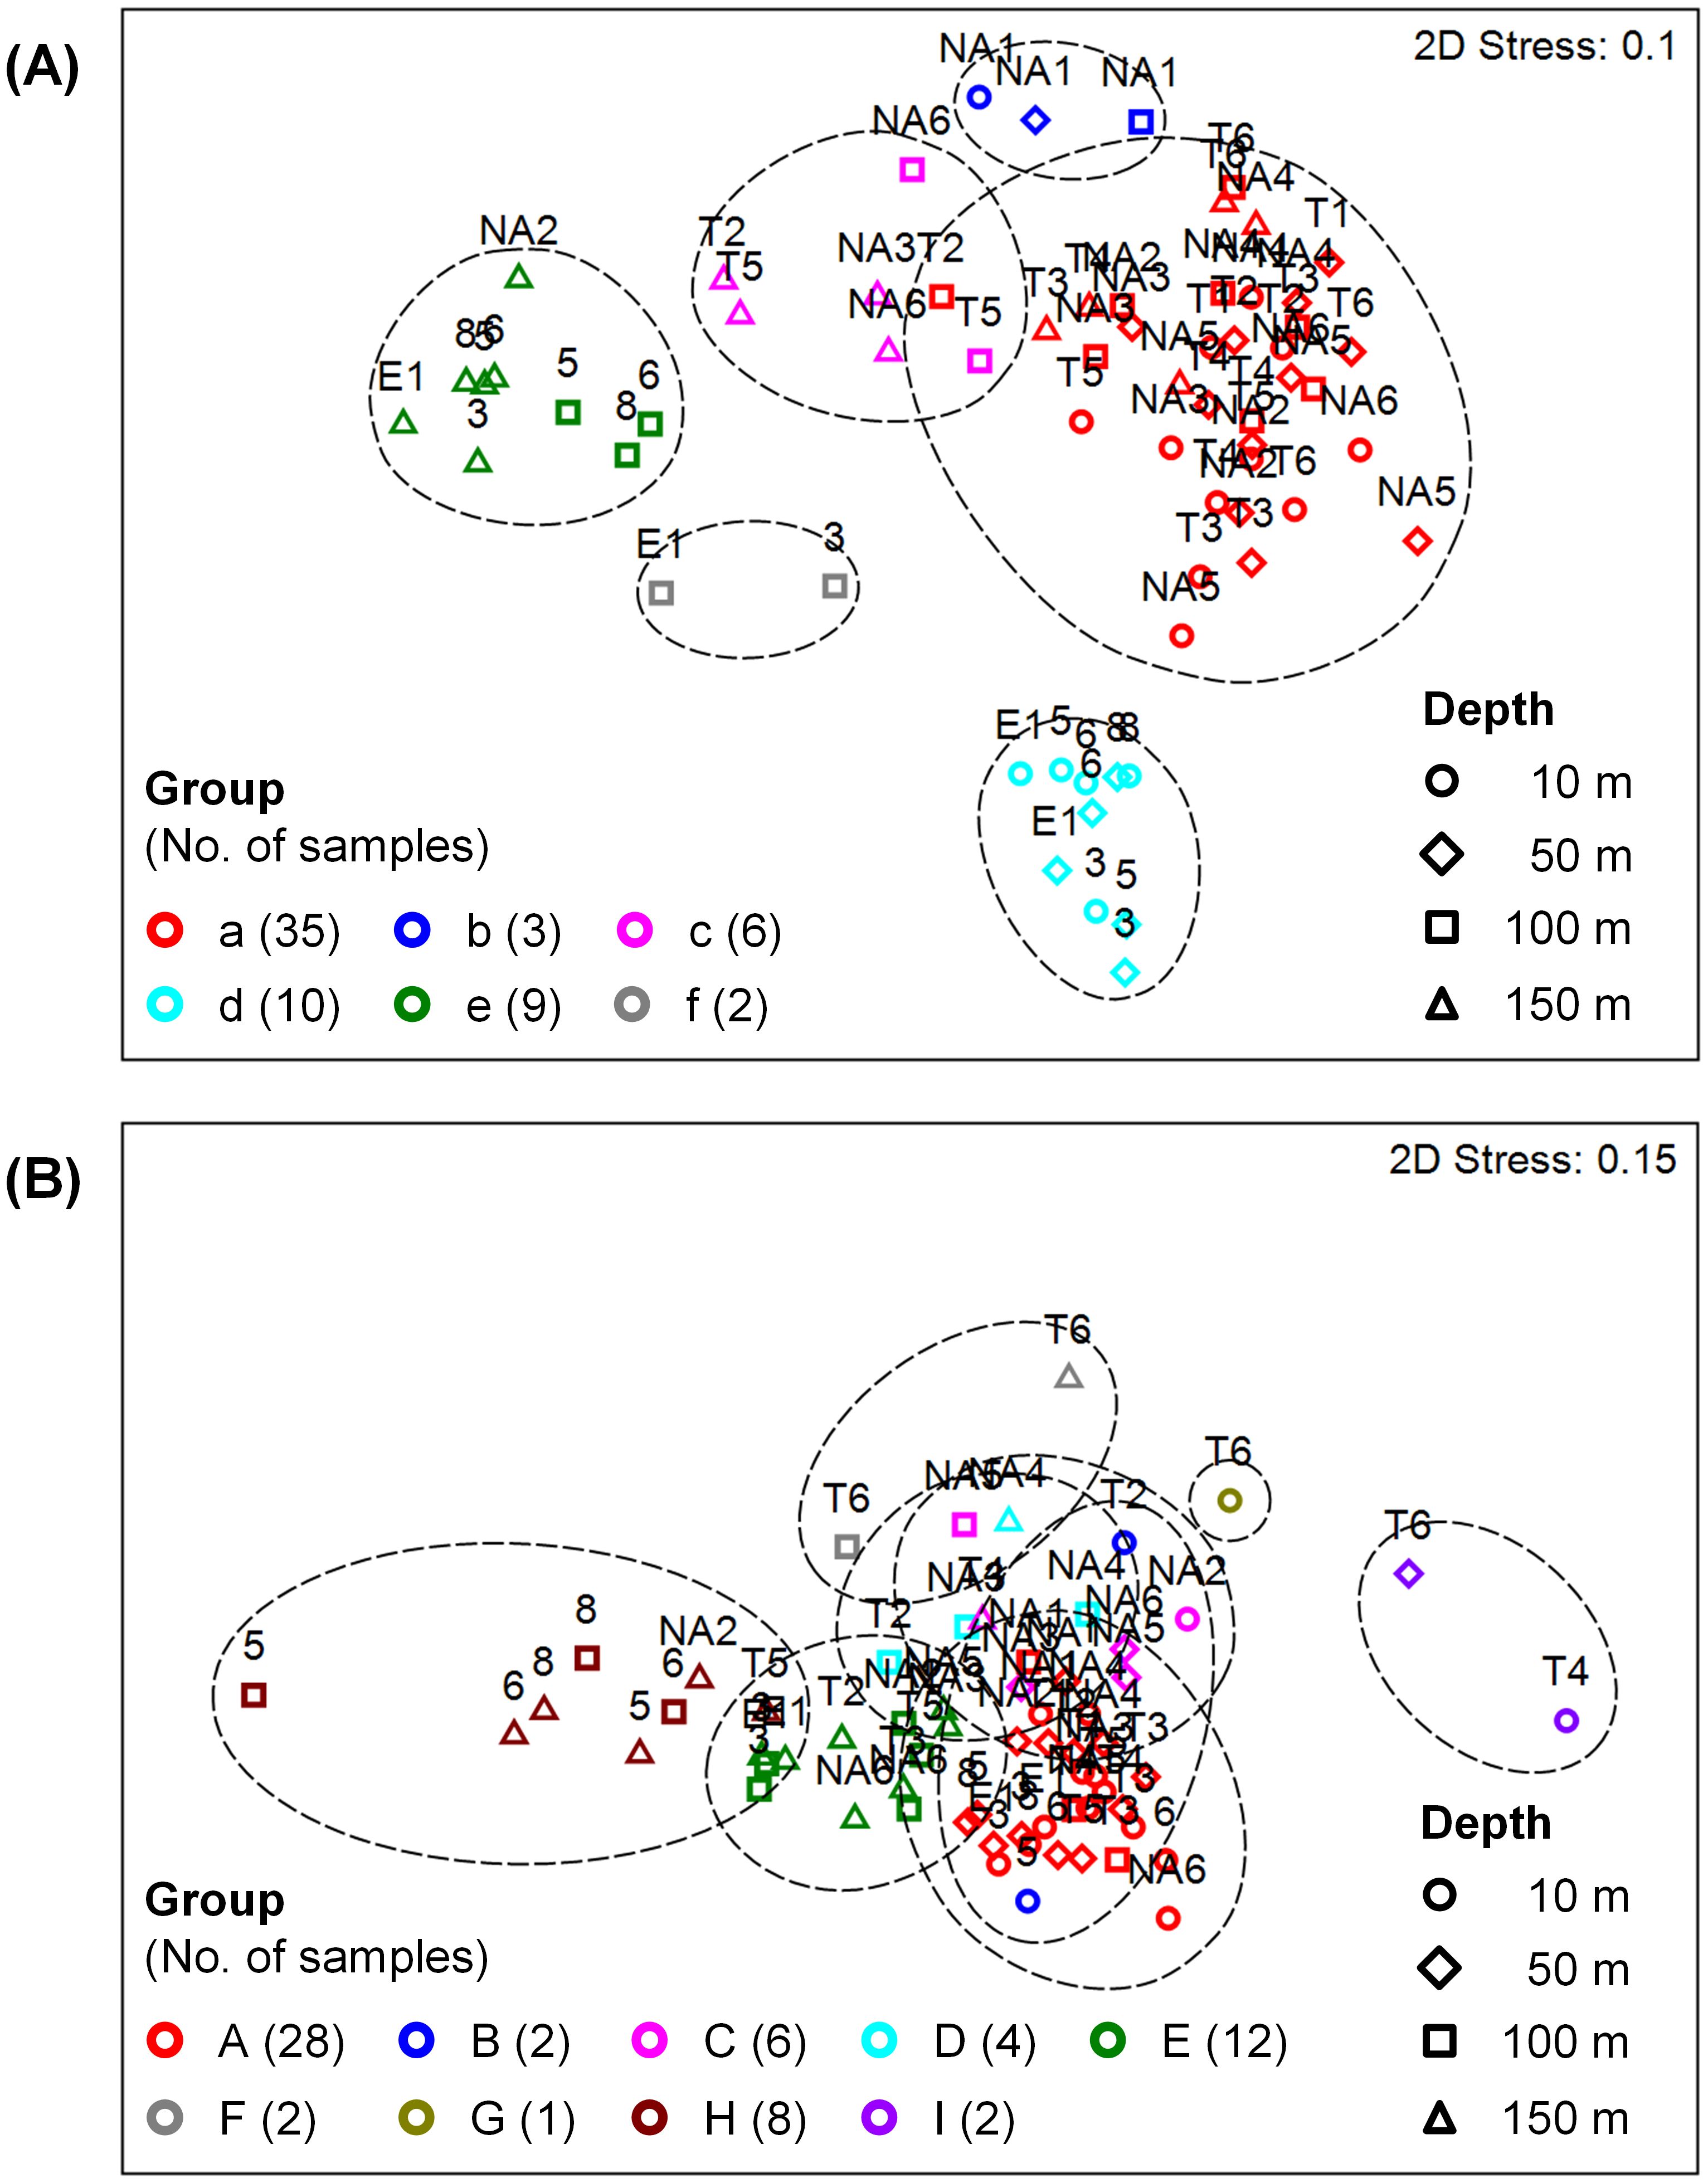
Figure 3. Non-metric multidimensional scaling (nMDS) analysis of the community structures of (A) prokaryotes and (B) microbial eukaryotes, showing similarity distances among samples. Samples were classified into groups according to the similarities of 69% in (A) and 59% in (B) indicated by dashed lines (see Supplementary Figure 1). Sample labels and symbols represent stations and depths, respectively.
Prokaryotic samples were primarily divided by seasons (Table 1A). Samples of spring and autumn were classified into Groups a–c and d–f, respectively, except a sample at 150 m depth of Station NA2. During spring, samples at Station NA1 (Group b) and samples at 100–150 m depths (Group c) formed different groups. Samples at 10–50 m (Group d) and 100–150 m (Groups e–f) depths were grouped differently during autumn. Flavobacteriales were the most dominant (17.0–37.5%) during spring (Groups a–c), and Synechococcales (17.4%), SAR11 Clade (18.2%), and Nitrosopumilales (16.2%) were also abundant in Groups a, b, and c, respectively (Figure 4A, Supplementary Figure 2A). During autumn, Groups d (44.5%) and f (16.2%) were dominated by Synechococcales, and Nitrosopumilales dominated (17.8%) Group e.
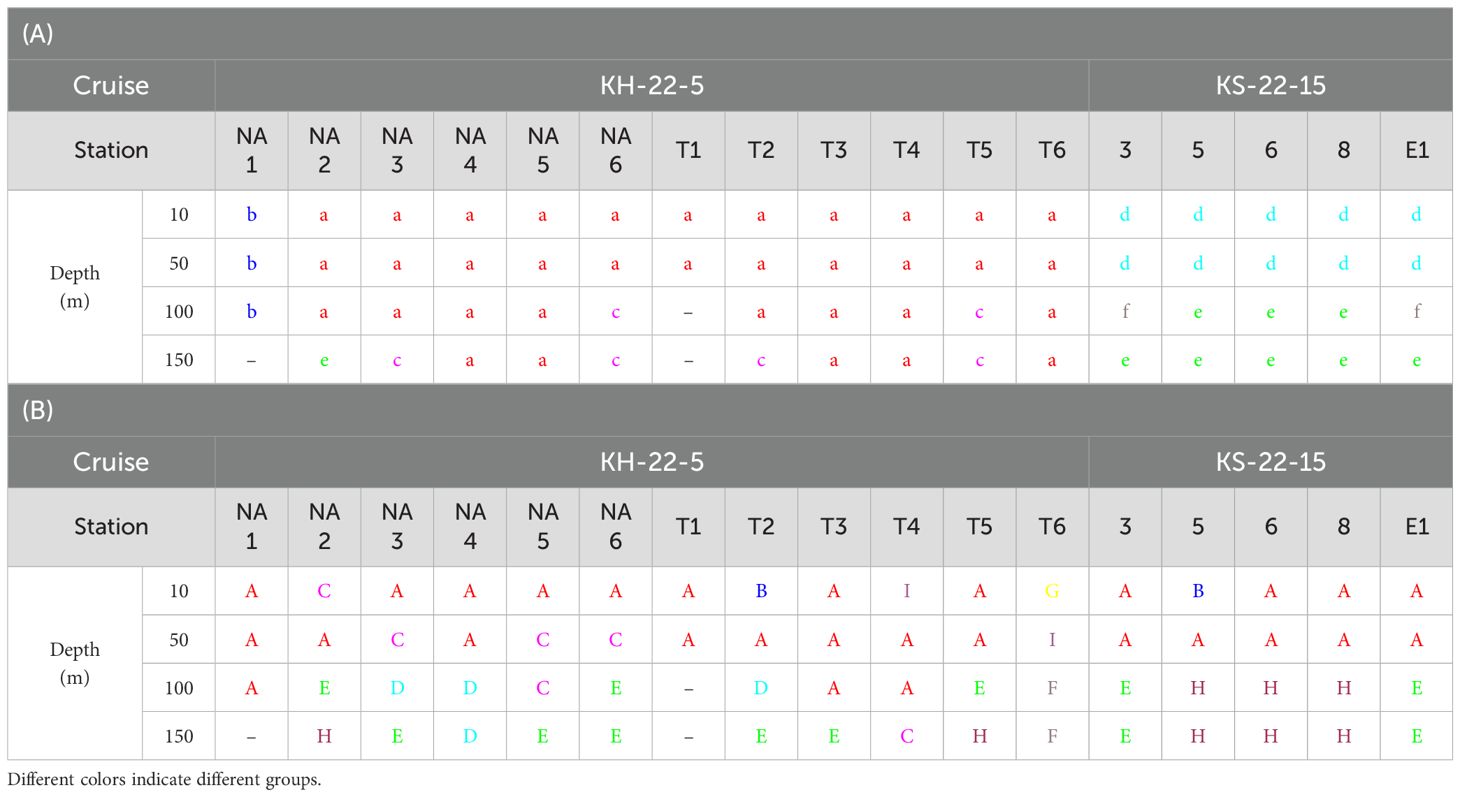
Table 1. Groups of each sample classified according to the similarities of the community structures of (A) prokaryotes and (B) microbial eukaryotes (see Figure 3).
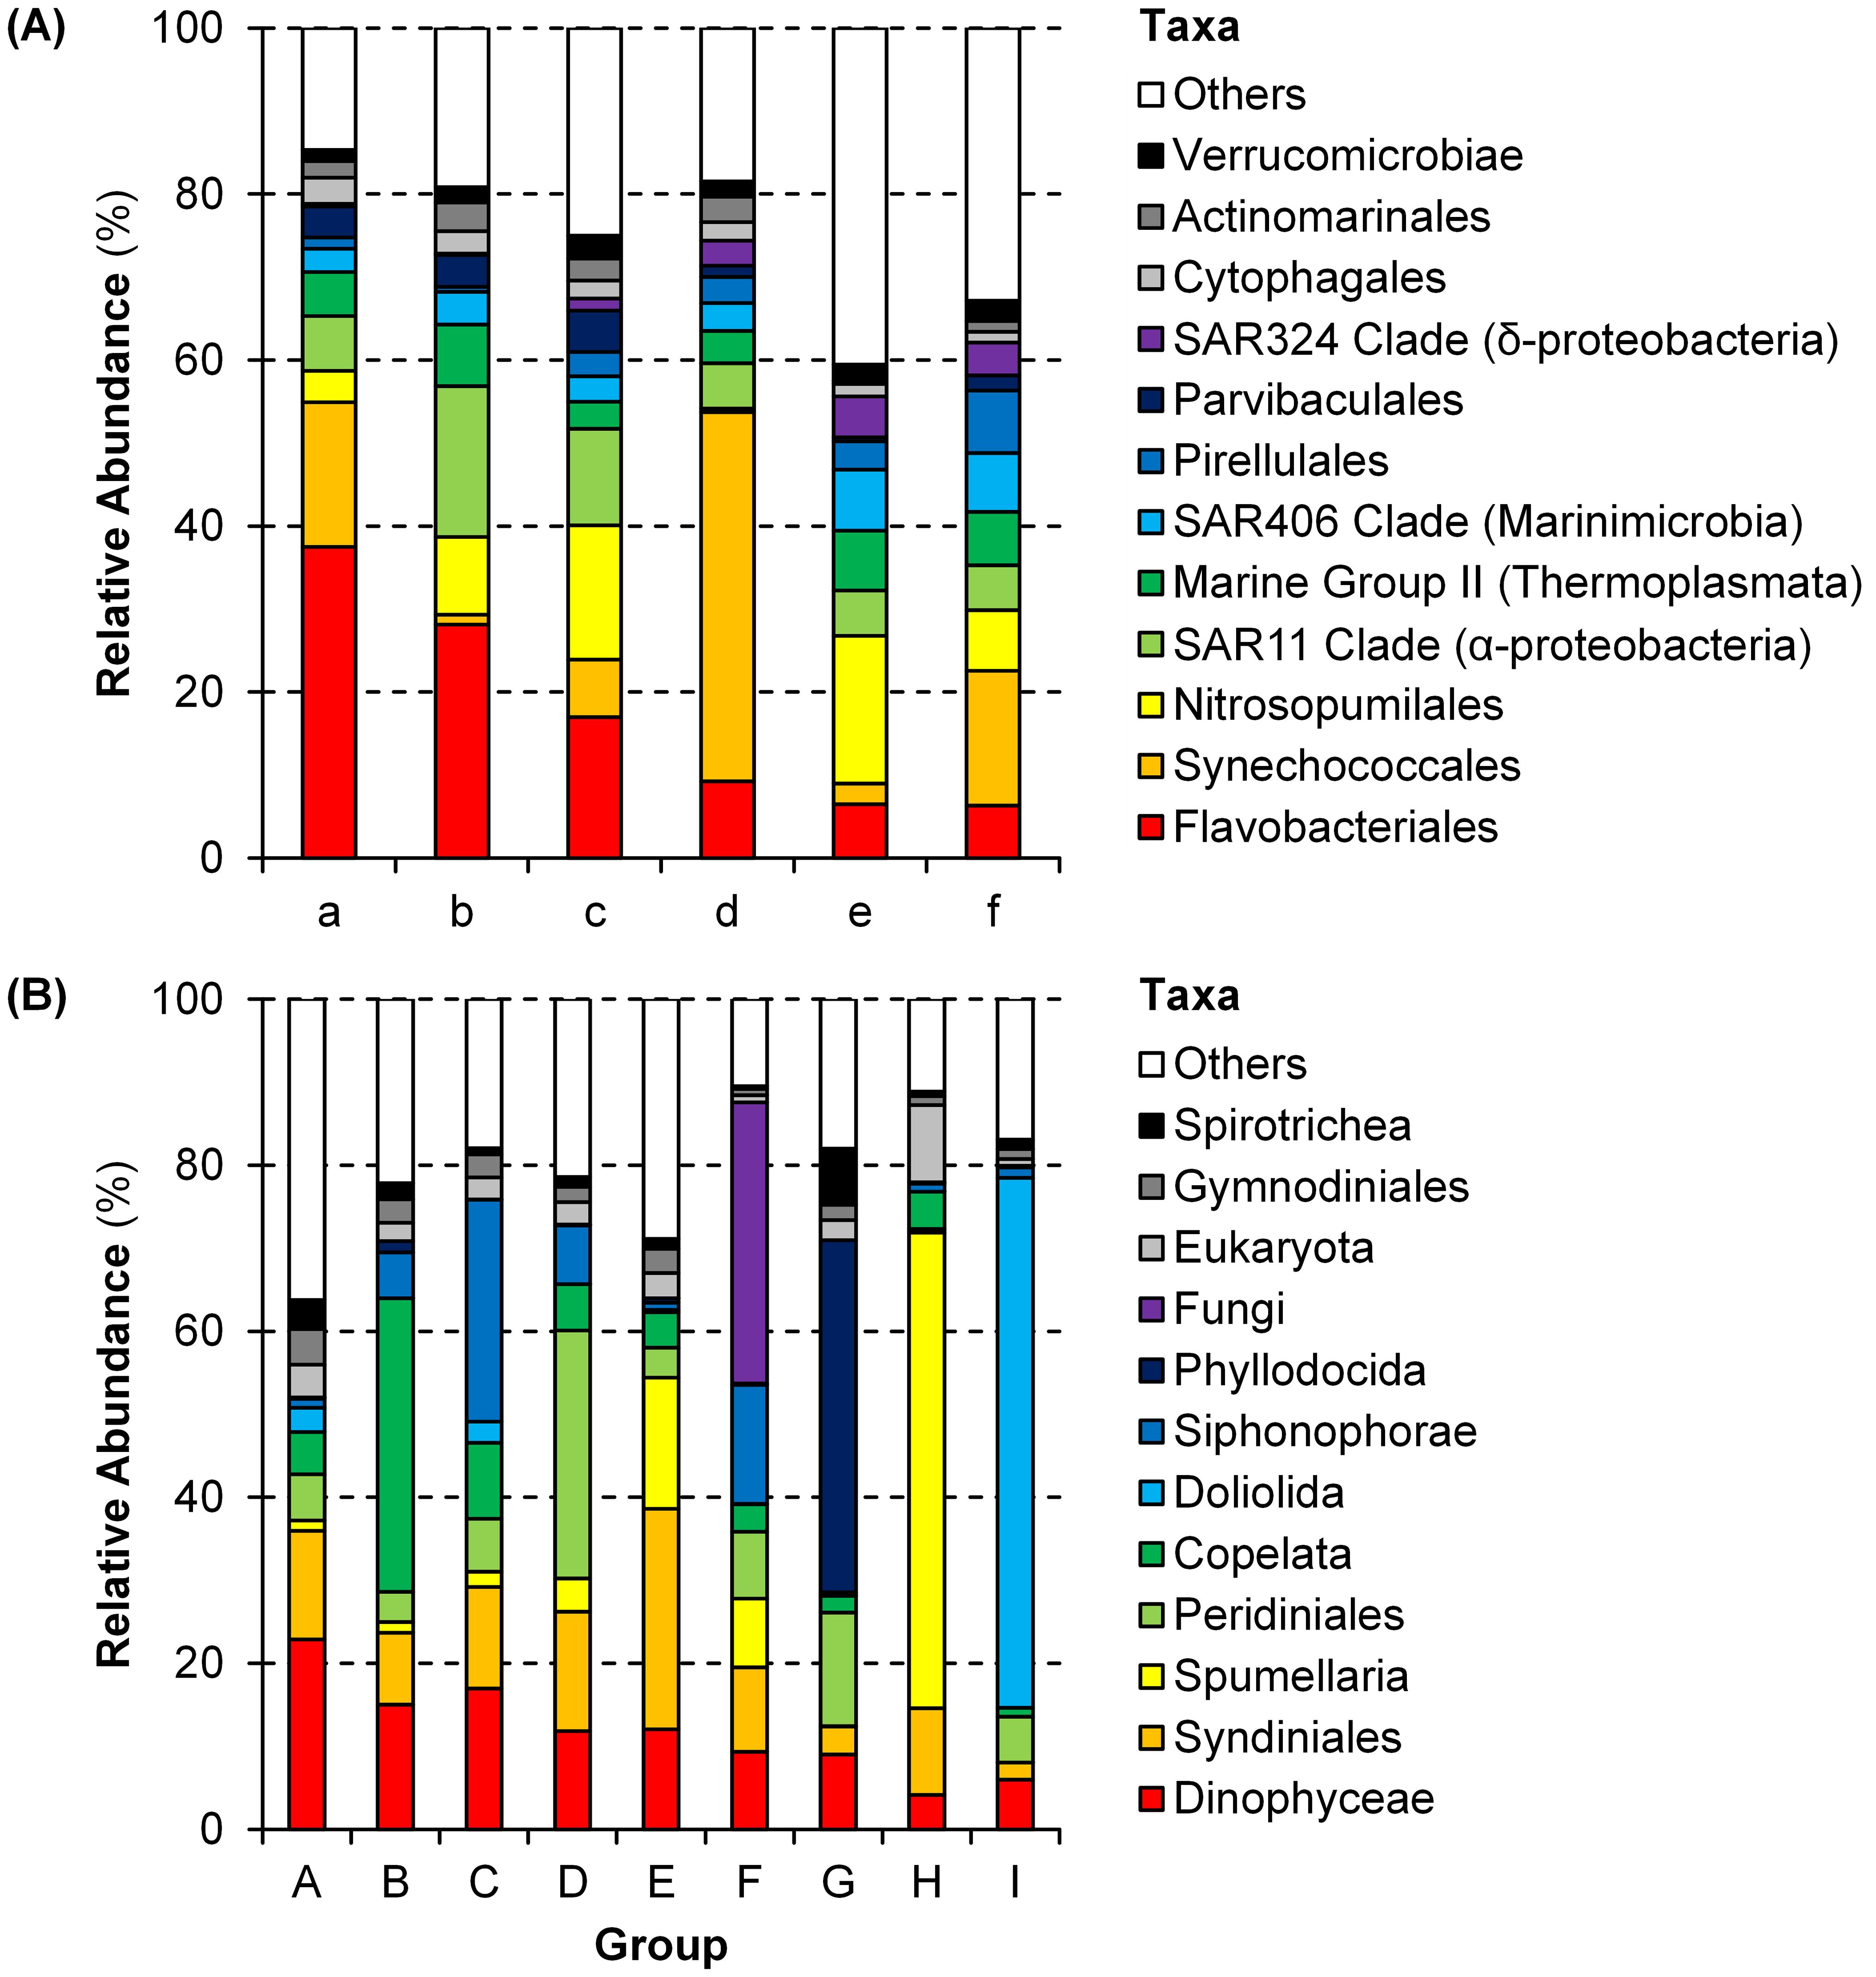
Figure 4. Community structures of each group (see Table 1 and Figure 3) of (A) prokaryotes and (B) microbial eukaryotes at the order level.
Most of eukaryotic samples were classified into Groups A (28 samples) and C (6 samples) regardless of seasons, locations, and depths. The other samples were divided by depths (Table 1B). Groups B, G, and I were composed of samples at shallower depths (0–50 m) whereas samples at deeper depths (100–150 m) formed Groups D–F and H. Notably, samples at 150 m depth of Stations NA2 and T5 and at deeper depths of Stations 5–8 were grouped together as Group H. Dinophyceae and Syndiniales were dominant in Groups A (22.9% and 13.1%, respectively) and C (17.0% and 12.2%, respectively) with more abundant Siphonophorae (26.8%) in Group C (Figure 4B, Supplementary Figure 2B). In Groups B, G, and I, heterotrophs such as Copelata (35.4%), Phyllodocida (42.4%), and Doliolida (63.8%) dominated eukaryotic communities, respectively. Groups D, E, and F, were dominated by Peridiniales (29.8%), Syndiniales (26.6%), and Fungi (33.9%), respectively, and Spumellaria were the most dominant (57.3%) in Group H.
For prokaryotic communities, both richness and Shannon index showed high values in Groups c (medians: 453 and 7.15, respectively), e (862 and 8.48), and f (585 and 7.87) (Figures 5A, C) which consist of samples at deeper depths (100–150 m) (Table 1A). The richness of eukaryotic communities was high (505) in Group A and low (159) in Group F (Figure 5B). High Shannon index of eukaryotic communities was observed in Groups A (7.35) and E (7.33) while the index was low in Groups F (4.53) and I (4.08) (Figure 5D).
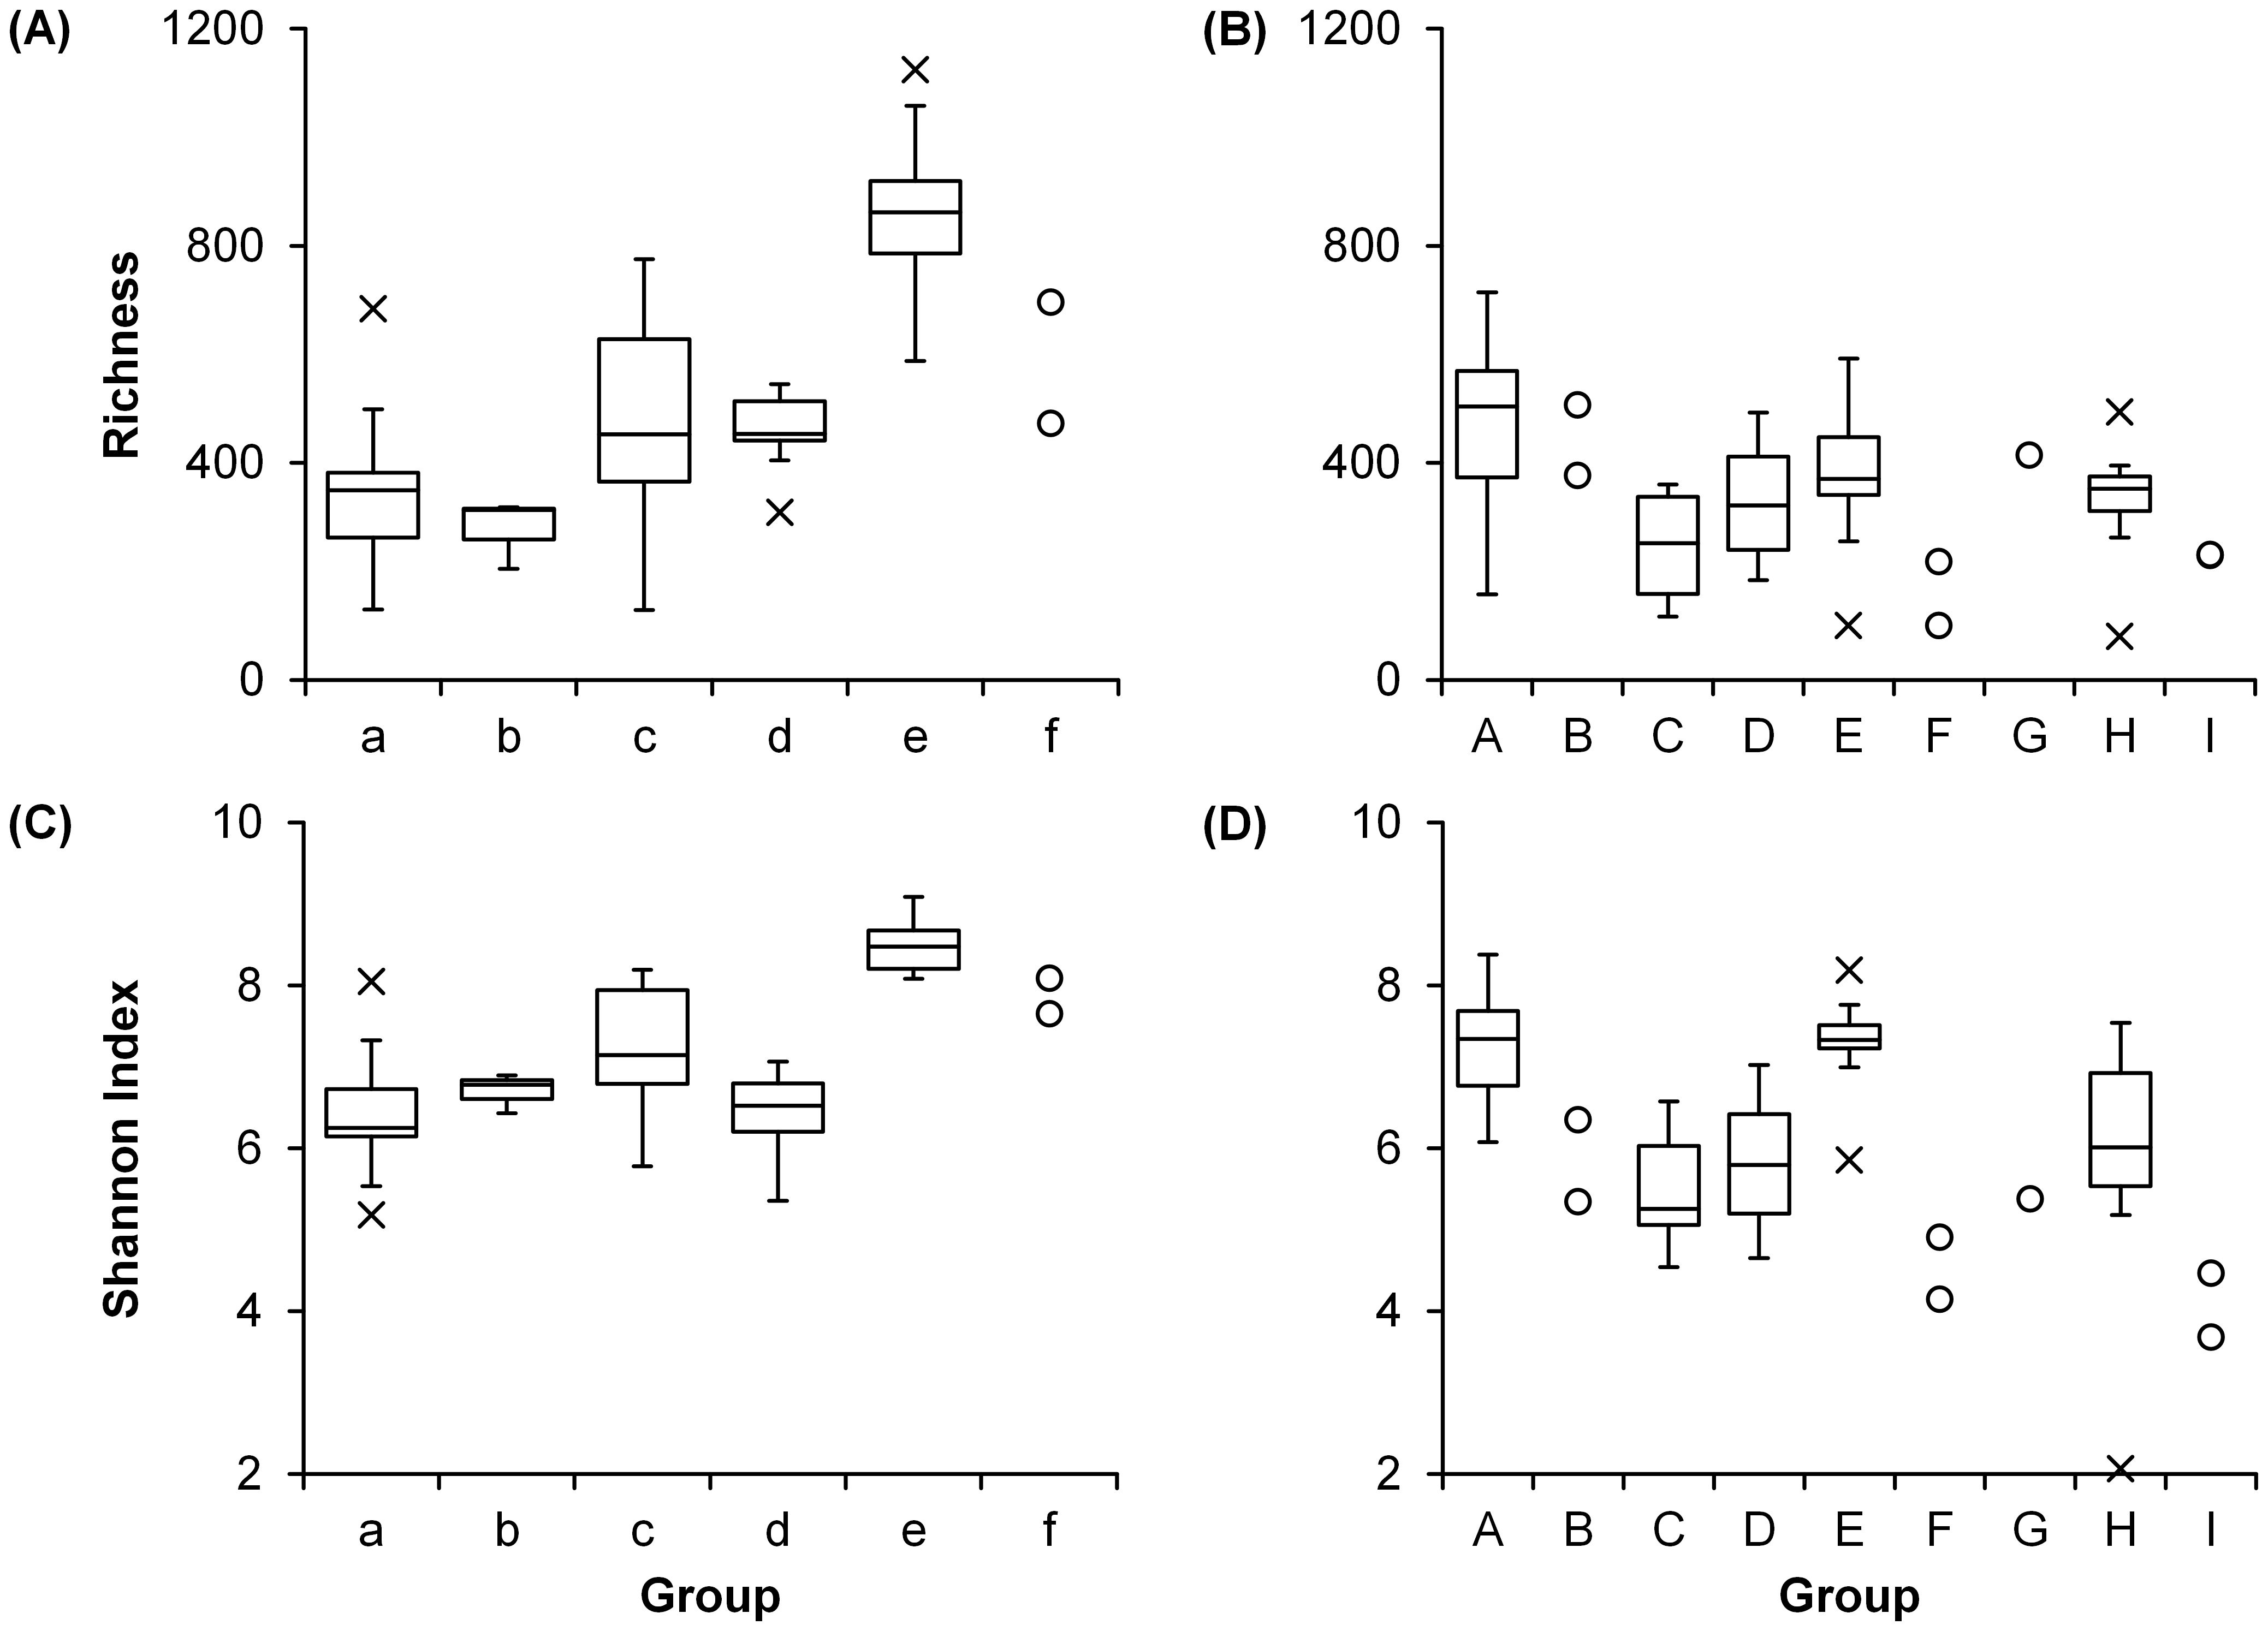
Figure 5. Diversity of each group (see Table 1 and Figure 3) of (A, C) prokaryotic and (B, D) eukaryotic communities.
3.3 Relationships between parameters and microbial community structures
The DistLM analysis showed that water temperature, salinity, and chl. a concentration explained 64.6% of the variance in the community structure of prokaryotes at the order level (Table 2). Among the parameters, the contribution of chl. a concentration was the largest (35.0%), followed by water temperature (20.0%) and salinity (9.57%). On the other hand, for microbial eukaryotes, only 35.4% of the variance was accounted for by the three parameters. Chl. a concentration contributed most (24.7%) to the variation in eukaryotic community structure, but water temperature (8.59%) and salinity (4.72%) each made a minor contribution. The axes 1 and 2 of the dbRDA accounted for 39.3% and 23.4% of the variance in prokaryotic community structure, respectively (Figure 6A). For microbial eukaryotes, 26.8% and 6.04% of the variance in community structure was explained by the dbRDA axes 1 and 2, respectively (Figure 6B). The axis 1 positively and highly correlated with chl. a concentration whereas water temperature (negative) and salinity (positive) showed stronger correlations with the axis 2 for both prokaryotic and eukaryotic communities (Supplementary Table 3).
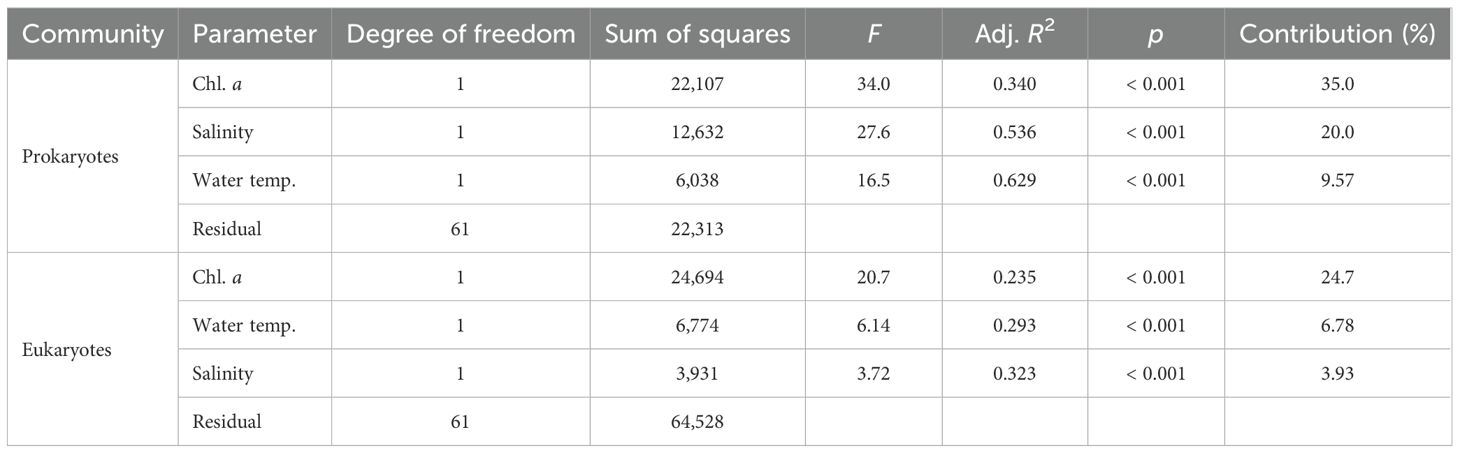
Table 2. Distance-based linear model (DistLM) analysis of the variations in the community structures of prokaryotes and microbial eukaryotes using water temperature, salinity, and chlorophyll a concentration (chl. a) as explanatory variables.
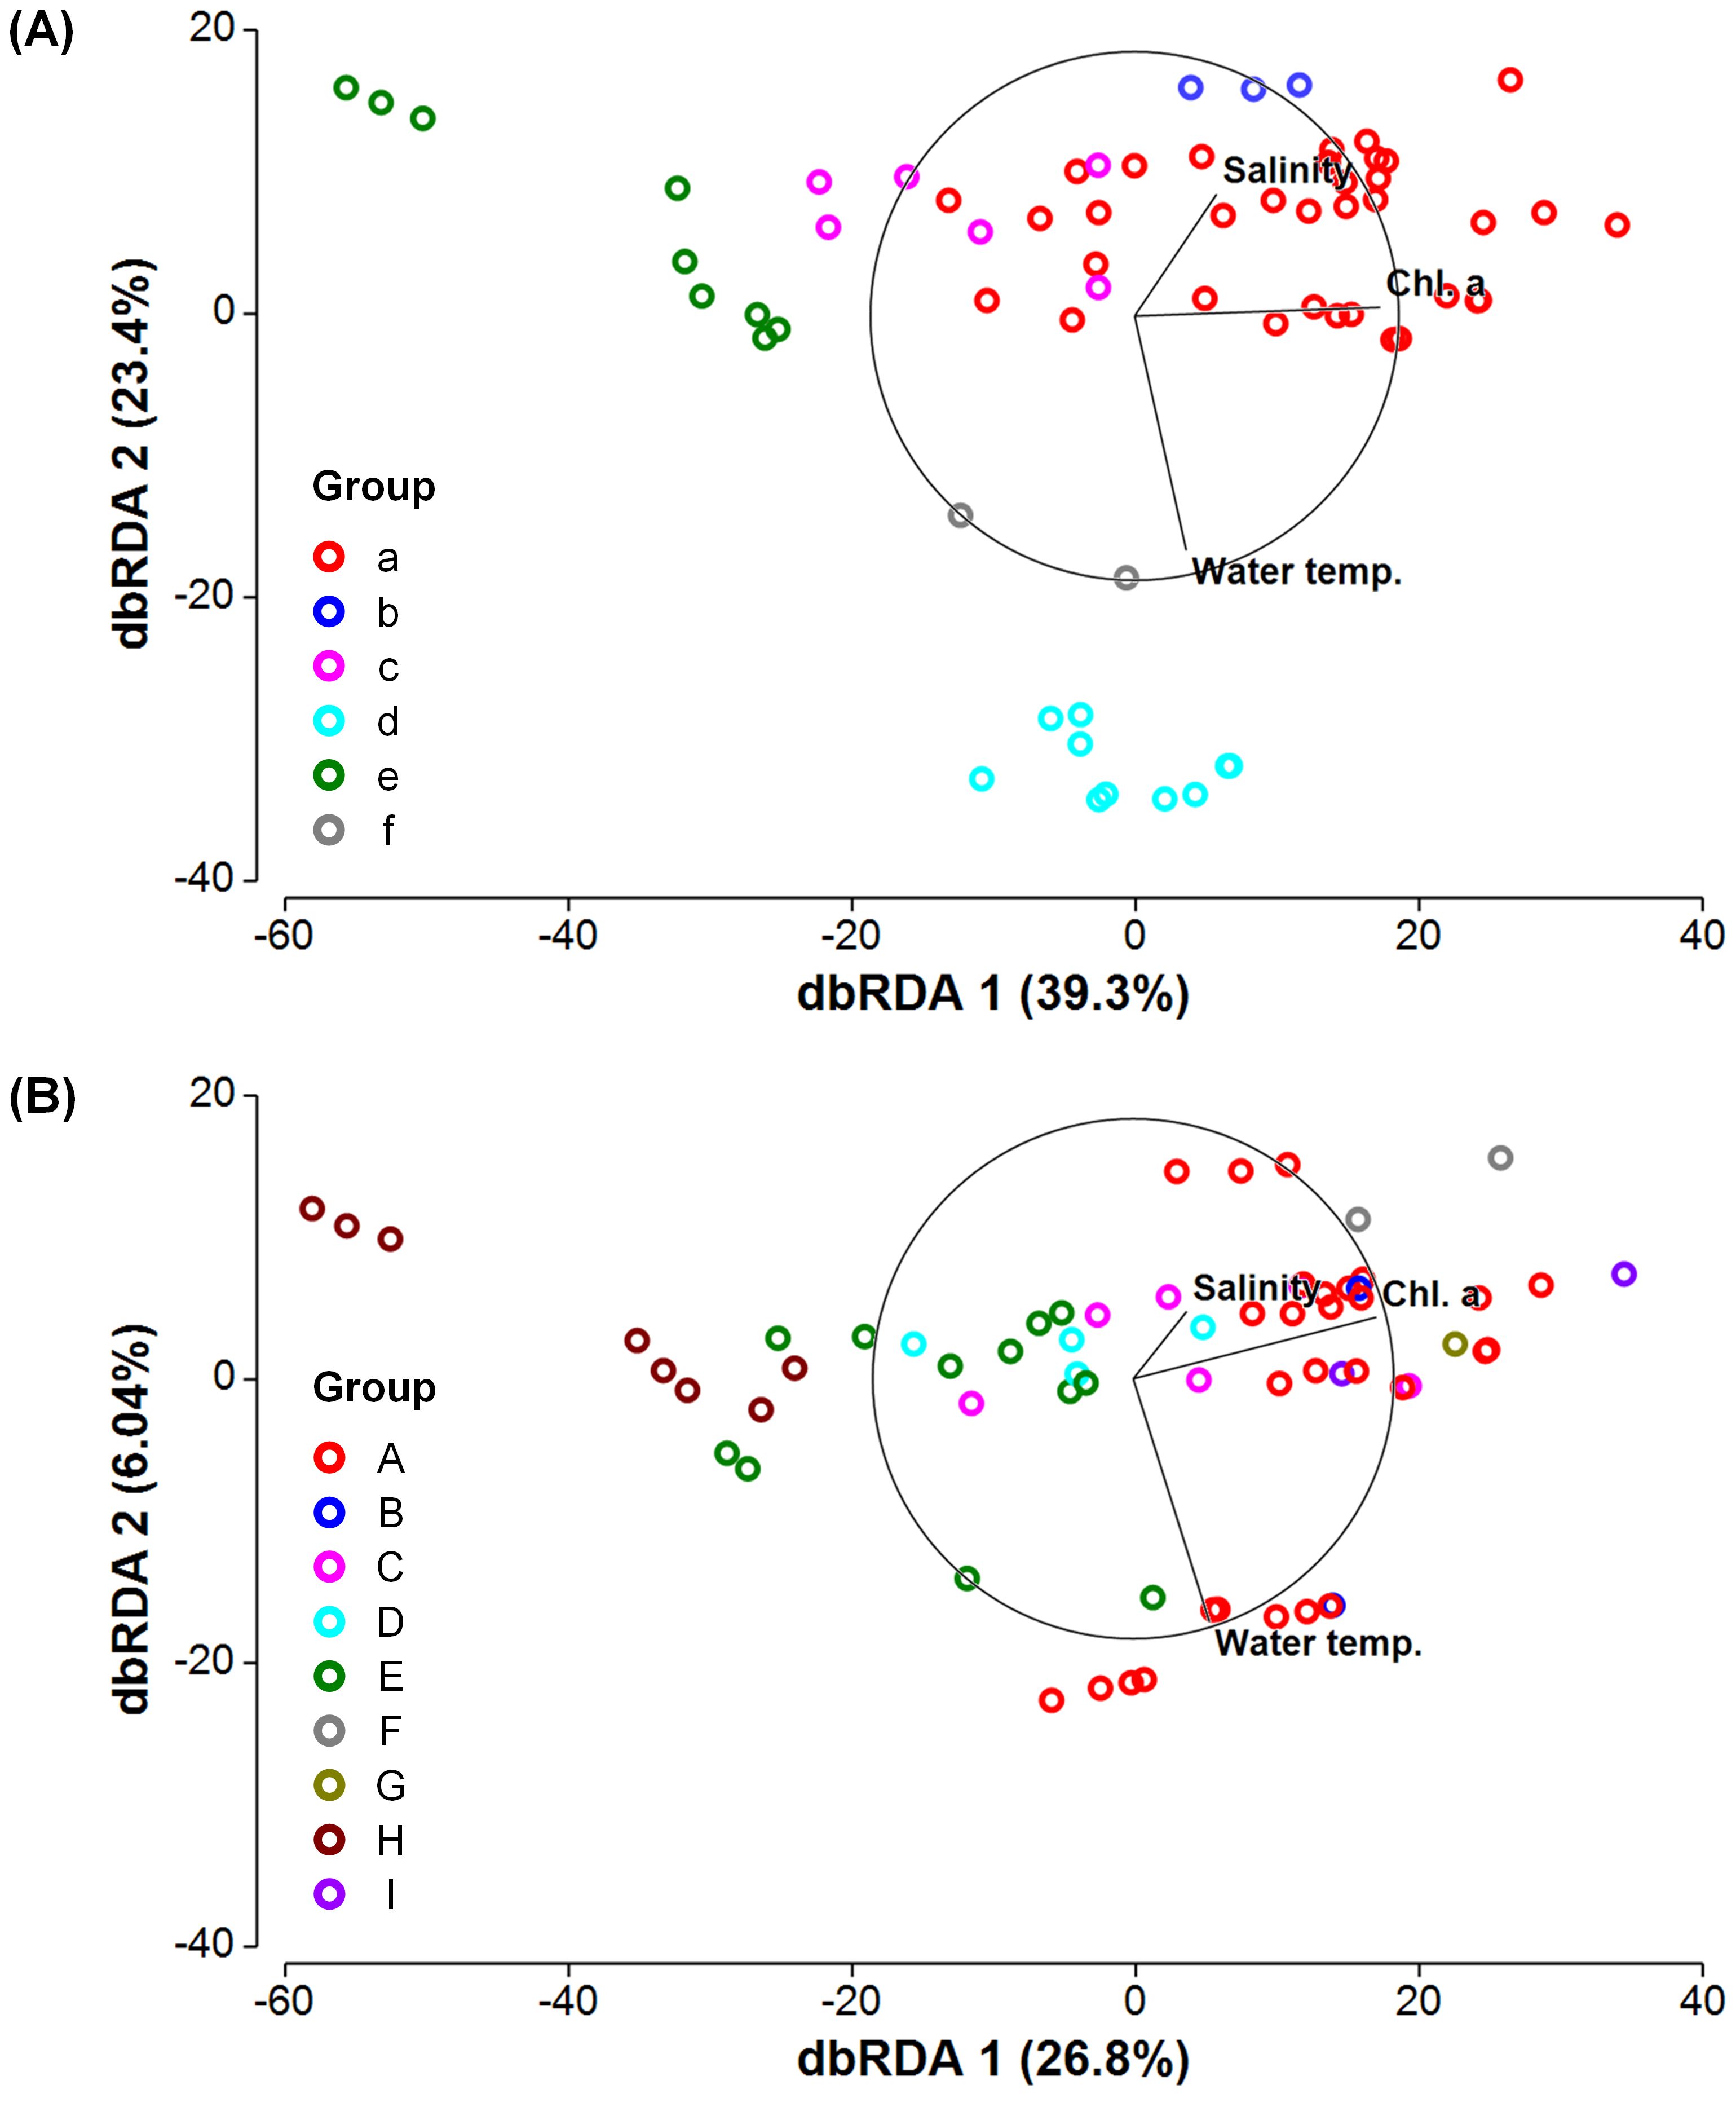
Figure 6. Distance-based redundancy analysis (dbRDA) of the community structures of (A) prokaryotes and (B) microbial eukaryotes. Samples were classified into groups (see Table 1 and Figure 3), and the contribution (%) of each dbRDA axis to the variation in the community structure is shown. Direction and strength of the relationships of water temperature, salinity, and chlorophyll a concentration (chl. a) with dbRDA axes are indicated by vector overlay.
3.4 Distribution patterns of microbial taxa
To compare the distribution patterns of microbial communities across multiple trophic levels, the similarities among both prokaryotic and eukaryotic taxa at the order level were examined. Prokaryotes, dinoflagellates (Dinophyceae, Syndiniales, Peridiniales, and Gymnodiniales), Spirotrichea, and Copelata showed relatively similar distribution patterns and formed the same cluster at the similarity of 29% (Figure 7, Supplementary Figure 3). In contrast, distinct distribution patterns were observed for Siphonophorae, Spumellaria, Doliolida, Phyllodocida, and Fungi. The distribution patterns of these heterotrophic eukaryotes were also independent from each other.
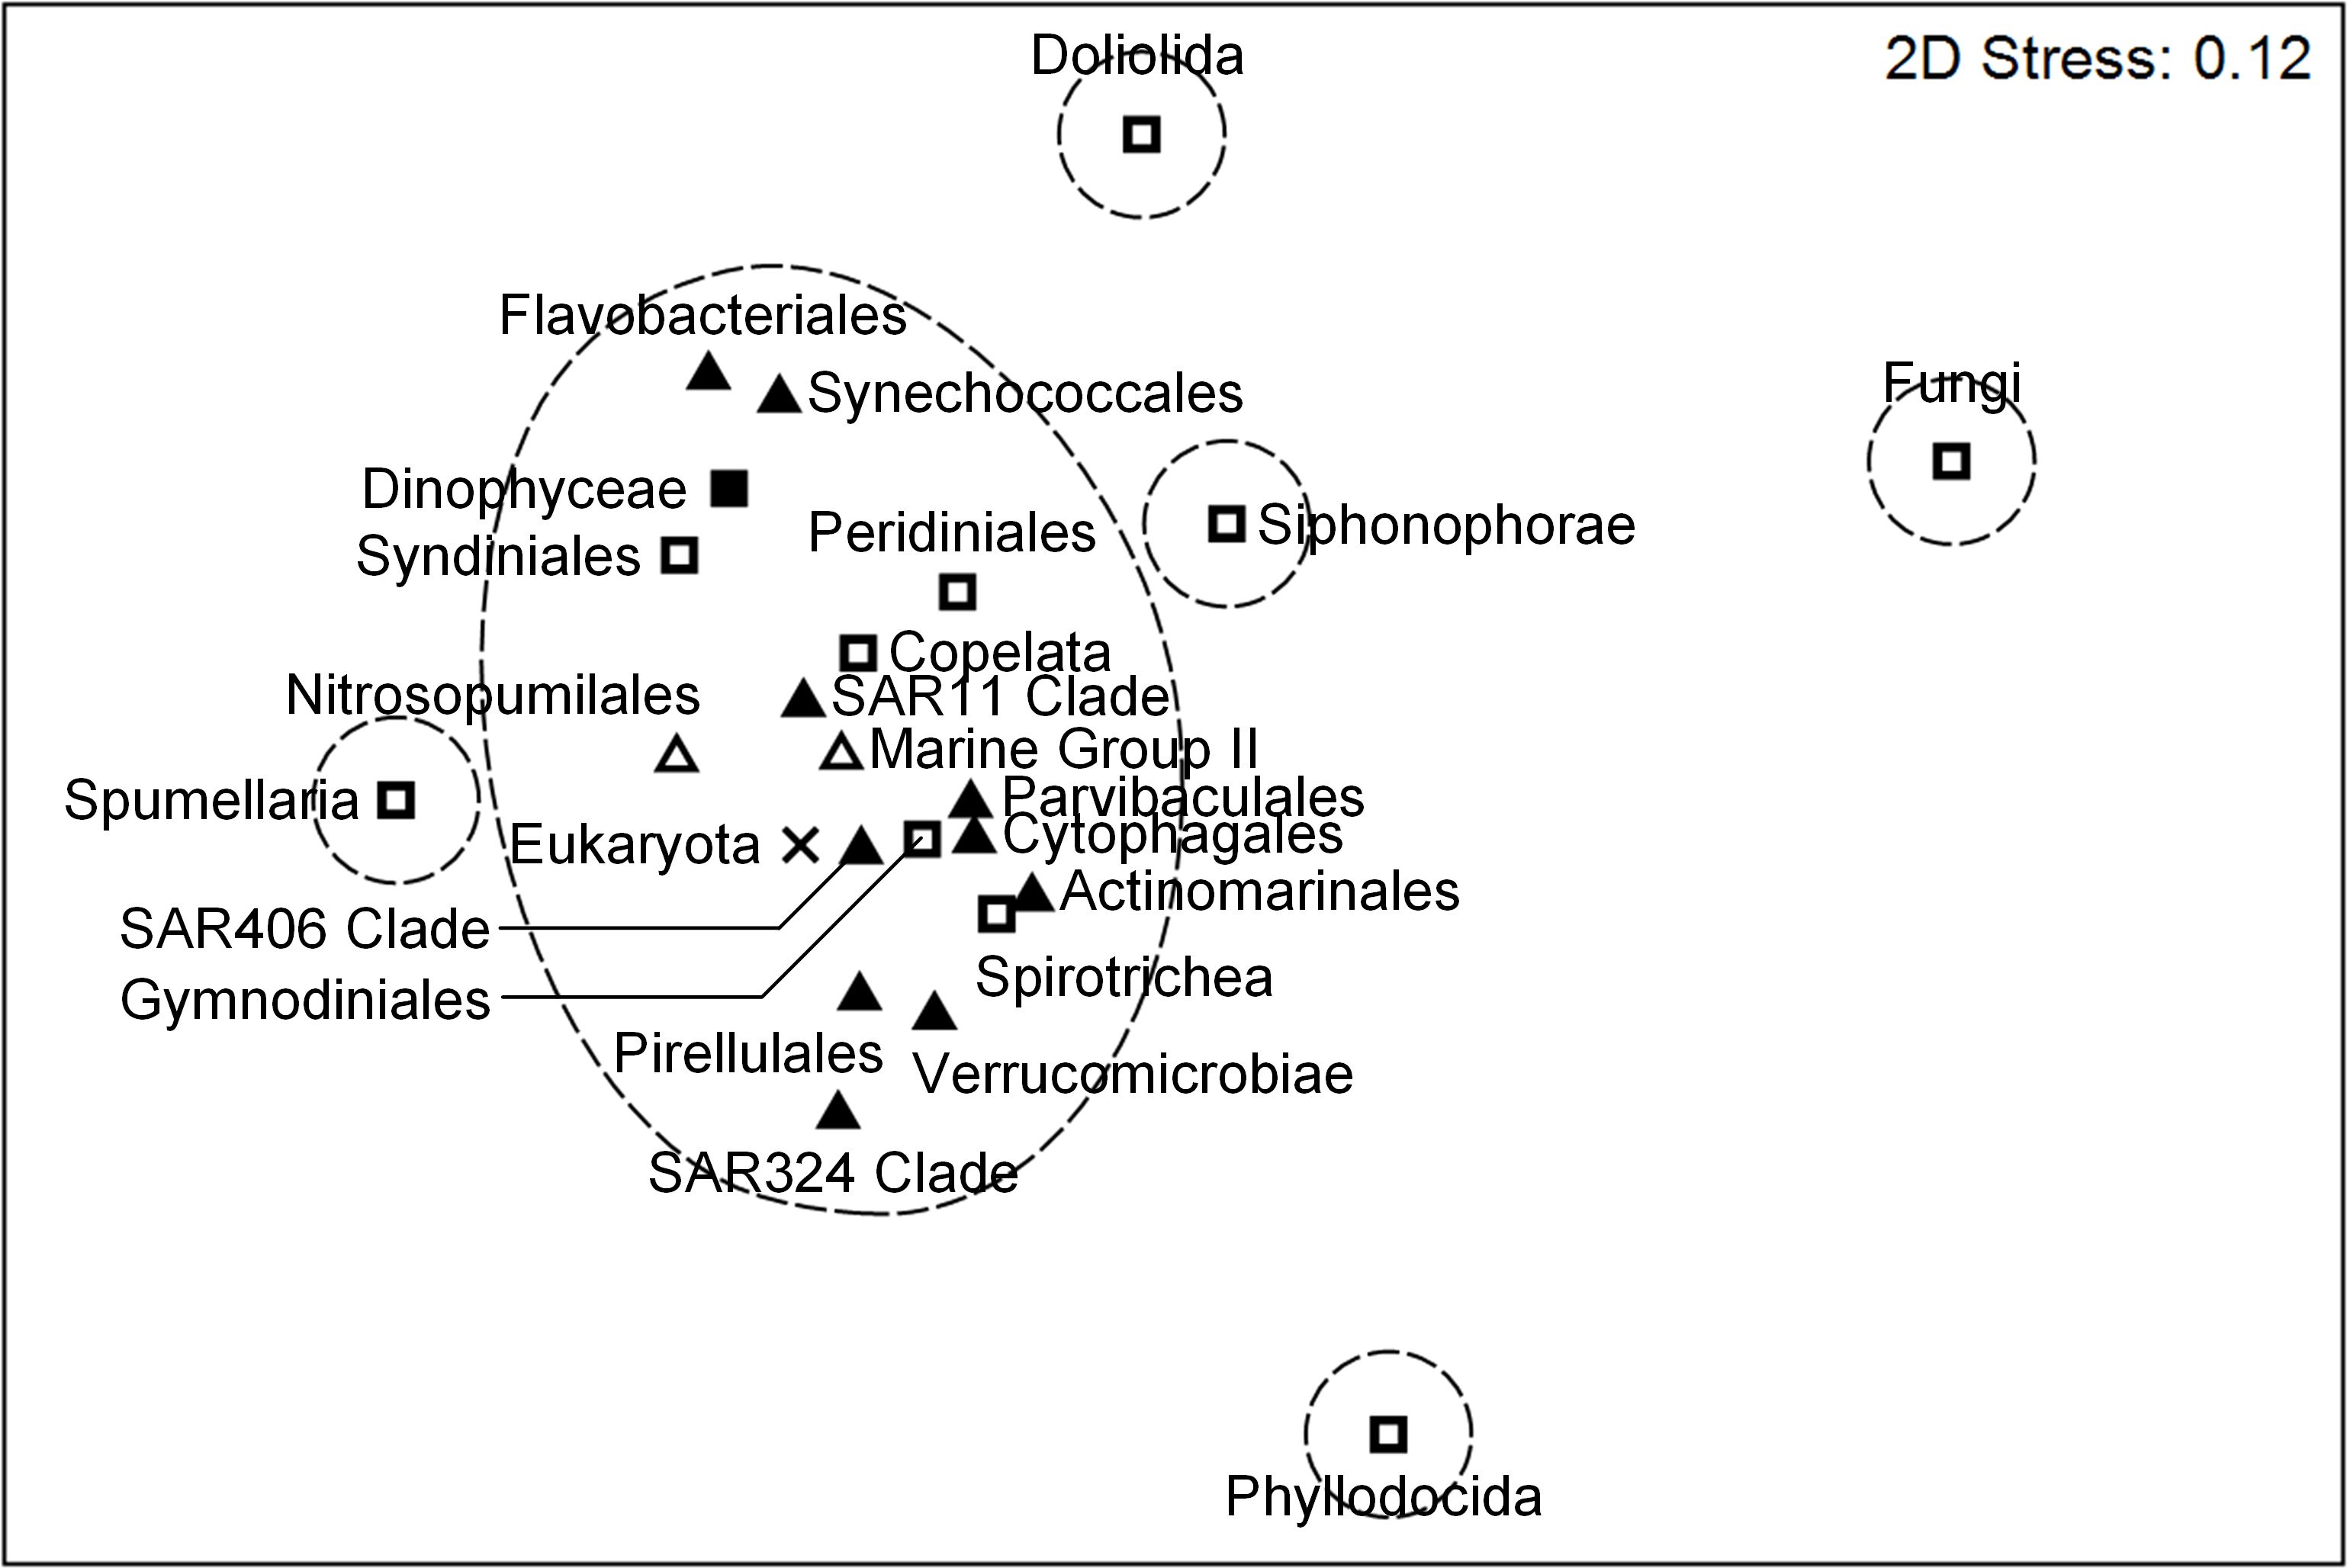
Figure 7. Non-metric multidimensional scaling (nMDS) analysis of the community structures of both prokaryotes and microbial eukaryotes, showing similarity distances among prokaryotic (bacteria ▲; archaea △) and eukaryotic (autotrophs ◼; heterotrophs and mixotrophs □; unclassified ×) taxa (the top 12 most abundant taxa of each community). Dashed lines indicate the similarity of 29% (see Supplementary Figure 3).
4 Discussion
4.1 Water column structure
This study showed the key characteristics of physical and biological environments in the subtropical Kuroshio region. For example, water temperature and salinity were low during each season with high chl. a concentration at shallower depths of Stations NA1 and 5–8 (Figure 2), which is typical of shelf water in the East China Sea affected by abundant river discharge (Lie and Cho, 2002). In the surface layer of Stations NA3 and T4 located at the edge of the Kuroshio Current, chl. a concentration showed high values during spring. Similarly, high phytoplankton abundance was found near the surface of the Kuroshio front due to the upward flux of nutrients caused by the enhanced turbulence (Kaneko et al., 2013). At deeper depths of Station T6, high chl. a concentration as well as low water temperature and salinity were observed probably because of the discharge of coastal water, as reported by Endo and Suzuki (2019).
The Kuroshio Current, which flows along the continental slope of the East China Sea, causes complex hydrodynamic processes in the subtropical Kuroshio region. Previous studies reported that the shoreward upwelling of offshore intermediate water occurred under the Kuroshio surface water due to steep topography (Chen et al., 1995; Ito et al., 1995). Thus, the observed changes in physical conditions and chl. a concentration (i.e. the decrease in water temperature and the irregular increase in salinity) during spring at deeper depths of Stations NA2 and T5 located on the Kuroshio Current (Figure 2) probably resulted from the intrusion of intermediate water from the open ocean. Furthermore, similar changes in these parameters were also observed at deeper depths of Stations 5–8 during autumn. This may have been because the shoreward upwelling reached the East China Sea and showed strong seasonality with maximum during autumn (Guo et al., 2006; Isobe, 2008; Wu et al., 2014). Interestingly, the different water masses during spring and autumn were reflected in the distinct structure of microbial communities at 150 m depth of Stations NA2 and T5 and at 100–150 m depths of Stations 5–8 consisting of taxa abundantly detected in intermediate waters (Table 1, Figure 4). These results indicate that high microbial diversity in the subtropical Kuroshio region is supported by the dynamic interplay of multiple water masses.
4.2 Prokaryotic community structure
Prokaryotes showed seasonally and vertically different community structures because prokaryotic communities were mainly grouped by seasons and depths (Table 1A, Figure 4A). During spring, Flavobacteriales dominated prokaryotic communities (Groups a–c). The dominance of Flavobacteriales is often associated with phytoplankton blooms (Buchan et al., 2014) as they efficiently utilize the high-molecular-weight organic compounds derived from phytoplankton (Teeling et al., 2012; Fernández-Gómez et al., 2013; Williams et al., 2013). Indeed, a significant positive correlation was observed between chl. a concentration and the relative abundance of Flavobacteriales throughout samples (r = 0.489, n = 65, p < 0.001) (Supplementary Figure 4A). In addition, Flavobacteria are known to have proteorhodopsins (PRs) functioning as the light-driven H+ pumps, and H+ gradient across membranes is used to produce energy via ATP synthases (Béjà et al., 2000; Yoshizawa et al., 2012). Gómez-Consarnau et al. (2007) proved the active photo-heterotrophic growth of the PR-containing Flavobacteria under light exposure, which is considered to support their prosperity in oligotrophic, subtropical environments. SAR11 clade, one of the most dominant bacteria in marine surface waters (Morris et al., 2002; Giovannoni, 2017), was also abundantly detected during spring (Group b). Similar to Flavobacteria, SAR11 clade members contain PRs, allowing them to sustain growth under the light and carbon-limited conditions (Giovannoni et al., 2005; Steindler et al., 2011).
During autumn when the water column was more stratified in the surface layer, different prokaryotic communities were observed between shallower and deeper depths, as reported by Treusch et al. (2009). Prokaryotic communities at 10–50 m depths were overwhelmingly dominated by Synechococcales during autumn (Group d) (Table 1A, Figure 4A), which are dominant primary producers in warm, oligotrophic environments (Agawin et al., 2000; Hirata et al., 2011) since smaller cells have higher surface-to-volume ratio and are more beneficial in nutrient uptake (Pasciak and Gavis, 1974; Kiørboe, 1993; Marañón, 2015). Laboratory experiments showed that the optimal growth temperature of marine Synechococcus was mostly between 21 °C and 28 °C (Moore et al., 1995; Mackey et al., 2013). The water temperature of samples classified into Group d was within this range (24.6–27.1 °C) (Supplementary Figure 5A), and water temperature was significantly positively correlated with the relative abundance of Synechococcales throughout samples (r = 0.804, n = 65, p < 0.001) (Supplementary Figure 4A). On the other hand, Nitrosopumilales, ammonia-oxidizing archaea (Qin et al., 2016), were abundant at 100–150 m depths during autumn and spring as well (Groups e and c, respectively) probably because ammonia oxidation is photo-inhibited in surface waters (Horak et al., 2018). These results correspond to the vertically stratified community structure of prokaryotes with a sharp transition around 50–100 m depths (DeLong et al., 2006; Mende et al., 2017). The present study indicates that prokaryotic communities are structured seasonally by physical and biological environments and vertically by water column stratification and light environments.
4.3 Eukaryotic community structure
Eukaryotic communities were mostly dominated by dinoflagellates (Dinophyceae, Syndiniales, and Peridiniales) (Groups A and C–E, 50 out of all 65 samples) (Table 1B, Figure 4B). Dinoflagellates are globally distributed in the epipelagic layer (Le Bescot et al., 2016) and known to dominate the subtropical region of the Western North Pacific Ocean (Zhang et al., 2018; Wu et al., 2020). Dinoflagellates are highly diverse in trophic strategies (Cohen et al., 2021). Although about half of marine dinoflagellate species are autotrophic or mixotrophic, the other half are heterotrophic (Gómez, 2012). Particularly, Syndiniales are parasitic and infect a wide range of hosts such as other dinoflagellates, ciliates, and radiolarians (Guillou et al., 2008; Anderson and Harvey, 2020; Käse et al., 2021). Syndiniales often dominate eukaryotic communities in various oceanic regions, which has been observed by recent 18S rDNA metabarcoding surveys (Clarke et al., 2019; Rizos et al., 2023; Anderson et al., 2024), and can regulate host populations (Chambouvet et al., 2008; Montagnes et al., 2008). The dominance and diverse trophic strategies of dinoflagellates suggest their important roles in the marine microbial food web.
Other dominant eukaryotic communities were largely different depending on depths. Copelata (Group B) and Doliolida (Group I) dominated eukaryotic communities locally but overwhelmingly at shallower depths (Table 1B, Figure 4B) where high chl. a concentration (0.57–1.05 µg L–1) was observed (Supplementary Figure 5B). These tunicates feed on biological particles including the pico-sized and nano-sized plankton through mucous filter-feeding (Deibel, 1998; Bone et al., 2003), which cannot be ingested efficiently by crustacean zooplankton (copepods). Appendicularian houses and doliolids are then grazed by copepods (Takahashi et al., 2013; Nishibe et al., 2015) and fish larvae and juveniles (Watanabe and Saito, 1998; Watanabe and Kawaguchi, 2003). Thus, Copelata and Doliolida probably proliferated in their favorable food environments and linked small primary producers and the early life stages of fish efficiently, supporting high fishery production in the subtropical Kuroshio region as the tunicate food chain (Okazaki et al., 2019). Nevertheless, although tunicates were identified around the region in plankton net samples (Kobari et al., 2018) and the gut contents of fish larvae and juveniles (Okazaki et al., 2019), the detailed information on their local distributions has been limited. The present study successfully captured the spatially heterogeneous distribution of eukaryotic communities in marine environments by applying eDNA metabarcoding analysis at horizontally and vertically high resolutions.
At deeper depths, Spumellaria were most dominant (Group H) (Table 1B, Figure 4B). A previous study reported that the class Polycystinea (include the order Spumellaria) was abundant exclusively in the deep layer (around 500 m depth) of the Eastern North Pacific Ocean (Schnetzer et al., 2011). This is consistent with the results of water column structure, indicating that the water mass of samples classified into Group H was derived from offshore intermediate water, as discussed above. Moreover, fungi were dominant at 100–150 m depths of Station T6 (Group F), which was probably affected by coastal water. Because fungal abundance decreased with increasing salinity in the Delaware River estuary (Burgaud et al., 2013) and increased with riverine input at a coastal time-series site of the Western English Channel (Taylor and Cunliffe, 2016), salinity may be important for the prosperity of fungi in the ocean. These results indicate that the intrusion of water masses brings microbial communities and increases biodiversity in an oceanic region.
4.4 Differences between prokaryotic and eukaryotic communities
The diversity of both prokaryotic and eukaryotic communities varied vertically. High diversity (both richness and Shannon index) of prokaryotic communities was observed in groups composed of samples at deeper depths (Table 1A, Figures 5A, C). Thus, when the diversity of all samples is compared by depth, prokaryotic diversity was significantly different between depths and higher at deeper depths (Supplementary Table 4, Supplementary Figures 6A, C). This is consistent with the vertical variation in epipelagic waters reported in previous studies and was probably due to adaptation to a wider range of ecological niches at deeper depths such as the particle-associated micro-environments (Sunagawa et al., 2015; Mende et al., 2017). In contrast, the obvious trend of eukaryotic diversity was not observed by comparison among groups (Figures 5B, D). In terms of vertical variation, the diversity of eukaryotic communities tended to be high at shallower depths, decrease at 100 m depth, and then increase at 150 m depth although significant difference was not found between depths (Supplementary Table 4, Supplementary Figures 6B, D). Schnetzer et al. (2011) investigated eukaryotic community structure at multiple depths (< 880 m) of the Eastern North Pacific and found high diversity at the surface (1.5 m) and middle depth (150 m). They pointed out that high diversity was supported by diverse autotrophic species at the surface and various niches with sharp environmental gradients including water temperature and particle concentration at middle depth. The vertical variations in diversity were different between prokaryotic and eukaryotic communities, which suggests their adaptation to different environmental conditions in the ocean.
Physical conditions and chl. a concentration affected the community structures of prokaryotes and microbial eukaryotes differently. The DistLM analysis showed that chl. a concentration (35.0%) and physical conditions (29.6%) accounted for most (64.6%) of the spatial and seasonal variances in prokaryotic community structure (Table 2). Thus, it is indicated that the supply of resources such as organic matter and nutrients by phytoplankton and the physical environments of water masses mainly structure prokaryotic communities. This finding is consistent with the correlation of prokaryotic community structure with water temperature on a global scale (Sunagawa et al., 2015) and with phytoplankton community structure in the southern California region (Needham and Fuhrman, 2016). On the other hand, for microbial eukaryotes, chl. a concentration exerted a major (24.7%) influence on community structure, but physical conditions had a minor (10.7%) effect. Compared to prokaryotes, the effect of physical conditions on the community structure of eukaryotes was much smaller. A recent study also reported that water temperature and salinity less explained the variability of eukaryotic community structure in the Chinese marginal seas (Wang et al., 2024). In coastal waters of South Africa, protistan community structure showed a stronger relationship with chl. a concentration (Holman et al., 2021) as observed in the present study. Although the relationship between chl. a concentration (a proxy for phytoplankton abundance) and the community structure of eukaryotes including phytoplankton may not be surprising, the major contribution of chl. a concentration to structuring eukaryotic communities can be partly attributed to the importance of food environments for heterotrophs such as heterotrophic dinoflagellates and tunicates. However, a large proportion (64.6%) of the variance in eukaryotic community structure remained unexplained, indicating that other factors not considered in this study were more important. For instance, Lima-Mendez et al. (2015) examined the co-occurrence patterns of microbial taxa in the euphotic layer globally and found the importance of biological interactions, especially parasitism, in structuring plankton communities. Parasitic interactions were probably common in the present study since parasitoids (e.g. Syndiniales) were detected abundantly (Figure 4B, Supplementary Figure 2B). Moreover, predatory interactions (Zhu et al., 2023) and inorganic nutrients (Wu et al., 2020; Sogawa et al., 2022) may have been important. These results suggest that different factors shape the structures of prokaryotic and eukaryotic communities and thus cause the different spatio-temporal variations in their community structures.
The comparison of distribution patterns among both prokaryotic and eukaryotic taxa suggests biological interactions and ecological roles in marine environments. Prokaryotic growth is generally dependent on materials derived from phytoplankton (Cole et al., 1988; Ducklow and Carlson, 1992), and phytoplankton abundance and community structure are highly affected by the activity of symbiotic prokaryotes (Needham and Fuhrman, 2016). Ciliates (Jonsson, 1986; Rassoulzadegan et al., 1988) and appendicularians (Scheinberg et al., 2005; Troedsson et al., 2007) mainly feed on the pico-sized and nanosized plankton. Thus, relatively similar distribution patterns were observed for prokaryotes, dinoflagellates, Spirotrichea, and Copelata (Figure 7) probably due to their symbiotic and trophic interactions. Furthermore, these taxa were common and detected to some extent in most samples (Supplementary Figure 2), which implicates their roles in maintaining the stable structure and functions of marine ecosystems. In contrast, the other heterotrophic eukaryotes (Siphonophorae, Spumellaria, Doliolida, Phyllodocida, and Fungi) exhibited distinct and unique distribution patterns, showing the horizontal and vertical heterogeneity of their distributions in epipelagic waters. For example, doliolids form dense patches sporadically in subtropical waters with abundant food availability and impact local food web structure greatly through their high feeding rate (Takahashi et al., 2015; Frischer et al., 2021). The sporadic and massive blooms of Doliolida at shallower depths of the edge of the Kuroshio Current (Figure 4B, Supplementary Figure 2B) coincided with high chl. a concentration (0.76–1.05 µg L–1) (Supplementary Figure 5B) and probably changed the structure of the microbial food web and energy transfer to higher trophic levels locally in their favorable environments due to active heterotrophy. The distinct distribution patterns of the heterotrophic eukaryotes may also have resulted from strong predatory relationships with other food sources and higher trophic levels not considered in this study. Warm-water species of Siphonophorae inhabiting the epipelagic layer, for instance, prey on copepods and fish (Mapstone, 2014; Damian-Serrano et al., 2021). These findings correspond to higher community stability of prokaryotes relative to eukaryotes under environmental disturbance (Wang et al., 2024) and more unique structure of eukaryotic communities compared to prokaryotes (Zhu et al., 2023). Different distribution patterns among prokaryotic and eukaryotic communities implicate the differences in their ecological roles in the ocean as well as their symbiotic and trophic interactions.
5 Conclusions
This study investigated prokaryotic and eukaryotic communities in the surface layer of the subtropical Kuroshio region during two seasons using the same samples and consistent methods and compared their relationships with environments and their distribution patterns. By applying eDNA metabarcoding analysis to a large number of seawater samples collected horizontally and vertically during spring and autumn, the spatial and seasonal distributions of highly diverse marine microbial communities across taxonomic and trophic levels were successfully captured. Physical conditions played a much more important role in driving the variation in the community structure of prokaryotes compared to microbial eukaryotes, and the phytoplankton-derived resources and food environments were important in structuring prokaryotic and eukaryotic communities, respectively. Prokaryotic and several eukaryotic taxa with putative symbiotic and trophic interactions showed relatively similar distribution patterns whereas other heterotrophic eukaryotes, which were sporadically and massively detected probably in their favorable environments for each community, exhibited distinct and unique distributions. Comparing these distribution patterns implicates their different ecological roles in marine environments. To examine potential biological interactions among prokaryotic and eukaryotic communities in more detail, it is essential to improve reference databases for higher taxonomic assignment, especially in tropical and subtropical waters where organisms are often highly diverse but present at low abundance (Chavez et al., 2021). In addition, future research should investigate the relationships of these microbial communities with higher trophic levels including metazoans and fish in the in situ oceanic environments. Enhancing the detection sensitivity and quantitative capacity of eDNA metabarcoding is required to address this challenge because eDNA concentration is typically low in the open ocean (Stat et al., 2017; Garcia-Vazquez et al., 2021). By integrating these approaches, eDNA metabarcoding studies can provide deeper insights into the complex dynamics of marine communities and their roles in marine ecosystems.
Data availability statement
The datasets presented in this study can be found in online repositories. The names of the repository/repositories and accession number(s) can be found below: https://www.ddbj.nig.ac.jp/, PRJDB19670.
Author contributions
YS: Data curation, Writing – original draft, Conceptualization, Investigation, Formal Analysis, Writing – review & editing. MU: Data curation, Writing – original draft, Formal Analysis, Writing – review & editing. JH: Data curation, Project administration, Writing – review & editing. MH-T: Data curation, Investigation, Writing – review & editing. TF: Writing – review & editing, Investigation, Data curation. MT: Investigation, Data curation, Writing – review & editing. KM: Investigation, Writing – review & editing, Data curation. HF: Writing – review & editing, Data curation, Investigation. HS: Investigation, Writing – review & editing, Data curation. KH: Project administration, Writing – review & editing. SH: Project administration, Writing – review & editing, Funding acquisition. SY: Conceptualization, Data curation, Project administration, Funding acquisition, Writing – original draft, Investigation, Formal Analysis, Writing – review & editing.
Funding
The author(s) declare financial support was received for the research and/or publication of this article. This study was supported by OceanDNA Project (No. 027) from UTokyo Future Society Initiative and the Interdisciplinary Collaborative Research Program (1-B) of Atmosphere and Ocean Research Institute, The University of Tokyo. This work was also supported by Bilateral Program (No. JPJSBP120217403) and Grant-in-Aid for Scientific Research (A) (No. 22H00557) from the Japan Society for the Promotion of Science.
Acknowledgments
This study was supported by the Cooperative Research Program of Atmosphere and Ocean Research Institute, The University of Tokyo (R/V Hakuho-Maru, JURCAOSSHN21–05 and Shinsei-Maru, JURCAOSS22-21). We appreciate the captains, crews, and all members of the research cruises for their support in field investigation.
Conflict of interest
The authors declare that the research was conducted in the absence of any commercial or financial relationships that could be construed as a potential conflict of interest.
The author(s) declared that they were an editorial board member of Frontiers, at the time of submission. This had no impact on the peer review process and the final decision.
Generative AI statement
The author(s) declare that no Generative AI was used in the creation of this manuscript.
Any alternative text (alt text) provided alongside figures in this article has been generated by Frontiers with the support of artificial intelligence and reasonable efforts have been made to ensure accuracy, including review by the authors wherever possible. If you identify any issues, please contact us.
Publisher’s note
All claims expressed in this article are solely those of the authors and do not necessarily represent those of their affiliated organizations, or those of the publisher, the editors and the reviewers. Any product that may be evaluated in this article, or claim that may be made by its manufacturer, is not guaranteed or endorsed by the publisher.
Supplementary material
The Supplementary Material for this article can be found online at: https://www.frontiersin.org/articles/10.3389/fmars.2025.1656531/full#supplementary-material
References
Abad D., Albaina A., Aguirre M., Laza-Martínez A., Uriarte I., Iriarte A., et al. (2016). Is metabarcoding suitable for estuarine plankton monitoring? A comparative study with microscopy. Mar. Biol. 163, 1–13. doi: 10.1007/s00227-016-2920-0
Agawin N. S. R., Duarte C. M., and Agustí S. (2000). Nutrient and temperature control of the contribution of picoplankton to phytoplankton biomass and production. Limnol. Oceanogr. 45, 591–600. doi: 10.4319/lo.2000.45.3.0591
Anderson S. R., Blanco-Bercial L., Carlson C. A., and Harvey E. L. (2024). Role of Syndiniales parasites in depth-specific networks and carbon flux in the oligotrophic ocean. ISME Commun. 4, ycae014. doi: 10.1093/ismeco/ycae014
Anderson M. J., Gorley R. N., and Clarke K. R. (2008). PERMANOVA+ for PRIMER: Guide to Software and Statistical Methods (Plymouth: PRIMER-e).
Anderson S. R. and Harvey E. L. (2020). Temporal variability and ecological interactions of parasitic marine Syndiniales in coastal protist communities. mSphere 5, 00209–00220. doi: 10.1128/msphere.00209-20
Arandia-Gorostidi N., Krabberød A. K., Logares R., Deutschmann I. M., Scharek R., Morán X. A. G., et al. (2022). Novel interactions between phytoplankton and bacteria shape microbial seasonal dynamics in coastal ocean waters. Front. Mar. Sci. 9. doi: 10.3389/fmars.2022.901201
Azam F., Fenchel T., Field J. G., Gray J. S., Meyer-Reil L. A., and Thingstad F. (1983). The ecological role of water-column microbes in the sea. Mar. Ecol. Prog. Ser. 10, 257–263. doi: 10.3354/meps010257
Baird M. E. and Suthers I. M. (2007). A size-resolved pelagic ecosystem model. Ecol. Model. 203, 185–203. doi: 10.1016/j.ecolmodel.2006.11.025
Béjà O., Aravind L., Koonin E. V., Suzuki M. T., Hadd A., Nguyen L. P., et al. (2000). Bacterial rhodopsin: Evidence for a new type of phototrophy in the sea. Science 289, 1902–1906. doi: 10.1126/science.289.5486.1902
Bolyen E., Rideout J. R., Dillon M. R., Bokulich N. A., Abnet C. C., Al-Ghalith G. A., et al. (2019). Reproducible, interactive, scalable and extensible microbiome data science using QIIME 2. Nat. Biotechnol. 37, 852–857. doi: 10.1038/s41587-019-0209-9
Bone Q., Carré C., and Chang P. (2003). Tunicate feeding filters. J. Mar. Biol. Assoc. UK 83, 907–919. doi: 10.1017/S002531540300804Xh
Buchan A., LeCleir G. R., Gulvik C. A., and González J. M. (2014). Master recyclers: Features and functions of bacteria associated with phytoplankton blooms. Nat. Rev. Microbiol. 12, 686–698. doi: 10.1038/nrmicro3326
Burgaud G., Woehlke S., Rédou V., Orsi W., Beaudoin D., Barbier G., et al. (2013). Deciphering the presence and activity of fungal communities in marine sediments using a model estuarine system. Aquat. Microb. Ecol. 70, 45–62. doi: 10.3354/ame01638
Callahan B. J., McMurdie P. J., Rosen M. J., Han A. W., Johnson A. J., and Holmes S. P. (2016). DADA2: High-resolution sample inference from Illumina amplicon data. Nat. Methods 13, 581–583. doi: 10.1038/nmeth.3869
Chambouvet A., Morin P., Marie D., and Guillou L. (2008). Control of toxic marine dinoflagellate blooms by serial parasitic killers. Science 322, 1254–1257. doi: 10.1126/science.1164387
Chavez F. P., Min M., Pitz K., Truelove N., Baker J., LaScala-Grunewald D., et al. (2021). Observing life in the sea using environmental DNA. Oceanogr. 34, 102–119. doi: 10.5670/oceanog.2021.218
Chen C. T. A., Ruo R., Paid S. C., Liu C. T., and Wong G. T. F. (1995). Exchange of water masses between the East China Sea and the Kuroshio off northeastern Taiwan. Cont. Shelf Res. 15, 19–39. doi: 10.1016/0278-4343(93)E0001-O
Clarke L. J., Bestley S., Bissett A., and Deagle B. E. (2019). A globally distributed Syndiniales parasite dominates the Southern Ocean micro-eukaryote community near the sea-ice edge. ISME J. 13, 734–737. doi: 10.1038/s41396-018-0306-7
Cohen N. R., McIlvin M. R., Moran D. M., Held N. A., Saunders J. K., Hawco N. J., et al. (2021). Dinoflagellates alter their carbon and nutrient metabolic strategies across environmental gradients in the central Pacific Ocean. Nat. Microbiol. 6, 173–186. doi: 10.1038/s41564-020-00814-7
Cole J. J., Findlay S., and Pace M. L. (1988). Bacterial production in fresh and saltwater ecosystem: A cross-system overview. Mar. Ecol. Prog. Ser. 43, 1–10. doi: 10.3354/meps043001
Comeau A. M., Li W. K., Tremblay J.É., Carmack E. C., and Lovejoy C. (2011). Arctic Ocean microbial community structure before and after the 2007 record sea ice minimum. PLoS One 6, e27492. doi: 10.1371/journal.pone.0027492
Damian-Serrano A., Haddock S. H., and Dunn C. W. (2021). The evolution of siphonophore tentilla for specialized prey capture in the open ocean. P. Natl. Acad. Sci. 118, e2005063118. doi: 10.1073/pnas.2005063118
Deibel D. (1998). “The abundance, distribution, and ecological impact of doliolids,” in The Biology of Pelagic Tunicates. Ed. Bone Q. (Oxford University Press, Oxford), 171–186.
DeLong E. F., Preston C. M., Mincer T., Rich V., Hallam S. J., Frigaard N. U., et al. (2006). Community genomics among stratified microbial assemblages in the ocean’s interior. Science 311, 496–503. doi: 10.1126/science.1120250
de Vargas C., Audic S., Henry N., Decelle J., Mahé F., Logares R., et al. (2015). Eukaryotic plankton diversity in the sunlit ocean. Science 348, 1261605. doi: 10.1126/science.1261605
Djurhuus A., Closek C. J., Kelly R. P., Pitz K. J., Michisaki R. P., Starks H. A., et al. (2020). Environmental DNA reveals seasonal shifts and potential interactions in a marine community. Nat. Commun. 11, 1–9. doi: 10.1038/s41467-019-14105-1
Djurhuus A., Pitz K., Sawaya N. A., Rojas-Márquez J., Michaud B., Montes E., et al. (2018). Evaluation of marine zooplankton community structure through environmental DNA metabarcoding. Limnol. Oceanogr. Methods 16, 209–221. doi: 10.1002/lom3.10237
Ducklow H. W. and Carlson C. A. (1992). Oceanic bacterial production. Adv. Microb. Ecol. 12, 113–181. doi: 10.1007/978-1-4684-7609-5_3
Endo H. and Suzuki K. (2019). “Spatial variations in community structure of haptophytes across the Kuroshio front in the Tokara Strait,” in Kuroshio Current: Physical, Biogeochemical, and Ecosystem Dynamics. Eds. Nagai T., Saito H., Suzuki K., and Takahashi M. (Wiley, Hoboken), 207–221.
Endo H., Umezawa Y., Takeda S., and Suzuki K. (2023). Haptophyte communities along the Kuroshio current reveal their geographical sources and ecological traits. Mol. Ecol. 32, 110–123. doi: 10.1111/mec.16734
Fernández-Gómez B., Richter M., Schüler M., Pinhassi J., Acinas S. G., González J. M., et al. (2013). Ecology of marine Bacteroidetes: A comparative genomics approach. ISME J. 7, 1026–1037. doi: 10.1038/ismej.2012.169
Frischer M. E., Lamboley L. M., Walters T. L., Brandes J. A., Arneson E., Lacy L. E., et al. (2021). Selective feeding and linkages to the microbial food web by the doliolid Dolioletta gegenbauri. Limnol. Oceanogr. 66, 1993–2010. doi: 10.1002/lno.11740
Garcia-Vazquez E., Georges O., Fernandez S., and Ardura A. (2021). eDNA metabarcoding of small plankton samples to detect fish larvae and their preys from Atlantic and Pacific waters. Sci. Rep. 11, 7224. doi: 10.1038/s41598-021-86731-z
Ghiglione J. F., Galand P. E., Pommier T., Pedrós-Alió C., Maas E. W., Bakker K., et al. (2012). Pole-to-pole biogeography of surface and deep marine bacterial communities. P. Natl. Acad. Sci. 109, 17633–17638. doi: 10.1073/pnas.1208160109
Giovannoni S. J. (2017). SAR11 bacteria: The most abundant plankton in the oceans. Annu. Rev. Mar. Sci. 9, 231–255. doi: 10.1146/annurev-marine-010814-015934
Giovannoni S. J., Bibbs L., Cho J. C., Stapels M. D., Desiderio R., Vergin K. L., et al. (2005). Proteorhodopsin in the ubiquitous marine bacterium SAR11. Nature 438, 82–85. doi: 10.1038/nature04032
Glibert P. M. and Mitra A. (2022). From webs, loops, shunts, and pumps to microbial multitasking: Evolving concepts of marine microbial ecology, the mixoplankton paradigm, and implications for a future ocean. Limnol. Oceanogr. 67, 585–597. doi: 10.1002/lno.12018
Gómez F. (2012). A quantitative review of the lifestyle, habitat and trophic diversity of dinoflagellates (Dinoflagellata, Alveolata). Syst. Biodivers. 10, 267–275. doi: 10.1080/14772000.2012.721021
Gómez-Consarnau L., González J. M., Coll-Lladó M., Gourdon P., Pascher T., Neutze R., et al. (2007). Light stimulates growth of proteorhodopsin-containing marine Flavobacteria. Nature 445, 210–213. doi: 10.1038/nature05381
Guillou L., Viprey M., Chambouvet A., Welsh R. M., Kirkham A. R., Massana R., et al. (2008). Widespread occurrence and genetic diversity of marine parasitoids belonging to Syndiniales (Alveolata). Environ. Microbiol. 10, 3349–3365. doi: 10.1111/j.1462-2920.2008.01731.x
Guo X., Miyazawa Y., and Yamagata T. (2006). The Kuroshio onshore intrusion along the shelf break of the East China Sea: The origin of the Tsushima Warm Current. J. Phys. Oceanogr. 36, 2205–2231. doi: 10.1175/JPO2976.1
Harzi A. M., Tackx M., Daro M. H., Kesaulia I., Caturao R., and Podoor N. (1998). Winter distribution of phytoplankton and zooplankton around some sandbanks of the Belgian coastal zone. J. Plankton Res. 20, 2031–2052. doi: 10.1093/plankt/20.11.2031
Hirai J., Kuriyama M., Ichikawa T., Hidaka K., and Tsuda A. (2015). A metagenetic approach for revealing community structure of marine planktonic copepods. Mol. Ecol. Resour. 15, 68–80. doi: 10.1111/1755-0998.12294
Hirata T., Hardman-Mountford N. J., Brewin R. J. W., Aiken J., Barlow R., Suzuki K., et al. (2011). Synoptic relationships between surface Chlorophyll-a and diagnostic pigments specific to phytoplankton functional types. Biogeosciences 8, 311–327. doi: 10.5194/bg-8-311-2011
Holman L. E., De Bruyn M., Creer S., Carvalho G., Robidart J., and Rius M. (2021). Animals, protists and bacteria share marine biogeographic patterns. Nat. Ecol. Evol. 5, 738–746. doi: 10.1038/s41559-021-01439-7
Horak R. E., Qin W., Bertagnolli A. D., Nelson A., Heal K. R., Han H., et al. (2018). Relative impacts of light, temperature, and reactive oxygen on thaumarchaeal ammonia oxidation in the North Pacific Ocean. Limnol. Oceanogr. 63, 741–757. doi: 10.1002/lno.10665
Isobe A. (2008). Recent advances in ocean-circulation research on the Yellow Sea and East China Sea shelves. J. Oceanogr. 64, 569–584. doi: 10.1007/s10872-008-0048-7
Ito T., Kaneko A., Furukawa H., Gohda N., and Koterayama W. (1995). A structure of the Kuroshio and its related upwelling on the East China Sea shelf slope. J. Oceanogr. 51, 267–278. doi: 10.1007/BF02285165
Jonsson P. R. (1986). Particle size selection, feeding rates and growth dynamics of marine planktonic oligotrichous ciliates (Ciliophora: OligotriChina). Mar. Ecol. Prog. Ser. 33, 265–277. doi: 10.3354/meps033265
Joye S. B., Bowles M. W., and Ziervogel K. (2022). “Marine biogeochemical cycles,” in The Marine Microbiome. Eds. Stal L. J. and Cretoiu M. S. (Springer, Cham), 623–671.
Kaneko H., Yasuda I., Komatsu K., and Itoh S. (2013). Observations of vertical turbulent nitrate flux across the Kuroshio. Geophys. Res. Lett. 40, 3123–3127. doi: 10.1002/grl.50613
Käse L., Metfies K., Neuhaus S., Boersma M., Wiltshire K. H., and Kraberg A. C. (2021). Host-parasitoid associations in marine planktonic time series: Can metabarcoding help reveal them? PLoS One 16, e0244817. doi: 10.1371/journal.pone.0244817
Kiørboe T. (1993). Turbulence, phytoplankton cell size, and the structure of pelagic food webs. Adv. Mar. Biol. 29, 1–72. doi: 10.1016/S0065-2881(08)60129-7
Kiørboe T. (2024). Predation in a microbial world: Mechanisms and trade-offs of flagellate foraging. Annu. Rev. Mar. Sci. 16, 361–381. doi: 10.1146/annurev-marine-020123-102001
Kobari T., Makihara W., Kawaguchi T., Sato K., and Kume G. (2018). Geographic variability in taxonomic composition, standing stock, and productivity of the mesozooplankton community around the Kuroshio Current in the East China Sea. Fish. Oceanogr. 27, 336–350. doi: 10.1111/fog.12256
Le Bescot N., Mahé F., Audic S., Dimier C., Garet M. J., Poulain J., et al. (2016). Global patterns of pelagic dinoflagellate diversity across protist size classes unveiled by metabarcoding. Environ. Microbiol. 18, 609–626. doi: 10.1111/1462-2920.13039
Levine N. M., Alexander H., Bertrand E. M., Coles V. J., Dutkiewicz S., Leles S. G., et al. (2025). Microbial ecology to ocean carbon cycling: From genomes to numerical models. Annu. Rev. Earth Planet. Sci. 53, 595–624. doi: 10.1146/annurev-earth-040523-020630
Levinsen H., Nielsen T. G., and Hansen B. W. (1999). Plankton community structure and carbon cycling on the western coast of Greenland during the stratified summer situation. II. Heterotrophic dinoflagellates and ciliates. Aquat. Microb. Ecol. 16, 217–232. doi: 10.3354/ame016217
Lie H. J. and Cho C. H. (2002). Recent advances in understanding the circulation and hydrography of the East China Sea. Fish. Oceanogr. 11, 318–328. doi: 10.1046/j.1365-2419.2002.00215.x
Lima-Mendez G., Faust K., Henry N., Decelle J., Colin S., Carcillo F., et al. (2015). Determinants of community structure in the global plankton interactome. Science 348, 1262073. doi: 10.1126/science.1262073
Lindeque P. K., Parry H. E., Harmer R. A., Somerfield P. J., and Atkinson A. (2013). Next generation sequencing reveals the hidden diversity of zooplankton assemblages. PLoS One 8, e81327. doi: 10.1371/journal.pone.0081327
Liu A. C. H., Chang F. H., Yang J. W., Saito H., Umezawa Y., Chen C. C., et al. (2022). Free-living marine bacterioplankton composition and diversity along the Kuroshio region. Deep-Sea Res. I 183, 103741. doi: 10.1016/j.dsr.2022.103741
Logares R., Deutschmann I. M., Junger P. C., Giner C. R., Krabberød A. K., Schmidt T. S. B., et al. (2020). Disentangling the mechanisms shaping the surface ocean microbiota. Microbiome 8, 1–17. doi: 10.1186/s40168-020-00827-8
Mackey K. R. M., Paytan A., Caldeira K., Grossman A. R., Moran D., McIlvin M., et al. (2013). Effect of temperature on photosynthesis and growth in marine Synechococcus spp. Plant Physiol. 163, 815–829. doi: 10.1104/pp.113.221937
Mapstone G. M. (2014). Global diversity and review of Siphonophorae (Cnidaria: Hydrozoa). PLoS One 9, e87737. doi: 10.1371/journal.pone.0087737
Marañón E. (2015). Cell size as a key determinant of phytoplankton metabolism and community structure. Annu. Rev. Mar. Sci. 7, 241–264. doi: 10.1146/annurev-marine-010814-015955
Mende D. R., Bryant J. A., Aylward F. O., Eppley J. M., Nielsen T., Karl D. M., et al. (2017). Environmental drivers of a microbial genomic transition zone in the ocean’s interior. Nat. Microbiol. 2, 1367–1373. doi: 10.1038/s41564-017-0008-3
Mitra A., Caron D. A., Faure E., Flynn K. J., Leles S. G., Hansen P. J., et al. (2023). The Mixoplankton Database (MDB): Diversity of photo-phago-trophic plankton in form, function, and distribution across the global ocean. J. Eukaryotic Microbiol. 70, e12972. doi: 10.1111/jeu.12972
Montagnes D. J., Chambouvet A., Guillou L., and Fenton A. (2008). Responsibility of microzooplankton and parasite pressure for the demise of toxic dinoflagellate blooms. Aquat. Microb. Ecol. 53, 211–225. doi: 10.3354/ame01245
Moore L. R., Goericke R., and Chisholm S. W. (1995). Comparative physiology of Synechococcus and Prochlorococcus: Influence of light and temperature on growth, pigments, fluorescence and absorptive properties. Mar. Ecol. Prog. Ser. 116, 259–275. doi: 10.3354/meps116259
Morris R. M., Rappé M. S., Connon S. A., Vergin K. L., Siebold W. A., Carlson C. A., et al. (2002). SAR11 clade dominates ocean surface bacterioplankton communities. Nature 420, 806–810. doi: 10.1038/nature01240
Needham D. M. and Fuhrman J. A. (2016). Pronounced daily succession of phytoplankton, archaea and bacteria following a spring bloom. Nat. Microbiol. 1, 1–7. doi: 10.1038/nmicrobiol.2016.5
Nishibe Y., Takahashi K., Ichikawa T., Hidaka K., Kurogi H., Segawa K., et al. (2015). Degradation of discarded appendicularian houses by oncaeid copepods. Limnol. Oceanogr. 60, 967–976. doi: 10.1002/lno.10061
Okazaki Y., Miyamoto H., Suzuki K., Saito H., Hidaka K., and Ichikawa T. (2019). “Diverse trophic pathways from zooplankton to larval and juvenile fishes in the Kuroshio ecosystem,” in Kuroshio Current: Physical, Biogeochemical, and Ecosystem Dynamics. Eds. Nagai T., Saito H., Suzuki K., and Takahashi M. (Wiley, Hoboken), 245–256.
Parada A. E., Needham D. M., and Fuhrman J. A. (2016). Every base matters: Assessing small subunit rRNA primers for marine microbiomes with mock communities, time series and global field samples. Environ. Microbiol. 18, 1403–1414. doi: 10.1111/1462-2920.13023
Pasciak W. J. and Gavis J. (1974). Transport limitation of nutrient uptake in phytoplankton. Limnol. Oceanogr. 19, 881–888. doi: 10.4319/lo.1974.19.6.0881
Qin W., Martens-Habbena W., Kobelt J. N., and Stahl D. A. (2016). “Candidatus nitrosopumilales,” in Bergey’s Manual of Systematics of Archaea and Bacteria. Eds. Trujillo M. E., Dedysh S., DeVos P., Hedlund B., Kämpfer P., Rainey F. A., and Whitman W. B. (Wiley, New York), 1–2.
Quince C., Lanzen A., Davenport R. J., and Turnbaugh P. J. (2011). Removing noise from pyrosequenced amplicons. BMC Bioinf. 12, 1–18. doi: 10.1186/1471-2105-12-38
Rassoulzadegan F., Laval-Peuto M., and Sheldon R. W. (1988). Partitioning of the food ration of marine ciliates between pico-and nanoplankton. Hydrobiologia 159, 75–88. doi: 10.1007/BF00007369
Rizos I., Debeljak P., Finet T., Klein D., Ayata S. D., Not F., et al. (2023). Beyond the limits of the unassigned protist microbiome: Inferring large-scale spatio-temporal patterns of Syndiniales marine parasites. ISME Commun. 3, 16. doi: 10.1038/s43705-022-00203-7
Ruppert K. M., Kline R. J., and Rahman M. S. (2019). Past, present, and future perspectives of environmental DNA (eDNA) metabarcoding: A systematic review in methods, monitoring, and applications of global eDNA. Global Ecol. Conserv. 17, e00547. doi: 10.1016/j.gecco.2019.e00547
Saito H. (2019). “The Kuroshio: Its recognition, scientific activities and emerging issues,” in Kuroshio Current: Physical, Biogeochemical, and Ecosystem Dynamics. Eds. Nagai T., Saito H., Suzuki K., and Takahashi M. (Wiley, Hoboken), 3–11.
Sawaya N. A., Djurhuus A., Closek C. J., Hepner M., Olesin E., Visser L., et al. (2019). Assessing eukaryotic biodiversity in the Florida Keys National Marine Sanctuary through environmental DNA metabarcoding. Ecol. Evol. 9, 1029–1040. doi: 10.1002/ece3.4742
Scheinberg R. D., Landry M. R., and Calbet A. (2005). Grazing of two common appendicularians on the natural prey assemblage of a tropical coastal ecosystem. Mar. Ecol. Prog. Ser. 294, 201–212. doi: 10.3354/meps294201
Schnetzer A., Moorthi S. D., Countway P. D., Gast R. J., Gilg I. C., and Caron D. A. (2011). Depth matters: Microbial eukaryote diversity and community structure in the eastern North Pacific revealed through environmental gene libraries. Deep-Sea Res. I 58, 16–26. doi: 10.1016/j.dsr.2010.10.003
Sildever S., Nishi N., Tazawa S., Kasai H., Hirai J., Shiomoto A., et al. (2023). Eight years of weekly eDNA monitoring in the North-Western Pacific. Environ. DNA 5, 1202–1215. doi: 10.1002/edn3.452
Sogawa S., Tsuchiya K., Nagai S., Shimode S., and Kuwahara V. S. (2022). Annual dynamics of eukaryotic and bacterial communities revealed by 18S and 16S rRNA metabarcoding in the coastal ecosystem of Sagami Bay, Japan. Metabarcoding Metagenomics 6, e78181. doi: 10.3897/mbmg.6.78181
Sogin M. L., Morrison H. G., Huber J. A., Welch D. M., Huse S. M., Neal P. R., et al. (2006). Microbial diversity in the deep sea and the underexplored “rare biosphere. P. Natl. Acad. Sci. 103, 12115–12120. doi: 10.1073/pnas.0605127103
Stat M., Huggett M. J., Bernasconi R., DiBattista J. D., Berry T. E., Newman S. J., et al. (2017). Ecosystem biomonitoring with eDNA: Metabarcoding across the tree of life in a tropical marine environment. Sci. Rep. 7, 12240. doi: 10.1038/s41598-017-12501-5
Steindler L., Schwalbach M. S., Smith D. P., Chan F., and Giovannoni S. J. (2011). Energy starved Candidatus Pelagibacter ubique substitutes light-mediated ATP production for endogenous carbon respiration. PLoS One 6, e19725. doi: 10.1371/journal.pone.0019725
Sunagawa S., Coelho L. P., Chaffron S., Kultima J. R., Labadie K., Salazar G., et al. (2015). Structure and function of the global ocean microbiome. Science 348, 1261359. doi: 10.1126/science.1261359
Suzuki R. and Ishimaru T. (1990). An improved method for the determination of phytoplankton chlorophyll using N,N-dimethylformamide. J. Oceanogr. 46, 190–194. doi: 10.1007/BF02125580
Taberlet P., Coissac E., Pompanon F., Brochmann C., and Willerslev E. (2012). Towards next-generation biodiversity assessment using DNA metabarcoding. Mol. Ecol. 21, 2045–2050. doi: 10.1111/j.1365-294X.2012.05470.x
Takahashi K., Ichikawa T., Fukugama C., Yamane M., Kakehi S., Okazaki Y., et al. (2015). In situ observations of a doliolid bloom in a warm water filament using a video plankton recorder: Bloom development, fate, and effect on biogeochemical cycles and planktonic food webs. Limnol. Oceanogr. 60, 1763–1780. doi: 10.1002/lno.10133
Takahashi K., Ichikawa T., Saito H., Kakehi S., Sugimoto Y., Hidaka K., et al. (2013). Sapphirinid copepods as predators of doliolids: Their role in doliolid mortality and sinking flux. Limnol. Oceanogr. 58, 1972–1984. doi: 10.4319/lo.2013.58.6.1972
Takasuka A., Kuroda H., Okunishi T., Shimizu Y., Hirota Y., Kubota H., et al. (2014). Occurrence and density of Pacific saury Cololabis saira larvae and juveniles in relation to environmental factors during the winter spawning season in the Kuroshio Current system. Fish. Oceanogr. 23, 304–321. doi: 10.1111/fog.12065
Taylor J. D. and Cunliffe M. (2016). Multi-year assessment of coastal planktonic fungi reveals environmental drivers of diversity and abundance. ISME J. 10, 2118–2128. doi: 10.1038/ismej.2016.24
Teeling H., Fuchs B. M., Becher D., Klockow C., Gardebrecht A., Bennke C. M., et al. (2012). Substrate-controlled succession of marine bacterioplankton populations induced by a phytoplankton bloom. Science 336, 608–611. doi: 10.1126/science.1218344
Treusch A. H., Vergin K. L., Finlay L. A., Donatz M. G., Burton R. M., Carlson C. A., et al. (2009). Seasonality and vertical structure of microbial communities in an ocean gyre. ISME J. 3, 1148–1163. doi: 10.1038/ismej.2009.60
Troedsson C. M., Frischeret E., Nejstgaard J. C., and Thompson E. M. (2007). Molecular quantification of differential ingestion and particle trapping rates by the appendicularian Oikopleura dioica as a function of prey size and shape. Limnol. Oceanogr. 52, 416–427. doi: 10.4319/lo.2007.52.1.0416
Truelove N. K., Patin N. V., Min M., Pitz K. J., Preston C. M., and Yamahara K. M. (2022). Expanding the temporal and spatial scales of environmental DNA research with autonomous sampling. Environ. DNA 4, 972–984. doi: 10.1002/edn3.299
Ushio M., Furukawa S., Murakami H., Masuda R., and Nagano A. J. (2022). An efficient early-pooling protocol for environmental DNA metabarcoding. Environ. DNA 4, 1212–1228. doi: 10.1002/edn3.337
Wang X., Wang H., Liang Y., McMinn A., and Wang M. (2024). Community organization and network complexity and stability: Contrasting strategies of prokaryotic versus eukaryotic microbiomes in the Bohai Sea and Yellow Sea. mSphere 9, 00395–00324. doi: 10.1128/msphere.00395-24
Ward B. A., Dutkiewicz S., Jahn O., and Follows M. J. (2012). A size-structured food-web model for the global ocean. Limnol. Oceanogr. 57, 1877–1891. doi: 10.4319/lo.2012.57.6.1877
Watanabe H. and Kawaguchi K. (2003). Decadal change in the diets of the surface migratory myctophid fish Myctophum nitidulum in the Kuroshio region of the western North Pacific: Predation on sardine larvae by myctophids. Fish. Sci. 69, 716–721. doi: 10.1046/j.1444-2906.2003.00678.x
Watanabe Y. and Saito H. (1998). Feeding and growth of early juvenile Japanese sardines in the Pacific waters off central Japan. J. Fish Biol. 52, 519–533. doi: 10.1111/j.1095-8649.1998.tb02014.x
Welschmeyer N. A. (1994). Fluorometric analysis of chlorophyll a in the presence of chlorophyll b and pheopigments. Limnol. Oceanogr. 39, 1985–1992. doi: 10.4319/lo.1994.39.8.1985
Williams T. J., Wilkins D., Long E., Evans F., DeMaere M. Z., Raftery M. J., et al. (2013). The role of planktonic Flavobacteria in processing algal organic matter in coastal East Antarctica revealed using metagenomics and metaproteomics. Environ. Microbiol. 15, 1302–1317. doi: 10.1111/1462-2920.12017
Wu Y., Hirai J., Zhou F., Iwataki M., Jiang S., Ogawa H., et al. (2024). Diversity and biogeography of dinoflagellates in the Kuroshio region revealed by 18S rRNA metabarcoding. Front. Mar. Sci. 11. doi: 10.3389/fmars.2024.1361452
Wu C. R., Hsin Y. C., Chiang T. L., Lin Y. F., and Tsui I. F. (2014). Seasonal and interannual changes of the Kuroshio intrusion onto the East China Sea Shelf. J. Geophys. Res. Oceans 119, 5039–5051. doi: 10.1002/2013JC009748
Wu P. F., Li D. X., Kong L. F., Li Y. Y., Zhang H., Xie Z. X., et al. (2020). The diversity and biogeography of microeukaryotes in the euphotic zone of the northwestern Pacific Ocean. Sci. Total Environ. 698, 134289. doi: 10.1016/j.scitotenv.2019.134289
Yilmaz P., Parfrey L. W., Yarza P., Gerken J., Pruesse E., Quast C., et al. (2014). The SILVA and “All-species Living Tree Project (LTP)” taxonomic frameworks. Nucleic Acids Res. 42, D643–D648. doi: 10.1093/nar/gkt1209
Yoshizawa S., Kawanabe A., Ito H., Kandori H., and Kogure K. (2012). Diversity and functional analysis of proteorhodopsin in marine Flavobacteria. Environ. Microbiol. 14, 1240–1248. doi: 10.1111/j.1462-2920.2012.02702.x
Yu Z., Ito S., Wong M. K. S., Yoshizawa S., Inoue J., Itoh S., et al. (2022). Comparison of species-specific qPCR and metabarcoding methods to detect small pelagic fish distribution from open ocean environmental DNA. PLoS One 17, e0273670. doi: 10.1371/journal.pone.0273670
Zhang H., Huang X., Huang L., Bao F., Xiong S., Wang K., et al. (2018). Microeukaryotic biogeography in the typical subtropical coastal waters with multiple environmental gradients. Sci. Total Environ. 635, 618–628. doi: 10.1016/j.scitotenv.2018.04.142
Zhu W., Zhu M., Liu X., Xia J., Yin H., and Li X. (2023). Different responses of bacteria and microeukaryote to assembly processes and co-occurrence pattern in the coastal upwelling. Microb. Ecol. 86, 174–186. doi: 10.1007/s00248-022-02093-7
Keywords: bacteria, phytoplankton, zooplankton, environmental DNA metabarcoding analysis, community structure, diversity, biogeography, Kuroshio Current
Citation: Sugai Y, Ushio M, Hirai J, Hasegawa-Takano M, Fujiwara T, Takada M, Mori K, Fukuda H, Saito H, Hamasaki K, Hyodo S and Yoshizawa S (2025) Different structuring factors and distribution patterns of marine prokaryotic and eukaryotic communities in the subtropical Kuroshio region. Front. Mar. Sci. 12:1656531. doi: 10.3389/fmars.2025.1656531
Received: 30 June 2025; Accepted: 27 October 2025;
Published: 28 November 2025.
Edited by:
Xiaolei Wang, Ocean University of China, ChinaReviewed by:
Pankaj Tiwari, University of Kalyani, IndiaFabio Toshiro Taquicava Hanashiro, KU Leuven, Belgium
Copyright © 2025 Sugai, Ushio, Hirai, Hasegawa-Takano, Fujiwara, Takada, Mori, Fukuda, Saito, Hamasaki, Hyodo and Yoshizawa. This is an open-access article distributed under the terms of the Creative Commons Attribution License (CC BY). The use, distribution or reproduction in other forums is permitted, provided the original author(s) and the copyright owner(s) are credited and that the original publication in this journal is cited, in accordance with accepted academic practice. No use, distribution or reproduction is permitted which does not comply with these terms.
*Correspondence: Youta Sugai, eXN1Z2FpQGFvcmkudS10b2t5by5hYy5qcA==
†Present address: Masumi Hasegawa-Takano, Advanced Institute for Marine Ecosystem Change, Japan Agency for Marine-Earth Science and Technology, Yokosuka, Kanagawa, Japan Takayoshi Fujiwara, Department of Engineering Science, University of Oxford, Oxford, United Kingdom