 Hjálmar Hátún1*
 Jóhannis Danielsen1
 Bergur Olsen1
 Sólvá Jacobsen1
 Helga Bára Mohr Vang1
 Inga Kristiansen1
 Karin Margretha H. Larsen1
 Eilif Gaard1
 Ian Salter1
 Petur Steingrund1
 Kjell Arne Mork2,3
- 1Faroe Marine Research Institute, Tórshavn, Faroe Islands
- 2Institute of Marine Research, Bergen, Norway
- 3Bjerknes Centre for Climate Research, Bergen, Norway
Demersal fish stocks and seabird populations on the Faroe shelf have declined profoundly over the past half-century, and the relative role of exploitation and climate remains a key question. The dynamics of the subpolar gyre influences both the marine climate and several ecosystems in the northeastern Atlantic. Furthermore, a more than century old hypothesis suggests that production in marine ecosystems along the eastern margin of the Norwegian Sea is fueled by transport of nutrient- and zooplankton-rich subarctic waters from the Iceland Sea-Jan Mayen region. Recent research has, on the other hand, related the productivity of the Faroe shelf ecosystem to local processes. These contrasting perspectives are here combined, to explain the highly variable recruitment, and thus stock sizes, of Faroese cod (Gadus morhua) and guillemots (Uria aalge). We propose that good recruitment to demersal fish stocks and seabirds requires both high on-shelf biological production and high oceanic food content, proxied by large volumes of subarctic waters surrounding the Faroe shelf.
1 Introduction
Biological production on the Faroe shelf is characterized by marked peaks with 6- to 10-years intervals: specifically in 1974, 1983 (weak), 1994, 2000, 2009, 2017 (Jacobsen et al., 2019), and a recent weak peak in 2023-2024 (Olsen et al., 2025). These peaks are reflected in on-shelf primary production, as proxied by a so-called primary production index (PPI) (Gaard et al., 1998), the size of juvenile fish (Eliasen et al., 2011) [represented by a 0-group length index, Jacobsen et al., 2019], recruitment to commercial fish stocks (ICES, 2024) and the breeding success and nest attendance of seabirds (Olsen et al., 2025). Although there is coherent synchrony in these parameters, the magnitude of peaks in the PPI and 0-group length index are not always reflected in recruitment to the adult Atlantic cod (Gadus morhua) (hereafter just cod) stock. In particular, production peaks after 2003 have not benefitted cod as they did before. While the Faroese fish stocks and seabird populations exhibit peaks following productive periods, they also show clear longer-term shifts and negative trends (Olsen et al., 2025), which cannot be explained by variation in the PPI or in the 0-group length index. This calls for consideration of additional environmental drivers, likely with a larger-scale ‘footprint’ than just the Faroe shelf itself. Acknowledging previously suggested links between ecological shifts in the NE Atlantic and indices like the North Atlantic Oscillation (NAO) index, and the Atlantic Multi-decadal Oscillation (AMO) (Hátún et al., 2009), we discuss potential links to the influence of nutrient- and zooplankton-rich subarctic waters (SAW) from two main sources: the subpolar gyre (SPG) and the East Icelandic Current.
Recent research has demonstrated linkages between SPG dynamics and both oceanic and shelf ecosystems in the subpolar North Atlantic (Hátún et al., 2022b). Strong winter convection and an associated large SPG increase the contribution of SAW to the mixed Atlantic waters surrounding the Faroe shelf, which in turn can increase biological production in these waters (Hátún et al., 2022a).
While including the SPG driver, this study focuses on a potentially similar influence of SAW from the East Icelandic Current, which has received less attention to date. Following the development of accurate oceanographic instruments (the Nansen bottle) in the late 1800s, a cold tongue of SAW from northeast of Iceland extending into the southern Norwegian Sea was among the first thoroughly studied oceanographic features (Figure 1). In their seminal book, ‘The Norwegian Sea’, Helland-Hansen and Nansen (1909) hypothesized that “increased amount of Arctic water carried in contact with Atlantic water in the region of the Faroe-Shetland Channel will improve the biological conditions of food-fishes during the same season in the North Sea and one year later near Lofoten”. The suggested reasons were that SAW possesses physical (e.g., temperature) and chemical (e.g., nutrients) properties which are of great importance for plankton development. For the open ocean, they observed large and nutritious calanoid copepods Calanus hyperboreus in this Icelandic tongue and along the axis of the southeastward flow of cold and heavy SAW into the southern Norwegian Sea, while Calanus finmarchicus were observed in the mixed water of Arctic and Atlantic origin. C. finmarchicus is a critical prey item, transferring energy from primary production to higher trophic levels in the Norwegian Sea (Melle et al., 2014), and on adjacent shelves (Sundby, 2000). C. hyperboreus plays a similar role north and northeast of Iceland during spring (Gislason and Silva, 2012). The biophysical relationships proposed by Helland-Hansen and Nansen (1909) received relatively little attention until recent studies by Kristiansen et al. (2016, 2019) demonstrated that the variable extent of this tongue into the waters north of the Faroe Islands regulates zooplankton communities there: a large Icelandic tongue results in large biomasses of C. hyperboreus, and large stages of C. finmarchicus can reach the Norwegian slope as well (Skagseth et al., 2022). The fact that these subarctic copepods largely vanished from the southern Norwegian Sea when the Icelandic tongue retracted westwards after 2003 (Kristiansen et al., 2019), likely had significant ecological implications (Hátún et al., 2022a).
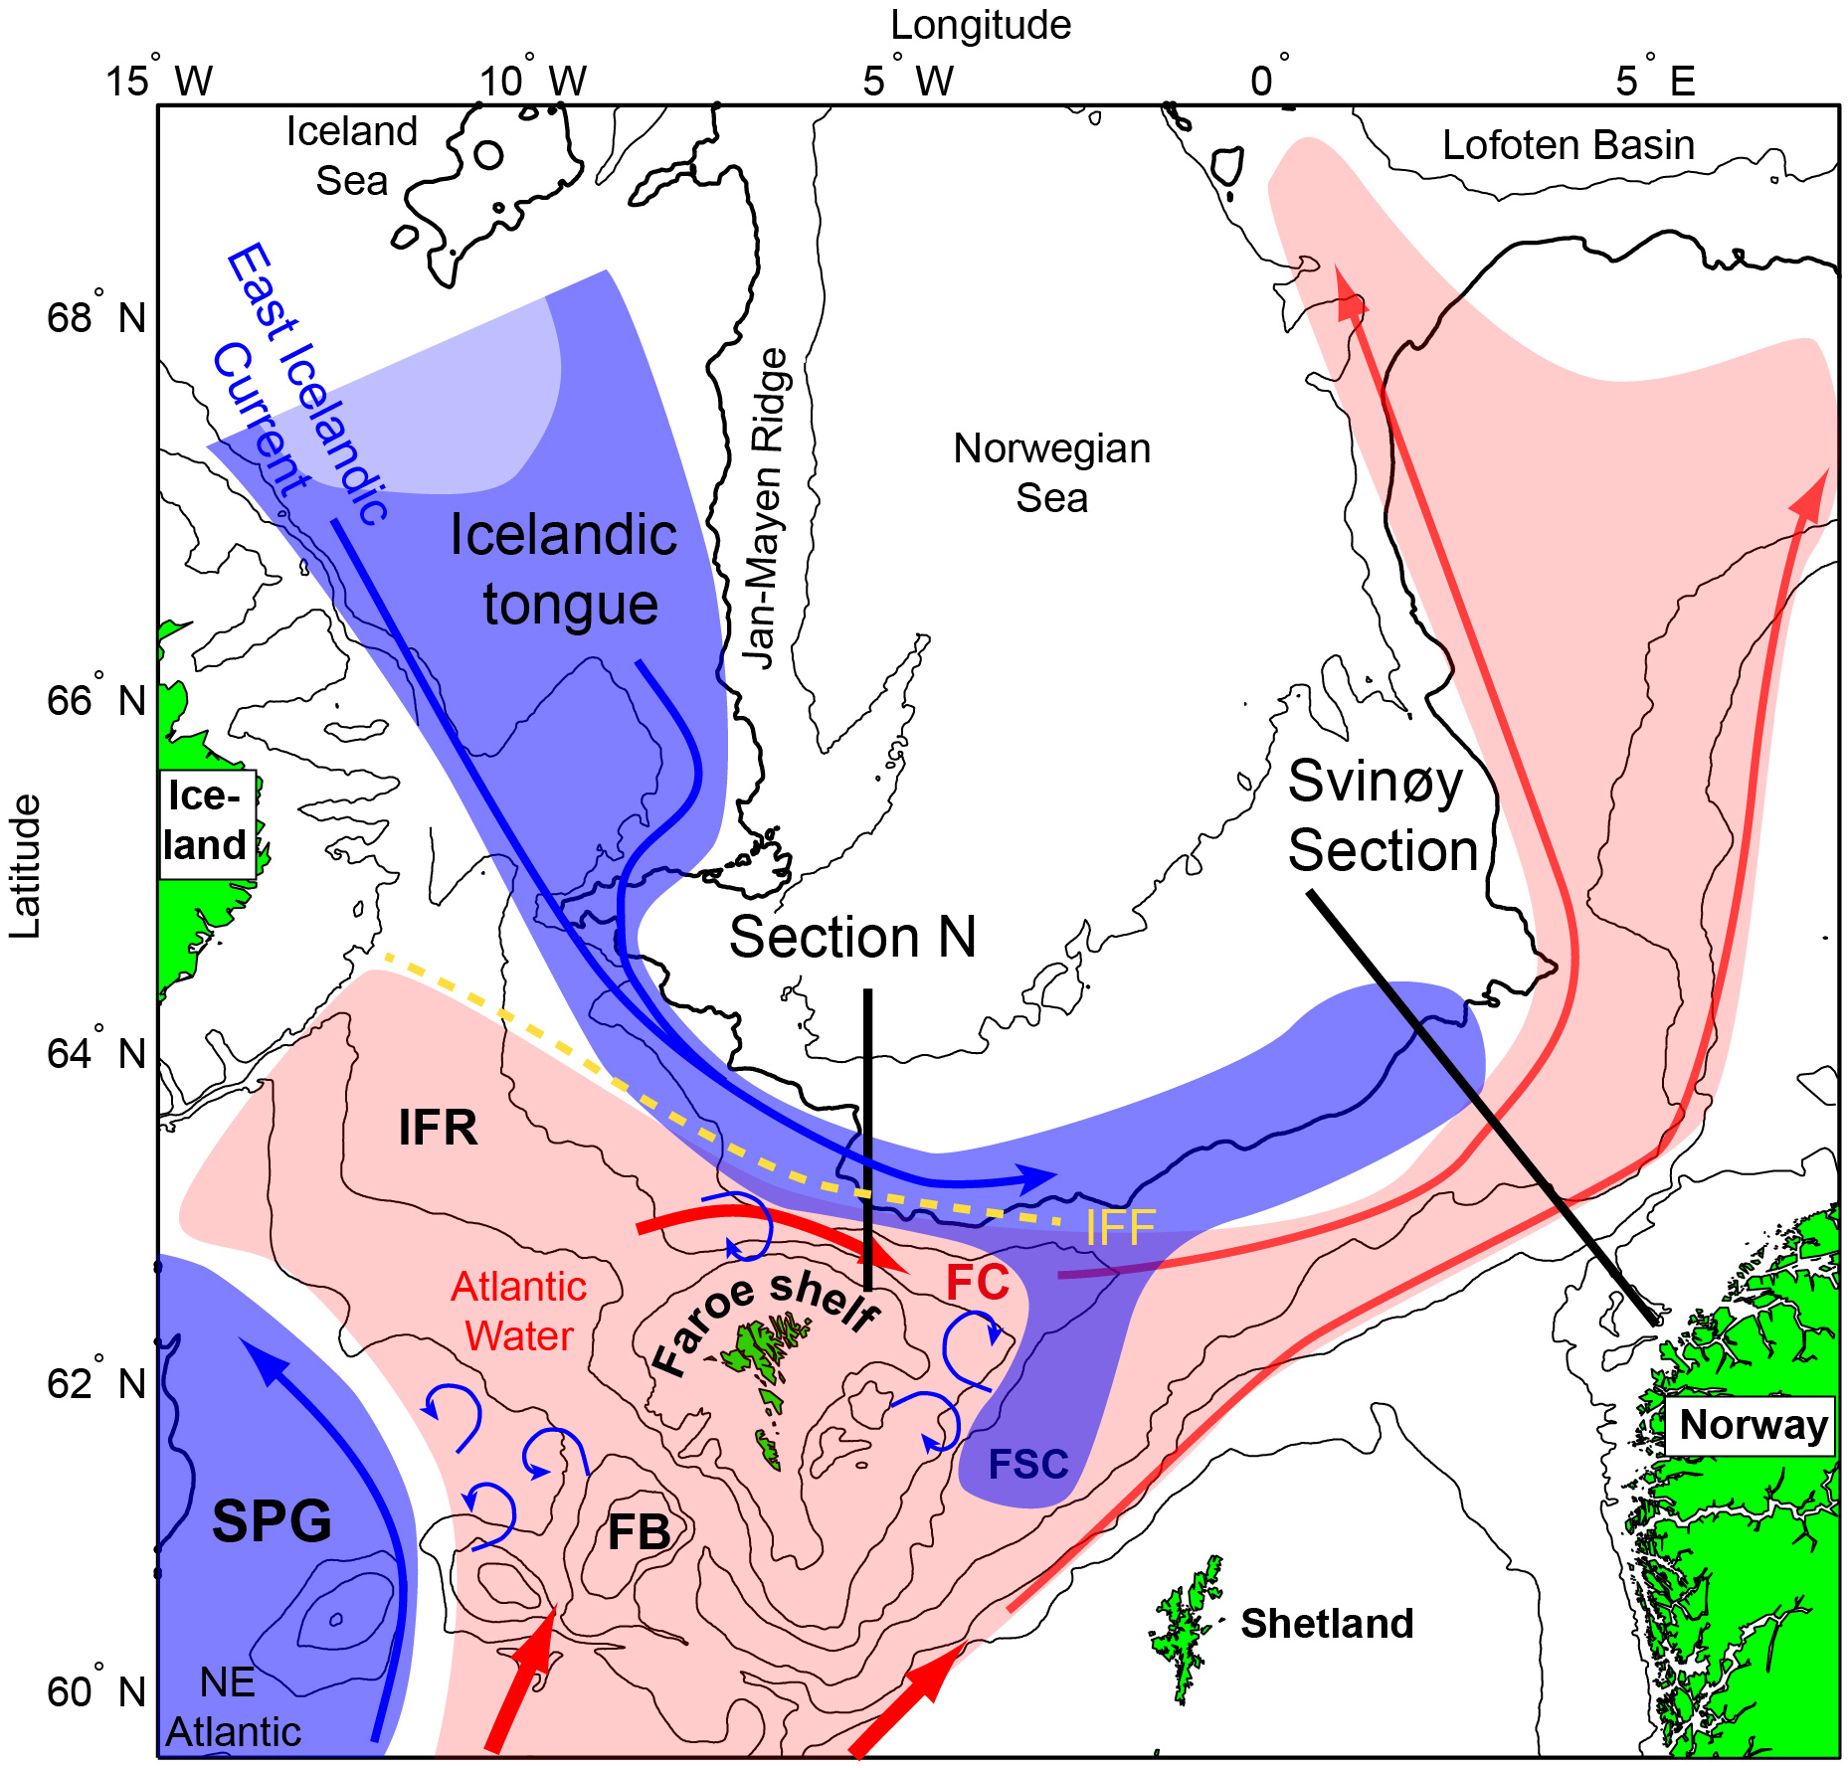
Figure 1. Overview over the study region. Subarctic currents and water masses are shown with blue arrows and shading, while the warmer Atlantic water counterpart is shown in red colours. The blue curled arrows suggest entrainment of subarctic waters into the Atlantic water. The positions of the monitoring sections, N and Svinøy, are marked with black lines, and the yellow dashed line represents the Iceland-Faroe Front (IFF). FSC, Faroe-Shetland Channel; FB, Faroe Bank; FC, Faroe Current; IFF, Iceland-Faroe Front; IFR, Iceland-Faroe Ridge and SPG, Subpolar gyre.
Similar shifts have, however, taken place before. For the Norwegian shelf, Helland-Hansen and Nansen (1909) found that increased recruitment to the cod, haddock (Melanogrammus aeglefinus) and Norwegian spring spawning herring (Clupea harengus) stocks was proceeded by increased volume of SAW and decreased temperatures in the Atlantic water. The SAW volume was estimated as the sectional area of SAW in a section across the southern Norwegian Sea (Sognefjord section) in May. The SAW volume was large in 1901, and fish thrived. This changed abruptly in ‘the famous year 1903’, with reduced SAW volume, increased Atlantic water temperatures and poor cod conditions, reflected in reduced development of sexual organs, reduced quantity of cod-roe and cod-liver oil and exceptionally late arrival at the fishing banks near Lofoten. Haddock were also small (in size) in 1903, and “thousands of dead seabirds (common guillemots, Uria aalge) were said to be in completely emaciated conditions, and washed ashore”. The deteriorated conditions coincided with a sudden occurrence of tropical plankton forms, which had previously never been observed in the northern seas.
SAW north of the Faroes circulates clockwise around the northeastern tip of the Faroe Plateau and into the Faroe-Shetland Channel, and establishes the hydrographic foundation below the Atlantic inflows towards higher latitudes. Confluence of lower trophic level biomass along the interface between the SAW and the overlying Atlantic waters – the permanent thermo/pycnocline, feeds a large biomass of krill, mesopelagic fish, and their larger predators (e.g. blue whiting (Micromesistius poutassou), Greenland halibut (Reinhardtius hippoglossoides), and several other fish species). This “Wall of mouths” (Hamner et al., 1988) is clearly identifiable as a Deep Scattering Layer in acoustic data from these waters (Cisewski et al., 2021). Zooplankton that have ascended and other near-surface, passive, food items can potentially also be advected from the Iceland tongue towards the Faroe shelf break in a low-saline surface layer, which builds during the summer and fall (Perkins et al., 1998). If the link between the SAW and the Norwegian shelf ecosystem suggested by Helland-Hansen and Nansen (1909) holds, such a mechanism might be even more robust for the Faroe shelf ecosystem. A thorough discussion of the ocean-to-shelf advection is, however, beyond the scope of the present work, which is to establish synchrony between key large-scale oceanographic drivers and biological indicators on the Faroe shelf.
Cod has been one of the main commercial fish species, sustaining a considerable portion of the Faroese economy. This stock has therefore been closely monitored, providing extensive data material, including long and robust time series (ICES, 2024). Guillemots have historically constituted the largest and most exploited seabird population in the Faroe Islands (Nørrevang, 1977). A major decline in this species during the 1960s elicited concern (Olsen, 1990; Reinert, 1976) and initiated structured seabird counts in the Faroe Islands (Dyck and Meltofte, 1975; 1973). The common guillemot (hereafter just guillemot) record discussed here is the longest of its kind from the Faroe shelf (Olsen et al., 2025). Cod and guillemots share similar prey species, e.g., sandeel (Ammodytes spp.), and adult guillemots in the Barents Sea (Myksvoll et al., 2013), and likely also on the Faroe shelf (B. Olsen, personal communication; Figure S1) also prey directly on juvenile cod. This shared predation makes the breeding performance of this seabird a useful indicator of the status and recruitment of the cod stock. Motivated by this expected ecological coupling, economic, ecological and cultural significance, and large data availability, cod recruitment, total cod biomass and total attendance of guillemots are employed as indicator records for principal higher trophic level species on the Faroe shelf. Building on Helland-Hansen and Nansen (1909), we will use these indicator records, the now well-documented SPG-ecology linkages and ongoing ecological research on biological production on the Faroe shelf, to introduce the following new theoretical framework: the biomass of higher trophic levels on the Faroe shelf is driven by both on-shelf production and off-shelf food abundance. This forms basis upon which more refined hypotheses can be built and rigorously tested.
The data material is described in Section 2. The SPG influence on SAW contribution to the Atlantic waters west of the Faroes (proxied by a salinity record) is presented in Section 3.1, and results from spatial and temporal changes in SAW from the Icelandic tongue are illustrated in Section 3.2. Updated oceanic zooplankton records north of the Faroe slope are provided in Section 3.3, recruitment and biomass of cod is presented in 3.4, and guillemot attendance is presented in 3.5. A comparison with the Faroe Bank cod is provided in 3.6 and the results are discussed in Section 4.
2 Materials and methods
Table S1 in the Supplementary Online Information (SOI) contains raw data for all indicator records, which are provided as annual values (excluding the salinity record and the gyre index).
2.1 SAW indicators from two sources
2.1.1 The subpolar gyre
A monthly resolved gyre index has been updated to 2024, based on the methods outlined in Hátún and Chafik (2018). As a metric for the influence of SAW from the SPG on the Atlantic water around the Faroe shelf, we use a salinity indicator record from Section N, crossing the Faroe Current north of the Faroes. The record is described in Larsen et al. (2012) (see Figure 1 and below), and the data are available at https://ocean.ices.dk/iroc.
2.1.2 The Icelandic tongue
Spatial analysis. To characterize the annual three-dimensional hydrographic changes associated with variable inflow from the Icelandic tongue, we combined datasets from ICES (International Council for the Exploration of the Sea), PINRO (Polar Research Institute of Marine Fisheries and Oceanography, Russia), and the Argo Global Data Assembly Centre in France (Coriolis Data Centre, France) (an update to Mork et al., 2014). We used data collected between mid-April and mid-June, including data from annual joint Nordic and EU pelagic spring surveys, which comprise hydrographic stations spaced every 60 nautical miles, extending to 1000 m depth in the Norwegian Sea. The combined observations were interpolated using objective analysis on a horizontal grid with 0.5° zonal and 0.25° meridional intervals at 5-meter depth increments down to 1000 m, following the methodology described by Skagseth and Mork (2012). These data were subsequently processed as described in Skagseth et al. (2022). We generated spatial maps showing SAW thickness defined by the criteria 1°C < T < 4°C and S < 34.91 psu (practical salinity units). A clear proxy visualization of this water mass is provided in a temperature-salinity (TS) diagram in Skagseth et al. (2022) (their Figure 6).
Section N. Hydrographic observations have been made 3–4 times a year along a standard section (Section N), crossing the Faroe slope along the 6°W meridian (Figure 1). These numerous measurements at Section N enable the construction of a proxy record for the SAW volume back to 1992. A cross-sectional area of SAW (represented by Modified East Icelandic Water, MEIW (Read and Pollard, 1992), at this location) – our estimate of the influence from the cold Icelandic tongue - is calculated for each measurement of Section N by integrating the areal representation of observations in the T-S range (1–3°C, S < 34.9 psu) (Kristiansen et al., 2019), followed by calculation of annual averages.
Svinøy Section. A proxy for the contribution of SAW from Icelandic tongue is also estimated as the area of SAW along the Norwegian Svinøy section (0-500 m depths). This section extends north-westward from the Norwegian slope (Figure 1), and covers the period 1978 to present. The cross-sectional area at this location is represented by water fresher than 34.9 in July-August (Skagseth et al., 2022). Based on this proxy series and an empirical threshold, conditions in the southern Norwegian Sea are divided into Atlantic and Subarctic periods, with, respectively, low and large SAW volumes (Section 3.2).
2.2 Ecological indicators
2.2.1 Calanoid copepods
Monitoring of zooplankton abundance and composition (0-50m hauls with a WP-2 net, 200µm mesh size) was initiated at Section N in 1993 with data being collected in mid- to late May. No data are available for 1996, 1998 and 2006. Abundance of C. hyperboreus and the overwintered stages of C. finmarchicus (CIV to CVI) (Kristiansen et al., 2016) from the truly subarctic region (north of the Iceland-Faroe Front, Figure 1) were used in our analysis, which follows Kristiansen et al. (2019).
2.2.2 0-group length index
The 0-group length index is used as a proxy for biological production on the Faroe shelf. This index was first introduced by Jacobsen et al. (2019), and subsequently updated to 2024 and extended back to 1974 by Olsen et al. (2025). It is based on annual 10-day surveys of juvenile fish abundances and lengths conducted on the Faroe Plateau since 1974, typically in late June to early July. It is calculated by applying principal component analysis (PCA) on the mean lengths of the four most abundant 0-group fish species: cod, haddock, Norway pout (Trisopterus esmarkii), and sandeel (Ammodytes spp.), averaged across all trawl stations within the 100 m bottom depth contour. The PCA effectively captures the shared growth pattern across these species, providing a robust indicator of overall juvenile fish development in the region. Specifics regarding trawl dimensions and other survey details are provided in Olsen et al. (2025).
2.2.3 Demersal fish
Faroese waters host two distinct cod stocks: the Faroe Plateau cod and the Faroe Bank cod. ICES regularly assesses both stocks to guide sustainable fishing practices. The Faroe Plateau cod is a data-rich stock (ICES category 1), allowing for comprehensive stock assessments that provide estimates of recruitment, spawning stock biomass, total stock biomass, and fishing pressure from 1959 to 2024 (ICES, 2024). The recruitment record used here represents the number of 1-year old fish, which means that high values in a given year (e.g., 1994) reflect large survival of fish spawned the previous year (e.g., 1993). Conversely, the Faroe Bank cod is classified as data-limited (ICES category 3), and the assessments for this stock rely primarily on survey biomass indices, and estimates of recruitment or spawning stock biomass are not currently available. The primary biomass index used in assessments is a CPUE (Catch Per Unit Effort) series derived from groundfish surveys conducted in September from 1996 to 2024 (ICES, 2024). Additionally, a secondary CPUE series from groundfish March surveys (1983-2024), is available, with gaps in 2004, and 2005.
2.2.4 Guillemots
We use annual counts of the total number of guillemots attending a long-term study colony at Høvdin, a breeding cliff on the island Skúvoy. Olsen et al. (2025) concluded that this unique record reflects the total abundance of guillemots in the Faroe Islands, dating back to 1972. Further research is required to assess the continued validity of this assumption.
2.3 Peak identification and standardization
Identification of years with peaks in the 0-group length index and the cod recruitment records, respectively, was based on visual inspection and an empirical threshold, supported by the MATLAB function findpeaks.m. Only one year (the highest value) was assigned to each peak, even when two consecutive years had values above the threshold. Since the cod recruitment values were low after 2000, the identification of peaks depended on the chosen threshold value. Auxiliary information from the Faroe shelf, supported the conclusion that 2009 and 2017 were peak years, while 2005 and 2013 were not. All time series have been standardized before plotting, by subtracting the mean and dividing by the standard deviation.
3 Results
3.1 SAW from the subpolar gyre
The previously proposed link between the size and circulation strength of the SPG and salinity in the NE Atlantic (Hátún et al., 2005) remains valid. As reflected by a declining gyre index (Figure 2), the SPG weakened through the late 1990s and early 2000s, which coincided with increased salinities around the Faroe Plateau. This pattern reflects reduced SAW influence. A subsequent strengthening of the SPG, which was gradually initiated after 2011 and showed more rapid changes after 2014, resulted in a marked drop in salinity, thereby demonstrating increased influx of SAW into the Atlantic waters. Shorter-term SPG intensifications (peaks in the black curve in Figure 2) coincide with increased productivity on the Faroe shelf, as highlighted by the vertical dashed lines (see Section 3.4). Drops in salinity are also observed around these productive periods, although these can both precede and follow the short-term SPG signal. While the SPG reached peak intensity around 2015-2016, salinity continued to drop until 2017-2018. After the small SPG peak/salinity drop in 2023, the SPG has weakened and salinities have been increasing, suggesting a turn towards period with reduced SAW influence once again. The SPG dynamics influences temperature in a similar way to salinity, although the temperature decline after 2014 is more moderate than that evident in the salinity (not shown).
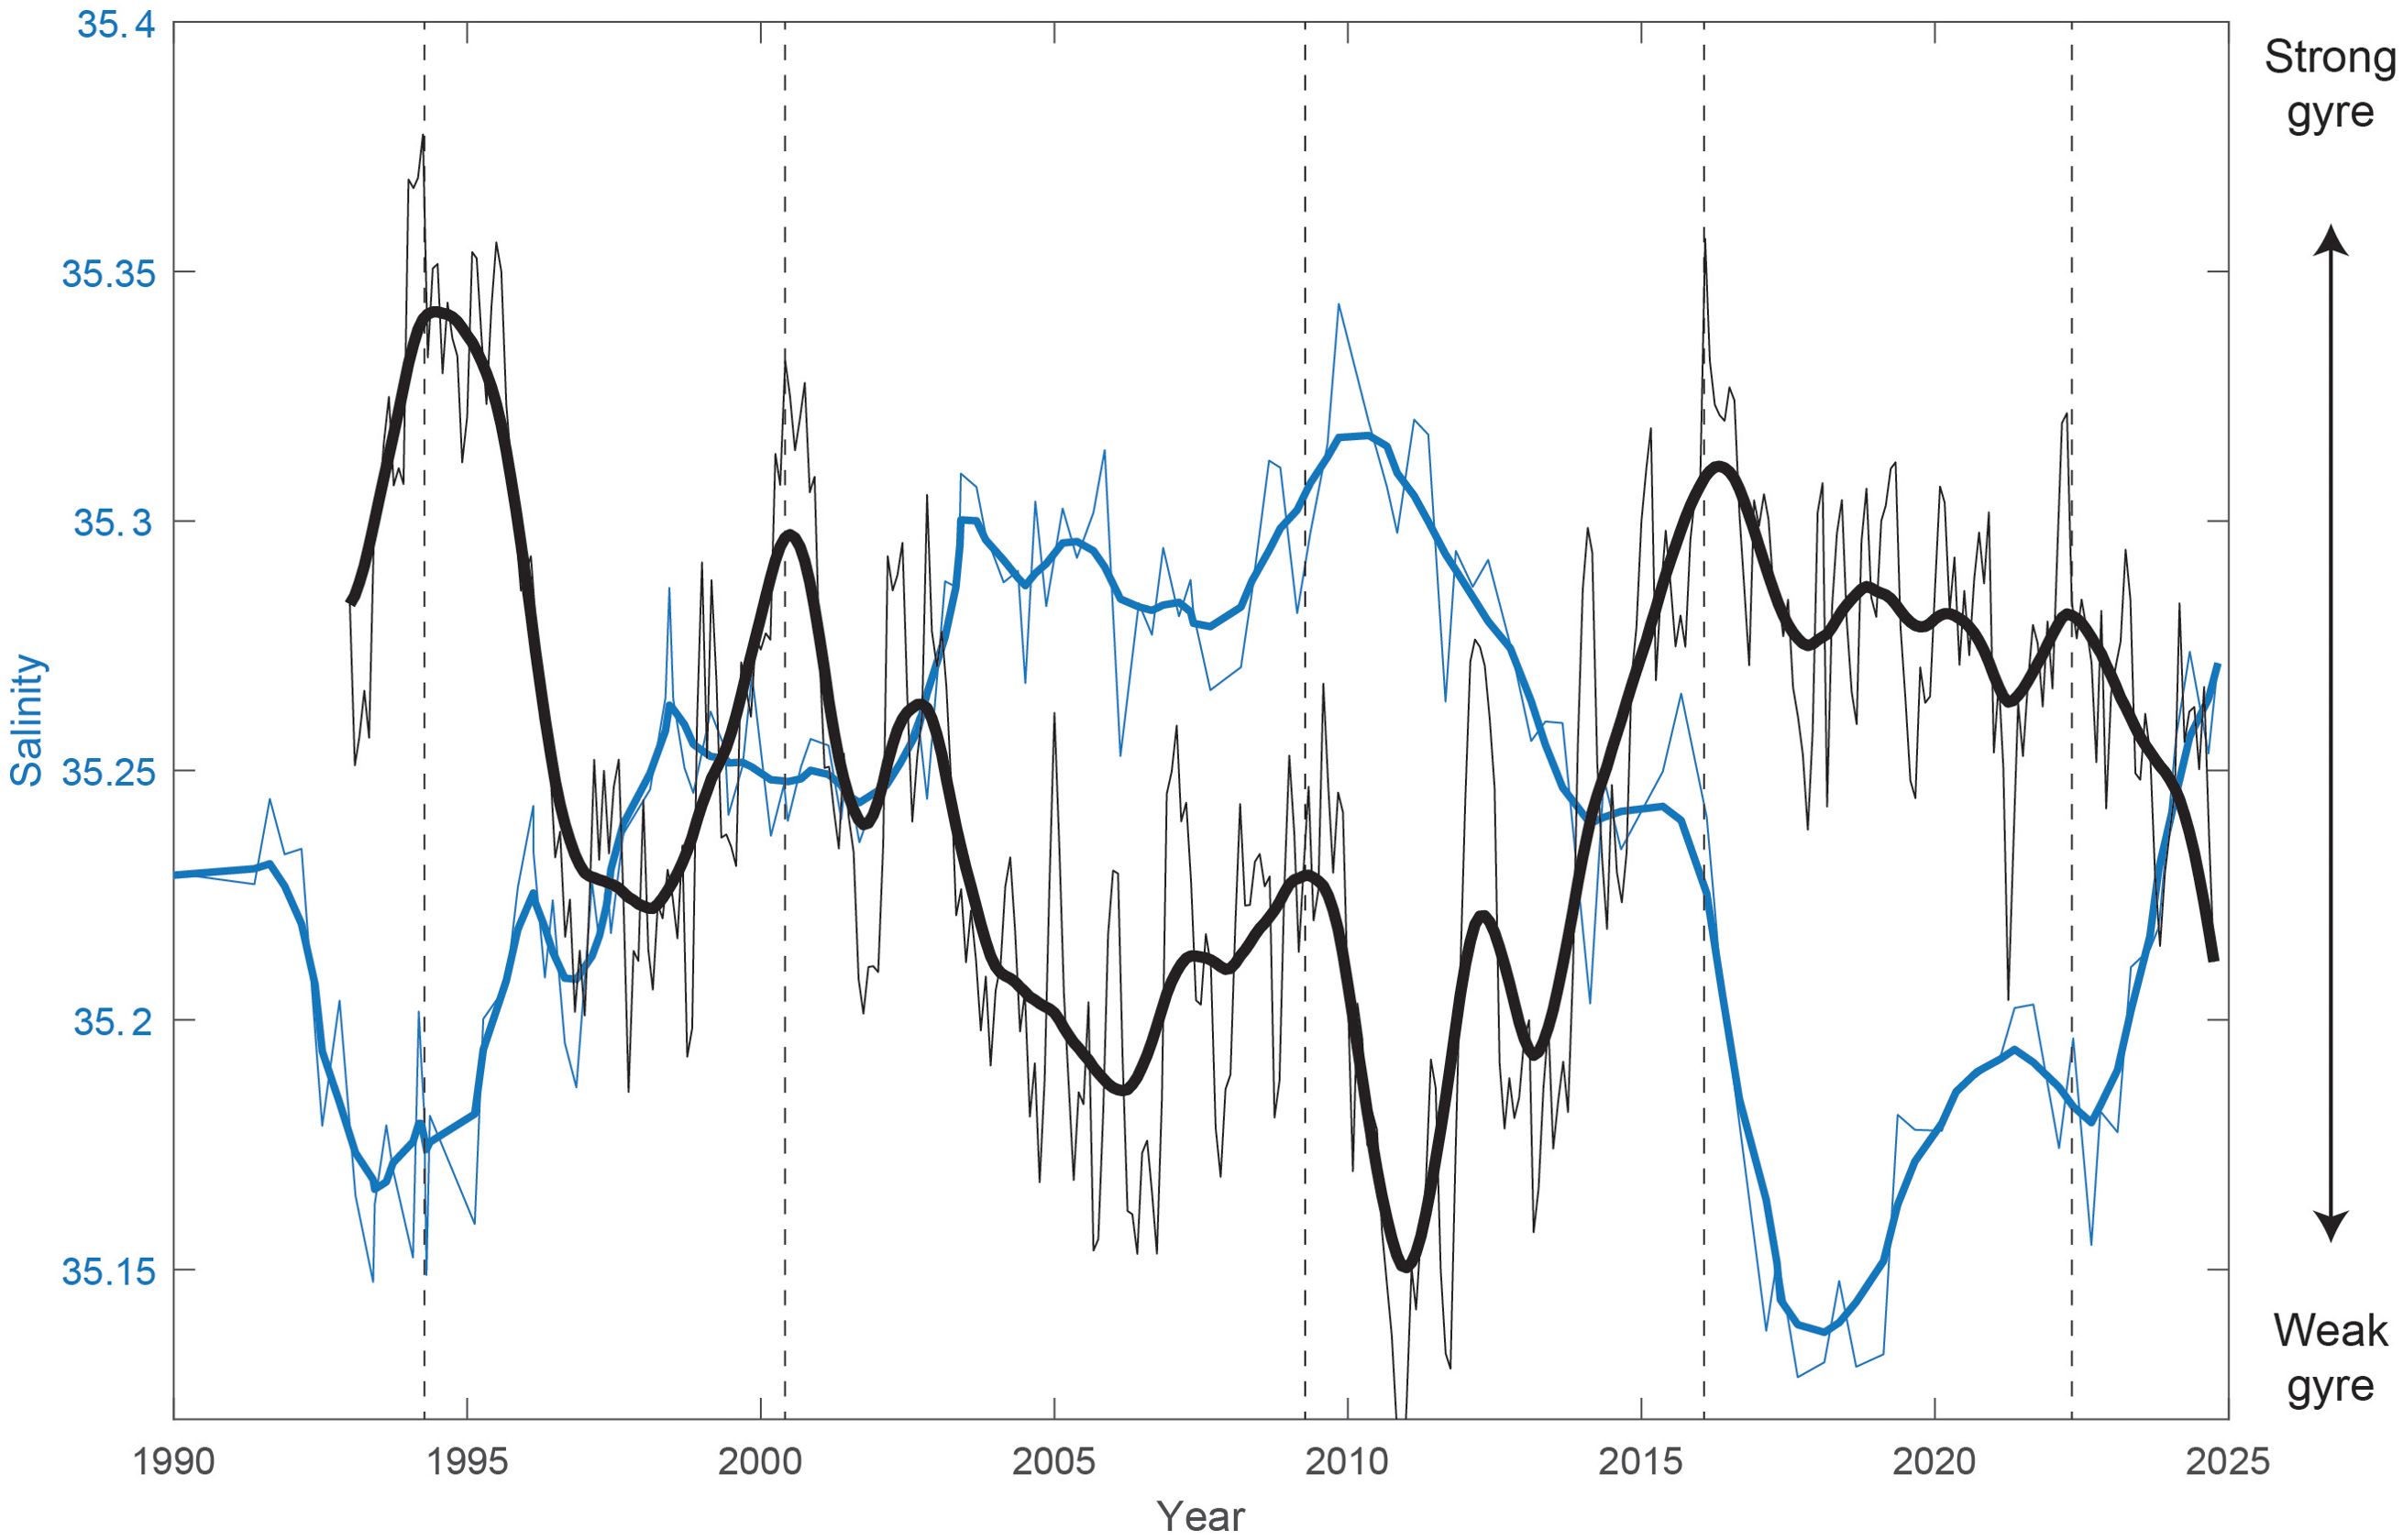
Figure 2. The gyre index (black, non-dimensional) and Atlantic water salinity (in psu) in the Faroe Current (blue, values on the left y-axis, see Figure 1 for the location). The thin black line shows monthly values, and the thick curve is a low-pass over 12 months. The thin blue line represents individual samples, and the thick blue curve is a low-pass over 4 values (which is approximately a year, since this hydrographic section is occupied 3-4 times a year). The timing of cod recruitment peaks is emphasized with vertical dashed lines.
3.2 SAW from the Icelandic tongue
3.2.1 Spatial view
The SAW layer remains thick along a U-shaped region between the NE Icelandic shelf and the Jan-Mayen ridge (Figure 3A). The thickest layer is generally observed near the deep and steep trough where the Jan-Mayen Ridge intersects the Iceland-Faroe Ridge (see Figure 1). The SAW layer thickness varies substantially between years, both within this U-shaped region and particularly in the southeastward ‘leakage’ into the Norwegian Sea and into the Faroe-Shetland Channel. Volumes of SAW were large from 1995 to 2002, but the leakage region thinned abruptly in 2003. Apart from smaller pulses (e.g. in 2012), the apparent eastward flow remained weak until 2018, after which a much thicker SAW layer was again observed north of the Faroe slope and along the Norwegian slope.
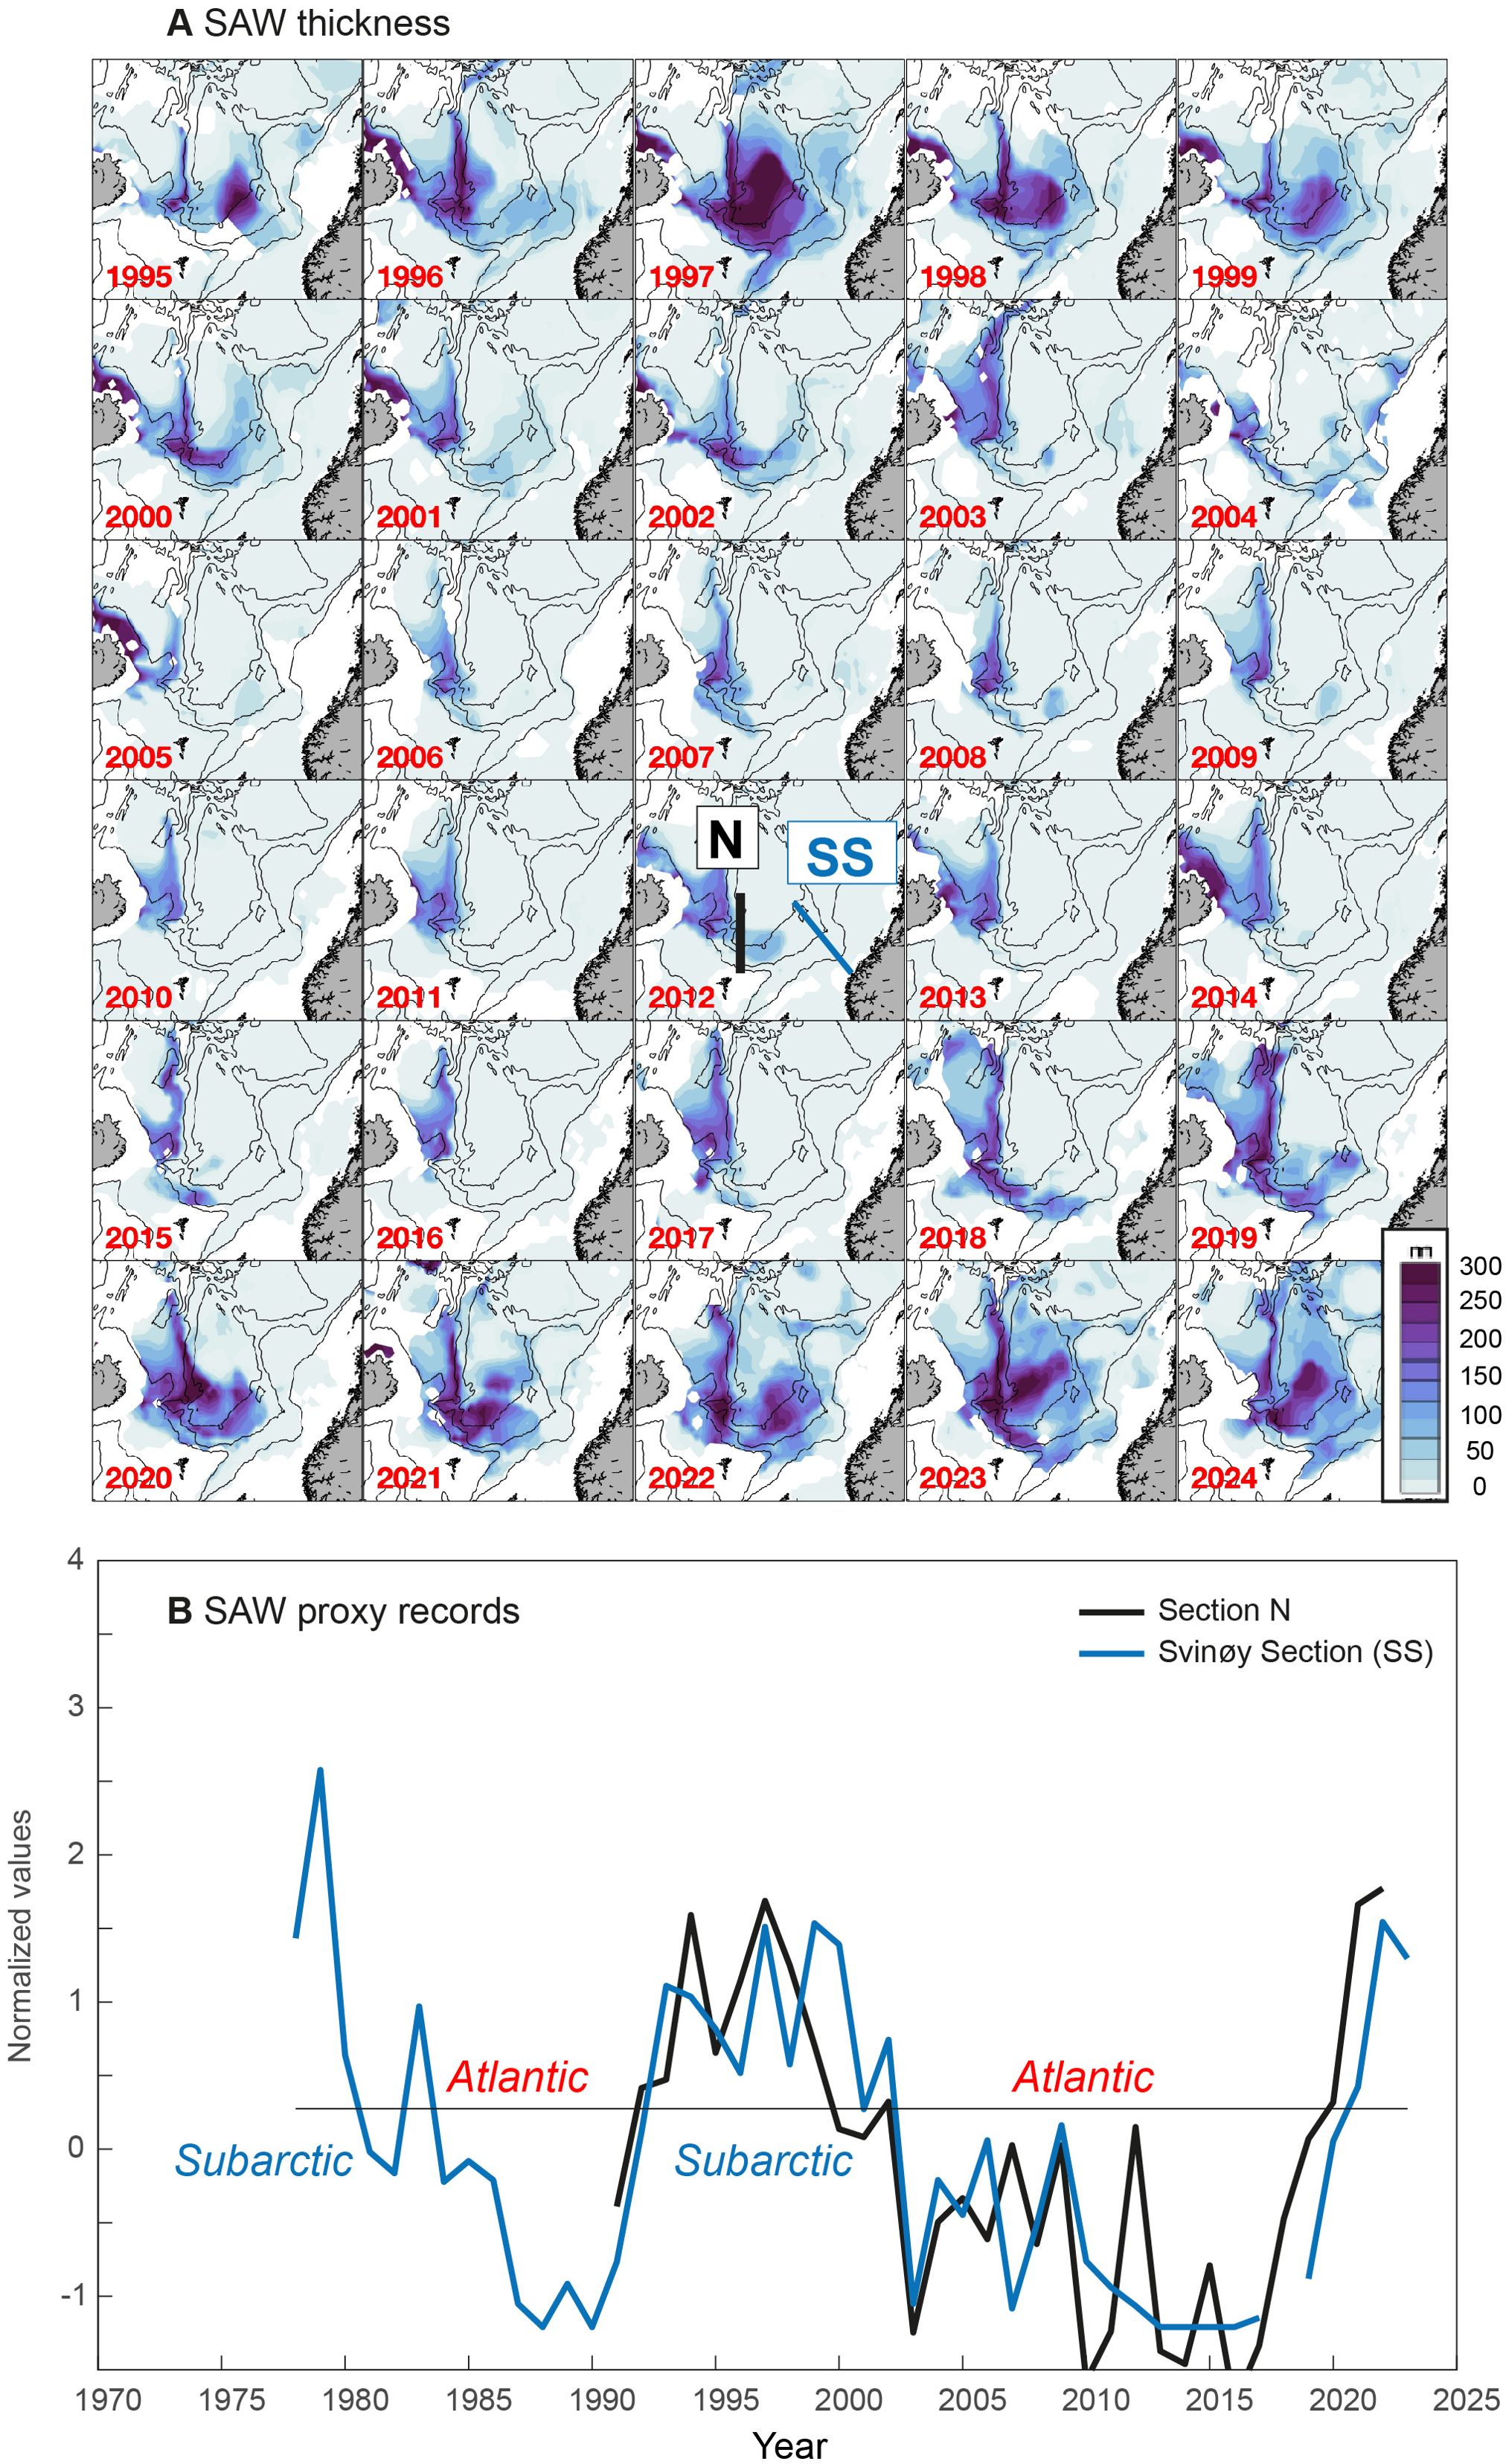
Figure 3. SAW from the Icelandic tongue. (A) Spatio-temporal changes in SAW thickness (see blue color scale) in the greater Norwegian Sea (which includes eastern parts of the Iceland Sea and the Faroe-Shetland Channel). (B) Indicators of SAW volume at Section N (N) at the north of the Faroes and the Svinøy section (SS) at the Norwegian slope (see Figure 1). Subarctic and Atlantic periods are emphasized.
3.2.2 Sectional view: Atlantic and Subarctic periods
The SAW proxy record from north of the Faroes (Section N, updated from Kristiansen et al., 2019) confirms that the eastward flow of SAW increased after 2017 (Figure 3B). This increase was steep, and the SAW volume in the 2020s reached values matching the highest levels of the 1990s. The SAW proxy record from the Norwegian slope (Svinøy section) closely follows the development at Section N (Figure 3B) (r = 0.73, p < 0.001, zero lag). The post-2017 increase was also dramatic in this more eastern location, and appears to have lagged behind Section N by about a year. The longer record available from the Svinøy section shows that the SAW volume in the southern Norwegian Sea was likely highest in the late 1970s, declined to very low values in 1987-1990, increased rapidly in the early 1990s, and remained high until 2002 (Figure 3). It dropped, as evident in the spatial view (Figure 3A) in 2003 and remained low until the aforementioned rapid post-2017 increase. We hereafter use the longer record from the Svinøy Section as a SAW indicator. Periods with this SAW indicator above/below average are referred to as Subarctic/Atlantic periods (Figure 3B).
3.3 Calanoid copepod abundances
To recapitulate the findings from Kristiansen et al. (2019) and Skagseth et al. (2022), high abundances of subarctic copepods during the 1990s and early 2000s were associated with high SAW volumes (a Subarctic period) and low copepod abundances were associated with the Atlantic period (2004-2014). A marked increase in both overwintered C. finmarchicus (in 2021) and C. hyperboreus (in 2022) at Section N, followed the post-2017 SAW increase, and especially the very large SAW volumes in 2021-2022 (Figure 4). Note that the SAW volume at Section N peaked in 2021 (Figure 3), one year before the peak at the Svinøy section (Figures 3, 4). The zooplankton abundances actually exceeded the high levels of the 1990s. This therefore supports the hypothesis proposed by Kristiansen et al. (2019), and shows that the early 2020s can likely be categorized as a second Subarctic period.
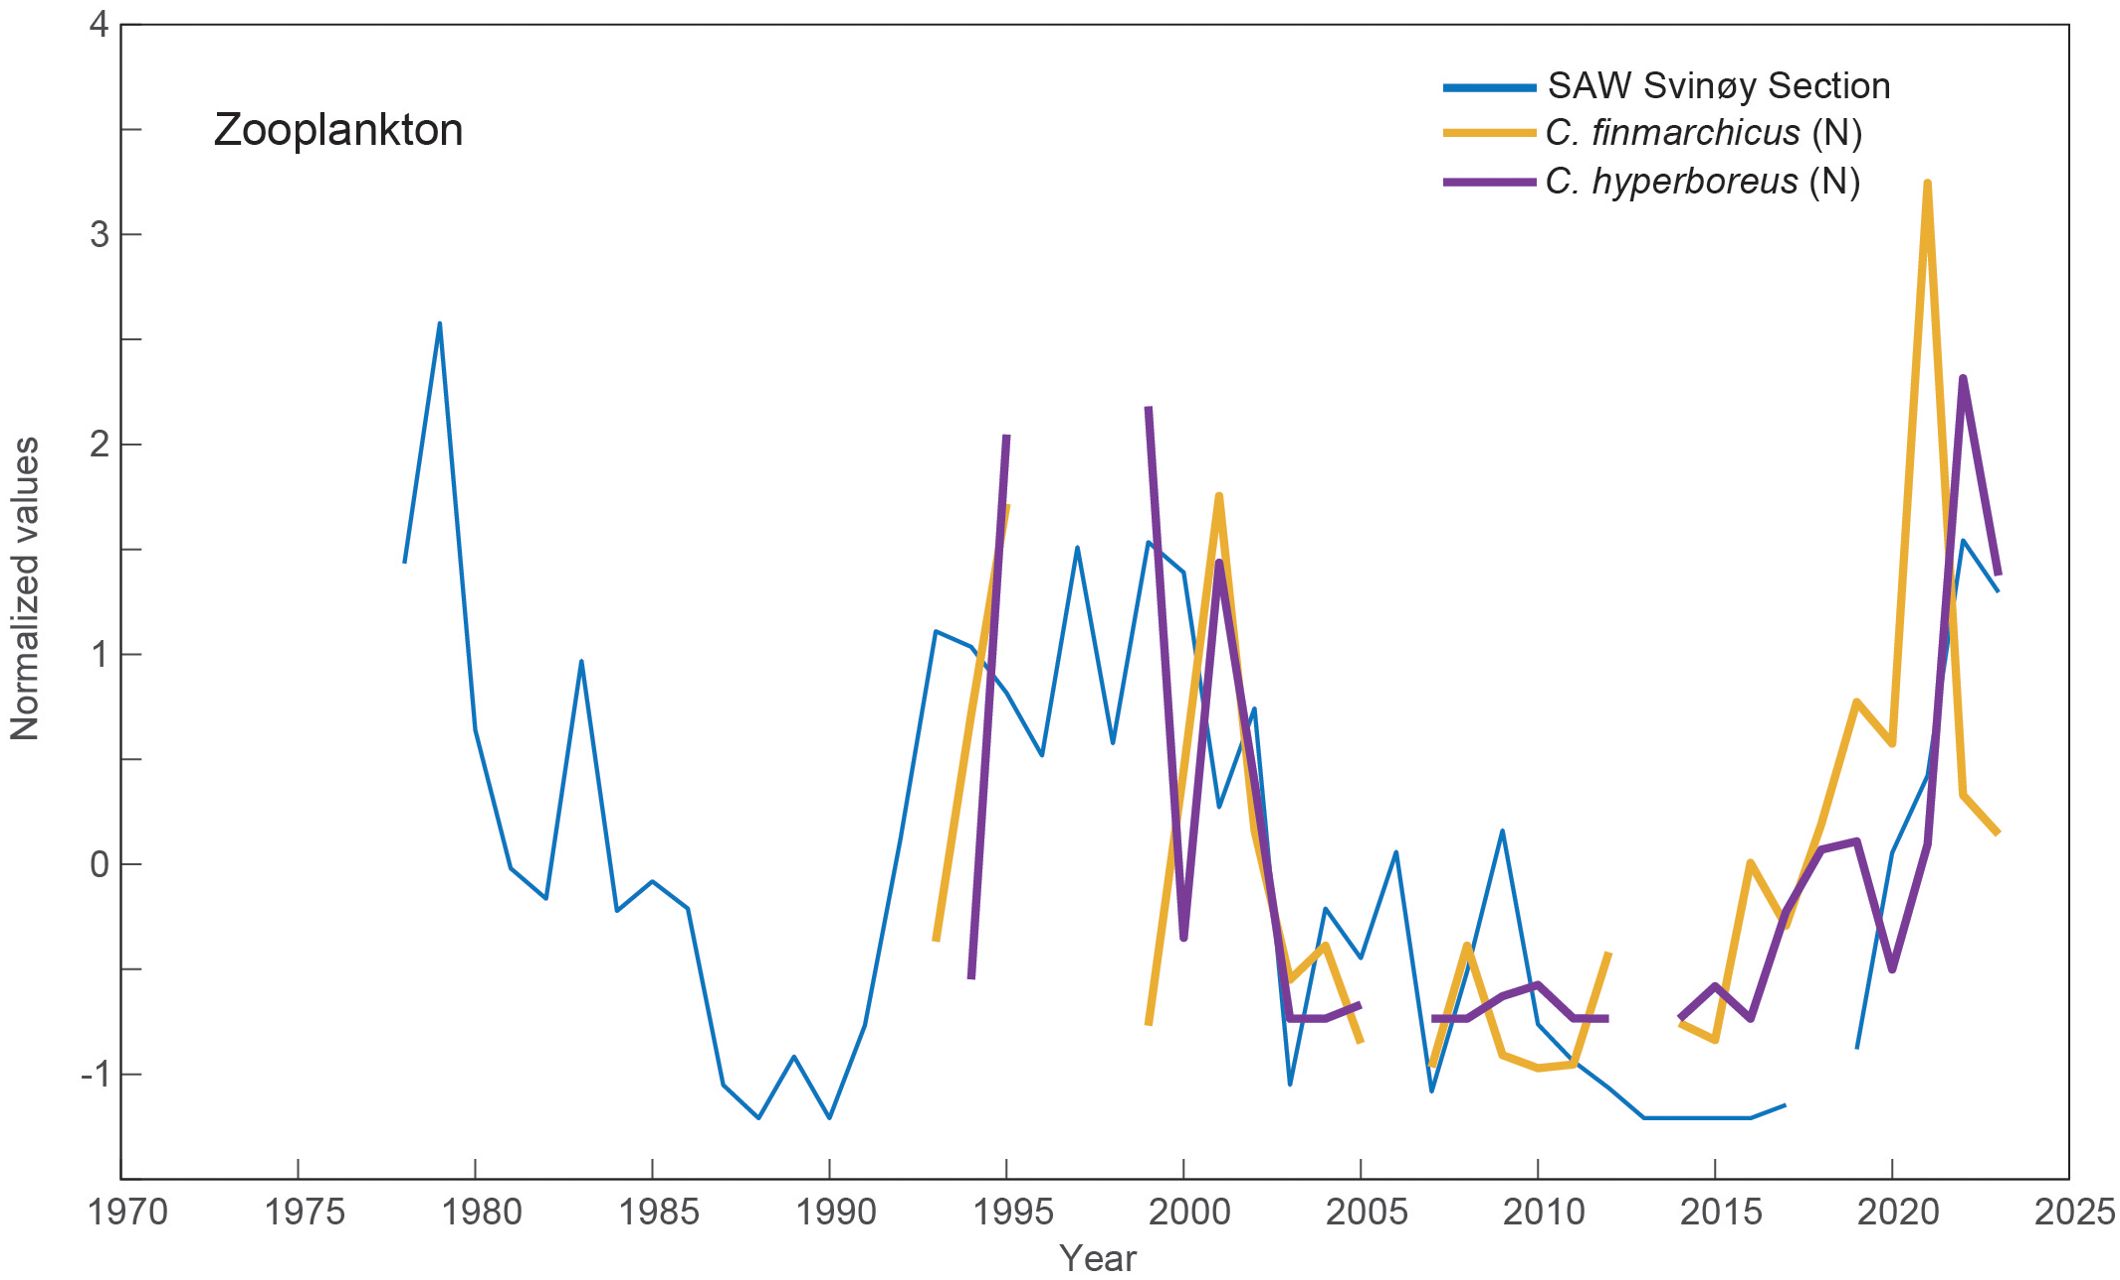
Figure 4. SAW volume in the southern Norwegian Sea and oceanic zooplankton, represented by the abundance of the subarctic calanoid copepods C. finmarchicus (large stages) and C. hyperboreus at the subarctic (northern) flank of Section N, in May.
3.4 Cod on the Faroe shelf
3.4.1 Recruitment
Peaks in cod recruitment (# 1-yr-old) occurring at 6- to 10-year intervals are clearly linked to peaks in the 0-group length index (Figure 5A), which represent the biological production on the Faroe shelf (Jacobsen et al., 2019; Olsen et al., 2025). The recruitment peaks in 1973-1974, 1994, 2000, 2009, and 2017 align precisely, while the recruitment peak in 1982 precedes the 0-group peak by a year, and the small recruitment peak in 1988 follows the 0-group peak by a year (Figure 5A).
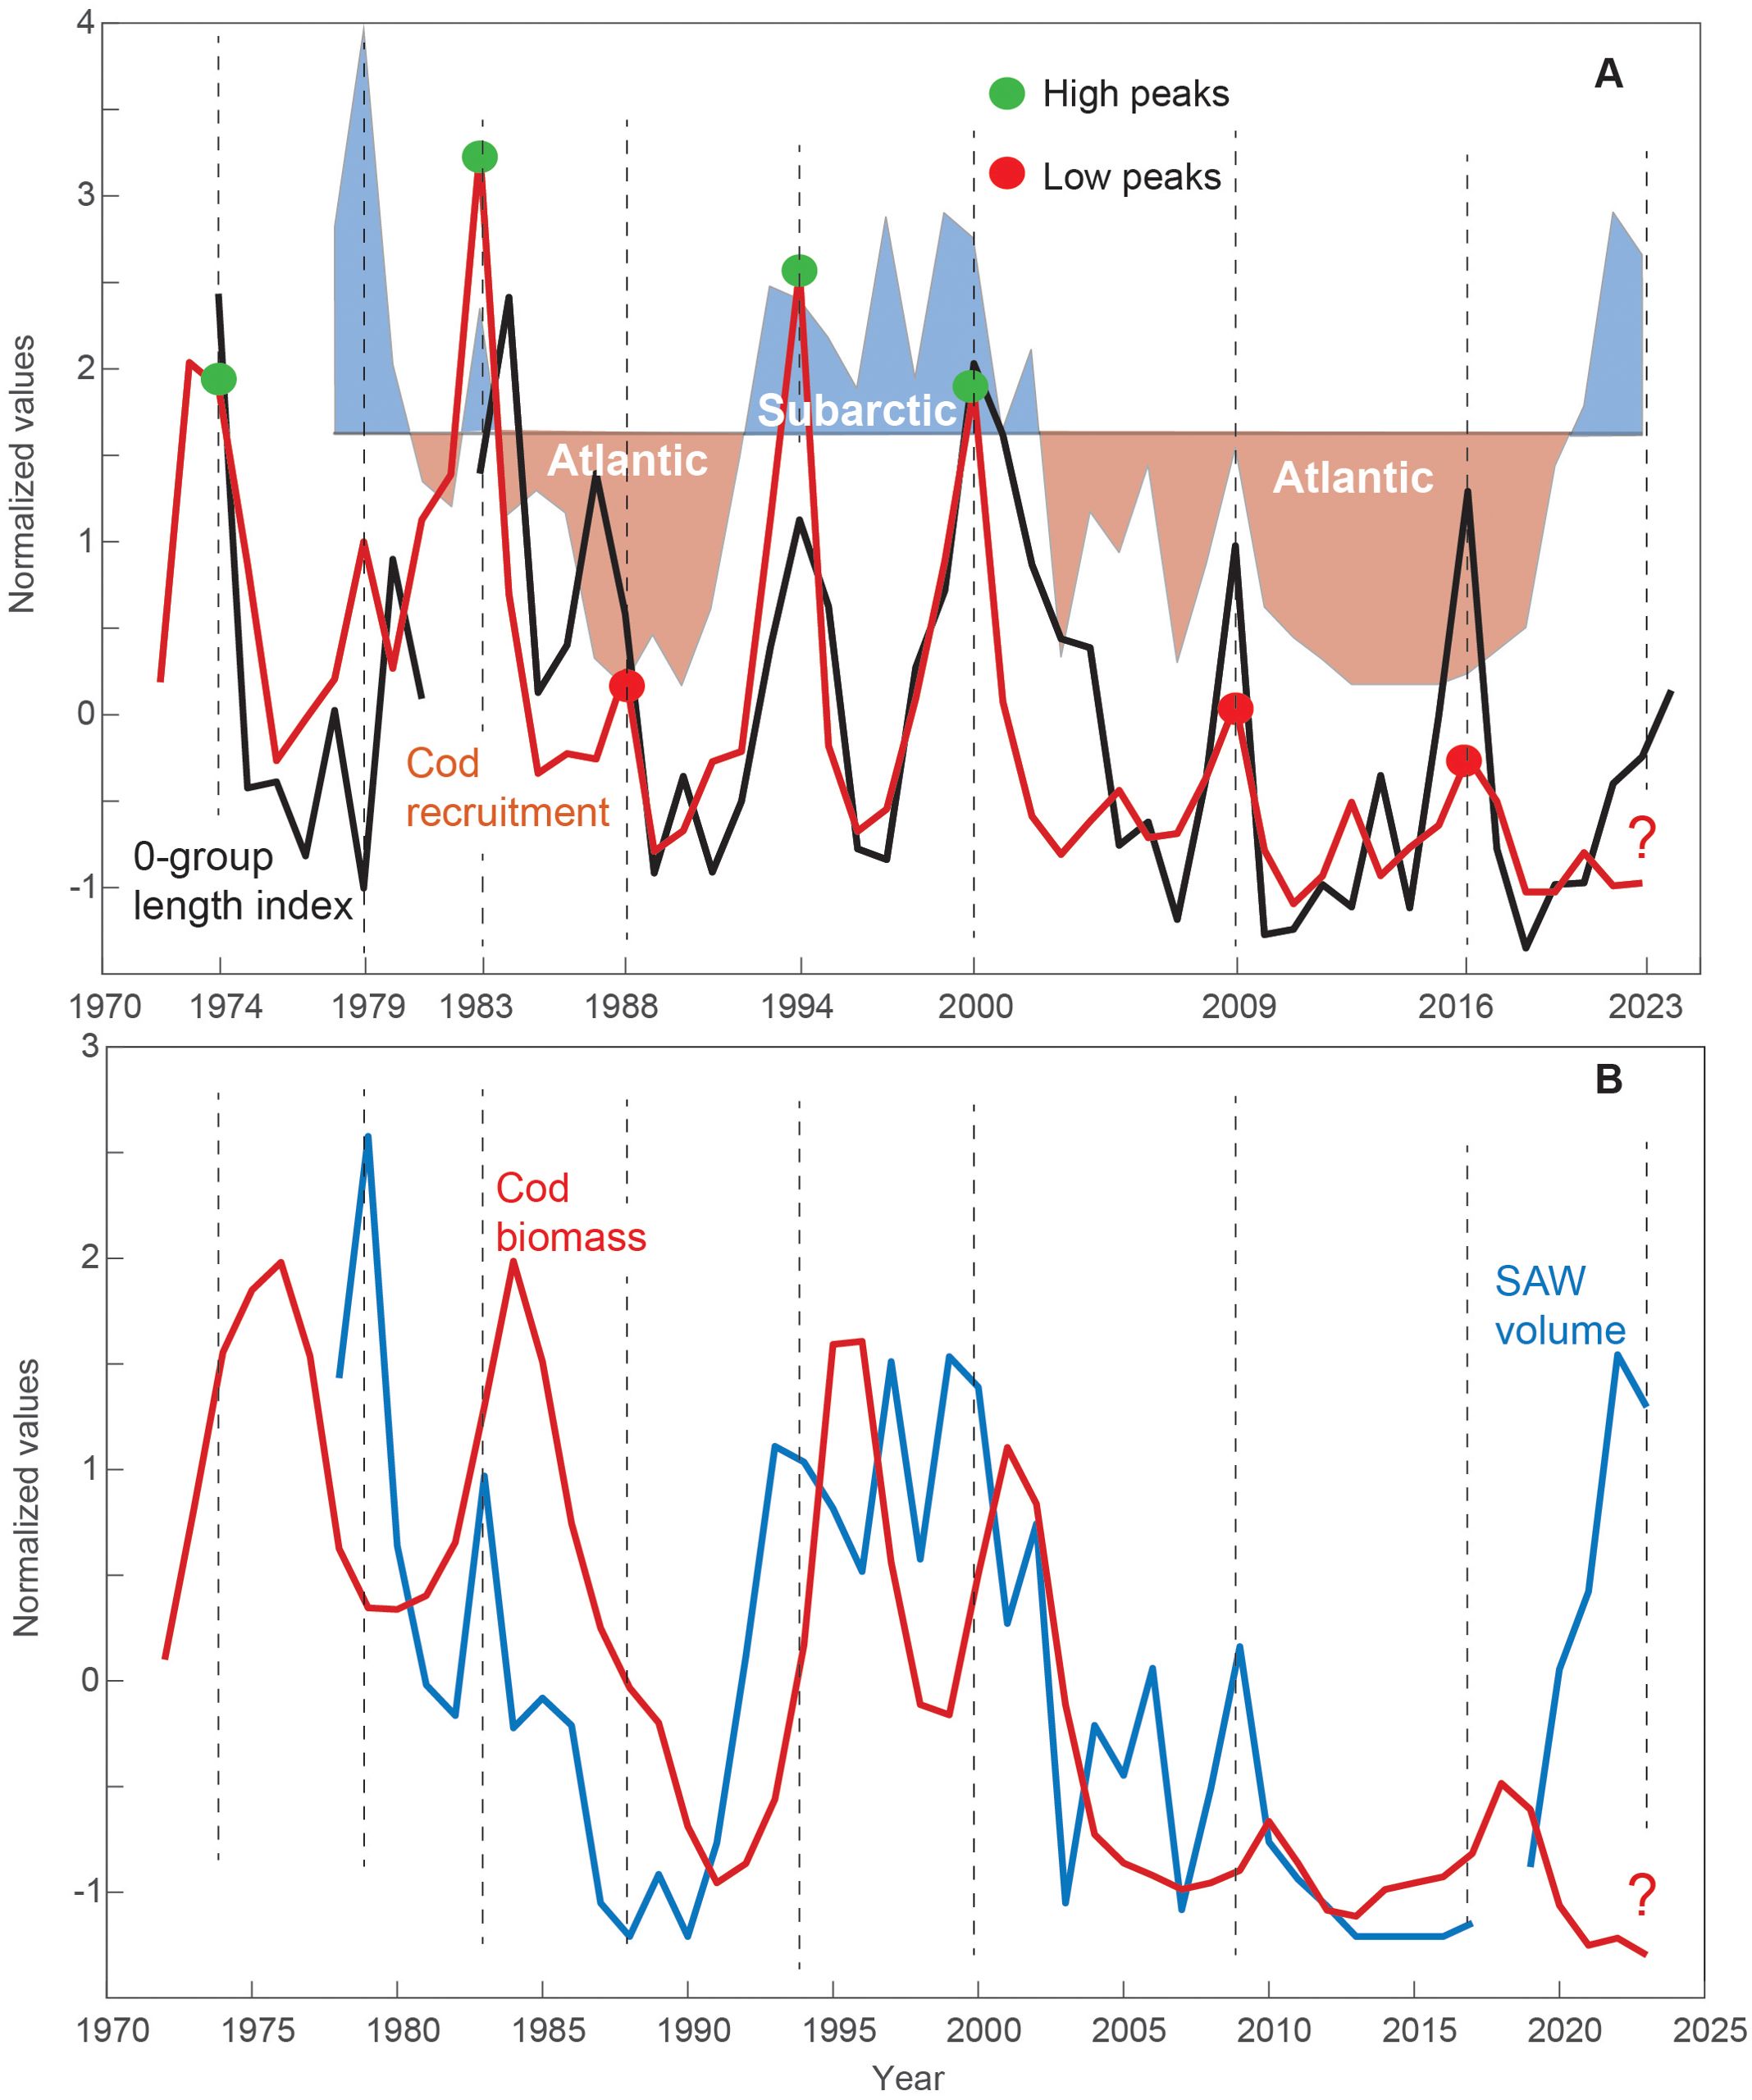
Figure 5. The Faroe cod stock and ecological drivers. (A) Cod recruitment (red line), the 0-group length index (black) and the SAW volume at the Svinøy section (c.f. Figure 3B), divided into Subarctic (blue shades) and Atlantic periods (red shades), based on a selected empirical threshold. Green and red dots emphasize high and low recruitment peaks, respectively. (B) Cod biomass (red) and the SAW volume (blue). The timing of cod recruitment peaks is emphasized with vertical dashed lines, in both panels. The question mark in the 2020s refers to the discussed event of a small cod stock, despite the recent subarctic conditions.
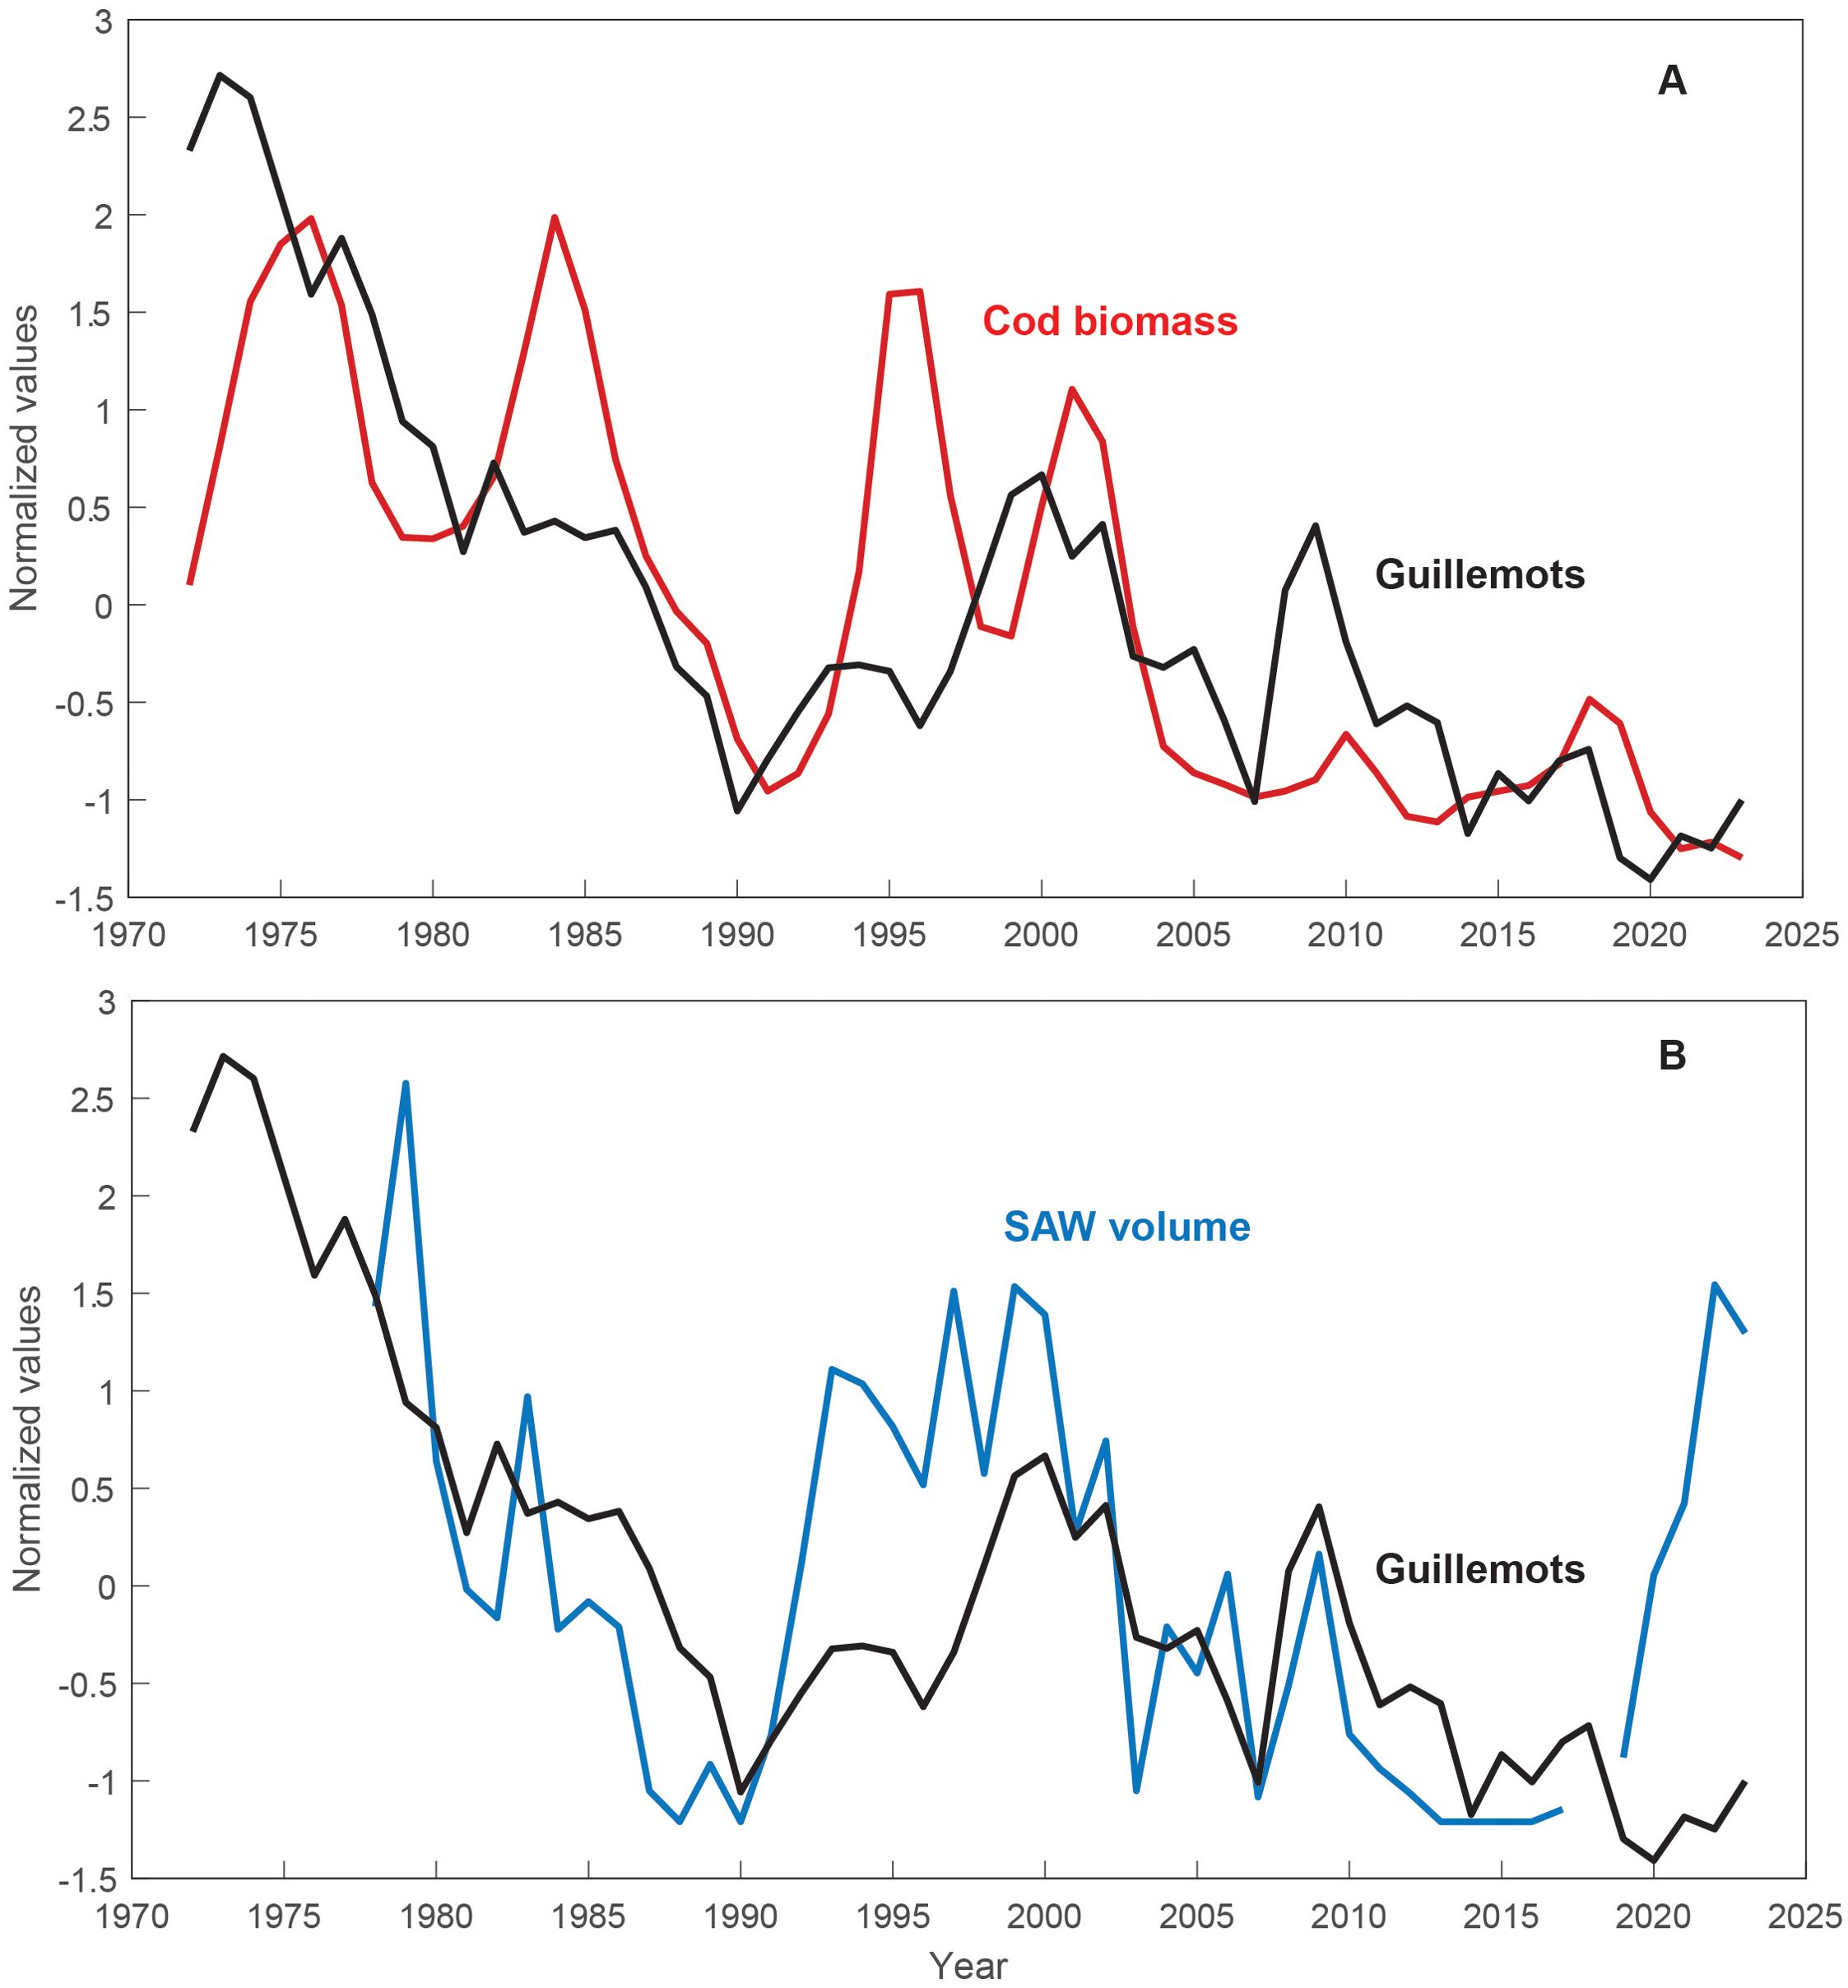
Figure 6. Attendance of guillemots in the Faroe Islands against: (A) the Faroe cod biomass and (B) the SAW volume indicator from the Svinøy section.
However, the recruitment peak magnitudes vary much more than the peaks in the 0-group length index. The high recruitment peak in 1982 coincided with large volumes of SAW, and the high peaks in 1994 and 2000 were preceded by peaks in SAW volume in the previous years (1993 and 1999, respectively). The three low peaks in 1988, 2009, and 2017 correspond to Atlantic periods with low SAW volumes (Table 1). The year 1979, with very large SAW volumes, resulted in a low recruitment peak, although the 0-group length index was very low (Figure 5A). These findings qualitatively support our theoretical framework (visual assessment), except for the 2020s increase in SAW volume and recently elevated 0-group length index (2023-2024), that is not yet evident in the cod recruitment estimates (which are relatively uncertain for recent years, see Discussion).
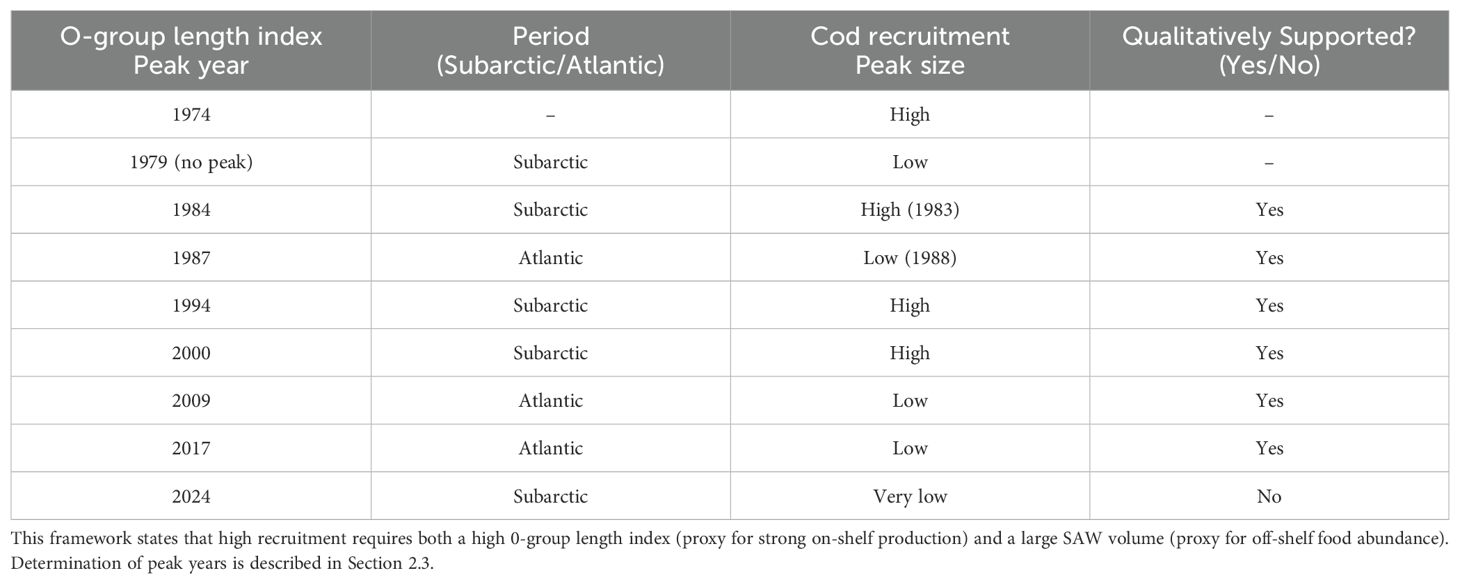
Table 1. Qualitative assessment of the theoretical framework.
3.4.2 Biomass
Strong recruitment peaks lead to peaks in total cod biomass after a lag of 1-3 years (Figure 5B). The biomass declined rapidly after these peaks, and the lack of strong recruitment peaks in the late 1980s and after the early 2000s resulted in strong declines in cod biomass in the late 1980s/early 1990s and after 2004. Although direct correlations between cod biomass and SAW volume are not high (r = 0.40, p = 0.01, at 1-year lag. Potential lags: 0-2 years, SAW volume leading), high SAW volumes (Subarctic periods) are associated with large biomasses, while low SAW volumes (Atlantic periods) correspond to reduced biomasses. The only exception occurs in the 2020s, when the SAW volume has been very high, while the cod stock has remained very small.
3.5 Guillemots
The biomass of the Faroe cod stock and the attendance of guillemots, proxied by the counts at Høvdin, have correlated during the last half century (Figure 6A) (r = 0.66, p < 0.001, at 0-year lag). A clear negative trend exists in both records, primarily induced by the marked cod and guillemot declines during the late 1980s and early 2000s (Olsen et al., 2025). Peaks in guillemot attendance roughly coincide with cod recruitment peaks, which lead the cod stock size. The guillemot attendance follows the volume of SAW from the late 1970s to immediately before the post-2017 increase (Figure 6B) (r = 0.66, p < 0.001, at 0-year lag). The 1970s-to-1990 and early 2000s declines, and the 1990s increase are evident in both records, and even shorter-term variability aligns; e.g. a ‘plateau’ during the early 1980s and peaks around 1993-1995, 1999-2000, and 2008-2009. However, there exists a strong contrast during the 2020s, when guillemot counts remained very low despite the SAW increase, comparable to the cod stock (Figure 5B). Including the 2020s, the correlation drops to 0.45 (p = 0.01).
3.6 Cod on the Faroe Bank
The cod stock on the Faroe Bank, located immediately west of the Faroe Plateau (Figure 1), is included to provide a broader spatial perspective. The cod stock size, here proxied by the CPUE of cod in both March and September show increases in the 2020s (Figure 7). The March records shot up in 2020, while the September record soared in 2021. The apparent link to the SAW volume record has also persisted back in time, with low and declining CPUE during the late 1980s, high CPUEs in the late 1990s and early 2000s, and a rapid drop after 2003.
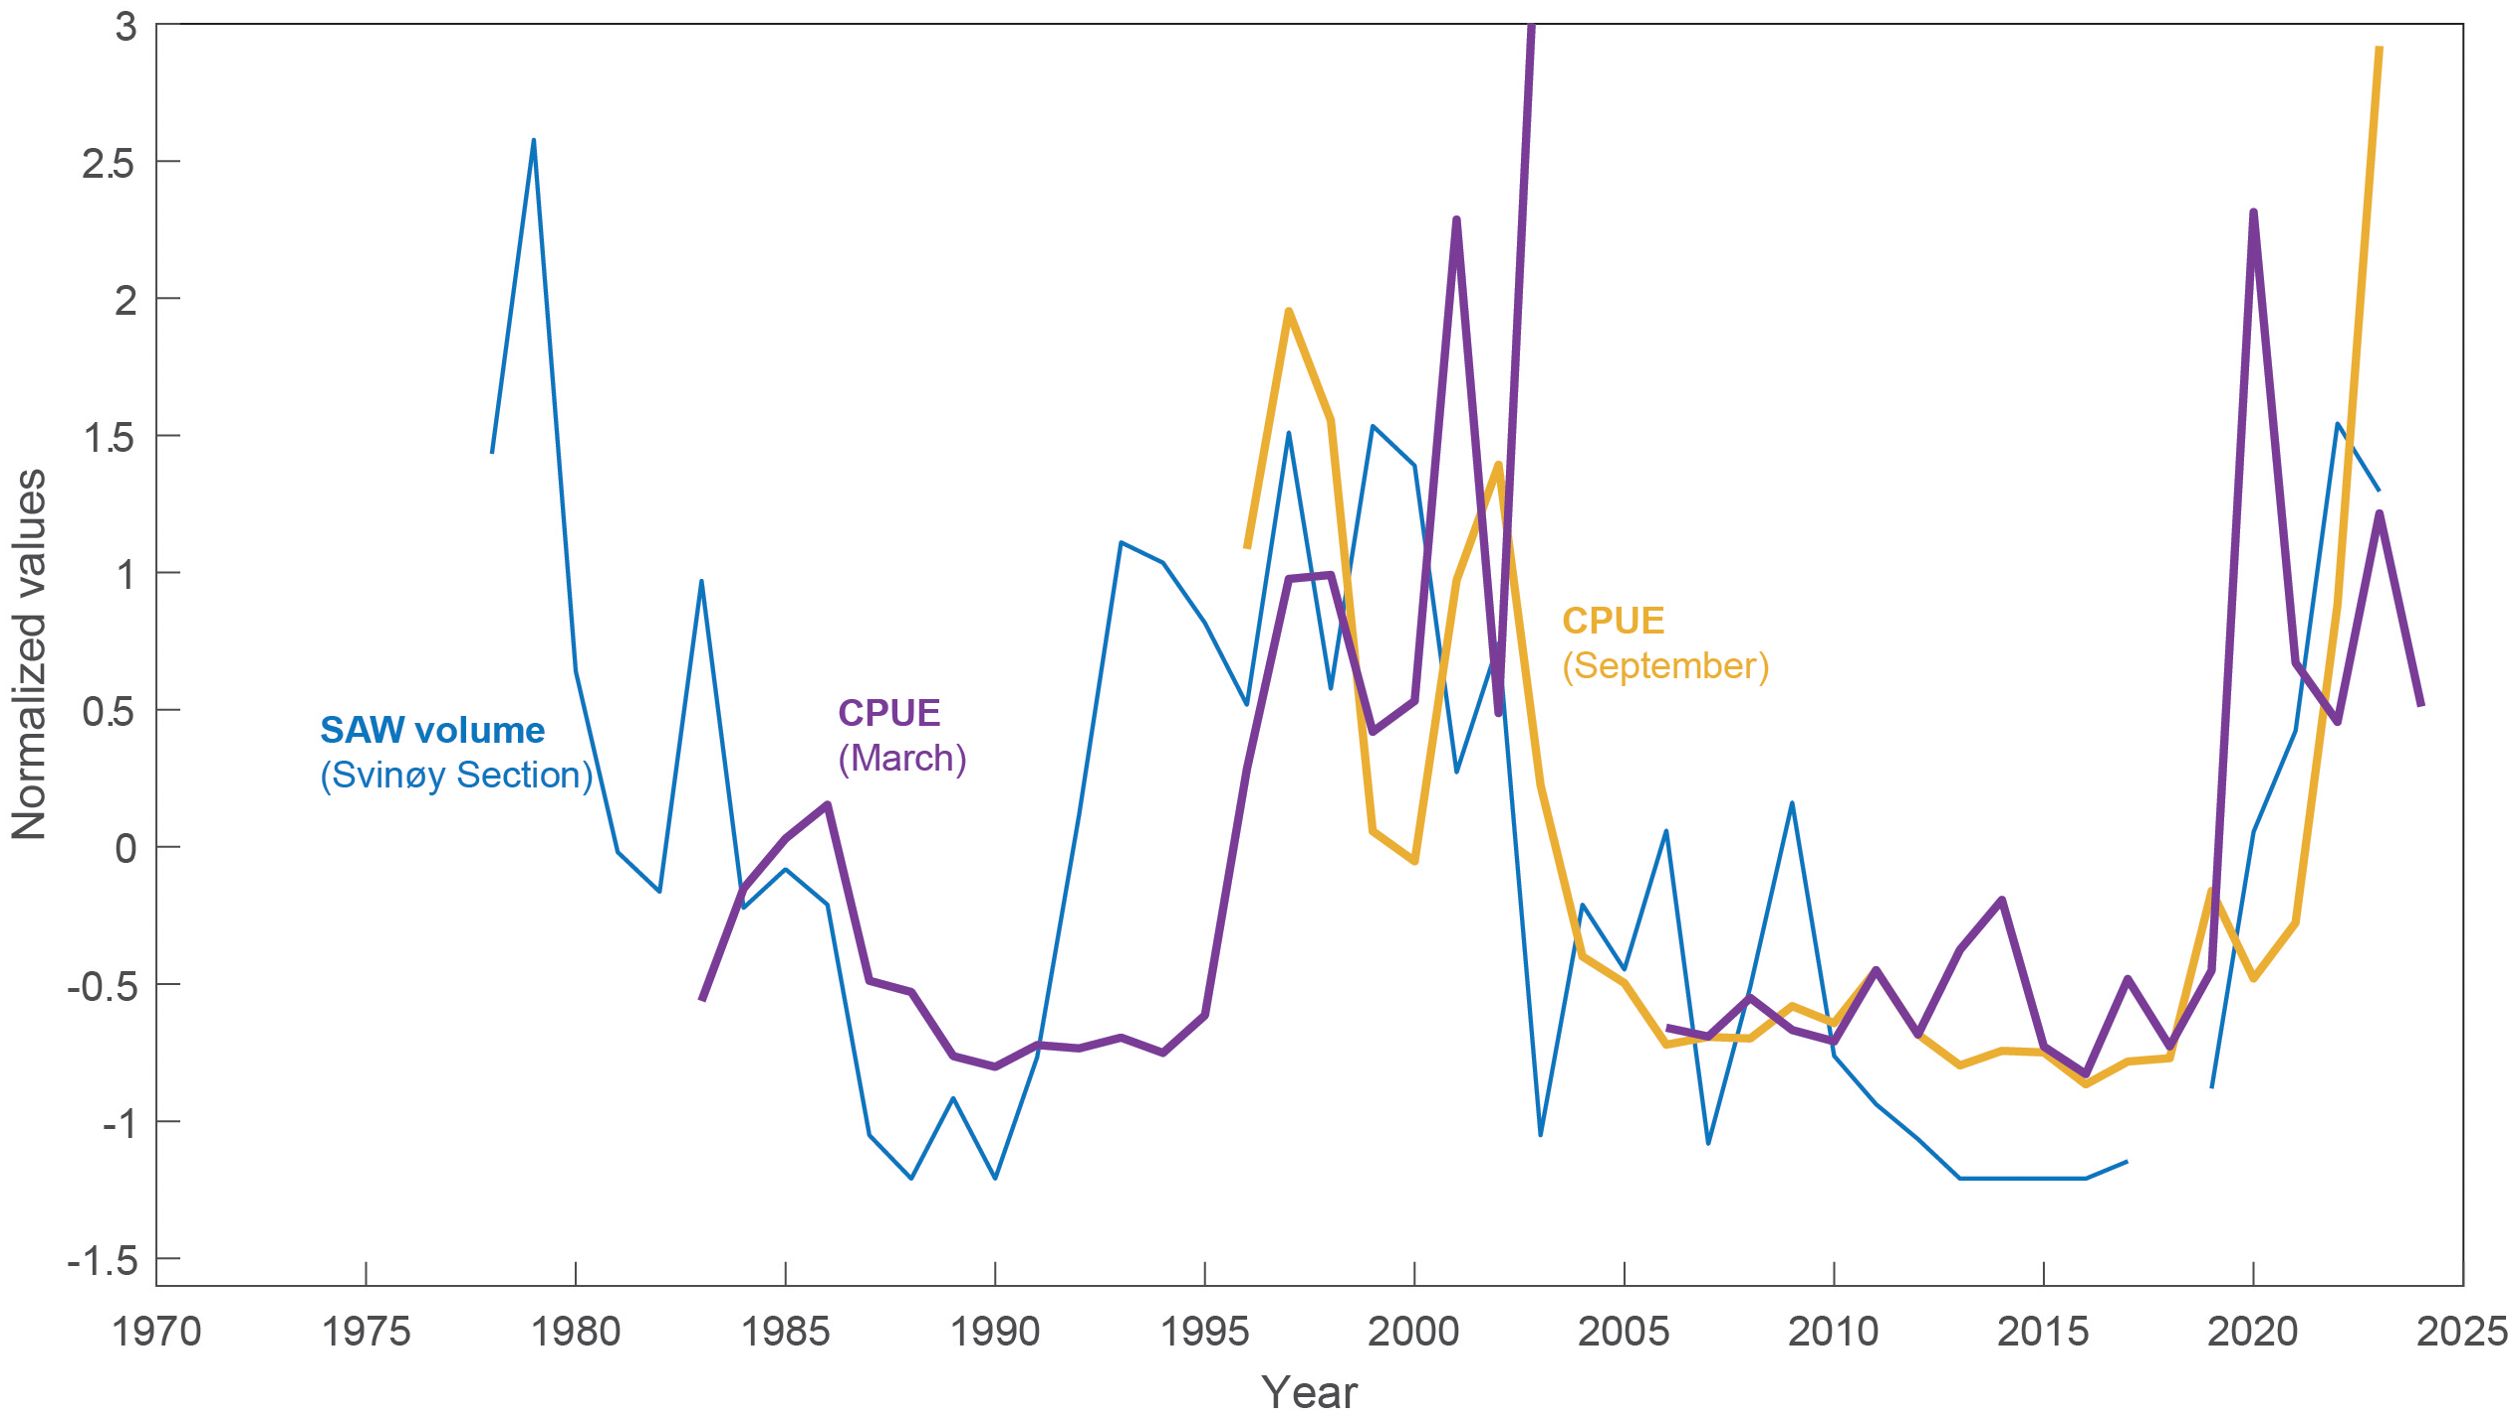
Figure 7. The cod stock size on the Faroe Bank, proxied by the Catch Per Unit Effort (CPUE) in March and September, respectively, and the SAW volume indicator from the Svinøy section.
4 Discussion
Acknowledging that fishery and hunting impact Faroe cod stock size and Faroese guillemot abundance, respectively, we explore a bottom-up perspective in this study. Our aim is to introduce a new theoretical framework, that biomass of higher trophic levels on the Faroe shelf is influenced by both on-shelf production and the import of off-shelf food resources. The data presented support the validity of this perspective, although our aim is not to provide definite conclusions. We encourage the development of more specific, testable hypotheses, that build on this framework.
The off-shelf food resources are in this framework related to the volume of SAW in Faroese waters, derived from both the SPG and the Icelandic tongue. In this initial presentation, we mainly focused on SAW from the Icelandic tongue, while the 0-group length index serves as the on-shelf production indicator. Despite this oversimplification, the framework can qualitatively describe three key aspects of the Faroe ecosystem: variability in Faroe shelf cod stock recruitment, biomass development of both the Faroe shelf and Faroe Bank cod stocks, and guillemot attendance at Faroese seabird cliffs. We acknowledge, however, that a realistic representation of stock development for cod and guillemots must involve top-down pressures (including fishery and hunting) and likely several environmental drivers not included here, for example declining silicate levels (Hátún et al., 2017), increasing temperature and regional/local processes.
We show that a rapid ‘subarctification’ in the southern Norwegian Sea in the 2020s resulted in a dramatic increase in subarctic zooplankton abundance north of the Faroes in May, which supports the previous hypothesis (Kristiansen et al., 2019; Skagseth et al., 2022) that a variable influx from the Icelandic tongue regulates the zooplankton community in the southern Norwegian Sea. Our SAW volume indicator therefore likely represents fundamental aspects of the marine environment and ecosystems in these waters. It should be noted that the total zooplankton dry weights at the north of the Faroes (Section N) in May increased more gradually than the copepod counts (Figure 4 and Figure S2, in the SOI). Since dry weight is used as an indicator for the Norwegian Sea (https://www.ices.dk/community/groups/Pages/WGINOR.aspx), the causes of this discrepancy should be further investigated.
Our new theoretical framework can, in a mechanistic way, explain why seemingly favorable on-shelf conditions do not always translate to high adult cod stock numbers. The weaker-than-expected cod recruitment peaks (1987-1988, 2008-2009 and 2016-2017) coincided with Atlantic conditions, characterized by small SAW volume and, by inference, limited ocean-to-shelf food supply throughout the year.
The tight synchrony between the cod recruitment record (#1-year-olds) and the 0-group length index suggests that the feeding conditions of 1-year old cod are a bottleneck for recruitment to the adult stock. The 0-group length index is composed of data from the cod, haddock, Norway pout and sandeel stocks, where the sandeel biomass likely plays a critical trophic role. Predation from cod on the other species, including cannibalism, should however also be considered. The high recruitment peaks in 1994 and 2000 were preceded by both very high SAW volumes (Figure 5A), and by increased numbers of juvenile cod the year before (i.e., 1993 and 1999; see Olsen et al. (2025), their Figure 4). The high recruitment peak in 1983 was also preceded by high numbers of juveniles, while the SAW volume coincided; the SAW peak occurred in 1983 and was at near average values in 1982 (Figure 5A). Our knowledge of the first year of Faroe cod is limited by data scarcity, and the trophic pathways of how onto-shelf advection can impact cod’s living conditions through their first year are manifold, including hydrographic conditions, fluxes of nutrients, zooplankton and higher trophic level biomass. The presented results suggest that this first preconditioning year is associated with intensifying influence from the SPG (Figure 2) and/or the Icelandic tongue (Figure 5), and the following bottleneck year coincides with maximum influence from these SAW sources. Guillemots are known for their ability to dive deep (up to 150-200 meters) to catch prey, making them efficient marine hunters, but their prey size is generally limited to smaller fish species (e.g., sandeel, capelin (Mallotus villosus) and juvenile cod; Piatt and Nettleship, 1985). This seabird species feeds both on and off the Faroe shelf (Olsen et al., 2025), and thus also over regions directly influenced by the SAW. However, elaborating on this bottom-up trophic cascade is beyond the scope of the present work.
Although the SAW volume indicator and cod biomass are not strongly correlated, they share important characteristics; low SAW volumes and low recruitment peaks quickly resulted in major declines in the cod stock biomass in the late 1980s and after 2000. Excluding the 2020s peaks in the SAW volume, both series clearly show a negative trend, and it is evident that Subarctic periods have historically led to higher biomasses, while Atlantic periods result in reduced biomasses.
Furthermore, a correlation between cod biomass and guillemot attendance in the Faroes enables us to use the guillemot record as an assessment-independent indicator for the cod stock. A major decline in Faroe guillemot attendance, which started in the 1960s (Olsen et al., 2025), has continued since the early 1970s, with significant decreases in the late 1980s and early 2000s (Figure 6), and Olsen et al. (2025) discussed both drops in light of reduced winter convection in the Labrador-Irminger Seas, a weakened subpolar gyre and reduced silicate levels and krill abundance in large parts of the subpolar North Atlantic. Regarding the early 2000s drop. Olsen et al. (2025) furthermore mentioned the concurrent reduction in SAW volume from the Icelandic tongue. Our findings strengthen the proposition of a link between the guillemot numbers and the SAW volume, which even could help explain persistent guillemot decline from the 1970s to 1990 (Figure 6B).
Excessive fishing and bird hunting pressure have certainly contributed to the cod and guillemot declines, but these cannot account for the increased guillemot attendances during the 1990s and the peak in 2008-2009, nor the good cod recruitment during the decade 1995-2005. This suggests that our new bottom-up perspective should be considered as well, and that this could contribute to more rational management of these resources.
Counterintuitive to our framework is that the Faroe shelf cod stock and guillemot attendance have apparently not reacted to the 2020s increase in SAW volume and increased abundance of oceanic subarctic copepods. However, this 2020s discrepancy does not necessarily invalidate our new theoretical framework. Signs of Faroe Bank cod recovery were already evident by 2019, when groundfish surveys began detecting an increase in the stock biomass (ICES, 2024). This stock has since surpassed the previously observed peaks of the 1990s and early 2000s (ICES, 2024). Age structure analyses indicate that this recovery is largely driven by strong year classes from 2015–2018 (Salter et al., in prep.), though this cohort was not clearly reflected in survey estimates until after 2019, possibly due to underrepresentation of younger ages in survey. The rapid decline of cod biomass on the Faroe Bank in the early 2000s was likely caused by a combination of excessive fishing pressure and decreased SAW volume. And between 2008 and 2021, the Faroe Bank (< 200 m) was entirely closed to commercial fishing, with the exception of a limited longline fishery.
Relationships between the 0-group length index, the SAW volume and haddock recruitment are similar to the cod linkages back to the late 1970s (Figure S3). And the Faroe shelf haddock recruitment did indeed improve during the Faroe shelf production peak in 2016-2017, and the biomasses of both the Faroe shelf and the Faroe Bank haddock biomass increased after the 2016-2017 event and especially into the 2020s (Figures S3, S4). Furthermore, some seabird species have experienced improved conditions on the Faroe shelf after 2015 [e.g. Faroe puffins (Fratercula arctica) and kittiwakes (Rissa tridactyla); (Olsen et al., 2025)].
Based on the rapid intensification of the SPG after 2015 (Figure 2, and see Hátún and Chafik, 2018), and its potential to increase ocean-to-shelf fluxes of nutrients (Eliasen et al., 2017; Hátún et al., 2022a) and zooplankton (Jacobsen et al., 2025, 2022, 2019), Hátún et al. (2016) anticipated increased biological productivity on the shelves adjacent to the SPG after 2014. The biological signals observed on the Faroe Bank and Faroe shelf support this projection. Similar to the linkage between SPG dynamics and zooplankton biomass on the south Iceland shelf (Hátún et al., 2016), we suggest that the correlation between peaks in the gyre index and the 0-group length index (Figures 2, 5) could strengthen a causal understanding of the Faroe shelf production peaks.
The Faroe Bank is most directly impacted by the SPG, while the relative influence of SAW from the SPG and the Icelandic tongue, respectively, on the Faroe shelf is more difficult to disentangle. Our metrics of SAW from these two sources may not be completely independent. The SPG regulates the water properties in the Atlantic inflows, both those flowing past the Faroe Plateau [Figure 2 and Larsen et al. (2012)] and those flowing north through the Denmark Strait (Hátún et al., 2005). When diluted by variable winter convection and mixing between Atlantic and polar water masses north of Iceland (Malmberg and Valdimarsson, 2003), a lagged SPG-induced hydrographic signal could reach the Icelandic tongue and even become integrated into our SAW volume indicator (which is based on temperature and salinity thresholds, Section 2.1.2). However, our SAW volume indicator primarily represents the amount of Icelandic tongue water reaching the Faroe slope, which is regulated by regional processes, such as the Norwegian Sea gyre circulation (Hátún et al., 2021).
The amount of drift-ice exported south through the Fram Strait and transported in the East Greenland Current declined after 2003 (Sumata et al., 2023), and virtually disappeared after 2015, which led to an ecological regime shift in slope areas of southeastern Greenland (Heide-Jørgensen et al., 2023). A recent study, however, shows a marked increase in southward freshwater fluxes from the Fram Strait in 2020 (de Steur, personal communication), and the sea-ice cover farther south has increased thereafter. While Dickson et al. (1988) linked such ‘Great Salinity Anomalies’ (reduced salinity) to reduced biological production north of Iceland, we suggest that such anomalies can contribute to increased SAW volumes, and associated increased biological production, in Faroese waters.
So why have the Faroe shelf cod stock and the guillemot colonies not increased again in the 2020s? A first plausible explanation is that intense fishery has reduced this cod stock to levels too low for recovery, consequently impacting the guillemot population more severely than other seabird species (such as puffins and kittiwakes). The fishing ban on the Faroe Bank in 2008, and the Faroe Bank cod recovery after 2015, support this explanation. A second reason is that the total volume of SAW surrounding the Faroe shelf might be less than apparent from the SAW indicator from the Icelandic tongue alone, since the SPG weakened again after 2016 (Figure 2). A third cause could be found in other environmental drivers beyond the SAW volume from the Icelandic tongue and the SPG, for example the long-term decline in pre-bloom silicate concentrations in the Atlantic water passing the Faroe Plateau (Hátún et al., 2022a, 2017), may have impacted the cod-guillemot trophic pathway more severely than it did other trophic paths. Although marine scientists often, too one-sidedly, associate environmental drivers with seawater temperature (Edwards et al., 2021), we do not consider temperature as the sole driver of the discussed trends. While the unproductive Atlantic period (2004-2014) was associated with high temperatures, the highly productive period of the late 1950s-early 1960s experienced comparably high temperatures (Larsen et al., 2008). Correlations between the presented biological time series and temperature are, furthermore, not significant. A fourth possibility is that an anticipated increase in cod recruitment has indeed taken place around 2023-2024, but this remains not yet evident in the assessment records, given that the cod recruitment estimate is uncertain for the most recent 2-3 years (Beverton and Holt, 1993). Under this scenario, we should expect an increase in cod biomass and guillemot attendance during the coming year(s).
Similar conditions to the early 2020s occurred in the early 1990s; SAW volume reached a high level in 1993, followed by high on-shelf production (proxied by the 0-group length index) in 1994 (Figure 5). Cod, spawned in 1993, recruited very well in 1994, and cod biomass rose from 1991 levels, which were comparable to current very low estimates, to very high values in already 1995 and 1996 (Figure 5B). Notably, due to poor fishery in the late 1980s-early 1990s, the Faroe Islands went bankrupt and the fishing fleet was largely dismantled in the early 1990s, resulting in very low fishing pressure (ICES, 2024), which likely has helped this rapid recovery. The 1990s experienced major fisheries management challenges and deteriorated trust between fishing industry and the scientific community, which underscores the critically importance of closely monitoring the present ecological development in Faroese waters. Our framework could potentially also help understanding trends in neighboring shelf ecosystems.
5 Conclusions
Ecological changes on the Faroe shelf have previously been discussed in relation to primary production on this shelf. These earlier studies provided foundational insights into the ecosystem’s dynamics, and their explanation model primarily explains the marked production peaks, recurring in this system at 6- to 10-year intervals. By including oceanic food abundance, represented by the volume of subarctic water masses around the Faroe Plateau, our new theoretical framework enables the explanation of longer-term trends that also characterize this ecosystem. This expanded approach offers a more comprehensive understanding of the ecosystem’s complex temporal dynamics, and can support improved management of marine resources. Multiple hypothesis inference could be a strategy to get closer to a truly evidence-based understanding of the drivers of the Faroe shelf ecosystem. This would involve formulating statistical models that are related to different hypotheses, which could be evaluated, ranked, and some rejected. A priority area of research enabling this approach should be on how advection of nutrients and prey from the open ocean subsidize local production, both on the Faroe shelf and on the Faroe Bank. Key questions are: what is advected, where (both geographically and vertically in the water column), during which season, and how does this vary between years? What are the relative roles of seawater temperature per se, local primary production, and the onto-shelf nutrient and food advection, respectively?
Data availability statement
The original contributions in the study are included in the article/Supplementary material (Table S1). Further inquiries can be directed to the corresponding author/s.
Ethics statement
The study involves bird counts (from a distance), and data from fisheries. An ethical approval for this activity is not required in the Faroe Islands.
Author contributions
HH: Writing – original draft, Visualization, Conceptualization, Writing – review & editing, Methodology. JD: Data curation, Writing – review & editing. BO: Resources, Writing – review & editing, Data curation. SJ: Visualization, Writing – original draft, Writing – review & editing, Conceptualization, Data curation, Methodology. HV: Conceptualization, Data curation, Writing – review & editing. IK: Visualization, Writing – review & editing, Data curation. KL: Data curation, Resources, Writing – review & editing, Funding acquisition. EG: Writing – review & editing, Data curation. IS: Validation, Methodology, Writing – review & editing. PS: Data curation, Writing – review & editing, Methodology, Resources. KM: Visualization, Data curation, Writing – review & editing, Resources.
Funding
The author(s) declare financial support was received for the research and/or publication of this article. Faroe Marine Research Institute has allocated resources for monitoring hydrography, plankton, juvenile fisheries and seabirds in the Faroese region over the past half decade. This monitoring program is based on permanent governmental funding, and a broad selection of scientific projects. HH work was, additionally, supported by the MARiNAO project, Si-4-Eco (grant no. 8018).
Acknowledgments
The current and previous research staff of the Faroes Marine Research Institute (FAMRI) and the Marine Research Institute (IMR), including the crew aboard the research vessels, are also acknowledged for their dedicated field data collection. We thank Regin Olsen for performing the guillemot counts since 2017, and for proofreading.
Conflict of interest
The authors declare that the research was conducted in the absence of any commercial or financial relationships that could be construed as a potential conflict of interest.
Generative AI statement
The author(s) declare that no Generative AI was used in the creation of this manuscript.
Any alternative text (alt text) provided alongside figures in this article has been generated by Frontiers with the support of artificial intelligence and reasonable efforts have been made to ensure accuracy, including review by the authors wherever possible. If you identify any issues, please contact us.
Publisher’s note
All claims expressed in this article are solely those of the authors and do not necessarily represent those of their affiliated organizations, or those of the publisher, the editors and the reviewers. Any product that may be evaluated in this article, or claim that may be made by its manufacturer, is not guaranteed or endorsed by the publisher.
Supplementary material
The Supplementary Material for this article can be found online at: https://www.frontiersin.org/articles/10.3389/fmars.2025.1662766/full#supplementary-material
References
Beverton R. J. H. and Holt S. J. (1993). On the Dynamics of Exploited Fish Populations (Dordrecht: Springer Netherlands). doi: 10.1007/978-94-011-2106-4
Cisewski B., Hátún H., Kristiansen I., Hansen B., Larsen K. M. H., Eliasen S. K., et al. (2021). Vertical migration of pelagic and mesopelagic scatterers from ADCP backscatter data in the Southern Norwegian Sea. Front. Mar. Sci. 7. doi: 10.3389/fmars.2020.542386
Dickson R. R., Meincke J., Malmberg S., and Lee A. J. (1988). The great salinity anomaly in the Northern North-Atlantic 1968-1982. Prog. Oceanogr. 20, 103–151. doi: 10.1016/0079-6611(88)90049-3
Dyck J. and Meltofte H. (1975). The guillemot (Uria aalge) population of the Faeroes 1972. Dansk Ornitol. Foren. Tidsskr. 69, 55–64.
Edwards M., Hélaouët P., Goberville E., Lindley A., Tarling G. A., Burrows M. T., et al. (2021). North Atlantic warming over six decades drives decreases in krill abundance with no associated range shift. Commun. Biol. 4, 1–10. doi: 10.1038/s42003-021-02159-1
Eliasen K., Reinert J., Gaard E., Hansen B., Jacobsen J. A., Grønkjær P., et al. (2011). Sandeel as a link between primary production and higher trophic levels on the Faroe shelf. Mar. Ecol. Ser. 438, 185–194. doi: 10.3354/meps09301
Eliasen S. K., Hátún H., Larsen K. M. H., and Jacobsen S. (2017). Faroe shelf bloom phenology – The importance of ocean-to-shelf silicate fluxes. Cont. Shelf Res. 143, 43–53. doi: 10.1016/j.csr.2017.06.004
Gaard E., Hansen B., and Heinesen S. P. (1998). Phytoplankton variability on the faroe shelf. ICES J. Mar. Sci. 55, 688–696. doi: 10.1006/jmsc.1998.0373
Gislason A. and Silva T. (2012). Abundance, composition, and development of zooplankton in the Subarctic Iceland Sea in 2006, 2007, and 2008. ICES J. Mar. Sci. 69, 1263–1276. doi: 10.1093/icesjms/fss070
Hamner W. M., Jones M. S., Carleton J. H., Hauri I. R., and Williams D. M. (1988). Currents on a windward reef face. Bull. Mar. Sci. 42, 459–479.
Hátún H., Azetsu-Scott K., Somavilla R., Rey F., Johnson C., Mathis M., et al. (2017). The subpolar gyre regulates silicate concentrations in the North Atlantic. Sci. Rep. 7, 14576. doi: 10.1038/s41598-017-14837-4
Hátún H. and Chafik L. (2018). On the recent ambiguity of the North Atlantic subpolar gyre index. J. Geophys. Res. Ocean. 2014, 1–5. doi: 10.1029/2018JC014101
Hátún H., Chafik L., and Larsen K. M. H. (2021). The norwegian sea gyre – A regulator of Iceland-Scotland ridge exchanges. Front. Mar. Sci. 8. doi: 10.3389/fmars.2021.694614
Hátún H., Larsen K. M. H., Eliasen S. K., and Mathis M. (2022a). “Major nutrient fronts in the northeastern Atlantic – from the subpolar gyre to adjacent shelves,” in Chemical Oceanography of Frontal Zones. (Berlin: Springer Nature). 97–141.
Hátún H., Lohmann K., Matei D., Jungclaus J. H., Pacariz S. V., Bersch M., et al. (2016). An inflated subpolar gyre blows life toward the northeastern Atlantic. Prog. Oceanogr. 147, 49–66. doi: 10.1016/j.pocean.2016.07.009
Hátún H., Payne M. R., Beaugrand G., Reid P. C., Sandø A. B., Drange H., et al. (2009). Large bio-geographical shifts in the north-eastern Atlantic Ocean: From the subpolar gyre, via plankton, to blue whiting and pilot whales. Prog. Oceanogr. 80, 149–162. doi: 10.1016/j.pocean.2009.03.001
Hátún H., Sandø A. B., Drange H., Hansen B., and Valdimarsson H. (2005). Influence of the Atlantic subpolar gyre on the thermohaline circulation. Science 309, 1841–1844. doi: 10.1126/science.1114777
Hátún H., Silva T. S. G., Skagseth Ø., and Grønkjær P. (2022b). Editorial: Physical drivers of biogeographical shifts in the Northeastern Atlantic – and adjacent shelves. Front. Mar. Sci. 9. doi: 10.3389/fmars.2022.1062204
Heide-Jørgensen M. P., Chambault P., Jansen T., Gjelstrup C. V. B., Rosing-Asvid A., Macrander A., et al. (2023). A regime shift in the Southeast Greenland marine ecosystem. Glob. Change Biol. 29, 668–685. doi: 10.1111/gcb.16494
Helland-Hansen B. and Nansen F. (1909). The Norwegian Sea - Its Physical Oceanography Based Upon the Norwegian Researches 19001904 (Kristiania: Det Mallingske Bogtrykkeri).
Jacobsen S., Gaard E., and Hátún H. (2022). Declining pre-bloom calanus finmarchicus egg production adjacent to two major overwintering regions in the Northeastern Atlantic. Front. Mar. Sci. 6, 9. doi: 10.3389/fmars.2022.822978
Jacobsen S., Gaard E., Hátún H., Steingrund P., Larsen K. M. H., Ólafsdóttir S. R., et al. (2019). Environmentally driven ecological fluctuations on the faroe shelf revealed by fish juvenile surveys. Front. Mar. Sci. doi: 10.3389/fmars.2019.00559
Jacobsen S., Vang H. B. M., Eliasen S. K., Húsgarð Larsen K. M., Gaard E., Grønkjær P., et al. (2025). Identifying a growth and survival bottleneck: oceanic zooplankton abundance and Faroe shelf primary production jointly influence the survival of Faroe Plateau cod larvae. J. Plankton Res. 47, 1–12. doi: 10.1093/plankt/fbaf018
Kristiansen I., Gaard E., Hátún H., Jónasdóttir S., and Ferreira A. S. A. (2016). Persistent shift of Calanus spp. in the southwestern Norwegian Sea since 2003, linked to ocean climate. ICES J. Mar. Sci. 73, 1319–1329. doi: 10.1093/icesjms/fsv222
Kristiansen I., Hátún H., Petursdóttir H., Gislason A., Broms C., Melle W., et al. (2019). Decreased influx of Calanus spp. into the south-western Norwegian Sea since 2003. Deep Sea Res. Part I Oceanogr. Res. Pap. 149, 103048. doi: 10.1016/j.dsr.2019.05.008
Larsen K. M. H., Hansen B., and Svendsen H. (2008). Faroe shelf water. Cont. Shelf Res. 28, 1754–1768. doi: 10.1016/j.csr.2008.04.006
Larsen K. M. H., Hátún H., Hansen B., and Kristiansen R. (2012). Atlantic water in the Faroe area: sources and variability. ICES J. Mar. Sci. 69, 802–808. doi: 10.1093/icesjms/fss028
Malmberg S. and Valdimarsson H. (2003). Hydrographic conditions in Icelandic waters 1990-1999, in: ICES Marine Science Symposia. ICES, 219, 50–60.
Melle W., Runge J., Head E. J. H., Plourde S., Castellani C., Licandro P., et al. (2014). The North Atlantic Ocean as habitat for Calanus finmarchicus: Environmental factors and life history traits. Prog. Oceanogr. 129, 244–284. doi: 10.1016/j.pocean.2014.04.026
Mork K. A., Skagseth Ø., Ivshin V., Ozhigin V., Hughes S. L., and Valdimarsson H. (2014). Advective and atmospheric forced changes in heat and fresh water content in the Norwegian Sea 1951-2010. Geophys. Res. Lett. 41, 6221–6228. doi: 10.1002/2014GL061038
Myksvoll M. S., Erikstad K. E., Barrett R. T., Sandvik H., and Vikebø F. (2013). Climate-driven ichthyoplankton drift model predicts growth of top predator young. PloS One 8, 1–9. doi: 10.1371/journal.pone.0079225
Olsen B. (1990). Metoder til optælling av lomvier Uria aalge i de færøske fuglefjelde. (Monitoring methods for guillemots Uria aalge in the Faroese bird cliffs). Zoological Museum, Copenhagen. 12, 1544866.
Olsen B., Anker-Nilssen T., Danielsen J., Gaard E., Hansen L. J., Jacobsen S., et al. (2025). Half a century of environmental variability and seabird trends on the Faroe Shelf in the North Atlantic Ocean. Front. Mar. Sci. doi: 10.3389/fmars.2025.1544866
Perkins H., Hopkins T. S., Malmberg S., Poulain P. M., and Warn-Varnas A. (1998). Oceanographic conditions east of Iceland. J. Geophys. Res. 103, 21531–21542. doi: 10.1029/98JC00890
Piatt J. F. and Nettleship D. N. (1985). Diving depths of four alcids. Ornithology. 102, 293–297. doi: 10.2307/4086771
Read J. F. and Pollard R. T. (1992). Water masses in the region of the Iceland faeroes front. J. Phys. Oceanogr. 22, 1365–1378. doi: 10.1175/1520-0485(1992)022<1365:WMITRO>2.0.CO;2
Skagseth Ø., Broms C., Gundersen K., Hátún H., Kristiansen I., Larsen K. M. H., et al. (2022). Arctic and atlantic waters in the norwegian basin, between year variability and potential ecosystem implications. Front. Mar. Sci. 9. doi: 10.3389/fmars.2022.831739
Skagseth Ø. and Mork K. A. (2012). Heat content in the norwegian sea 1995–2010. ICES J. Mar. Sci. 69, 826–832. doi: 10.1093/icesjms/fss026
Sumata H., de Steur L., Divine D. V., Granskog M. A., and Gerland S.. (2023). Regime shift in Arctic Ocean sea ice thickness. Nature 615, 443–449. doi: 10.1038/s41586-022-05686-x
Keywords: subarctic waters, copepods, Faroe shelf, cod, guillemots, recruitment, prediction
Citation: Hátún H, Danielsen J, Olsen B, Jacobsen S, Vang HBM, Kristiansen I, Larsen KMH, Gaard E, Salter I, Steingrund P and Mork KA (2025) Unifying local and large-scale drivers of the Faroe shelf ecosystem. Front. Mar. Sci. 12:1662766. doi: 10.3389/fmars.2025.1662766
Received: 09 July 2025; Accepted: 17 September 2025;
Published: 15 October 2025.
Edited by:
Francisco Machín, University of Las Palmas de Gran Canaria, SpainReviewed by:
Tatiana Rykova, Commonwealth Scientific and Industrial Research Organisation (CSIRO), AustraliaTerry Eugene Whitledge, Retired, Fairbanks, AK, United States
Copyright © 2025 Hátún, Danielsen, Olsen, Jacobsen, Vang, Kristiansen, Larsen, Gaard, Salter, Steingrund and Mork. This is an open-access article distributed under the terms of the Creative Commons Attribution License (CC BY). The use, distribution or reproduction in other forums is permitted, provided the original author(s) and the copyright owner(s) are credited and that the original publication in this journal is cited, in accordance with accepted academic practice. No use, distribution or reproduction is permitted which does not comply with these terms.
*Correspondence: Hjálmar Hátún, aGphbG1hcmhAaGF2LmZv