 Lin Zhang
 Hang Yuan
- School of Public Administration, Yanshan University, Qinhuangdao, China
This study focuses on the economic development efficiency of China’s three major marine economic zones, aiming to explore their dynamic evolution rules and regional disparity characteristics, thereby providing theoretical foundations and practical guidance for promoting sustainable marine economic development. Based on panel data from 11 coastal provinces in China (2012-2021), the research employs a three-stage super-efficient slack-based measure (SBM) model with undesirable outputs to measure marine economic development efficiency Additionally, it uses Dagum Gini coefficient decomposition method to systematically investigate regional disparities and their sources, and applies the kernel density estimation to analyze dynamic evolutionary characteristics. The study reveals three key findings: First, compared with the first stage, the measured marine economic development efficiency of China in the third stage generally increases, yet the rankings of provinces change to varying degrees. Second, it exhibits significant “polarization effects” among the three marine economic zones, each displaying distinct developmental patterns and distribution characteristics. Third, there is substantial spatial disequilibrium across the zones, with inter - regional differences constituting the primary source of developmental imbalances. These findings not only clarify the spatial configuration characteristics of China’s marine economic development but also provide crucial evidence for devising differentiated regional development policies.
1 Introduction
With rapid economic development and technological advancement, the exploitable quantity of marine resources has continued to expand. As an emerging economic form, the marine economy has gradually emerged as a pivotal driver of China’s sustainable economic development. Empirical data indicate that China’s gross ocean product grew from 5.01 trillion yuan in 2012 to 10.54 trillion yuan in 2024. Over the past twelve years, the gross ocean product has risen roughly 2.1-fold, further entrenching its role as a strategic growth engine of the national economy (State Oceanic Administration, 2012-2021). The Outline of the 14th Five-Year Plan for National Economic and Social Development and the Long-Range Objectives Through the Year 2035 of the People’s Republic of China includes a dedicated chapter on the ocean, explicitly calling for “actively expanding the space for marine economic development” and “accelerating the building of a strong maritime nation.” These directives set a clear roadmap for steering the marine economy toward high-quality development (State Council of the People’s Republic of China, 2021).
However, against the backdrop of the rapid development of China’s marine economy, the traditional extensive development model characterized by high input and high consumption still dominates. The characteristics of “high cost and low efficiency” in resource development and utilization are becoming increasingly prominent (Yan et al., 2024). As marine pollution and ecosystem degradation proceed, enhancing the efficiency and sustainability of the marine economy within limited resource constraints has become a vital strategic issue for China. Also, due to the significant differences in geographical location, resource endowment and economic foundation, the three major marine economic circles show severe development imbalance. Such development gap between regions not only restricts the overall efficiency of the marine economy, but also likely affects the coordinated stability of the national economic development. Building upon this contextual foundation, the present investigation adopts a tripartite analytical framework encompassing resource allocation, environmental carrying capacity, and economic performance to systematically assess the comparative advantages and deficiencies in marine economic development through an efficiency-driven lens. This study aims to explore the regional differences in the marine economic development of China’s three major marine economic circles and the dynamic evolution laws of the marine economy through scientific research. It also aims to systematically analyze the temporal evolution trajectory of marine economic efficiency. The purpose is to provide scientific evidence for developing differentiated regional development policies and promoting sustainable marine economic growth.
Existing research on marine economic efficiency has predominantly focused on sector-specific or industry-level efficiency analysis through case study and econometric modeling. For instance, evaluate the efficiency of marine port logistics and transportation (Tong, 2001), analyze the efficiency and impacts of marine fisheries production (Jamnia et al., 2015), and employ data envelopment analysis (DEA) and stochastic frontier analysis (SFA) to study the overall efficiency of the marine economy in coastal areas (Zhang et al., 2013; Zhao X. et al., 2016).However, despite achieving some results in analyzing the efficiency of individual sectors or industries within the marine economy, these research methods still have limitations when considering the overall efficiency of the marine economy. In recent years, many studies have found that undesirable outputs during the development of the marine economy were ignored in previous assessments of marine economic efficiency. Undesirable outputs refer to negative environmental impacts generated during the production process, such as pollution and resource waste (Sun et al., 2016; Jiang and Yu, 2025). The traditional DEA method has several flaws. Incorporating undesirable outputs into the assessment can significantly enhance the accuracy of evaluating the efficiency of the marine economy (Yuan et al., 2016; Zhao L. et al., 2016; Gai et al., 2018; Wang et al., 2025). Therefore, future research should pay more attention to the impact of environmental variables and random error on the results. Scholarly investigations into environmental variables have adopted diversified analytical perspectives. Researchers have explored environmental variables from various perspectives. Literature shows that coastal population resources, financial support, marine green fuel, marine technological innovation, and marine environmental governance are key to sustainable marine economic efficiency (Chen and Ye, 2024; Xu et al., 2025; Zhang and Wang, 2025) Furthermore, the spatiotemporal characteristics of marine economic development and its influencing economic factors remain pivotal research priorities in academia. Li Shan (Li and Zhao, 2020) and others used spatial pattern statistical methods to comprehensively analyze the evolution of China’s marine economic spatial patterns. Wang Yingying (2021) employed an undesirable super-efficiency model to measure and analyze the evolutionary patterns of marine economic efficiency. Existing literature has predominantly focused on marine economic efficiency and its developmental trajectories, employing diversified methodological approaches to conduct in-depth quantitative analyses through spatiotemporal dimensions (Gai et al., 2021; Cheng et al., 2022; Sun et al., 2024). These studies clearly show the theoretical and practical importance of researching marine economic efficiency. However, there is still room for further development in the following areas: First, although existing studies have adopted mainstream efficiency evaluation approaches such as DEA and SFA, they generally fail to incorporate undesirable outputs (e.g., marine pollution), resulting in systematic deviations between measured efficiency and actual development quality. Second, in terms of research content, the existing literature mainly centers on static efficiency measurement and the analysis of influencing factors; it lacks systematic investigation into dynamic characteristics such as the mechanisms underlying regional disparities, thereby offering limited support for the formulation of differentiated governance policies.
To fill the above research gaps, this paper focuses on 11 coastal provinces, using the SBM-Global model that accounts for undesirable outputs to analyze efficient decision-making units, thereby overcoming the limitation of conventional approaches that ignore environmental costs. It then employs the Dagum Gini coefficient decomposition technique, systematically uncovers the economic disparities among the Bohai Rim, the Yangtze River Delta, and the Pearl River Delta, along with their underlying causes. Finally, kernel density estimation is integrated to trace the spatiotemporal evolution of marine economic efficiency. In summary, the potential marginal contributions of this paper are as follows: first, employing an SBM-Global model that incorporates undesirable outputs improves the fidelity of efficiency measurement. Second, using the Gini coefficient, it provides an in-depth investigation of the extent and underlying causes of regional disparities in marine economic development, with special attention to the sustainability of economic efficiency. Third, by applying the Kernel density estimation method, the paper traces the dynamic trajectories of China’s marine economic efficiency, clarifying the spatiotemporal characteristics of the nation’s three major marine economic circles and their determinants. Fourth, it puts forward specific measures to narrow regional disparities in marine economic development and to promote the sustainable growth of the marine economy nationwide.
2 Materials and methods
2.1 Three-stage super-efficiency SBM-global model incorporating undesirable outputs
The three - stage DEA method can effectively eliminate the impact of uncontrollable factors like external environmental factors and random errors, thus enabling more accurate efficiency assessment (Fried et al., 2002). In this paper, the first stage of the three - stage DEA is modified to be a super - efficiency SBM - Global model (input - oriented) based on undesirable outputs, and the third stage also adopts the input - oriented SBM - Global model. The model construction is as follows:
Stage1: Super-efficiency SBM-Global model (Kaoru, 2002).
When the decision-making unit is invalid, the result is consistent with the standard efficiency model. When the decision-making unit is valid, the efficiency value can exceed 1. This paper integrates non - desired outputs into the model:
In the formula, represents the efficiency value of the marine economy. When and the redundancy is zero, the DMU (Decision Making Unit) is considered fully efficient. n is the number of decision-making units (DMUs); , and are the number of inputs, expected outputs and undesirable outputs, respectively; represents the redundancy of input, expected output and undesirable output; is the weight vector.
Stage2: Similar to the SFA model.
Under the principle of “ fixed output, input minimization”, a similar SFA model is constructed with the redundancy of input indicators of each decision-making unit in the first stage as the dependent variable, and the external environmental factors, random factors and management factors as independent variables. The expression is as follows:
In the formula, represents the slack variable for the i-th decision-making unit in the n-th input. = (, ,···, ) where represents environmental variables; In the formula, denotes the parameter vector corresponding to the environmental variables. + is the joint error term . represents random errors, which follow a truncated distribution. represents managerial inefficiency and follows a normal distribution. and are independently uncorrelated. Using maximum likelihood estimation, the parameter values are calculated and substituted into the adjustment formula below to obtain the new input values under homogeneous environmental conditions:
In the formula, is the adjusted input; is the original input; max () indicates the worst environmental condition, and other decision-making units are adjusted based on this; the adjustment principle for (random errors) is the same as above.
Stage3: Super - Efficiency SBM - Global Model after Input Adjustment.
The adjusted new input value is substituted for the original input value, the output is unchanged, and the Equation 1 is substituted again.
2.2 Dagum Gini coefficient and stratified decomposition framework
Dagum (1997) (Dagum, 1997) proposed dividing the overall Gini coefficient into three parts: the contribution of within - group differences, the contribution of between - group net differences, and the contribution of transvariation density. The larger the overall Gini coefficient, the greater the disparity in China’s marine economic development efficiency. This can be expressed mathematically as follows:
In the equation, denotes the marine economic efficiency value of province , denotes the marine-economic efficiency value of province within region , denotes the total number of provinces, represents the arithmetic mean of marine economic efficiency across all provinces.
Decomposing the Gini coefficient yields three components: within-region disparity (), between-region disparity (), and transvariation density (), which satisfy .
2.3 Kernel density estimation
Kernel density estimation, a non - parametric method for estimating unknown probability density functions, treats the distribution pattern of research subjects as a probability distribution, helping examine their changing trend over time. Specifically, let be the probability density function of a random variable . Suppose , , …, are independent and identically distributed discrete random samples. Then the kernel-density estimate at any point is given by the following equation (Ma, 2010);
In the formula, is the number of observations, is the non - negative bandwidth, and is the kernel function. To ensure the rationality of , the kernel function must satisfy non - negativity and integrate to 1. The Gaussian kernel function is used here to estimate the evolution of marine economic efficiency.
2.4 Indicator selection
In the regional marine economic development process, the resource, environmental, and economic subsystems form a complex large - scale system with close interactive links between them. In the process of marine economic development, the consumption of various resources and the generation and emission of environmental pollutants are inevitable (Huang et al., 2014). This paper builds on the traditional input - output system of economics. Starting with the three major systems of resources, environment, and economy, it constructs the indicator systems for the first and third stages of the three - stage DEA model, as shown in Table 1.
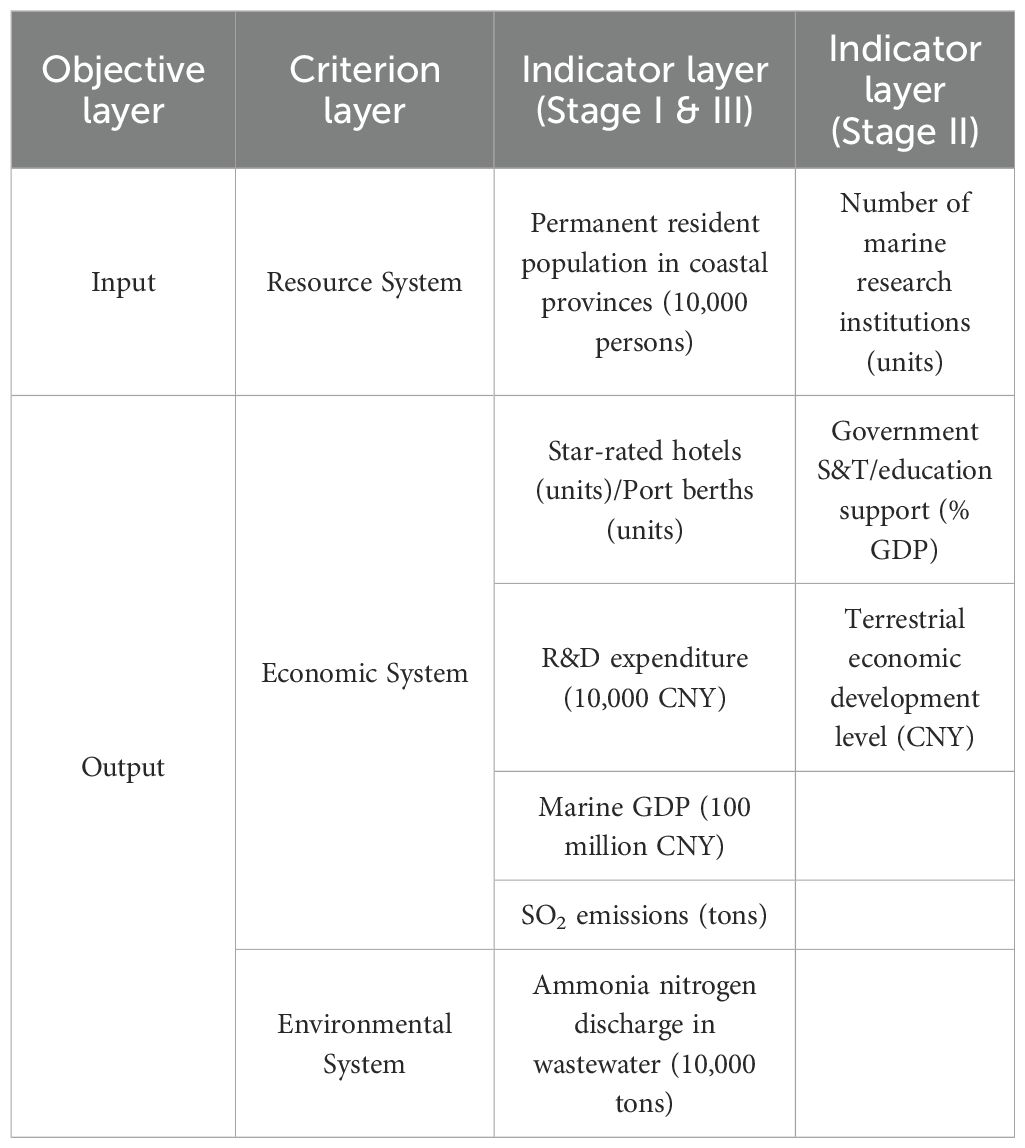
Table 1. Indicator selection for the first, second, and third stage of marine economic efficiency.
In the three - stage DEA method, 7 indicators are selected for efficiency evaluation in the first and third stage. In terms of inputs, three core indicators - labor input, resource input, and capital input - are chosen as the evaluation basis (Zhu and Gai, 2019). Specifically, the selection of the labor input indicator is based on the agglomeration effect of population development on elements such as talent, capital, information, and technology. The levels of these elements directly determine the breadth and depth of marine economic development in coastal provinces and cities. Therefore, drawing on existing literature, this study uses the year - end resident population in coastal provinces as the specific indicator for measuring labor input (Zhan et al., 2016). The selection of resource input indicators centers on coastal tourism and marine transport, the two pillars of the marine economy. Given their critical role in driving marine economic growth, this study incorporates the number of star - rated hotels and port berths (Guo et al., 2025) as specific metrics and consolidates them into a resource input composite indicator. In terms of capital input indicators, given that China’s marine innovation ability has been enhancing and its marine industrial structure has been optimizing in recent years, and considering the significant driving role of technological innovation in the sustainable development of the marine economy, this study selects R&D expenditure in the year as the capital input indicator. This allows for an in - depth exploration of its impact mechanism on marine economic efficiency.
In terms of output indicators, the study follows the principles of scientific and operability by choosing the marine economic GDP as the quantified representation of desired output, as it can comprehensively reflect the final economic outcomes created by marine economic activities.
In the environmental impact assessment dimension, this study selects sulfur dioxide emissions and ammonia - nitrogen emissions in wastewater as non - desired output indicators. These two types of pollutants respectively represent the typical harmful factors of air pollution and water pollution. Their emission levels are directly linked to the quality of the marine ecological environment. Incorporating them into the assessment system helps to more objectively measure the environmental costs of marine economic development and provides a comprehensive perspective for the overall evaluation of marine economic efficiency.
In the second stage, three indicators are selected for the resource aspect: the number of personnel in marine research institutions, the government’s support for marine science and technology (measured by the proportion of government’s three types of science and technology expenditures in the total fiscal expenditure), and the level of terrestrial economic development (measured by per capita GDP on land) (Ding et al., 2017).
2.5 Data sources
This paper studies 11 coastal provinces and regions in China, namely Liaoning, Tianjin, Hebei, Shandong, Jiangsu, Shanghai, Zhejiang, Fujian, Guangdong, Guangxi, and Hainan. Due to data limitations, Hong Kong, Macao, and Taiwan are not included in this study. The study covers the period from 2012 to 2021. Data are sourced from the 《China Marine Statistical Yearbook》, 《China Statistical Yearbook》, and 《China Energy Statistical Yearbook》.
3 Analysis of three-stage DEA results
3.1 Efficiency measurement
3.1.1 Empirical analysis of the first-stage super-efficiency SBM-global model
Using Equation 1 and Global Reference, the marine economic efficiency in China’s coastal regions from 2012 to 2021 was calculated. The super - efficiency model can rank efficient decision - making units. Thus, it is reasonable and necessary to modify the traditional SBM - Global model in the first and third stages to a super - efficiency SBM - Global model.
The computational results (Table 2) from the MAXDEA software indicate that, assuming no influence of environmental factors and stochastic errors, the national average efficiency score of the marine economy is 0.415, which reveals a widespread inefficiency. Further statistical analysis shows that 36% of regions have marine economic efficiency surpassing the national average, yet significant efficiency disparities exist between regions. Notably, while Shandong and Guangdong are recognized as economically leading provinces in marine economic activities, the data analysis in this study reveals that these provinces rank relatively low in economic efficiency. This is because external environmental factors and random errors interfere with the process, and these factors are not fully captured in the current model, thus affecting the accurate assessment of marine economic efficiency in these provinces.
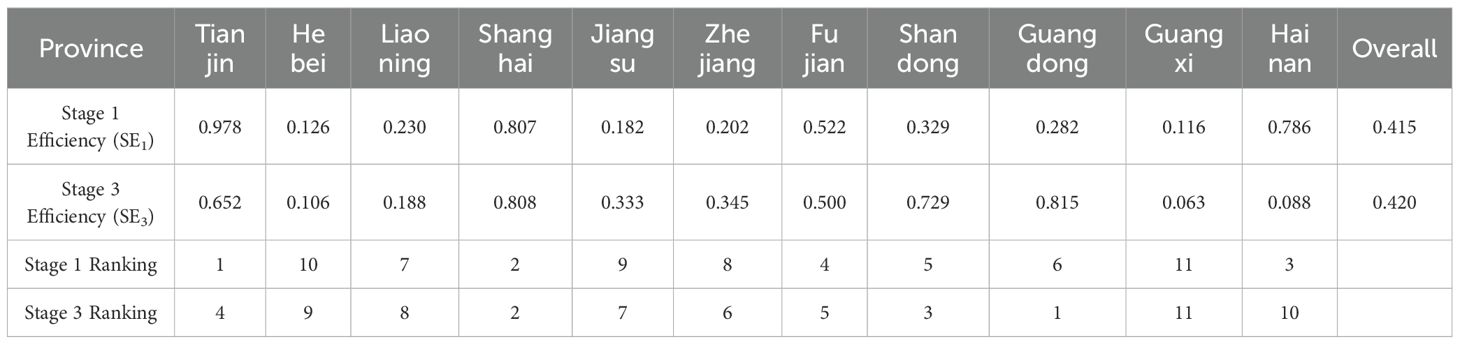
Table 2. A Comparison of China’s marine economic efficiency in coastal regions: results from the first and third stages.
3.1.2 Empirical analysis of the second-stage similarity-based stochastic frontier analysis
Using the slack variables of the three inputs for each decision-making unit as the dependent variable, and the number of marine scientific research personnel, government support for technology, and the level of terrestrial economic development as independent variables, a stochastic frontier analysis (SFA) model is constructed and calculated using Front4.1 software. The analysis results are expressed in logarithmic form, as shown in Table 3. The values of γ are all close to 1 and have passed the significance test at the 1% level. This indicates that there are significant differences in the external technical efficiency among the various decision-making units, while the impact of random errors is minimal. This finding underscores the rationality of employing the SFA model in the second stage to strip away the influence of environmental variables.
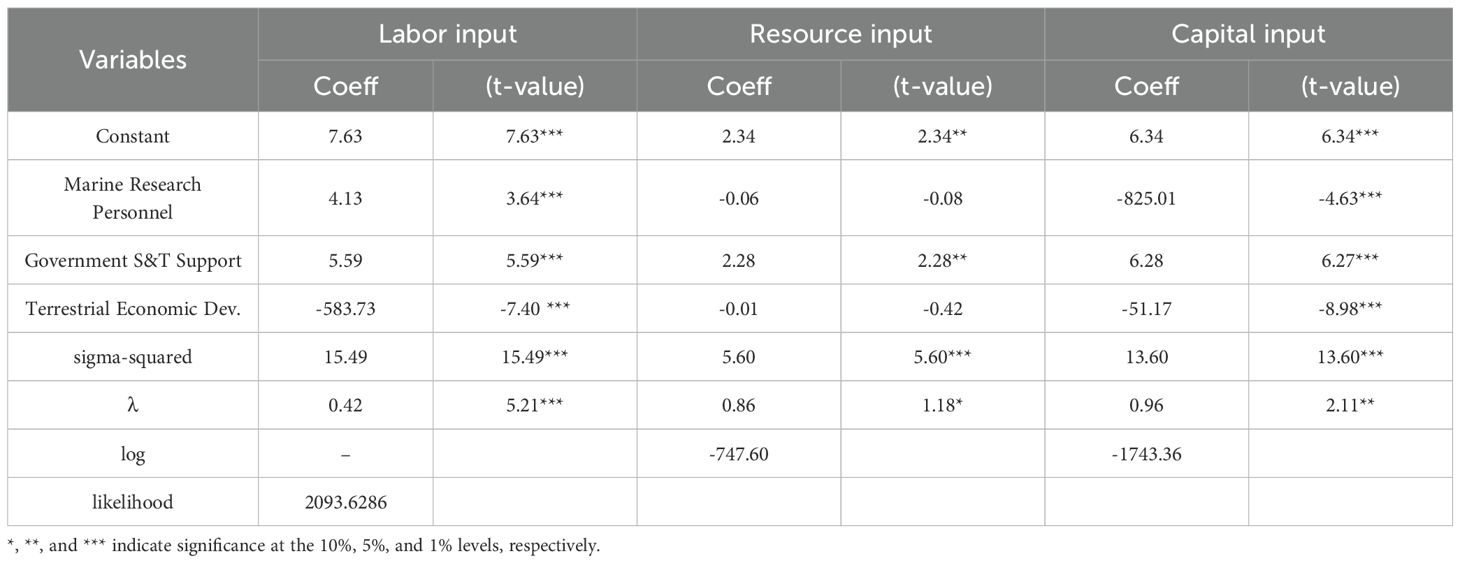
Table 3. Stochastic frontier analysis of environmental adjustment effects: decomposing efficiency variance in stage II.
3.1.3 Analysis of the third-stage super-efficiency SBM-global results
In the third - stage research, the adjusted input variables are re - entered into the three - stage SBM - Global model to measure the efficiency values (Table 2). In the third stage, adjusted input variables are re - input into the three - stage SBM - Global model to calculate efficiency values. Compared with the first - stage results, the marine economic efficiency of each province shows significant heterogeneity. The efficiency values of six regions, namely Tianjin, Hebei, Liaoning, Fujian, Guangxi, and Hainan, have decreased. Among them, Hainan’s efficiency was overestimated due to a high reliance on tourism, indicating that these regions’ efficiency was overestimated in the first stage because of favorable external environmental factors. For instance, Fujian has higher marketization levels, Hainan has strong environmental regulations, and Guangxi has temporary marine industrial subsidies. In contrast, the economic efficiency values of Shanghai, Jiangsu, Zhejiang, and Shandong have increased significantly. Shandong’s economic efficiency potential was fully unlocked due to the removal of institutional barriers and the emergence of technological spillover effects. Shanghai’s high marketization level and relatively mature policy system resulted in minimal environmental interference. These phenomena confirm that regional heterogeneity profoundly impacts efficiency assessment. They indicate that after removing external environmental factors and random errors, the true efficiency potential of these regions was initially underestimated.
The methodological refinement induced substantial positional shifts across regions, with Shanghai maintaining its second-place ranking and Guangxi persistently anchored at the bottom. Notable movements include Guangdong’s 5-position climb, Hainan’s dramatic 7-position decline, and Tianjin’s 3-position drop. Upward mobility was observed in Jiangsu, Zhejiang, and Shandong (2 positions each), and Hebei (1 position), while Liaoning and Fujian experienced 1-position decreases. These recalibrated rankings more accurately reflect the actual efficiency landscape when purified from exogenous environmental distortions.
4 The dynamic evolution of marine economic efficiency in China
4.1 Evolution of overall marine economic efficiency
The calculated marine economic efficiency values are plotted as shown in Figure 1. From the analysis of Figure 1, it can be observed that the mean marine economic efficiency demonstrates an initial upward trend, followed by a decline, and eventually stabilizes over the time series. This change can be divided into two phases. Phase 1, from 2012 to 2016, was a period of stable economic development. During this time, the “12th Five - Year Plan” was released, leading to enhanced economic strength and technological progress in China. In 2012, the 18th National Congress of the Communist Party of China first proposed the marine power strategy goal. Subsequently, the marine economic efficiency in coastal regions improved gradually. Phase 2, from 2017 to 2021, was a period of improving the quality and efficiency of economic development. In 2016, China introduced its “13th Five - Year Plan” for national marine standardization, promoting marine standardization reform and innovation. In this phase, innovation - driven “green development” economic policies were advanced, offering technical support for marine pollution control and ecological restoration. However, as many marine industries haven’t achieved green transformation and upgrading, the growth in marine economic efficiency slightly slowed overall.
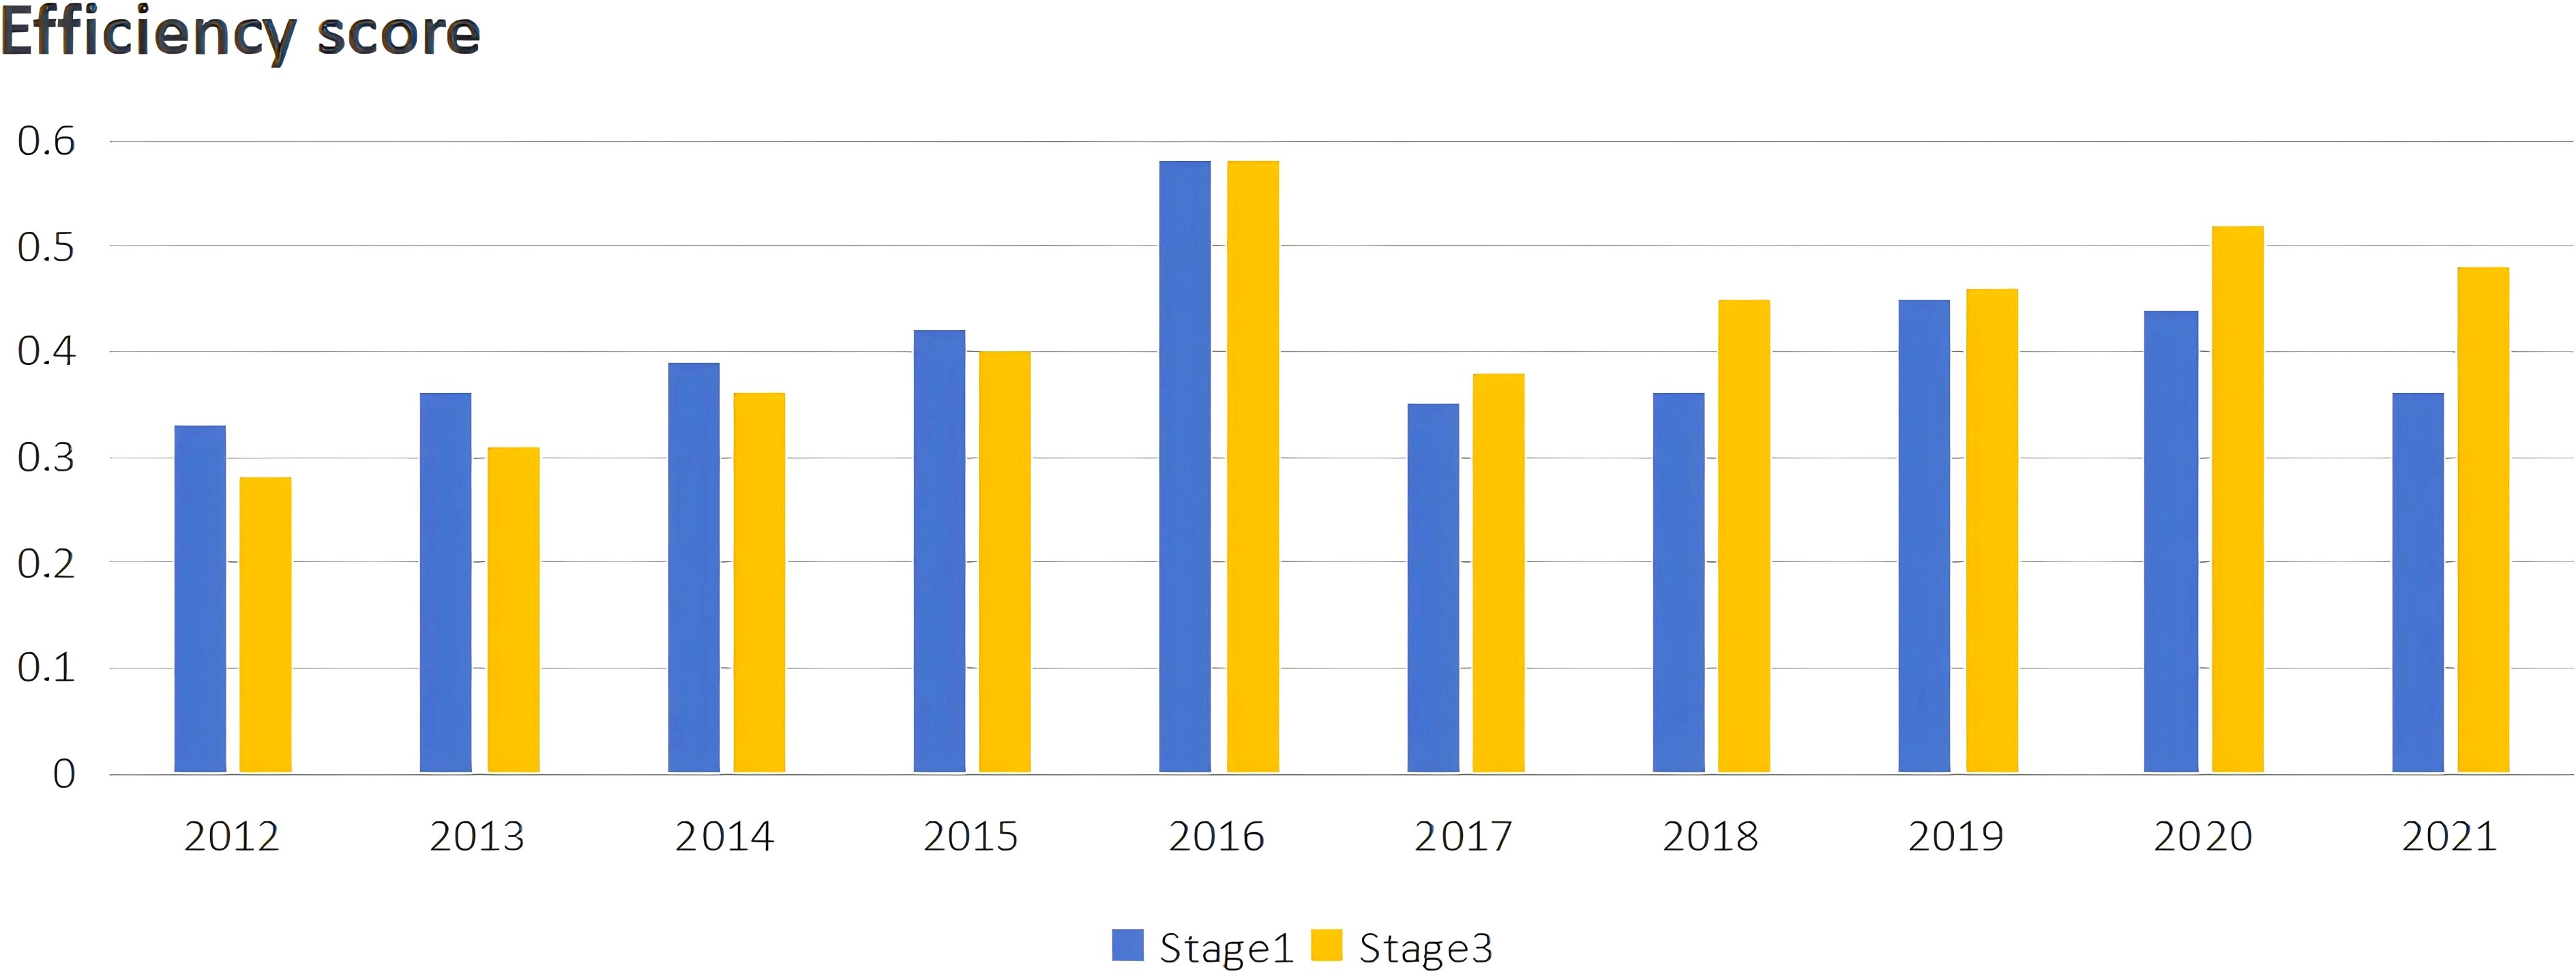
Figure 1. Changes in marine economic efficiency.
4.2 Evolutionary dynamics of marine economic circle efficiency
The analysis of the time - series evolution of national marine economic efficiency reveals significant spatial differences. This regional development gradient demands a multi - scale analysis to uncover structural disparities. According to the spatial classification standard in China’s Marine Economic Statistical Yearbook, the country’s marine economic space pattern presents a “Bohai Rim - Yangtze River Delta - Pan - Pearl River Delta” tripolar structure: The Bohai Rim Marine Economic Zone comprises four provinces/municipalities: Liaoning, Hebei, Tianjin, and Shandong. It features industrial clusters centered on heavy chemical industry and equipment manufacturing. The Yangtze River Delta Economic Hub (YRD-EH), comprising three province-level administrative units (Shanghai Municipality, Jiangsu, and Zhejiang), is characterized by its strategic focus on high-end shipping services and marine high-tech innovation ecosystems; The Pan - Pearl River Delta economic zone includes four provinces (regions): Fujian, Guangdong, Guangxi, and Hainan. It mainly relies on its geographical advantages to focus on developing port - adjacent industries and marine tourism. To explore the spatiotemporal evolution of marine economic efficiency in the three economic zones, this study uses non - parametric kernel density estimation. From four dimensions: distribution function shape, fluctuation, extension, and polarization trends, it examines the efficiency evolution of each economic zone and its internal provinces from 2012 to 2021.Figure 2 presents the kernel density estimation results and dynamic evolution for the entire sample. Figure 3 illustrates these findings for the three major economic zones.
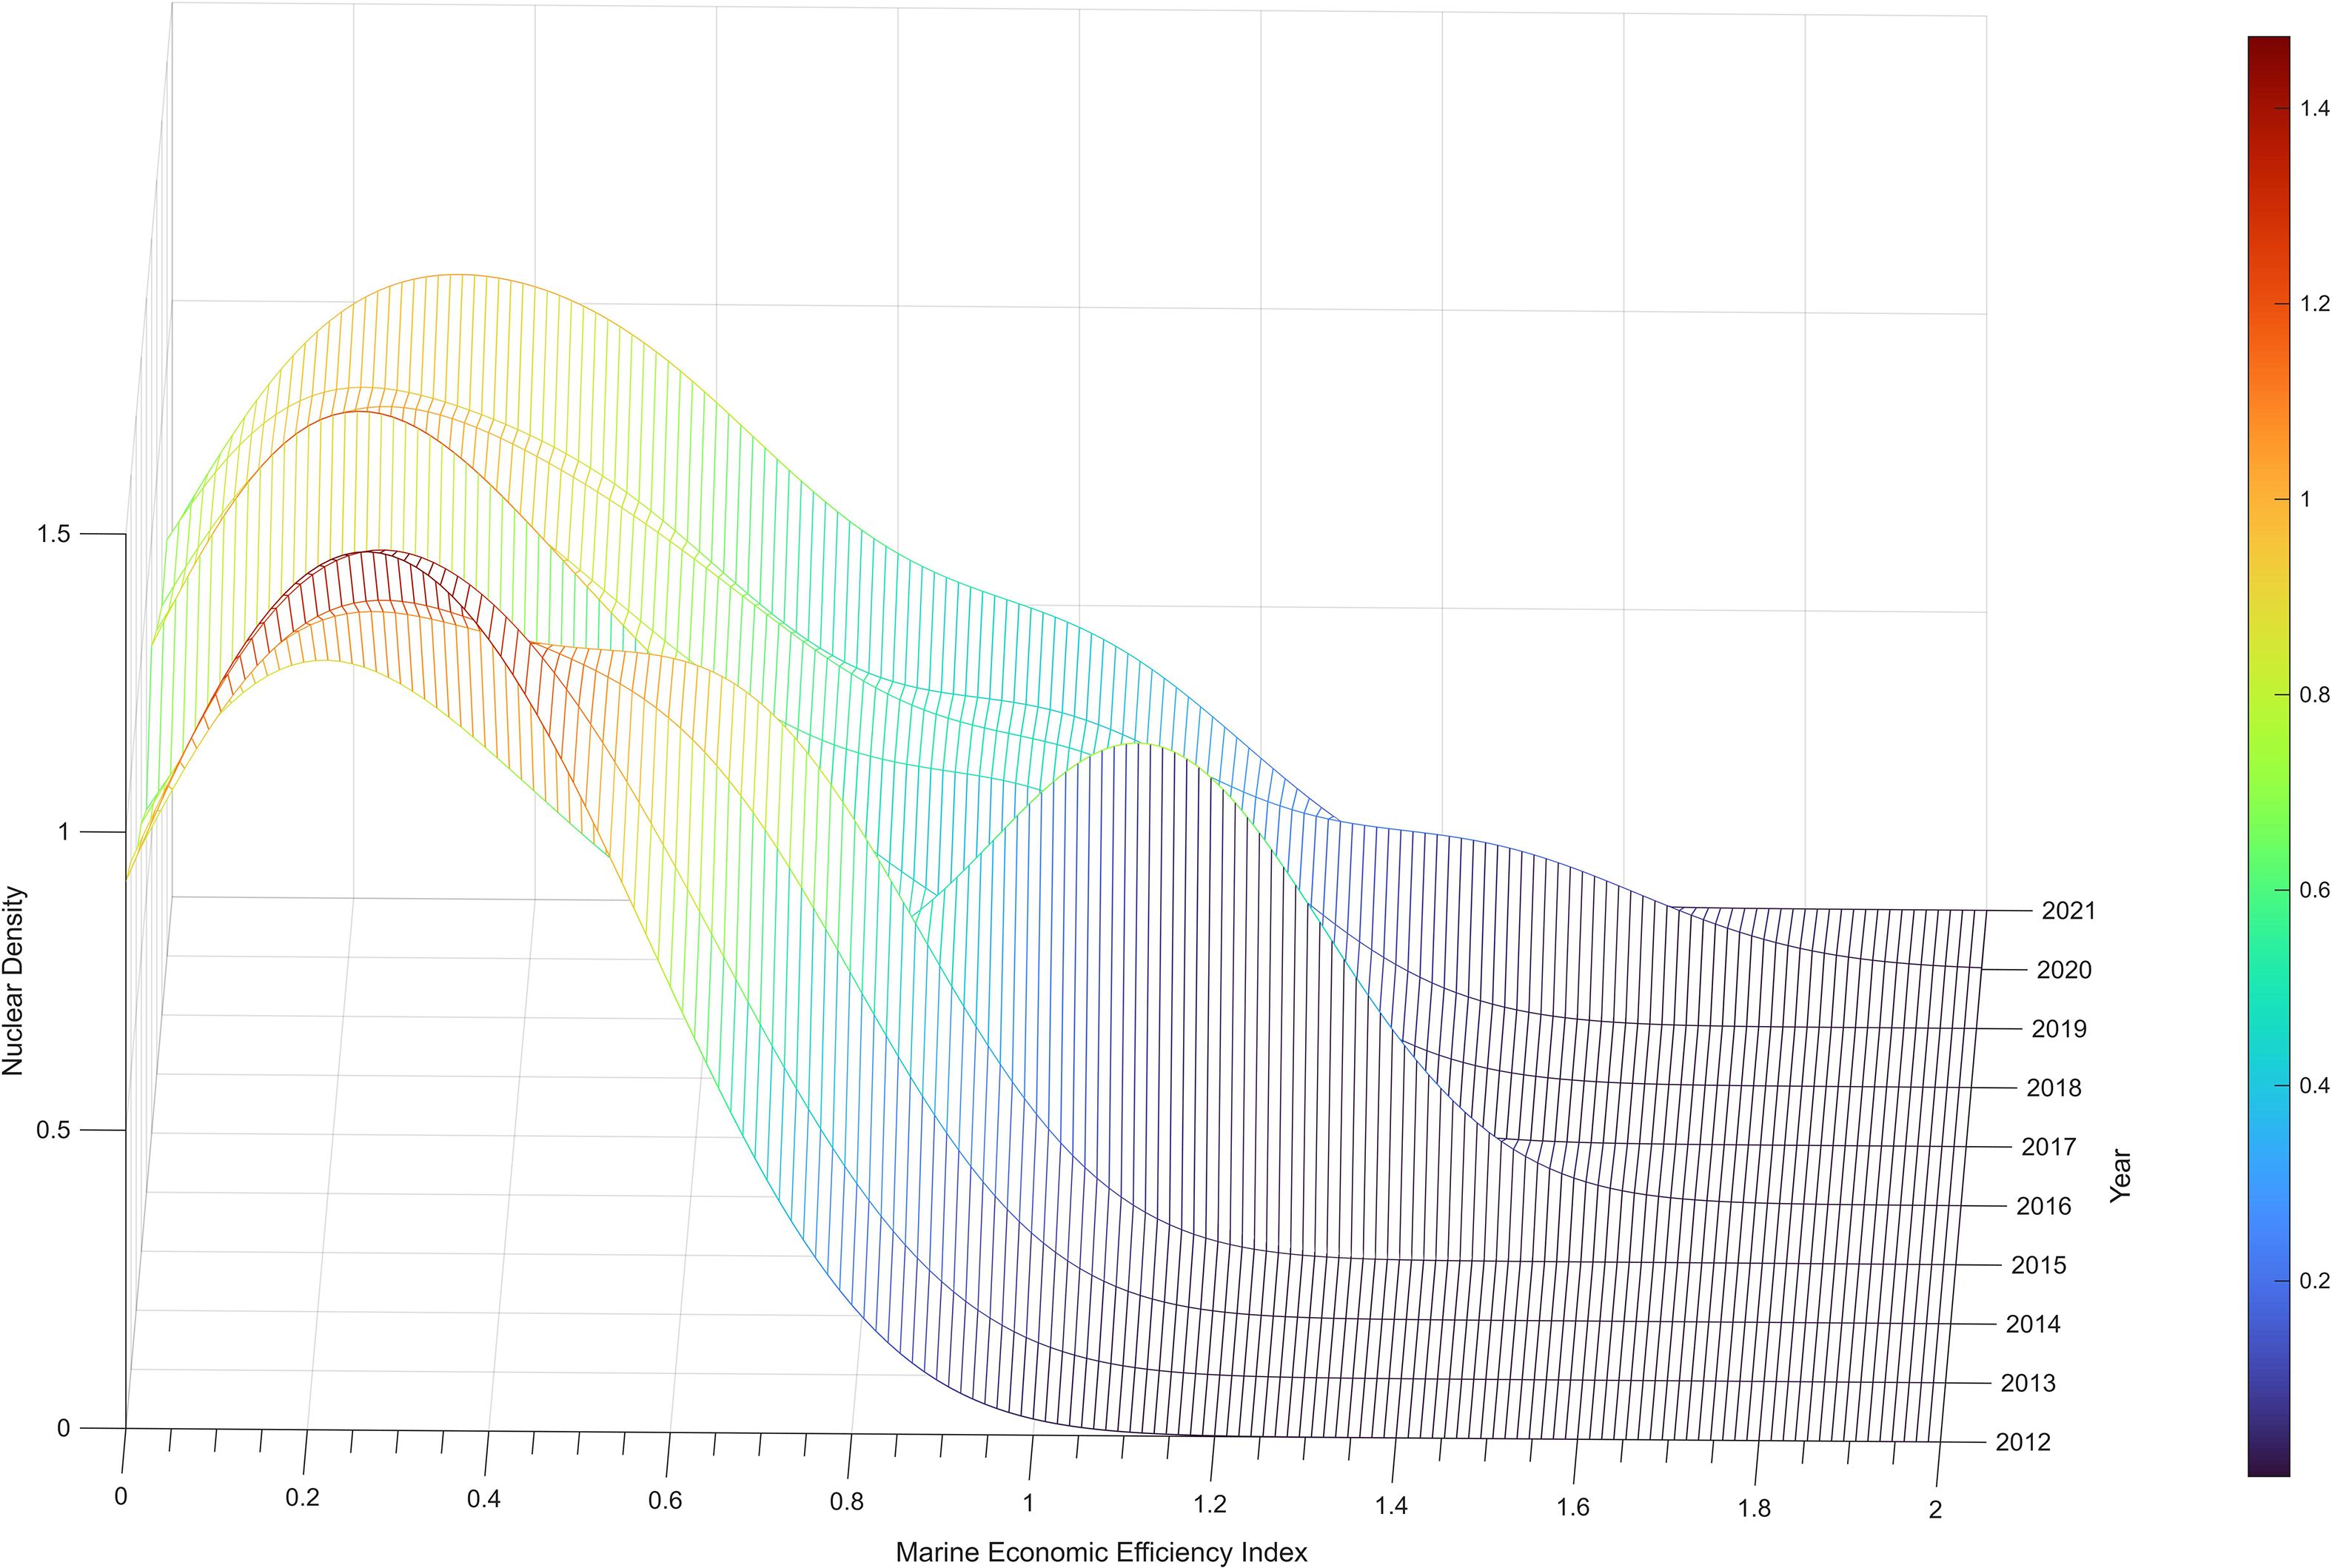
Figure 2. Dynamic distribution of marine economic development efficiency in China.
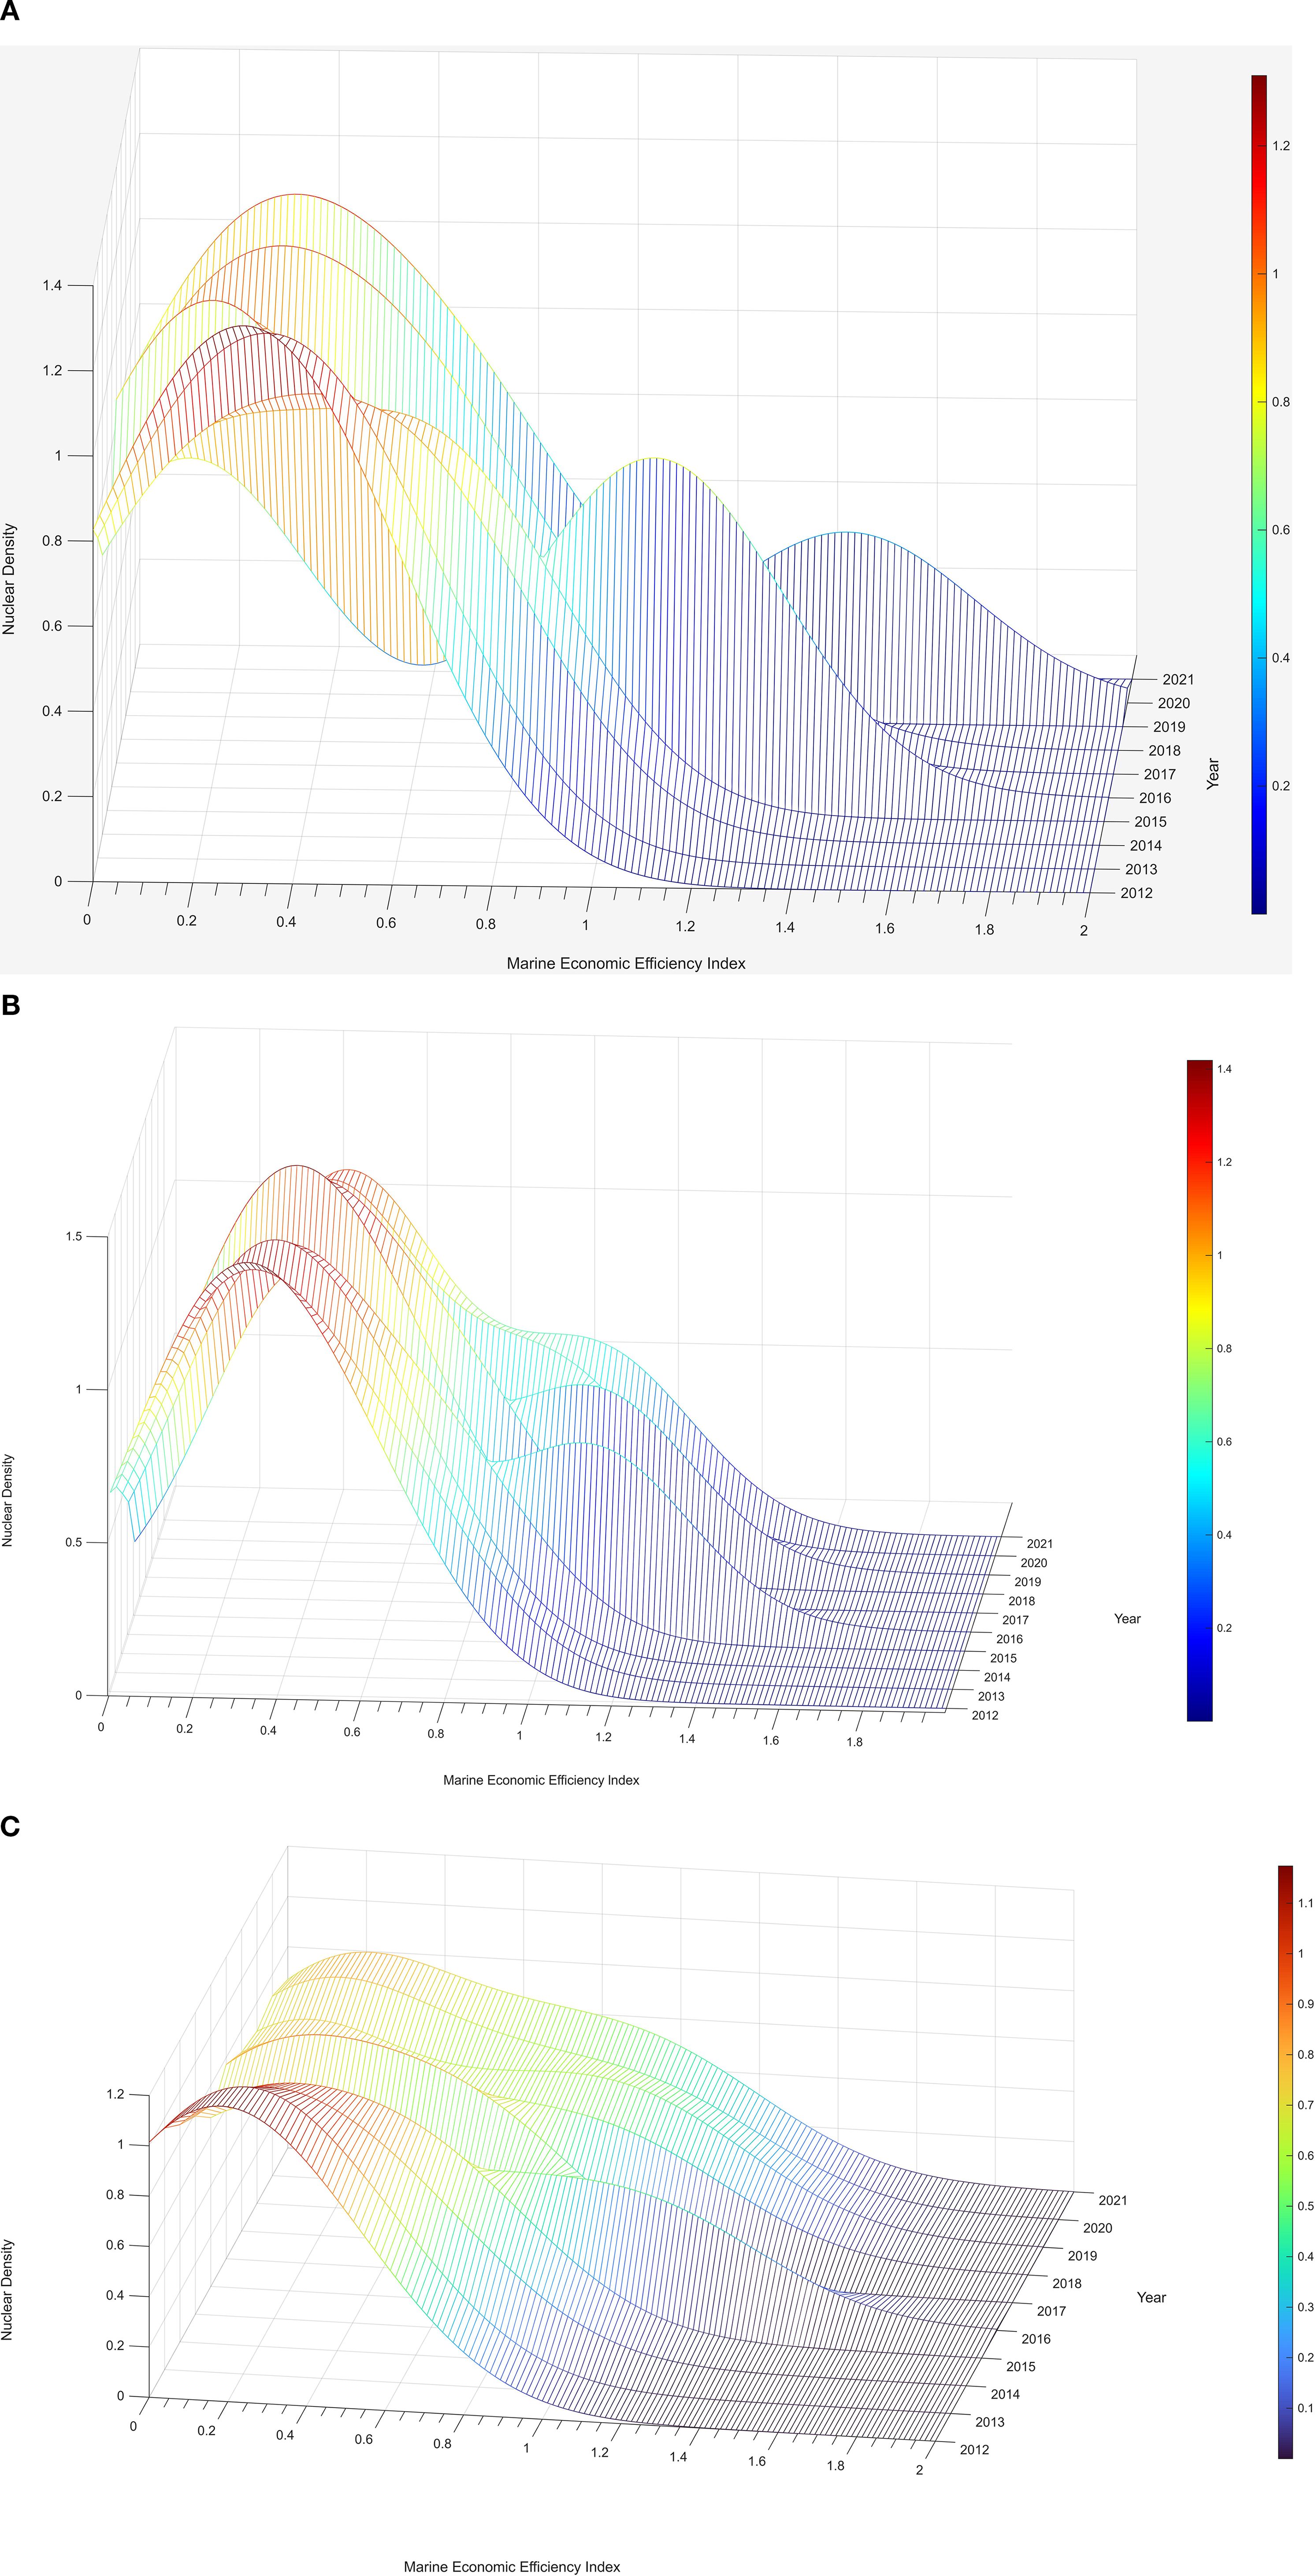
Figure 3. Dynamic distribution of marine economic development efficiency in three regions.
From the distribution in Figure 2, the marine economic development levels of the three major marine economic circles and their internal regions generally show a stable right - skewness with a trend of slowing growth. This indicates that China’s marine economy is steadily improving and shows an overall upward trend. However, the growth rate is relatively slow. In terms of technology, the traditional factor - driven model faces rigid constraints. Together with ecological threshold effects, these factors create growth resistance. In the policy dimension, the “13th Five - Year Plan” for national marine economic development (2016) and the Coastal Zone Protection and Utilization Management Measures jointly created policy synergy in industrial restructuring and ecological rigidity. This triggered short - term pains of supply - side capacity clearance and investment contraction. As per Figure 3, the dynamic distribution changes of each economic zone align with the overall situation, yet the degree of curve movement varies. This essentially reflects the structural differentiation of regional factor endowments.
As can be seen from Figure 3A, in terms of distribution form characteristics, the kernel density curve of the Bohai Economic Rim shows significant dynamic evolution characteristics. Specifically, the main peak of the kernel density curve for the Bohai Economic Rim first decreased and then increased, while the distribution width gradually widened. This indicates that the spatial differences in economic efficiency within the Bohai Economic Rim are expanding, and the absolute differences have deepened. The distribution curve of the marine economic development level of the Bohai Economic Rim shows a clear right - tailing phenomenon. This indicates significant economic disparities within the region. It shows that some provinces in the Bohai Economic Rim have taken the lead in achieving a high level of marine economic development, while other regions have fallen behind, with a pronounced imbalance in internal regional development. From the polarization perspective, at the start of the study, the marine economy distribution curve of the Bohai Rim presented a distinct bimodal shape. This indicates significant efficiency polarization in the region. Over time, the distribution curve has evolved from a bimodal to a unimodal shape. This indicates not only that economic disparities within the region are gradually narrowing but also shows that the green development concept has been effectively implemented within the region.
As shown in Figure 3B, the kernel density curve of the Yangtze River Delta Economic Zone has a clear dynamic evolution pattern. Specifically, the main peak height shows an upward fluctuation trend, the peak width first expands and then contracts, and the overall kernel density curve shifts to the right. These characteristics indicate that marine economic efficiency differences among provinces in the Yangtze River Delta Economic Zone are gradually narrowing, showing a trend of dynamic convergence without significant polarization. From the distribution extension feature, the main peak of the marine economic development level distribution curve in the Yangtze River Delta Economic Zone shows a “right - shift - left - shift - right - shift” evolution path, but the overall change amplitude is relatively small. This feature shows that the Yangtze River Delta Economic Zone’s marine economic efficiency is improving steadily, with the regional development level on the rise. Notably, regions with initially higher efficiency have experienced a relative decline, narrowing the gap with the regional average. This shows that the Yangtze River Delta Economic Zone has achieved a relatively balanced development level within the region while maintaining overall efficiency improvement. This evolution fully reflects that, in promoting marine economic development, the Yangtze River Delta Economic Zone has effectively reduced internal development disparities through regional collaboration and optimizing factor allocation, fostering a virtuous interactive development pattern.
As shown in Figure 3C, the kernel density curve of the Pan - Pearl River Delta Economic Zone presents a clear dynamic evolution pattern. The main peak of the kernel density curve for the Pan - Pearl River Delta Economic Zone generally shifts rightward, and the peak width continues to expand. This indicates that the absolute differences in the marine economic development level of the Pan - Pearl River Delta Economic Zone are widening. From the perspective of distribution extension characteristics, the distribution curve shows a significant right - tailing phenomenon. The extension range is gradually widening, and the distribution shape tends to flatten. This evolution mainly stems from some provinces in the Pan - Pearl River Delta Economic Zone that have significantly higher development levels. This has caused the economic development gap within the region to keep widening. Based on the phased changes in the curve pattern, the period from 2012 to 2021 can be divided into two distinct phases. From 2012 to 2015, the distribution curve shows a unimodal shift to the right, reflecting an overall improvement in development levels within the region, but with a gradual widening of the development gap. From 2016 to 2021, the distribution curve shows a bimodal divergence. This shift is closely related to the in - depth implementation of the “Marine Power” strategy. In the process of policy implementation, some provinces, leveraging their geographical advantages and policy dividends, took the lead in achieving rapid marine economic development. However, other regions fell behind, leading to a significant divergence in the regional development pattern.
4.3 Regional disparities and decomposition of China’s marine economic development efficiency
This research focuses on analyzing the dynamic evolution of marine economic development in China’s three major marine economic zones. Empirical findings reveal a significant non - equilibrium evolution in their spatial patterns. This study analyzes the dynamic evolution of China’s three major marine economic zones. It overcomes traditional static analysis limitations by innovatively introducing the Dagum Gini coefficient decomposition method. From a spatial econometric perspective, it dynamically examines the development differences among these zones from 2012 to 2021.This method dissects development differences through three aspects: inter - regional differences, intra - regional differences, and contributions from ultra transvariation density. It can accurately identify the driving sources and evolution patterns of marine economic spatial differentiation. Through dynamic differential measurement, we can quantify the structural effects of regional imbalance on the marine economic system. Through dynamic differential measurement, we can quantify the structural effects of regional imbalance on the marine economic system. More crucially, it reveals the spatiotemporal shifts in contribution rates, thus providing decision - making support for optimizing the marine economic spatial governance system and building cross - regional development mechanisms.
4.3.1 Overall regional differences and their evolutionary trends
Based on the Gini coefficient and its decomposition results shown in Table 4, the study finds that the economic development efficiency of China’s three major marine economic zones presents a significant regional imbalance, forming a gradient development pattern of “high in the east and low in the north and south”. Figure 4 further displays the evolution trend of regional differences among the three major marine economic zones. Combined with the quantitative analysis results, it can be known that during the research period, the overall degree of differences among the three major marine economic zones was relatively high, with the Gini coefficient ranging between 0.578 and 0.642. From a temporal perspective, the evolution of regional disparities can be divided into two distinct phases: In the first phase (2012 - 2018), regional differences continuously widened. The Gini coefficient rose steadily from 0.578 in 2012 to a peak of 0.627 in 2018, reflecting the growing development gap between regions during this period. In the second phase (2019 - 2021), regional differences showed a “decline - rise” fluctuation. The Gini coefficient hit the highest value of 0.642 in 2020 within the research period, then dropped slightly but still remained high. Notably, despite short - term fluctuations after 2019, the overall regional differences among the three major marine economic zones still show an upward trend. This indicates that despite national strategies for regional coordinated development, the development gap between the three major marine economic zones hasn’t been effectively narrowed. The eastern region, with its superior geographical location, well - developed industrial foundation, and strong innovation capacity, has maintained a relatively leading development trend. In contrast, the northern and southern regions have shown significant shortcomings in industrial upgrading and technological innovation, leading to a continuous expansion of the development gap between regions. This finding offers crucial empirical support for creating differential regional development policies and boosting the coordinated development of the marine economy.
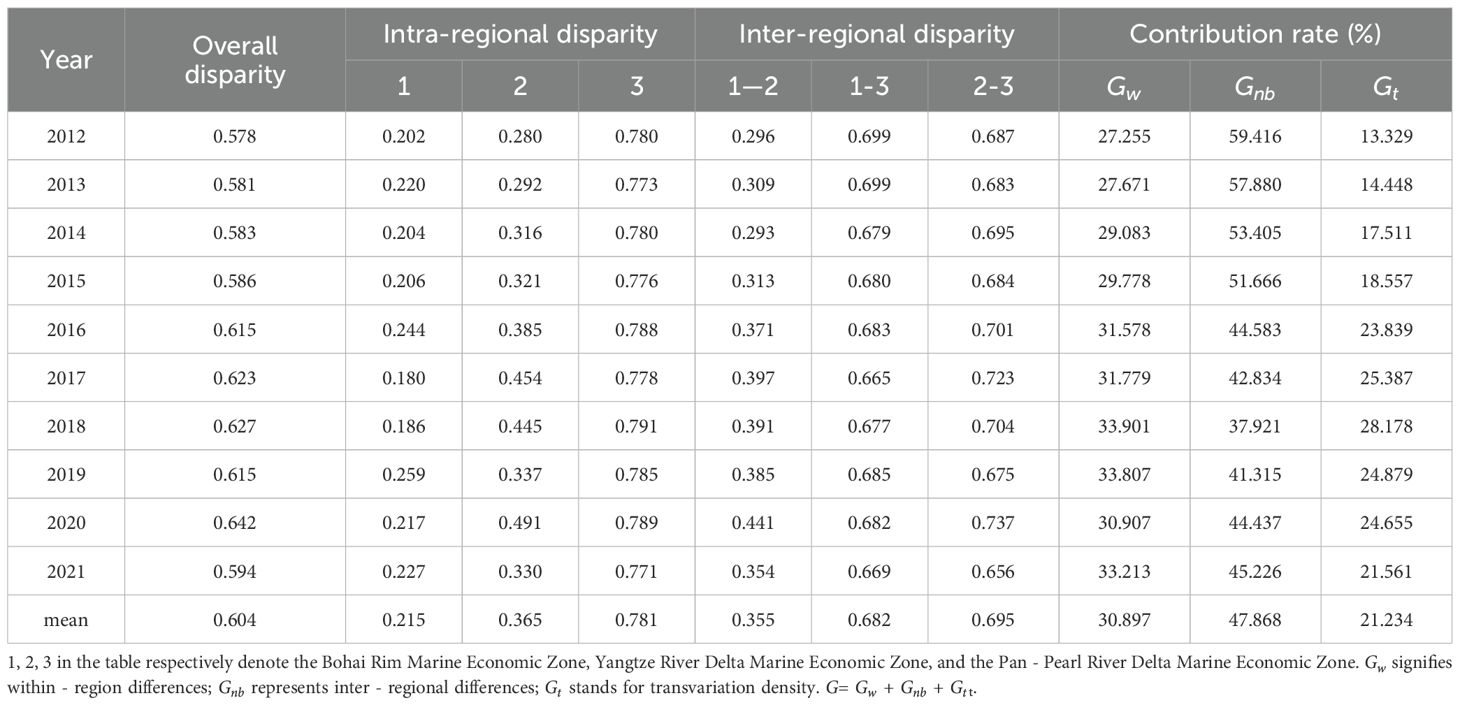
Table 4. Gini coefficient and decomposition results of marine economic development efficiency in China.
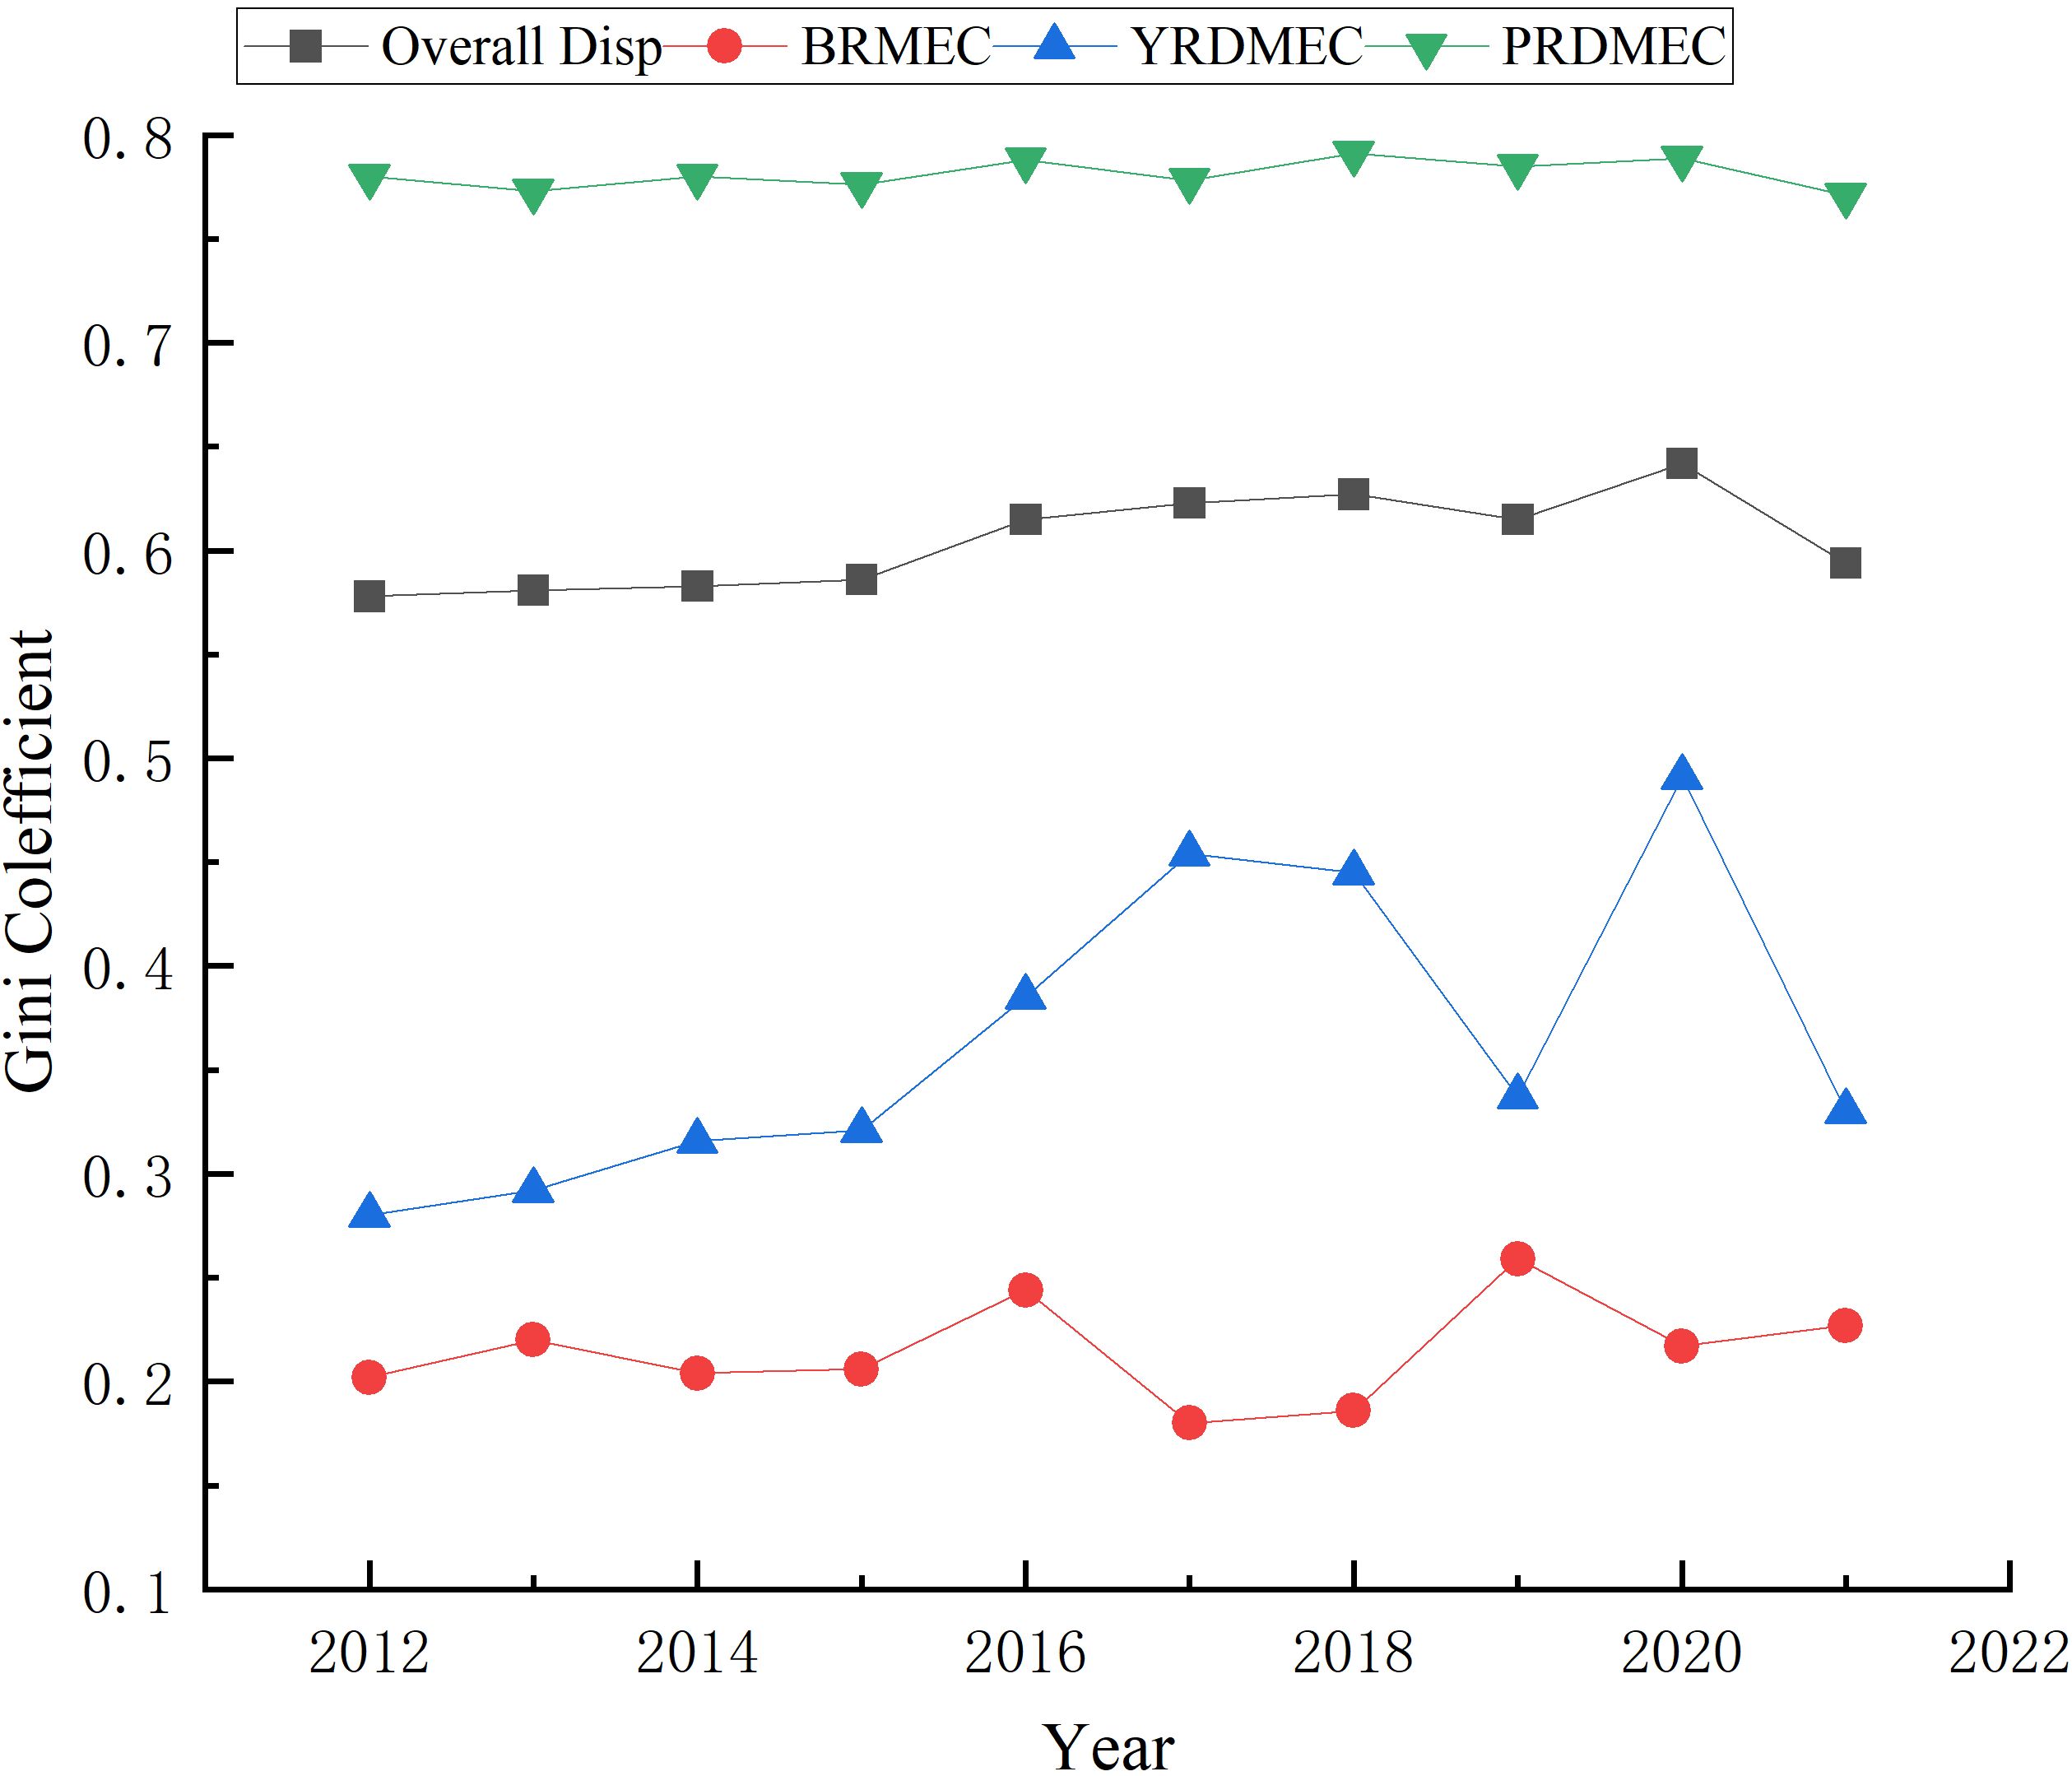
Figure 4. Overall differences and within - region differences in marine economic development efficiency in China (2012 - 2021).
4.3.2 Within-region differences and their evolutionary trends
The evolutionary trajectory in Figure 4 reveals the following trends in the regional differences within the three major marine economic zones: The empirical data (see Table 4) shows that the Pan - Pearl River Delta Economic Zone, with a Gini coefficient of 0.781, has the largest regional differences and exceeds the overall regional differences. The empirical data (see Table 4) shows that the Pan - Pearl River Delta Economic Zone, with a Gini coefficient of 0.781, has the largest regional differences and exceeds the overall regional differences. The Yangtze River Delta Economic Zone has a mean of 0.365, and the Bohai Economic Rim has a mean of 0.215. This gradient difference reflects issues of policy fragmentation and low - efficiency regional coordination. Specifically, the Pan - Pearl River Delta Marine Economic Zone suffers from severe regional polarization and institutional Matthew effects. Guangdong and Fujian, with free - trade zone policies and strong marine R & D investment, have become economic efficiency hubs. Their development levels are much higher than those of Hainan and Guangxi, indicating significant economic strength disparities. The regional differences within the Bohai Economic Rim show small - amplitude fluctuations and remain relatively stable. The root cause lies in the institutional barriers that prevent deep - seated cooperation. As a result, difference - governance is trapped in a “low - level equilibrium”. From 2012 to 2017, the Gini coefficient of the Yangtze River Delta Marine Economic Zone increased slowly from 0.28 to 0.45, and then decreased after 2018, indicating that regional differences were narrowing. The Yangtze River Delta Marine Economic Zone, a strategic highland for China’s high - quality economic development, comprises Jiangsu, Zhejiang, and Shanghai. These three provinces, with their remarkable economic and geographical advantages, have shown strong leadership in marine economic development. The three provinces, leveraging their strong industrial base, improved infrastructure, and prime location, have promoted marine industrial clusters and upgraded the industrial system. They’ve formed a coastal industrial belt and built a world - class port cluster through cooperation.
4.3.3 Inter-regional differences and their evolutionary trends
Dynamic decomposition results based on the Dagum Gini coefficient (Figure 5) indicate that the regional differences among the three major marine economic zones exhibit a spatial differentiation pattern. The empirical data indicates that regional differences between the Bohai Rim and the Pan - Pearl River Delta are decreasing, while those between the Bohai Rim and the Yangtze River Delta, and between the Yangtze River Delta and the Pan - Pearl River Delta, are increasing. Specifically, regional differences between the Bohai Rim and the Yangtze River Delta show a fluctuating upward trend, reaching the highest value of 0.441 in 2020 within the study period. However, in 2021, differences declined rapidly. This change is closely linked to the implementation of China’s 14th Five - Year Plan and the Long - range Objectives through 2035.The plan explicitly proposes “optimizing the layout of regional marine economies and strengthening cross - regional marine industrial cooperation”, providing a policy guide for the coordinated development of regional marine economies. By enhancing cross - regional cooperation mechanisms, industrial collaboration and resource - sharing between regions have been strengthened. This has promoted more balanced marine economic development. Differences between the Bohai Rim and Pan - Pearl River Delta marine economic zones, and between the Yangtze River Delta and Pan - Pearl River Delta zones, remained relatively stable. The Pan - Pearl River Delta - Yangtze River Delta zone has the highest inter - regional Gini coefficient at 0.69. This indicates the most significant development differences between these two regions. This continued high level of difference may originate from disparities between the two regions in terms of industrial structure, innovation capacity, and degree of opening up to the outside world. The inter - regional differences between the Bohai Rim and the Pan - Pearl River Delta are the second - highest. Although its Gini coefficient is lower than the former, it still reflects a clear regional development imbalance. In comparison, the Bohai Rim - Yangtze River Delta inter - regional differences are the smallest. This might result from the joint effects of geographical advantages and industrial complementarity between the two regions, making regional development more balanced.
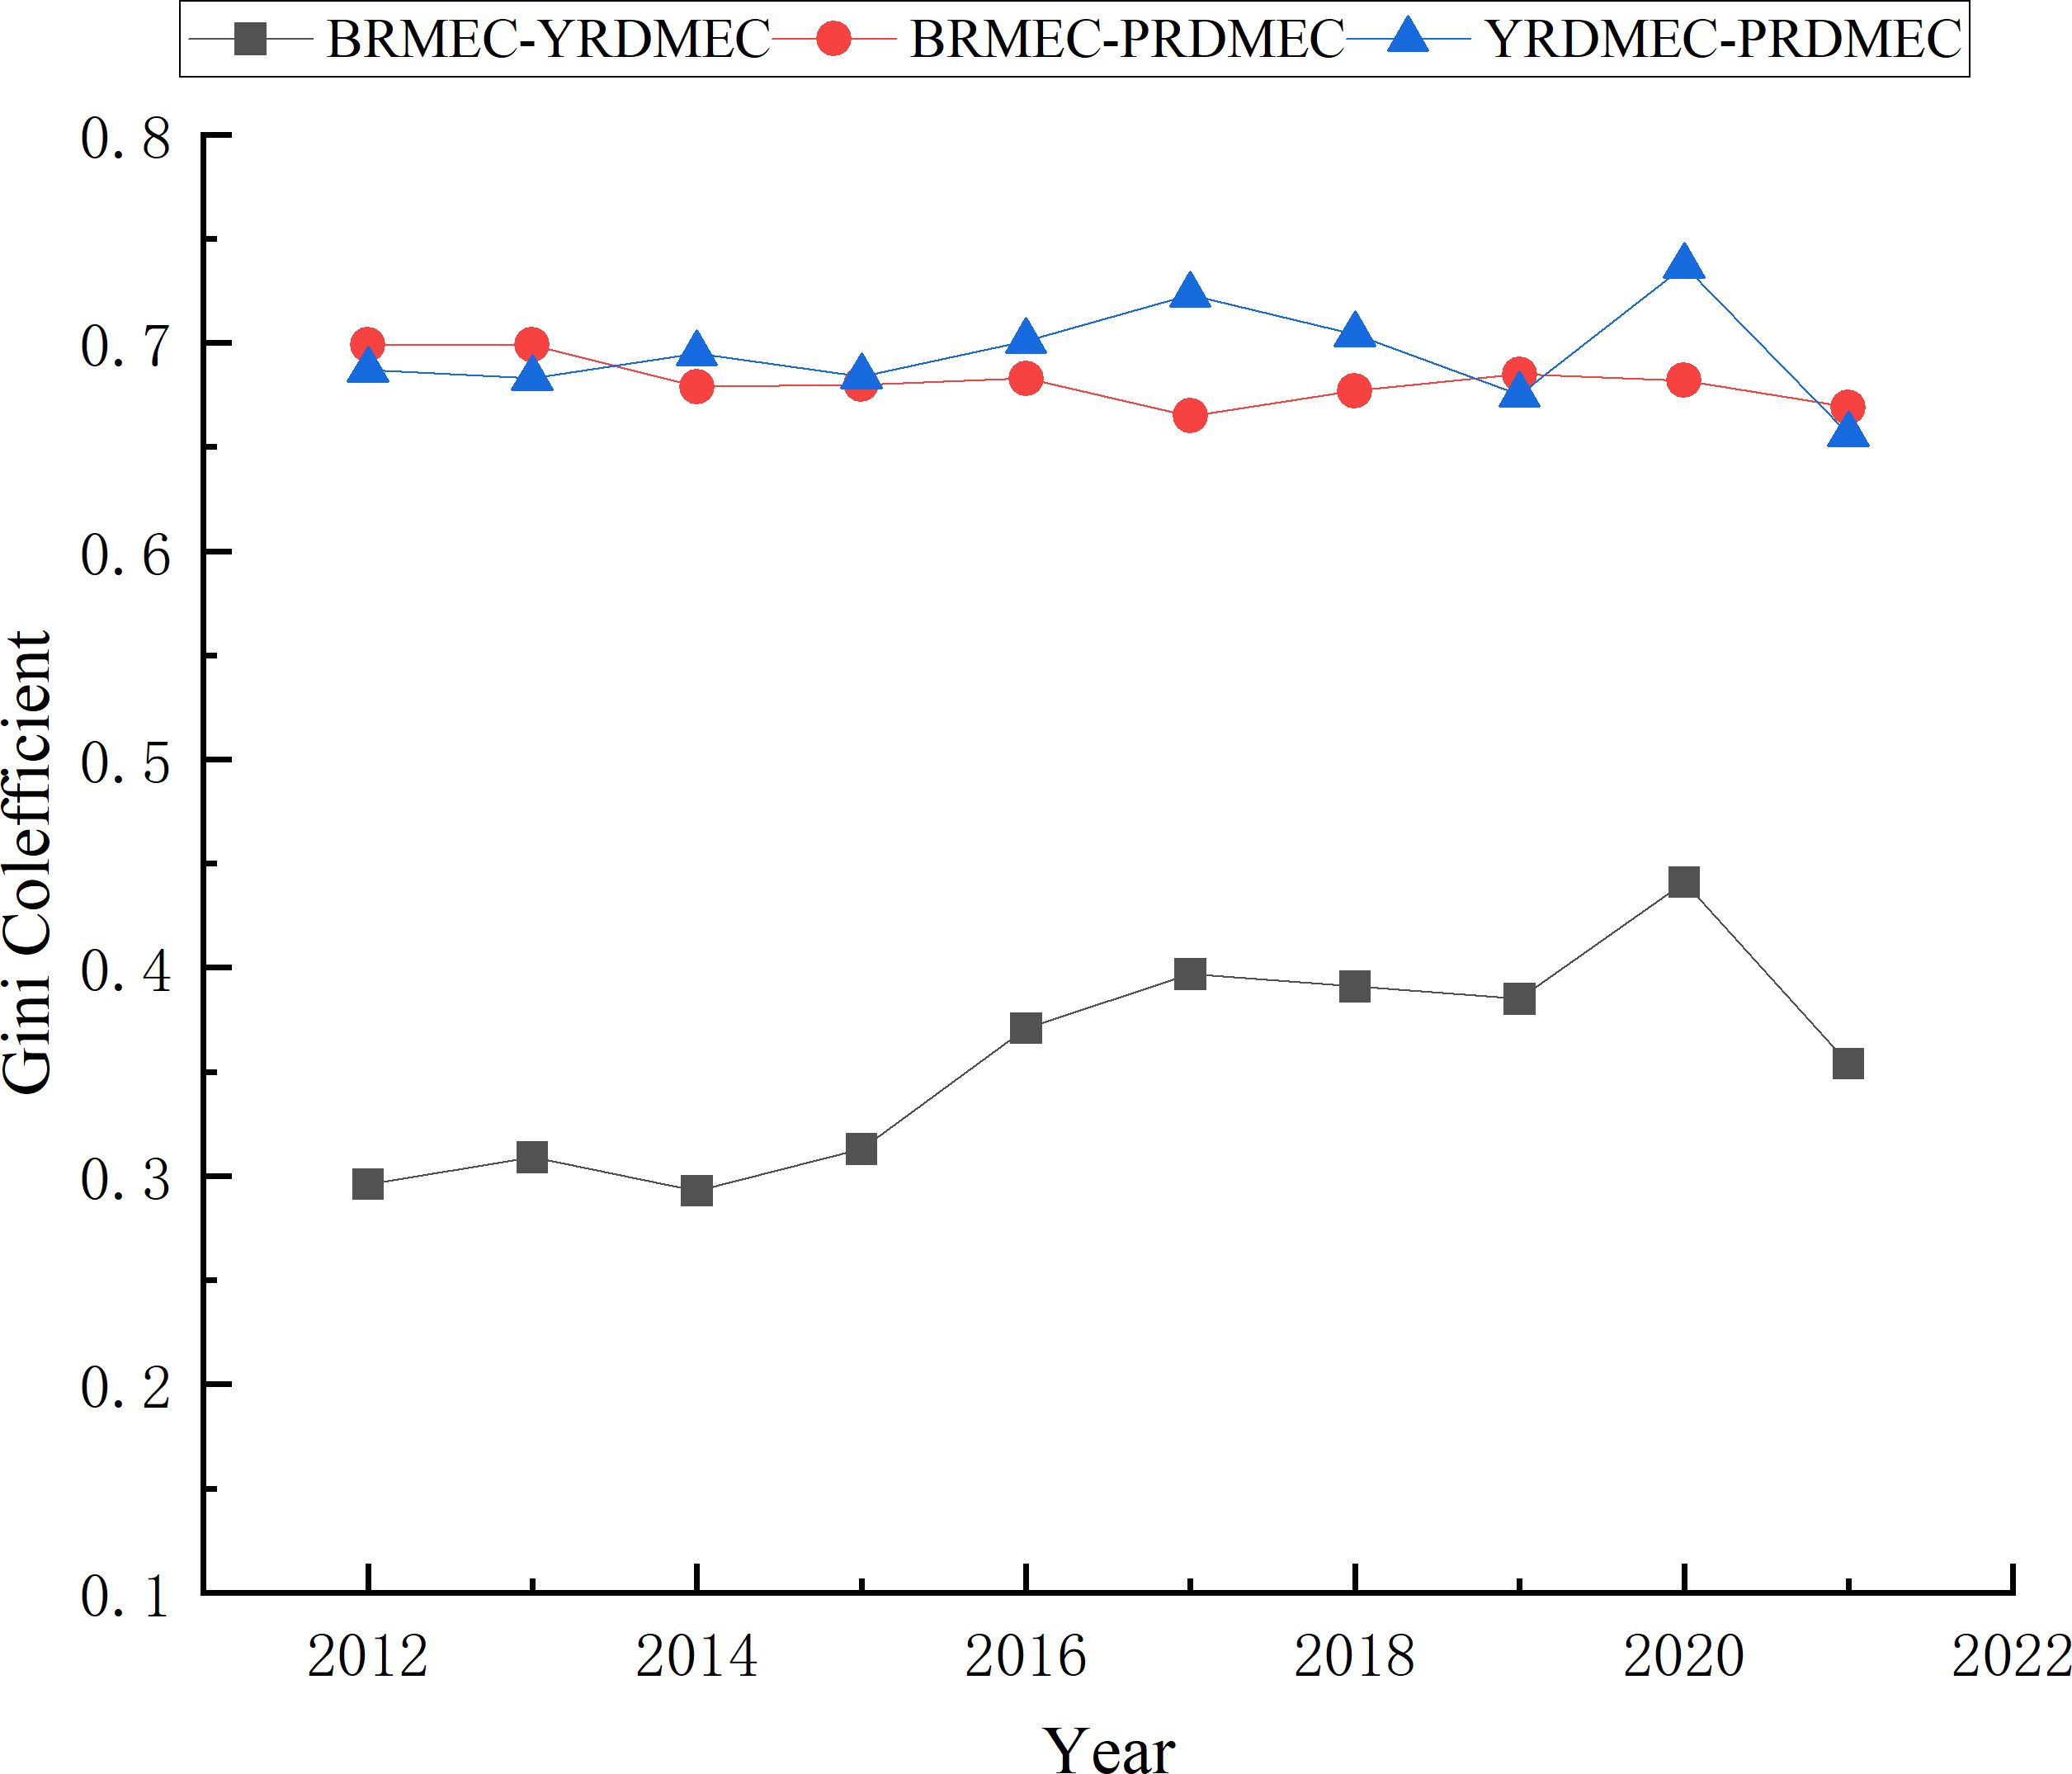
Figure 5. Inter - regional differences in marine economic development efficiency in China (2012 - 2021).
4.3.4 Sources and contributions of regional differences
Figure 6 shows the sources and contribution degrees of regional differences in the development of China’s three major marine economic zones. The research findings reveal the spatiotemporal evolution characteristics and intrinsic mechanisms of regional differences. From the perspective of dynamic evolution, the contribution of within - region differences remain relatively stable at around 30% throughout the research period, exhibiting a gradual “upward - downward - upward” trend. In contrast, the contribution of inter - regional differences shows more significant fluctuations. It decreased rapidly in the early stage and slowly rebounded later. In 2018, it reached a stage - low of 37.92% and then rose to 41.32% the following year. The contribution of transvariation density fluctuates significantly, showing an inverse U - shaped “upward - downward” trend. It peaked at 28.18% in 2018 and then decreased at an average rate of 0.03% per year.
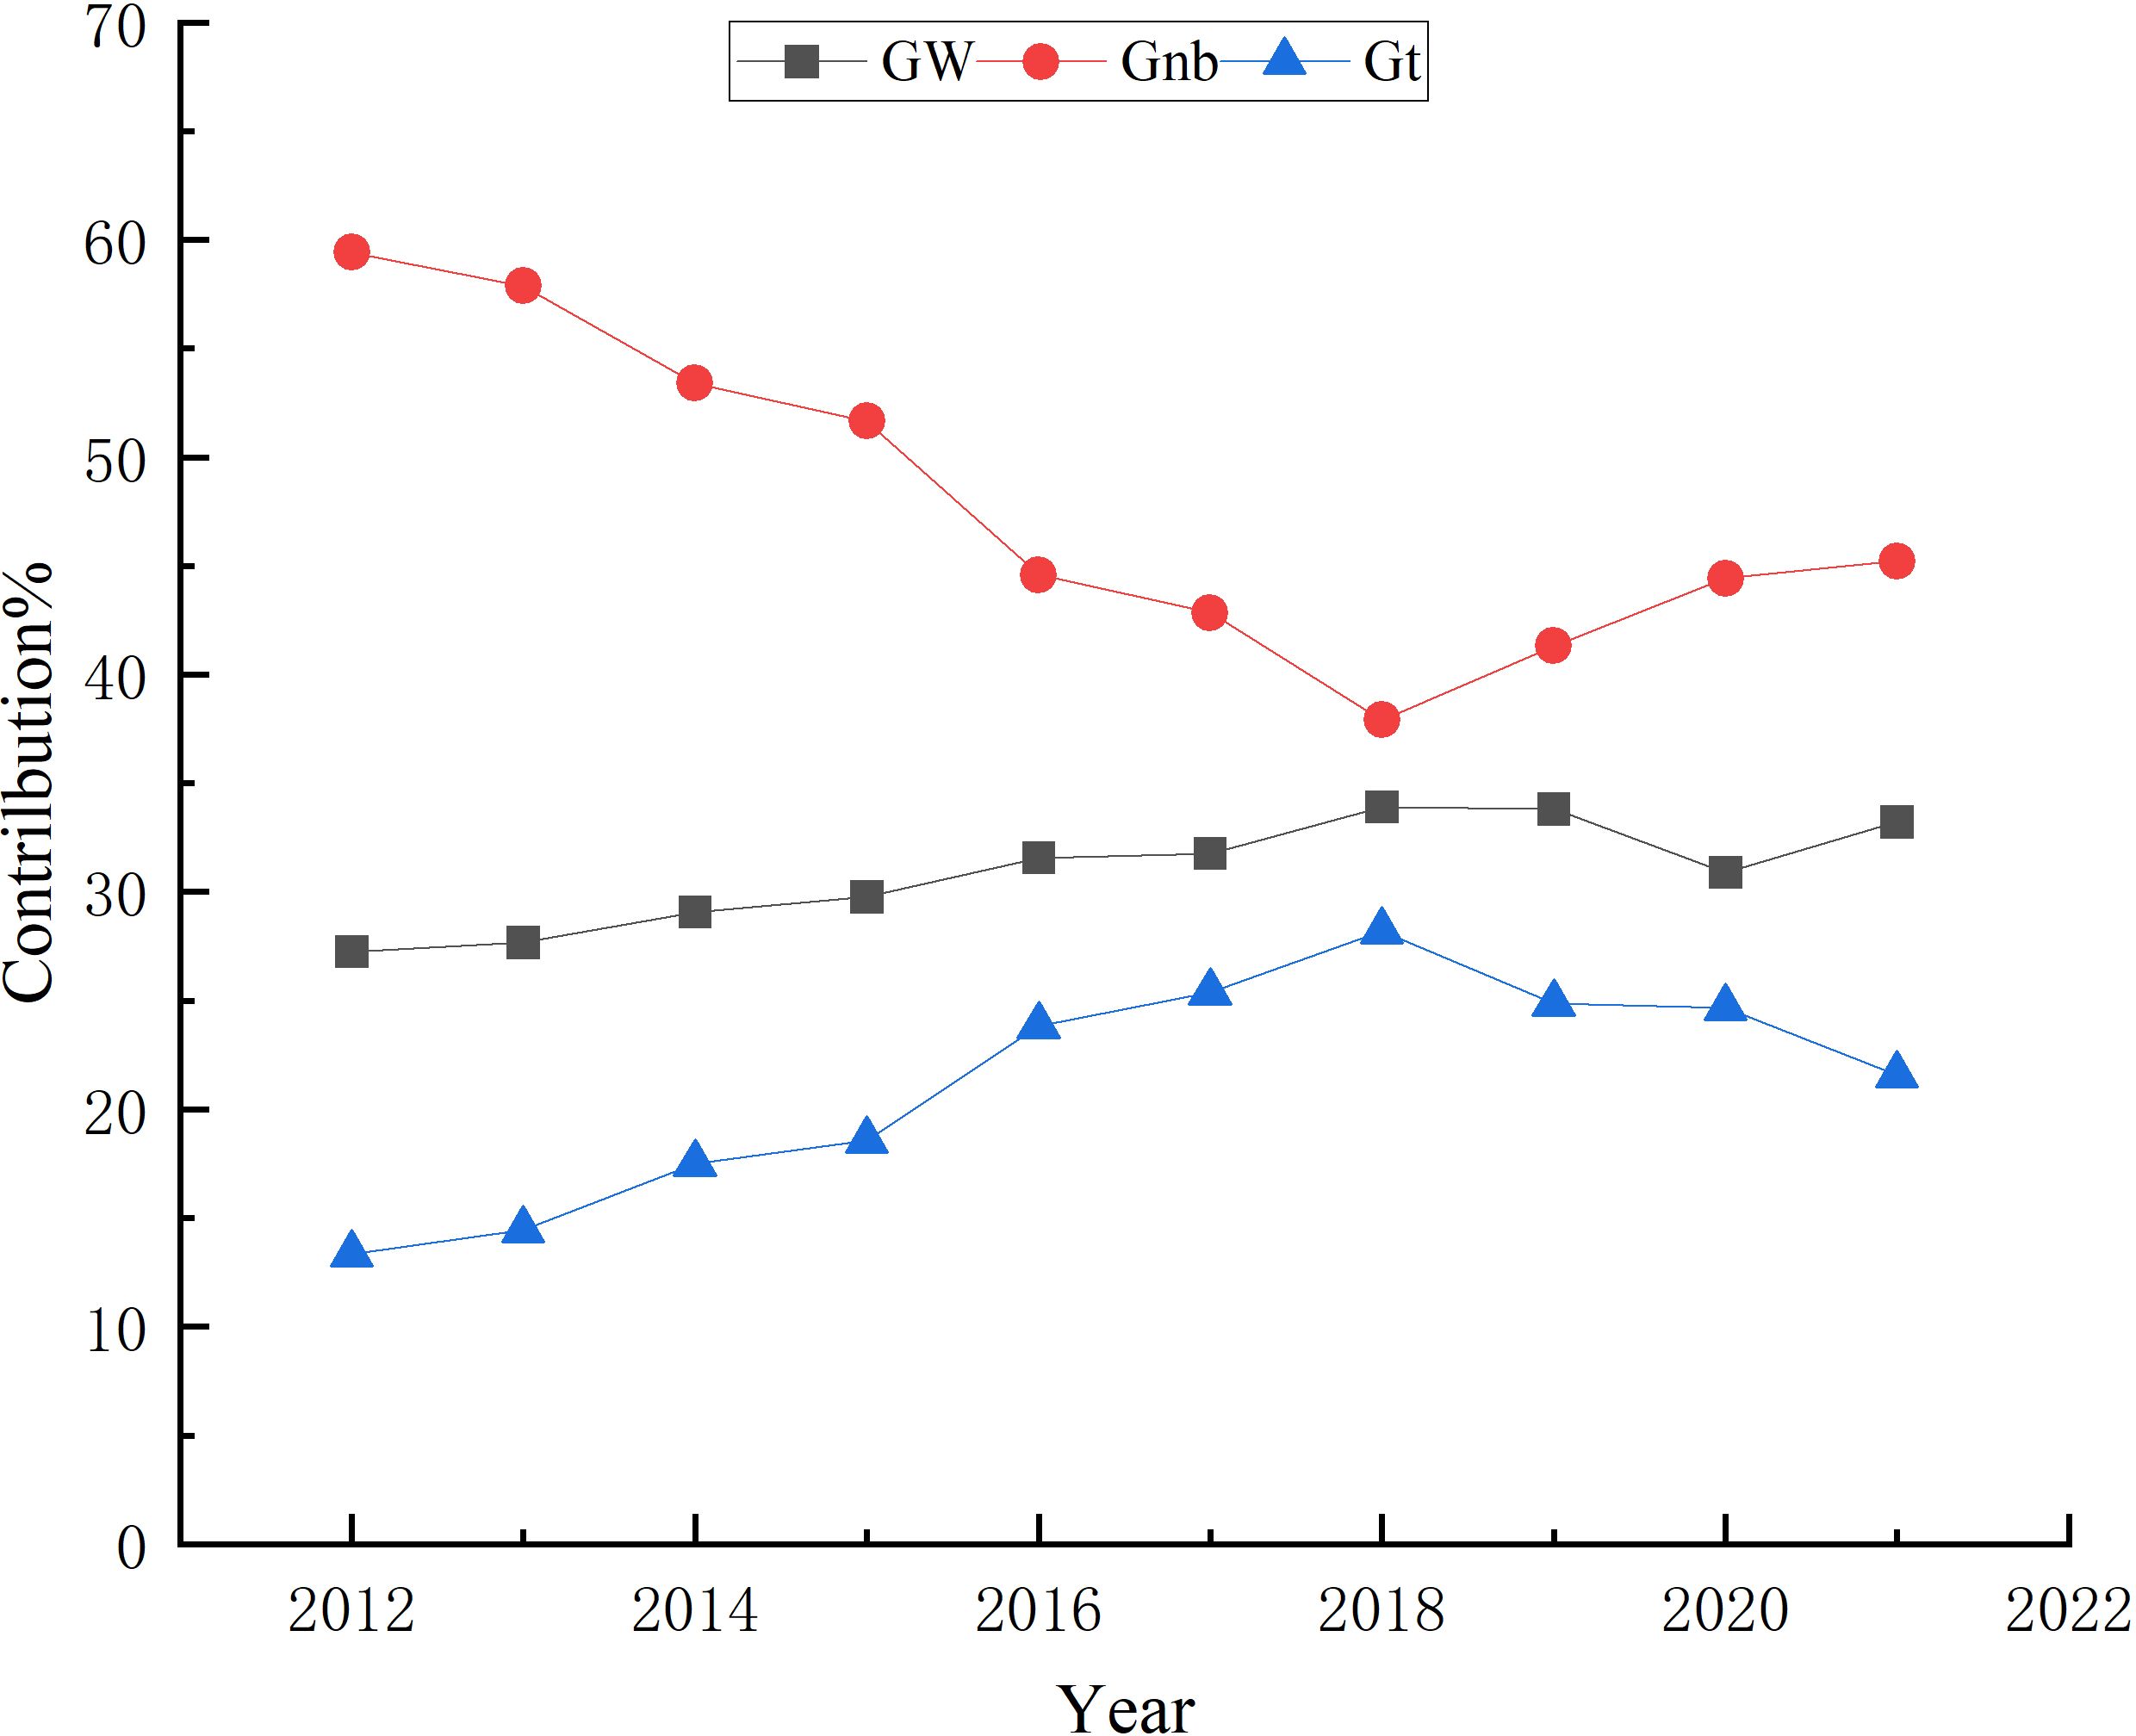
Figure 6. Contribution rates of regional differences in marine economic development efficiency in China (2012 - 2021).
In the sample period, inter - regional differences have been the main source of overall differences, with a mean contribution rate of 47.868% and long - term maintenance above 37%. This indicates that inter - regional imbalance is the primary factor causing the non - equilibrium development of China’s marine economy. The contribution of intra - regional differences is relatively small, fluctuating between 27.255% and 33.901%, with a mean of 30.897%. This indicates that internal regional development differences have a limited impact on overall differences. The contribution of transvariation density is the smallest, varying between 13.392% and 28.178%, and averaging at 21.234%. These findings provide empirical evidence for building regions with high - level marine economic development.
The study finds that the regional differences in China’s marine economic development mainly stem from inter - regional development imbalance. This conclusion offers vital evidence for creating differentiated regional coordinated - development strategies. At the same time, we should give full play to the leading role of high - level marine economic development areas. By promoting technological and institutional innovation, we can cultivate new growth poles and boost the high - quality development of the marine economy. The finding that the impact of intra-regional overlaps on overall differences is minimal creates favorable conditions for promoting coordinated development within regions.
5 Conclusions and policy recommendations
5.1 Conclusions
Improving marine economic efficiency is central to high - quality marine economic development and key to resolving the contradiction between resource and environmental limitations and sustainable development. This paper comprehensively evaluates China’s marine economic development efficiency using an undesirable output super - efficiency SBM model within the environmental production technology framework. Using the Dagum Gini coefficient and its decomposition method, this paper delves into regional differences and their sources. It also applies kernel density estimation to reveal multi - peak shifts and spatial polarization patterns in marine economic efficiency evolution. The study results demonstrate that:
1. The SBM - Global model with undesirable outputs is more accurate for efficiency measurement than traditional models, as its approach better matches real - world economic situations. From the measurement results, China’s marine economic efficiency generally rose first, then declined, and gradually stabilized afterwards. This trend shows that after a period of rapid growth, China’s marine economy is entering a phase of adjustment and optimization. China is now placing greater emphasis on environmental protection alongside economic development. The study offers vital references for creating differentiated marine economic development policies and indicates the direction for promoting high - quality marine economic growth. In the future, it is essential to focus on strengthening the management and control of undesirable outputs, optimizing the allocation of marine economic factors, enhancing technological innovation capabilities, and establishing an eco-friendly trade and circulation system. These measures will help achieve a sustained boost in marine green - economic efficiency.
2. Based on the results of the Dagum Gini coefficient decomposition, it has been found that China’s marine economic development exhibits a significant spatial imbalance, with an overall gradient development pattern of “high in the east and low in the north and south”. Specifically, in terms of within - region differences, the Pan - Pearl River Delta Marine Economic Zone shows the most significant internal disparities. Its difference level is continuously above the national overall difference level, peaking at 0.791. The Yangtze River Delta and the Bohai Rim marine economic zones have relatively small internal regional differences. However, these differences remain at a relatively high level. This phenomenon reflects significant differences in industrial structure, resource endowment, and development path among different marine economic zones. From the perspective of inter - regional differences, diversified trends of differences have emerged during the research period. The differences between the eastern coastal region and the northern and southern coastal regions are particularly prominent. This disparity is not only reflected in the economic scale but also in deeper - level development indicators such as technological innovation capacity and the degree of industrial structure optimization. From the perspective of difference contribution rates, the average contribution rate of inter - regional differences reached 47.868%, which is significantly higher than the 30.897% for intra - regional differences and 21.234% for transvariation density. This breakdown shows that inter - regional differences are the main driver of overall differences in China’s marine economic development efficiency. This finding offers vital guidance for creating differential regional policies and promoting the coordinated development of marine economies.
3. The analysis based on kernel density estimation shows that, from the perspective of absolute differences, the marine economic development levels of China’s three major marine economic zones and their internal regions have steadily improved. However, there are distinct differences in development characteristics among these regions. Specifically, the Bohai Economic Rim and the Pan - Pearl River Delta Economic Zone show a “decline in peak height and expansion in width” in their kernel density curves. This indicates that the absolute differences within these two economic zones are widening. This widening difference likely stems from the intensified divergence among cities within these regions in terms of industrial restructuring, technological innovation capacity, and resource endowment. By contrast, the kernel density curves of the eastern marine economic zone show “rising peaks and narrowing widths”, reflecting a significant reduction in internal absolute differences. This phenomenon may be attributed to the accelerated economic integration and optimized resource allocation within the region. Notably, the Bohai Economic Rim initially shows a clear bimodal distribution, indicating significant economic polarization in the region. However, over time, the kernel density curve has evolved from a bimodal to a unimodal shape. This not only indicates that economic disparities within the region are gradually narrowing but also signifies the continuous enhancement of green development’s clustering effect, with positive progress in coordinated regional development. These findings offer crucial evidence for creating differentiated regional development policies and indicate the direction for promoting the high - quality development of marine economies. Future efforts should focus on regulating regional development gaps, strengthening regional cooperation mechanisms, and steering the marine economy towards a high - quality, sustainable path.
5.2 Recommendations
Based on the above empirical analysis, this study shows there’s still significant room for improving marine economic efficiency in China’s coastal areas. As marine economic development intensifies and resource - environmental constraints tighten, balancing marine economic growth with ecological conservation is crucial for sustainable marine economic development. Under the new development pattern where green development is the core concept, this study puts forward the following policy suggestions to effectively enhance the marine economic efficiency of coastal cities:
1. The ocean economy must adhere to green development and comprehensively enhance the quality and sustainability of marine ecosystems. First, greater attention must be paid to marine-ecosystem protection and restoration. Introduce more stringent marine environmental and discharge standards while tightening enforcement and oversight to ensure these institutional constraints are effectively implemented. Advance the research, development, and widespread application of marine ecological-restoration technologies, focusing on breakthroughs in key core techniques to create replicable and scalable systematic solutions and to master a diverse array of restoration methods. Second, actively foster low-energy, low-emission marine industries and accelerate the development of green energy. Liaoning, Hebei, and Fujian can focus on developing clean-energy sources such as photovoltaic power and hydrogen to drive the green transformation of traditional marine industries. Guangdong and Shanghai should increase funding for marine-pollution control and encourage private capital to participate in ecological-restoration projects, providing tangible support for green ocean development.
2. In promoting regional marine economic development, narrowing the development gap between the three major marine economic zones is the top priority. Empirical analyses using Gini coefficients and kernel density estimation show that regional differences are the main bottleneck restricting the overall development of China’s marine economy. To achieve this, it is essential to embrace a coordinated and sustainable approach to regional development. By designing comprehensive policies that optimize resource allocation and leverage regional strengths, we can promote balanced economic growth across regions. Specifically, it is crucial to establish and improve inter - regional cooperation and communication mechanisms. This will enhance the efficiency of marine - related factors flowing across regions. Secondly, it is crucial to make full use of platforms for opening up to the outside world. We should draw on advanced management experience and development models from high - level regions, scientifically build a modern marine industrial system with sustainable development as the goal, and effectively narrow regional development gaps.
The following are the specific implementation paths: In the Bohai Economic Rim, Tianjin should give full play to the advantages of the coordinated development of the Beijing - Tianjin - Hebei region, and at the same time, it should strengthen the support for industrial assistance and technology transfer to Hebei. Hebei should actively connect with marine - economy - strong provinces like Tianjin and Shandong, accept industrial transfers actively, and focus on developing marine emerging industries. In the Yangtze River Delta Economic Zone, Shanghai should lead in deepening cooperation among Shanghai, Jiangsu, and Zhejiang. Efforts should be made to increase the proportion of the marine tertiary industry and the efficiency of technology transfer, with the goal of jointly creating a globally influential cluster of marine central cities. In the Pan - Pearl River Delta Economic Zone, Guangxi should fully leverage the locational advantage of the Guangdong - Hong Kong - Macao Greater Bay Area, actively accept industrial transfers, and learn from Guangdong’s advanced experience in developing high - tech industries. Hainan should fully leverage its ecological resource advantages, deepen the development of international tourist consumption centers, facilitate the efficient conversion of ecological value into economic value, and strive to become a new highland for marine economic development with international competitiveness.
Data availability statement
The original contributions presented in the study are included in the article/Supplementary Material. Further inquiries can be directed to the corresponding authors.
Author contributions
LZ: Methodology, Writing – review & editing, Data curation, Writing – original draft, Conceptualization, Visualization. BL: Funding acquisition, Writing – review & editing, Resources, Validation, Supervision. HY: Investigation, Data curation, Formal Analysis, Writing – review & editing.
Funding
The author(s) declare financial support was received for the research and/or publication of this article. Funding: Key Project of the Science and Technology Program (Social Sciences) for Higher Education Institutions under the Hebei Provincial Department of Education—Study on the Development of Hebei’s Characteristic Marine Economy Industries (project number:ZD202406).
Acknowledgments
The authors would like to express their sincere gratitude to Professor Liu Bangfan for his careful guidance throughout this research and for reviewing and revising the manuscript. We also thank Frontiers for providing the research platform and support. Furthermore, we appreciate the valuable suggestions and comments provided by the reviewers.
Conflict of interest
The authors declare that the research was conducted in the absence of any commercial or financial relationships that could be construed as a potential conflict of interest.
Generative AI statement
The author(s) declare that no Generative AI was used in the creation of this manuscript.
Any alternative text (alt text) provided alongside figures in this article has been generated by Frontiers with the support of artificial intelligence and reasonable efforts have been made to ensure accuracy, including review by the authors wherever possible. If you identify any issues, please contact us.
Publisher’s note
All claims expressed in this article are solely those of the authors and do not necessarily represent those of their affiliated organizations, or those of the publisher, the editors and the reviewers. Any product that may be evaluated in this article, or claim that may be made by its manufacturer, is not guaranteed or endorsed by the publisher.
Supplementary material
The Supplementary Material for this article can be found online at: https://www.frontiersin.org/articles/10.3389/fmars.2025.1671987/full#supplementary-material
References
Chen W. and Ye Y. (2024). Marine economic development and financial support: Status, prospects, and policy recommendations. Southwest Finance 11, 3–15. doi: 10.3969/j.issn.1009-4350.2024.11.xnjr202411001
Cheng M., Chen W., and Yang R. (2022). Construction of indicator system and spatio-temporal analysis of high-quality development of China’s marine economy under the maritime power strategy. Resour. Dev. Mark. 38, 8–15. doi: 10.3969/j.issn.1005-8141.2022.01.002
Dagum C. (1997). A new approach to the decomposition of the Gini income inequality ratio. Empir. Econ. 22, 515–531. doi: 10.1007/BF01205777
Ding L., Zheng H., and Wang W. (2017). Measurement and analysis of China’s marine economic productivity using an improved RAM-undesirable model. J. Cent. Univ. Finance Econ. 9, 119–128. doi: CNKI:SUN:ZYCY.0.2017-09-013
Fried H. O., Lovell C. K., Schmidt S. S., and Yaisawarng S. (2002). Accounting for environmental effects and statistical noise in data envelopment analysis. J. Product. Anal. 17, 157–174. doi: 10.1023/A:1013548723391
Gai M., Zhu J., Sun C., and Sun K. (2018). Analysis of spatio-temporal evolution and influencing factors of marine economic efficiency in China’s coastal regions. Resour. Sci. 10, 1966–1979. doi: 10.18402/resci.2018.10.06
Gai M., Zhu Y., and Zheng X. (2021). Measurement and impact mechanism of marine green development in China’s coastal provinces. Acta Ecol. Sin. 41, 9266–9281. doi: 10.5846/stxb202010062548
Guo R., Xiao G., Zhang C., and Li Q. (2025). A study on influencing factors of port cargo throughput based on multi-scale geographically weighted regression. Front. Mar. Sci. 12. doi: 10.3389/fmars.2025.1637660
Huang J., Yang X., and Hu Y. (2014). Coordination and sources of incoordination among resources, environment, and economy: evidence from the CREE-EIE analytical framework. China Ind. Econ. 7, 1730. doi: CNKI:SUN:GGYY.0.2014-07-003
Jamnia A. R., Mazloumzadeh S. M., and Keikha A. A. (2015). Estimate the technical efficiency of fishing vessels operating in Chabahar region, southern Iran. J. Saudi Soc. Agric. Sci. 14, 26–32. doi: 10.1016/j.jssas.2013.11.001
Jiang L. and Yu J. (2025). Dynamic relationship between marine environmental efficiency and marine economic growth in China based on SBM and PVAR models. Trans. Oceanol. Limnol. 47, 118–126. doi: 10.13984/j.cnki.cn37-1141.2025.02.015
Kaoru T. (2002). A slacks-based measure of efficiency in data envelopment analysis. Eur. J. Oper. Res. 143, 32–41. doi: 10.1016/S0377-2217(01)00324-1
Li S. and Zhao L. (2020). Evolution and influencing factors of China’s marine economic spatial pattern. Reg. Dev. Res. 39, 18–23. doi: 10.3969/j.issn.1003-2363.2020.04.004
State Council of the People’s Republic of China (2021). Outline of the 14th Five-Year Plan (2021-2025) for National Economic and Social Development and Vision 2035 of the People’s Republic of China. (Beijing: Xinhua News Agency).
State Oceanic Administration (2012-2021). China Marine Statistical Yearbook (Beijing: China Ocean Press).
Sun J., Jiang Z., and Hu J. (2024). Spatiotemporal evolution and driving factors of high-quality development in China’s marine economy. Acta Geogr. Sin. 79, 3110–3128. doi: 10.11821/dlxb202412008
Sun C. Z., Qin X. H., Li B., and Wang Z. Y. (2016). Study on marine economic vulnerability in the Bohai Rim region based on WSBM model. Geogr. Sci. 36, 705–714. doi: 10.13249/j.cnki.sgs.2016.05.705
Tong Z. J. (2001). Efficiency measurement of selected Australian and other international ports using data envelopment analysis. Transport. Res. Part A 35, 107–122. doi: 10.1016/S0965-8564(99)00049-X
Wang Y. (2021). Spatio-temporal evolution and convergence of green marine economic efficiency: evidence from panel data of 53 coastal cities. Bus. Econ. Manage. 11, 78–89. doi: 10.14134/j.cnki.cn33-1336/f.2021.11.006
Wang T., Xiao G., Li Q., and Biancardo S. A. (2025). The impact of the 21st-Century Maritime Silk Road on sulfur dioxide emissions in Chinese ports: evidence from a difference-in-difference model. Front. Mar. Sci. 12. doi: 10.3389/fmars.2025.1608803
Xu C., Wang Y., Yao D., Qiu S., and Li H. (2025). Research on the coordination of a marine green fuel supply chain considering a cost-sharing contract and a revenue-sharing contract. Front. Mar. Sci. 12. doi: 10.3389/fmars.2025.1552136
Yan B., Li X., and Du J. (2024). Spatial evolution and influencing factors of China’s marine economic efficiency based on the Bootstrap-DEA model. Mar. Sci. Bull. 43, 652–661. doi: 10.11840/j.issn.1001-6392.2024.05.008
Yuan Q., Zhang W., and Feng D. (2016). Analysis of marine economic efficiency and productive efficiency in China under resource and environmental constraints. Econ. Res. J. 33, 13–18. doi: 10.15931/j.cnki.1006-1096.2016.03.004
Zhao L., Zhang Y., Jiao X., Wu D., and Wu D (2016). Marine economic efficiency and its driving mechanisms in coastal regions. Ind. Technol. Econ. 7, 51–58. doi: 10.3969/j.issn.1004-910X.2016.07.007
Zhang J. L., Gao Z. X., and Yang R. (2013). Study on the development level and efficiency of marine economy in China’s coastal regions. Survey World 5), 46–50. doi: 10.3969/j.issn.1004-7794.2013.05.011
Zhang T. and Wang Y. (2025). Development pathways for new-quality marine productive forces driven by marine science and technology innovation. Environ. Prot. 53, 12–16. doi: 10.14026/j.cnki.0253-9705.2025.03.002
Zhao X., Peng Y., and Ding L. L. (2016). Analysis of spatial pattern and influencing factors of marine economic efficiency in China’s coastal regions. J. Yunnan Normal Univ. (Philosophy Soc. Sciences) 5), 112–120. doi: 10.13331/j.cnki.jhau(ss).2016.05.013
Zhao L., Zhang Y., Jiao X., et al. (2016). Evaluation of China’s marine economic efficiency based on SBM and Malmquist productivity index. Resour. Sci. 3, 461–475. doi: 10.18402/resci.2016.03.09
Keywords: marine economic efficiency, regional difference, distribution dynamics, three-stagesuper-efficient slack-based measure (SBM) model, regional development
Citation: Zhang L, Yuan H and Liu B (2025) Research on the dynamic evolution and differential analysis of the development efficiency of China’s marine economic circles. Front. Mar. Sci. 12:1671987. doi: 10.3389/fmars.2025.1671987
Received: 23 July 2025; Accepted: 02 September 2025;
Published: 25 September 2025.
Edited by:
Guangnian Xiao, Shanghai Maritime University, ChinaReviewed by:
Guangxue Wan, Shandong University, ChinaXu Changyan, Shanghai Maritime University, China
Copyright © 2025 Zhang, Yuan and Liu. This is an open-access article distributed under the terms of the Creative Commons Attribution License (CC BY). The use, distribution or reproduction in other forums is permitted, provided the original author(s) and the copyright owner(s) are credited and that the original publication in this journal is cited, in accordance with accepted academic practice. No use, distribution or reproduction is permitted which does not comply with these terms.
*Correspondence: Bangfan Liu, bGl1YmFuZ2ZhbkB5c3UuZWR1LmNu