 Pauline Denis1,2*
 Arthur Capet1,3
 Jan Vanaverbeke1,2
 Thomas R. H. Kerkhove1
 Geneviève Lacroix1
 Sébastien Legrand1
- 1Operational Directorate Natural Environment, Royal Belgian Institute of Natural Sciences, Brussels/Ostend, Belgium
- 2Marine Biology Research Group, Department of Biology, Ghent University, Ghent, Belgium
- 3B-GEOSYS, Department of Geoscience, Environment & Society, Université Libre de Bruxelles, Brussels, Belgium
Floating photovoltaic installations (FPV) are among the promising emerging marine renewable energy systems contributing to future global energy transition strategies. FPVs can be integrated within existing offshore wind farms, contributing to more efficient use of marine space. This complementarity has gained increasing attention as a sustainable approach to enhance green energy production while reducing offshore grid infrastructure costs, particularly in the North Sea. This study presents a first assessment to quantify the mid- and far-field hydrodynamic effects of FPVs (elevated design) deployed within an existing offshore wind farm (OWF) in the Belgian part of the North Sea. A subgrid-scale parameterization was adopted into the 3D hydrodynamic model COHERENS to assess impacts on four key hydrodynamic metrics: surface irradiance reduction due to shading, changes in current velocity fields, turbulent kinetic energy production, and variations in current-induced bottom shear stress. Four scenarios were compared: a baseline without structures, a scenario with only offshore wind turbines and two combined wind and photovoltaic configurations (sparse and dense). At farm scale, simulations showed small effects of FPV shading on sea surface temperature (< 0.1°C), but significant reductions in current speed, increased turbulent kinetic energy mainly beneath the floaters, and a noticeable impact on bottom shear stress. This hydrodynamic modeling study constitutes a first step toward a comprehensive environmental impact assessment of FPVs, particularly in relation to their biogeochemical effects on the water column and benthic habitats. The findings provide valuable insights to support sustainable marine spatial planning, environmental assessments, and industrial design strategies in the North Sea and beyond.
1 Introduction
Marine renewable energies are key components of current energy transition strategies in Europe. With an area of 570,000 km², the North Sea is particularly well-suited for offshore renewable energy structures due to its strong and consistent winds, relatively shallow waters, and proximity to energy-demanding regions in Europe. Existing offshore infrastructure, the region’s oil and gas experience, and local expertise in offshore engineering further support the development of offshore wind farms (OWFs) and other offshore renewable projects (Martins et al., 2023). Consequently, the North Sea has hosted many pioneering developments (Santhakumar et al., 2024). Offshore wind farms (OWFs) in the North Sea currently supply around 25.8 GW of power with an ambition to reach at least 120 GW by 2030 and 300 GW by 2050 (Ostend Declaration, 2023). The Belgian part of the North Sea (BPNS, 3,454 km²), currently hosts eight OWFs with 399 wind turbines and a total installed capacity of 2.26 GW. Foreseen expansion through an additional designated area, aims to double wind energy production in the BPNS in the coming years (Rumes et al., 2023).
Wind energy production on its own remains intermittent due to natural variability and thus lacks controllability (Buatois et al., 2014). To address this issue, resilient and sustainable energy strategies aim to integrate wind energy into hybrid renewable energy production systems, to exploit the natural complementarity in the availability of different intermittent renewable energy sources. Offshore floating photovoltaic (PV) installations have emerged as a promising complementary technology, particularly in areas where conditions are unsuitable for deploying wave or tidal energy converters. Combining wind and solar infrastructure is increasingly recognized as a sustainable option to reduce offshore grid costs per kWh in the North Sea (Delbeke et al., 2023).
While several floating solar energy farms have been built and studied worldwide (e.g. Benjamins et al., 2024; Exley et al., 2021; Vo et al., 2021), they are mostly located on rivers, lakes or reservoirs. Deploying such floating systems offshore introduces greater logistical complexity and risks due to waves and wind (Vo et al., 2021). Nevertheless, deploying floating PV installations (FPV) into existing OWFs in the North Sea offers three main advantages: (1) wind-solar complementarity ensures a more continuous energy generation, with PV generating power during sunny, low-wind conditions and wind turbines producing during windier, but often cloudier periods when solar irradiance is reduced, (2) space optimization, as the multi-use concept avoids the need for additional space in the already crowded North Sea (Stelzenmüller et al., 2022), and (3) the possibility of utilizing and integrating in the power network already present for the OWFs (Delbeke et al., 2023).
In the emerging offshore PV sector, two types of installations are being explored: floating mattress systems, where PV arrays laid directly on the sea surface, and elevated systems, where panels are mounted several meters above the sea surface on rigid structures and large floaters. Early deployments, both inland and offshore, largely used the floating mattress design, in direct contact with the sea surface (Vo et al., 2021; Vlaswinkel et al., 2023; Benjamins et al., 2024). However, recent offshore projects increasingly favor elevated systems, which provide an air gap beneath the solar panels and better protect electrical equipment (photovoltaic cells, cables, electronics) from harsh marine conditions such as waves and strong tidal currents (Wang and Lund, 2022; Ji et al., 2025). It has been showed that the cooling effect of the sea water and the wind could influence the efficiency of FPV arrays, while the main drawback of elevated FPVs remains their higher construction cost due to increased material and engineering requirements (Claus and López, 2022). To date, both approaches remain considered by industrials.
The deployment of such large-scale infrastructure in marine ecosystems comes with significant environmental challenges (Copping et al., 2025). The first impact that comes to mind for solar devices is shading. By intercepting sunlight before it reaches the ocean surface, FPVs reduce underwater irradiance (Benjamins et al., 2024; Hooper et al., 2021), which can negatively affect photosynthetic organisms and primary production (Karpouzoglou et al., 2020; Exley et al., 2021). Elevated FPVs are expected to allow more diffuse light to reach the water than floating mattress. Although the shading impact is hypothesized to be less significant, field evidence and detailed literature on this aspect are currently not available.
FPVs also introduce direct underwater effects. FPV technologies involve substantially more submerged structures than other offshore renewable solutions. For equivalent power capacity, elevated designs are expected to involve approximately 20 times more submerged surface than wind turbine foundations (Tractebel, pers. comm.). These submerged structures can alter hydrodynamic processes (Benjamins et al., 2024), acting as obstacles to flow circulation by modifying current fields (Van Der Eijk et al., 2024), generating turbulence (Karpouzoglou et al., 2020) and potentially impacting bottom shear stress. Offshore wind studies have shown that monopiles can generate energetic wakes downstream of the structures, which can affect the local marine environment by enhancing turbulence and vertical mixing (Rennau et al., 2012; Schultze et al., 2020), thereby generating turbid wakes (Baeye and Fettweis, 2015), weakening water column stratification (Carpenter et al., 2016; Christiansen et al., 2023) or disturbing natural sediment transport processes (Rivier et al., 2016).
It is also expected that FPVs will directly affect local ecosystem functioning (Benjamins et al., 2024; Hooper et al., 2021). The submerged components of FPVs provide additional artificial hard substrates in the marine environment, next to the OWF monopile foundations, promoting biological colonization by filter-feeding organisms like mussels, barnacles and amphipods (Mavraki et al., 2023). These organisms not only remove particles from the water for feeding (Voet et al., 2023), but also produce large amounts of fecal pellets (FPs) (Mavraki et al., 2022), which enhance organic carbon (OC) deposition on the seabed (Coates et al., 2014; Ivanov et al., 2021). This alters key habitat characteristics for benthic and demersal organisms (Lefaible et al., 2019; Coolen et al., 2022; Lefaible et al., 2023). While this phenomenon has been substantially documented, the extent of such deposition of particulate matter depends heavily on local hydrodynamical conditions, including tidal currents, bottom shear stress and water column mixing. Changes in near-bed hydrodynamics are particularly relevant in the context of environmental legislation such as the European Marine Strategy Framework Directive (MSFD), which states that permanent alteration of hydrographical conditions to the seabed and the water column does not adversely affect benthic habitats (Commission Decision (EU) 2017/848, 2017). Several EU Member States, including Belgium, use bottom shear stress the key indicator to assess the impacts of hydrodynamic alterations on the benthic habitats. In the Belgian context, a variation exceeding 10% of the average bottom shear stress is used as an early warning indicator for risk of local changes in the sedimentation-resuspension pattern, justifying the development of an ad-hoc benthic environmental monitoring program (Belgian State, 2025). Given the increased submerged surfaces induced by FPVs and potential hydrodynamical impacts, the biogeochemical effects observed in OWFs impact studies cannot be extrapolated to FPVs without dedicated assessment of their effects on water flow circulation.
This study therefore aims to quantify the mid- and far-field hydrodynamic impacts of FPV units on key variables, such as current velocity, turbulent kinetic energy (TKE) and bottom shear stress. The case study focuses on adding elevated FPV units, modelled after the Seavolt rigid semi-submersible design (DEME et al., 2023), to an existing Belgian OWF area. To quantify FPV-induced perturbation on these variables, a high-resolution (50 x 50 meter) 3D circulation model is set up for the area (domain ~ 25 km), with subgrid-scale parameterization of submerged obstacles. FPV-induced hydrodynamic impacts are compared to natural variability ranges in this tidal shallow region, under both spring and neap tidal conditions, across winter and summer periods. Finally, the FPV-induced impacts are evaluated alongside those of wind turbine foundations, and their combined (cumulative) effect is assessed across the OWF area and its surroundings, resulting from the multi-use of offshore wind and solar infrastructure in a single concession.
2 Materials and methods
2.1 Study area
The Belgian part of the North Sea (BPNS) spans 3,454 km², with a 67 km coastline and a maximum offshore distance of 78 km (Figure 1A). The BPNS is relatively shallow, with depths up to 50 meters, and consists primarily of sandy sediments, in addition to some gravelly and muddy areas. No seasonal stratification develops in the shallow BPNS.
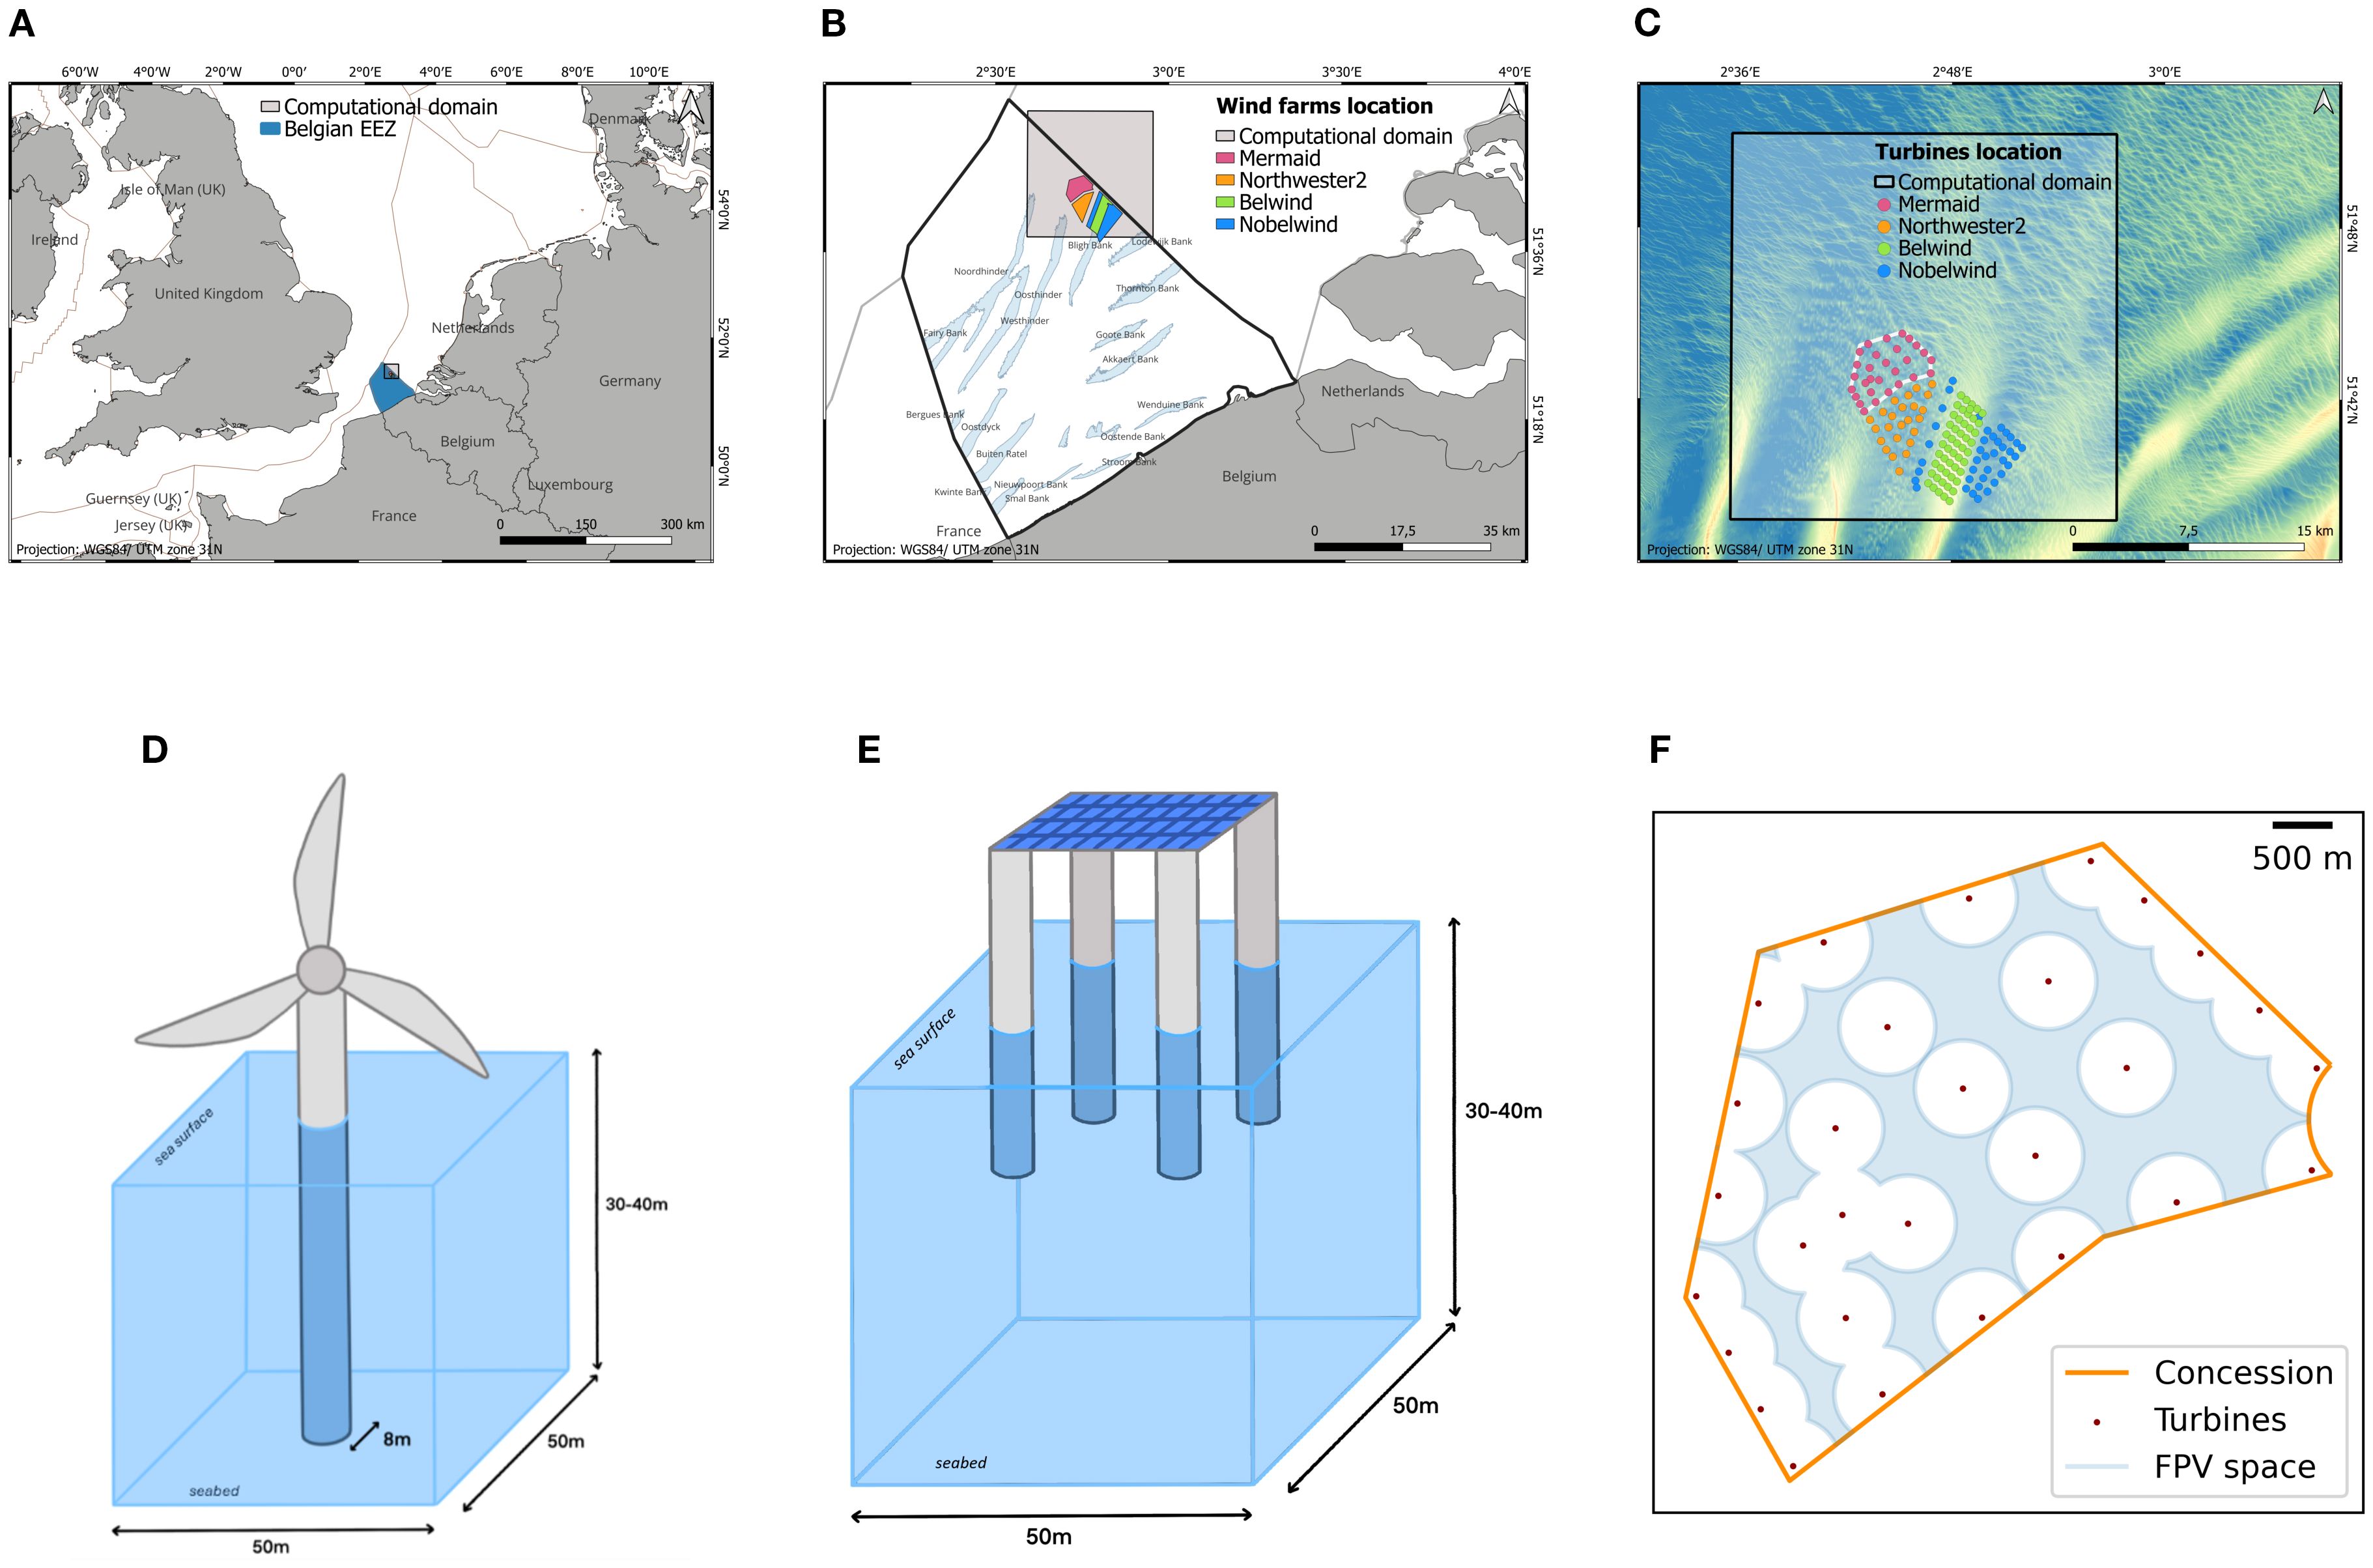
Figure 1. (A) Belgian EEZ. (B) Offshore wind farm locations and computational domain. (C) Turbines of Mermaid OWF (pink dots) and surrounding wind turbines. (D) Schematic of a wind turbine monopile in a grid cell. (E) Schematic of a FPV unit in a grid cell. (F) Available area for FPV deployment within the Mermaid OWF concession.
The Belgian OWF ‘Mermaid’ (https://map.4coffshore.com/offshorewind/; https://odnature.naturalsciences.be/mumm/en/windfarms/project/5: 25th July 2025, date last accessed), was selected for modeling the hydrodynamic impacts of combining offshore floating solar with offshore wind structures. The Mermaid OWF has been operational since 2020, with a total installed capacity of 235 MW. It spans 16.27 km², hosting 28 offshore wind turbine monopiles with an 8 m diameter each. It is the most offshore Belgian OWF, located at an average distance of 54 km (Figures 1B, C), with a water depth ranging from 25 m to 40 m.
The hydrodynamics of the Southern Bight of the North Sea, particularly in the Belgian coastal zone, is primarily influenced by the Atlantic Ocean, with a dominant northwest flow (Otto et al., 1990; Pätsch et al., 2017; Ivanov et al., 2020). Circulation in this region is mainly driven by Atlantic tides, shaped by bathymetry and the irregular coastline (Ivanov et al., 2020). The predominant tidal component is the lunar semi-diurnal tide (M2), while wind forcing and significant river inputs further modulate the dynamics. Offshore, tidal ellipses align parallel to the northward direction, with tidal velocities reaching up to 1 m.s-1 along the major axis, while minor-axis velocities remain below 0.2 m.s-1. The residual current in this area is much weaker than the tidal circulation, flowing in northeastern direction. Near the seabed, the residual current is even weaker, with a typical intensity of around 0.02 m.s-1 (Ivanov et al., 2020).
2.2 Model description
The model used in this work is the COupled Hydrodynamical-Ecological model for REgioNal and Shelf seas, COHERENS (https://doi.org/10.5281/zenodo.11261106: 25th July 2025, date last accessed). COHERENS is a three-dimensional hydrodynamic model designed for a wide range of applications in coastal and continental seas, estuaries, lakes and reservoirs. Its open-source code is freely available to the scientific community and has been widely applied in the last twenty years (https://ecomod-rbins.github.io/website/tools/COHERENS: 19th September 2025, date last accessed). COHERENS is a numerical model that solves the Reynolds-averaged Navier-Stokes equations using the Boussinesq and hydrostatic assumptions. The COHERENS user manual provides a detailed description of the model equations and implementations (Luyten et al., 2025).
A model grid is made up of grid cells where the inflow and outflow of scalar quantities and currents are computed at different nodes of the grid cell. Different physical variables are defined and computed at different nodes. Finite differences are used to discretize the mathematical model in space and the model equations are horizontally discretized on an “Arakawa-C” grid (Mesinger and Arakawa, 1976). COHERENS solves the 3D equations of environmental flows and offers the possibility to choose many different formulations corresponding to a multitude of physical contexts, constraints, parameters and assumptions. A Total Variation Diminishing (TVD) advection scheme was used for the scalar quantities, the 2D depth-integrated currents and the 3D currents. The type of limiting function for the TVD scheme chosen is the least diffusive “Superbee limiter” (Roe, 1986; Sweby, 1984). The same way as in Rennau et al. (2012) and Christiansen et al. (2023), the advection of turbulent quantities had been disabled due to model limitations at these spatial scales. For the horizontal diffusion, the Smagorinsky formulation (Smagorinsky, 1963) was used for momentum and scalars quantities. Regarding turbulence, the turbulence closure model has been utilized, where is the turbulent kinetic energy and is the rate of dissipation of turbulent kinetic energy (Burchard and Baumert, 1995). The turbulence closure model transports TKE wakes produced by the presence of structures (FPV or offshore wind turbines). With the turbulence closure model, the dissipation rate of is more realistic compared to a constant dissipation rate.
Modeling the impacts of offshore structures on hydrodynamic variables, such as currents and turbulence, at this resolution is challenging and requires a subgrid-scale parametrization. When resolving the precise dynamics of a cylindrical structure is not feasible, primarily due to grid resolution limitations, the effects of the structure are parameterized within the 3D grid cell (Figures 1D, E). In our case, the wind turbine foundation or solar panel floater introduces a drag force, represented as a negative acceleration in the momentum equations (Equations 2, 4, 5). This kinetic energy loss is then transferred into turbulent kinetic energy production and dissipation (Equations 8–10) (Rennau et al., 2012; Christiansen et al., 2023). Further details on drag force and turbulence parametrization are provided in the next section.
2.3 Subgrid-scale parametrization of offshore structures
2.3.1 Drag force and turbulence
To accurately represent current-structure interactions, given the small grid cell size relative to the scale of the structures, a 3D subgrid-scale parametrization is required within the equations. The model solves the Reynolds-averaged Navier-Stokes equations for current dynamics at its resolution scale (Equations 3–6). This approach models the effects of structures within each grid cell rather than explicitly representing cylindrical structures in the model. In this study, a horizontal grid resolution of 50 x 50 meter is used.
To represent the effect of structures on currents, we apply the action-reaction principle. It is assumed that structures in the water column, such as FPV floaters and wind turbine foundations generate a drag force that slows down the current (Equation 1). The lost kinetic energy in then transferred into a new turbulent kinetic energy production term (Equation 8).
This approach is relatively standard and has been used to model many applications, such as for vegetation canopy (Wilson and Shaw, 1977; Svensson and Häggkvist, 1990; Nepf, 1999; Cantalice et al., 2019, Bo et al., 2024) or longlines mussel aquaculture farms (Grant and Bacher, 2001; Plew et al., 2005, Lin et al., 2016). It has already been adopted in previous modeling studies to assess hydrodynamic impacts of wind turbine foundations (Rennau et al., 2012; Carpenter et al., 2016; Rivier et al., 2016; Christiansen et al., 2023).
The drag force exerted by a structure perpendicular to an unstratified flow is expressed as follows:
where is the drag coefficient of the structure [-], is the sea water density [kg.m-3], is the frontal area of the structure that is exposed to the free stream [m²] (Carpenter et al., 2016) and the norm of the current velocity [m.s-1].
For the current study, we applied specific values of the drag coefficient determined from laboratory experiments: for the FPV floaters and for turbines foundations (Tractebel, pers. comm.). These drag coefficients are treated as constants throughout the year, are specific to each infrastructure material, and do not account for marine growth.
Two new terms were therefore implemented and computed in the model for each grid cell and timestep: a drag force, seen as a negative acceleration along the X-axis, and one along the Y-axis calculated as:
where is the area density of the structures [m-1] with the number of structures (monopile foundation or FPV floater) per grid cell [-], the structure diameter [m] and the horizontal area of the grid cell for which the deceleration of the flow due to drag is applied [m²] (Rennau et al., 2012).
To take into account the deceleration induced by the structures in the concerning grid cells, drag forces and (Equation 2) are added to the respective - and - momentum equations in the 3D hydrostatic model COHERENS:
where are the horizontal velocity components, the vertical velocity (Equation 7), the pressure, the components of the horizontal momentum diffusion tensor, the vertical eddy viscosity, the density where is the uniform density and the density variation, and the gravitational acceleration .
The coefficient is calculated as a function of the turbulent kinetic energy per unit mass, [J.kg-1] and its dissipation rate, [W.kg-1].
Where is the non-dimensional stability function containing the algebraic second-moment turbulence closure (Umlauf et al., 2005).
The fundamental assumption is that the kinetic energy loss caused by the presence of structures becomes a new turbulent kinetic energy production term. Based on the equations for turbulence closure, a new source term is added to the equations corresponding to the kinetic energy loss i.e. the work exerted by the structure on the current (Plew et al., 2005; Christiansen et al., 2023).
This new turbulent kinetic energy generation term is written as.
This additional source term is added to the turbulence closure equations for the turbulent kinetic energy and its dissipation. That will allow for the consideration of subgrid-scale turbulence wake production (Svensson and Häggkvist, 1990; Rennau et al., 2012; Rivier et al., 2016; Christiansen et al., 2023).
where is the shear production, is the buoyancy production, and are the Schmidt numbers (Hossain and Rodi, 1982). ( are model weighting parameters for the dissipation source and sink terms (Umlauf and Burchard, 2003; Rennau et al., 2012; Christiansen et al., 2023), defined in COHERENS as .
Rennau et al. (2012) investigated the importance of the parameter, especially connected to structures mixing efficiency context. Following a calibration study, they concluded that determined an upper limit value and they suggested for strong mixing scenarios and for weak mixing scenarios. In this work, we use an intermediate value i.e. for the simulations.
The two-equations model (Equations 9, 10) is central to the dynamics of this subgrid-scale implementation. The presence of structures generates current disturbance wakes, which transport eddies that gradually detach from the structures, carry energy, and dissipate through the turbulent closure . It is important to note here that not all dynamics are represented; for instance, Von Karman vortices are not representable given the resolution used.
2.3.2 Shading
As a first step in assessing the impact of FPVs on the marine heat budget and temperature, we considered a reduction in the downward solar radiative heat flux. [W.m-2] represents the incident solar shortwave radiation reaching the sea surface. In each model cell containing a FPV unit, is reduced proportionally to the ratio of the FPV’s horizontal surface area within the cell to the total cell surface. The surface solar irradiance reduced by the shading of FPVs is expressed as:
with the natural surface solar irradiance [W.m-2], the fraction of covered surface with a value between 0 and 1, the solar surface irradiance altered by shading and used thereafter in the model heat budget. As the downward solar radiative heat flux is more considerable in summer than winter, only a summer simulation has been performed. In this first-order approach and considering that FPVs are elevated several meters above the sea surface, no alteration of the sensible and latent heat fluxes are considered in the simulations.
2.4 Model experiments/setups
2.4.1 Computational domain and scenarios
A 3D computational grid covering approximately 25 km around the Mermaid OWF was implemented (Figures 1B, C), with a horizontal grid resolution of 50 x 50 meter. Bathymetric data were derived from Flemish Hydrography datasets for this area (https://www.agentschapmdk.be/en/hydrographical-data: 25th July 2025, date last accessed). Meteorological forcings were obtained from the ERA5 dataset provided by the Copernicus Climate Change Service (C3S, 2018) for the year 2020. The water column was discretized into 15 non-uniform -levels, with a refined vertical resolution near the surface. For hydrodynamic open boundary condition forcings (2D currents, 3D currents, temperature, salinity), a nesting approach was used within the North Sea. This one-way nesting allows information to flow from a coarser-resolution parent grid to a finer-resolution child grid nested within it. The nesting hierarchy begins with the entire North Sea (~5000 m resolution), proceeds through intermediate subdomains with resolutions approximately 2000 m and 800 m, continues into the BPNS (~250 m resolution), and ultimately reaches the final computational domain at 50 m resolution.
The spatial distribution of the FPV installation is constrained by the extent of the concession area and the location of the wind turbines. The selected concession covers a total area of 16.27 km2, housing 28 turbines with monopile foundations of 8 m in diameter (https://www.otary.be/en/projects/seamade: 25th July 2025, date last accessed). We included a safety distance of 400 m between the monopiles and FPV units to account for operational and maintenance activities, reducing the usable area for FPV deployment to 6.3 km2 (Figure 1F).
FPV deployment scenarios were constructed based on these spatial constraints and on the technical design specifications provided by FPV developers. The FPV units are grouped in larger blocks, which are arranged within the computational domain with either east-west or north-south orientations. This configuration facilitates model implementation and aims to maximize the use of the available space.
Two types of structures are implemented in this study: offshore wind turbine monopile foundations and FPV units (Figures 1D, E). The primary difference between these structures, beyond their diameter, lies in their interaction with the water column. Wind turbine monopiles are embedded in the seabed and influence hydrodynamics throughout the entire water column, whereas FPV units are floating elevated structures anchored to the seabed, similar to the Seavolt rigid semi-submersible design (DEME et al., 2023), with their floats submerged by approximately between 3 m and 5 m. The grid resolution was chosen to ensure that each computational cell contains only a single structure (Figures 1D, E). The dimensions of FPV units are intentionally omitted for confidentiality reasons.
Four scenarios are analyzed and compared in this paper (Figure 2): (1) a baseline scenario with no structures (‘BASE’), (2) a scenario including only offshore wind turbines (‘WIND’), (3) a combined wind and sparse photovoltaic density where 9.8% of the available area is covered with FPV units, corresponding to a solar power capacity of 126 MW (‘WIND + SPARSE’) and (4) a combined wind and dense photovoltaic density, where 19.6% of the available area is used for FPVs, corresponding to a solar power capacity of 252 MW (‘WIND + DENSE’). Wind turbines from surrounding OWF concessions are also included in scenarios (2), (3) and (4), except for those located too close to the domain boundaries, to avoid numerical instabilities (Figure 1C).
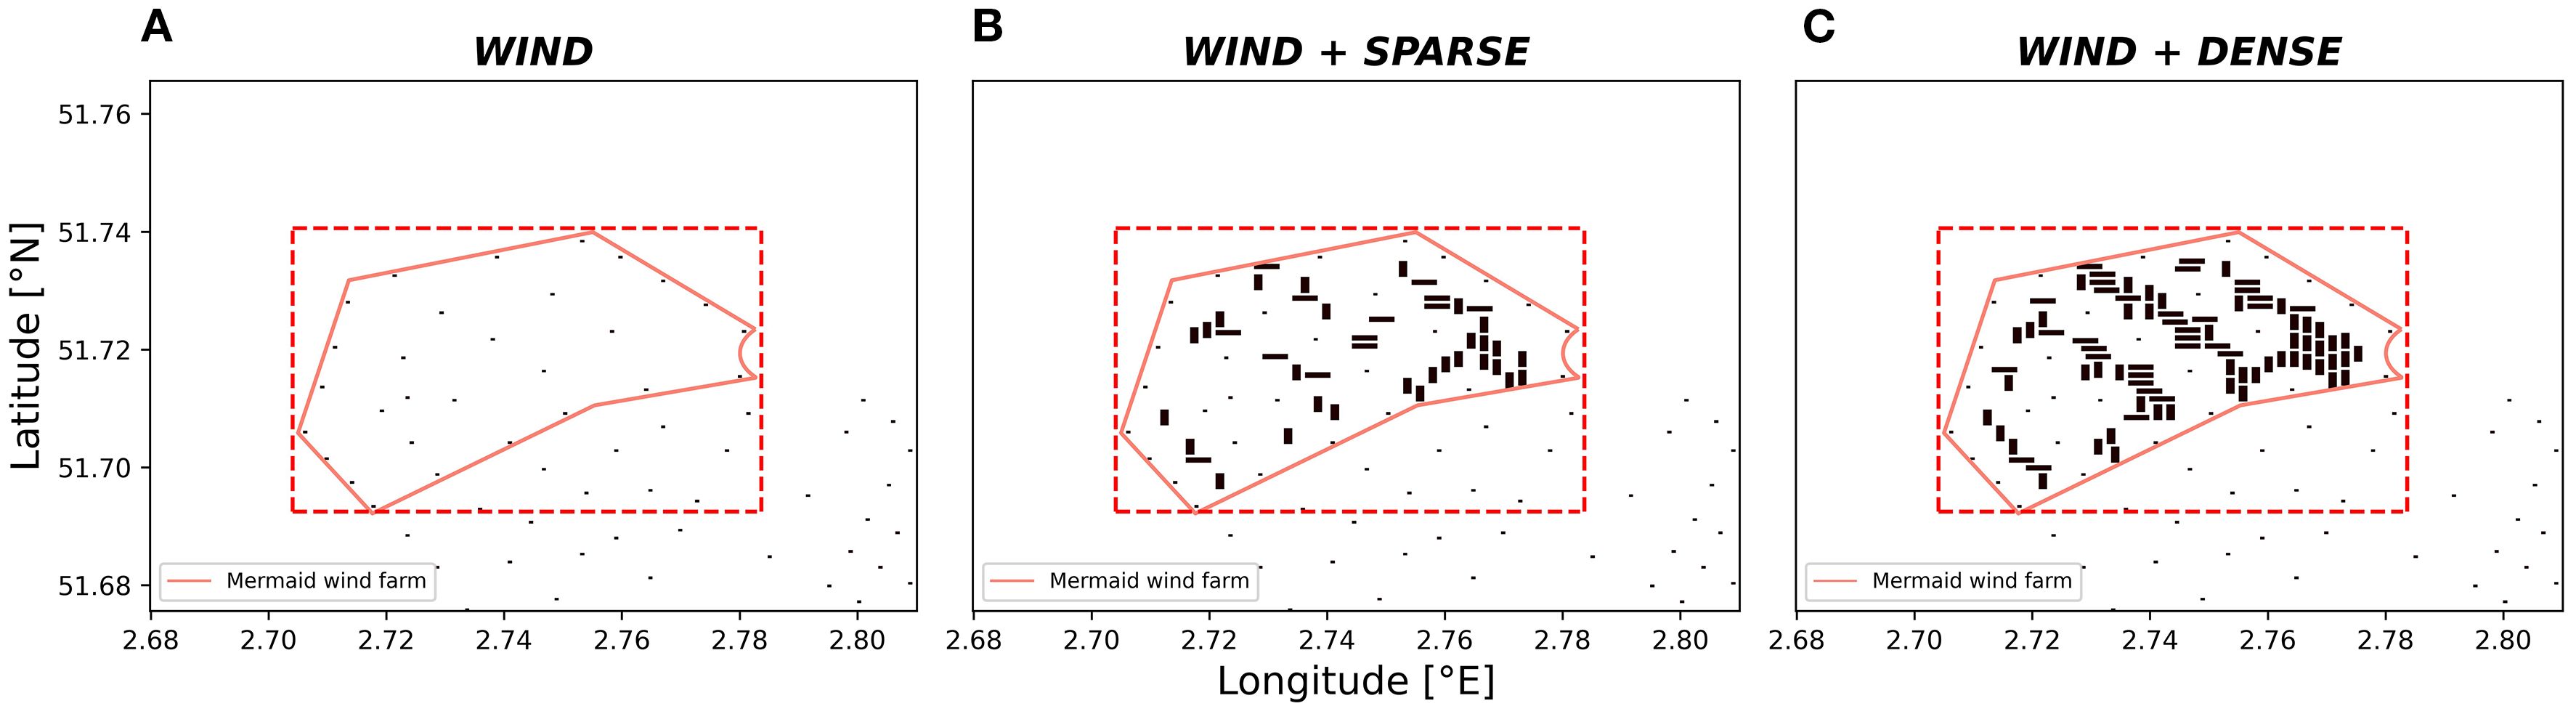
Figure 2. Scenarios for comparison zoomed around the OWF concession. (A) Wind turbines only. (B) Wind turbines + FPV with sparse photovoltaic density. (C) Wind turbines + FPV with dense photovoltaic density. Dotted red area: area used for variable averaging within the OWF concession zone.
The year 2020 was selected arbitrarily, a period marked by an intense stormy winter with record wind energy and a typical summer of heatwaves and calmer conditions. For each scenario, simulations were performed over three months in winter (January-March) and three months in summer (July-September), to capture seasonal variability in atmospheric and oceanic boundary conditions. A simulation timestep of 10 seconds was used, and hourly instantaneous outputs were generated.
As the study area is located in an offshore environment, tidal elevation must be taken into account. Since FPV units are floating structures, they follow the tidal elevation, ensuring that the submerged depth of the floats remains constant over time. In the model, a 2D forcing map, prepared during the preprocessing stage to reflect the distribution of FPV units and wind turbines, is applied. At each time step, this forcing is projected onto the appropriate number of vertical - layers, dynamically adapting to the variable elevation of the water column.
2.4.2 Assessment metrics and environmental indicators
Several metrics were selected to analyze the 3D simulation results. To evaluate the effect of solar panel shading on surface water temperature, simulations were conducted for ‘WIND + DENSE’ scenario, both with and without the shading parameterization (Equation 11). The difference in surface water temperature within the concession area was computed as:
where is the surface temperature field without shading, and is the surface temperature field accounting for the shading effect of FPV units.
The norm of the horizontal current velocity, [m.s-1], was computed at the surface layer to visualize dynamic variations induced by the presence of offshore structures. To assess broader flow patterns, the 90th percentile (P90 in Table 1) of surface current speed was calculated. This statistic indicates the value below which 90% of the current speed data points fall, providing insight into typical high-flow conditions. Percentiles were computed across both spatial dimensions (longitude and latitude) and over a temporal window of one month.
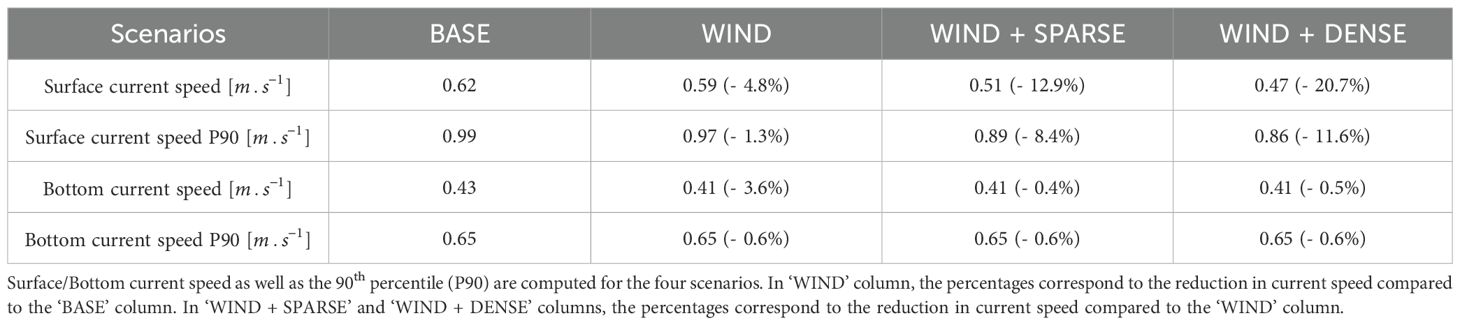
Table 1. Current speed averaged over the concession zone and 1-month period (January 2020).
Bottom shear stress [N.m-2] represents the force exerted by water flow (including both currents and waves) at seabed. In COHERENS, the norm of the bottom shear stress is computed as:
where is the is the seawater density [kg.m-3] and the norm of the current in the bottom cell [m.s-1]. The bottom drag coefficient is a function of the depth z [m above seabed] at which the velocity is provided, of the local roughness length and of the Von Karman coefficient .
To quantify the hydrodynamic modifications at the seabed caused by the presence of FPV units, relative differences in bottom shear stress [%] averaged over a 3-month simulation period (winter or summer) were readily computed as follows:
Here, is the norm of the bottom current speed in the scenarios including both wind turbine foundations and FPV units, while represents the norm of the bottom current speed in the ‘WIND’ reference case with only wind turbine foundations. The latter simplification assumes that the bottom drag coefficient remains constant across the different simulations (Equation 13). Based on the Belgian MSFD criteria (Belgian state, 2025, Legrand, 2025) (Equation 14), areas where the relative difference in bottom shear stress exceeds 10% are highlighted and quantified for each scenario and compared between scenarios.
In addition to current-based metrics, the turbulent kinetic energy [J.kg-1] was simulated and analyzed. Mean vertical profiles of were calculated and averaged within the concession zone (red rectangles in Figure 2) and plotted over a representative 12-hour tidal cycle (Section 3.3).
3 Results
3.1 Shading effect
FPV shading on sea surface temperature in summer results in an average cooling of 0.006°C over the OWF concession area. This cooling reaches a maximum up to 0.03°C below FPV units (Figure 3). The minimum cooling computed in the water column is around 0.0023 °C and is observed near the seabed.
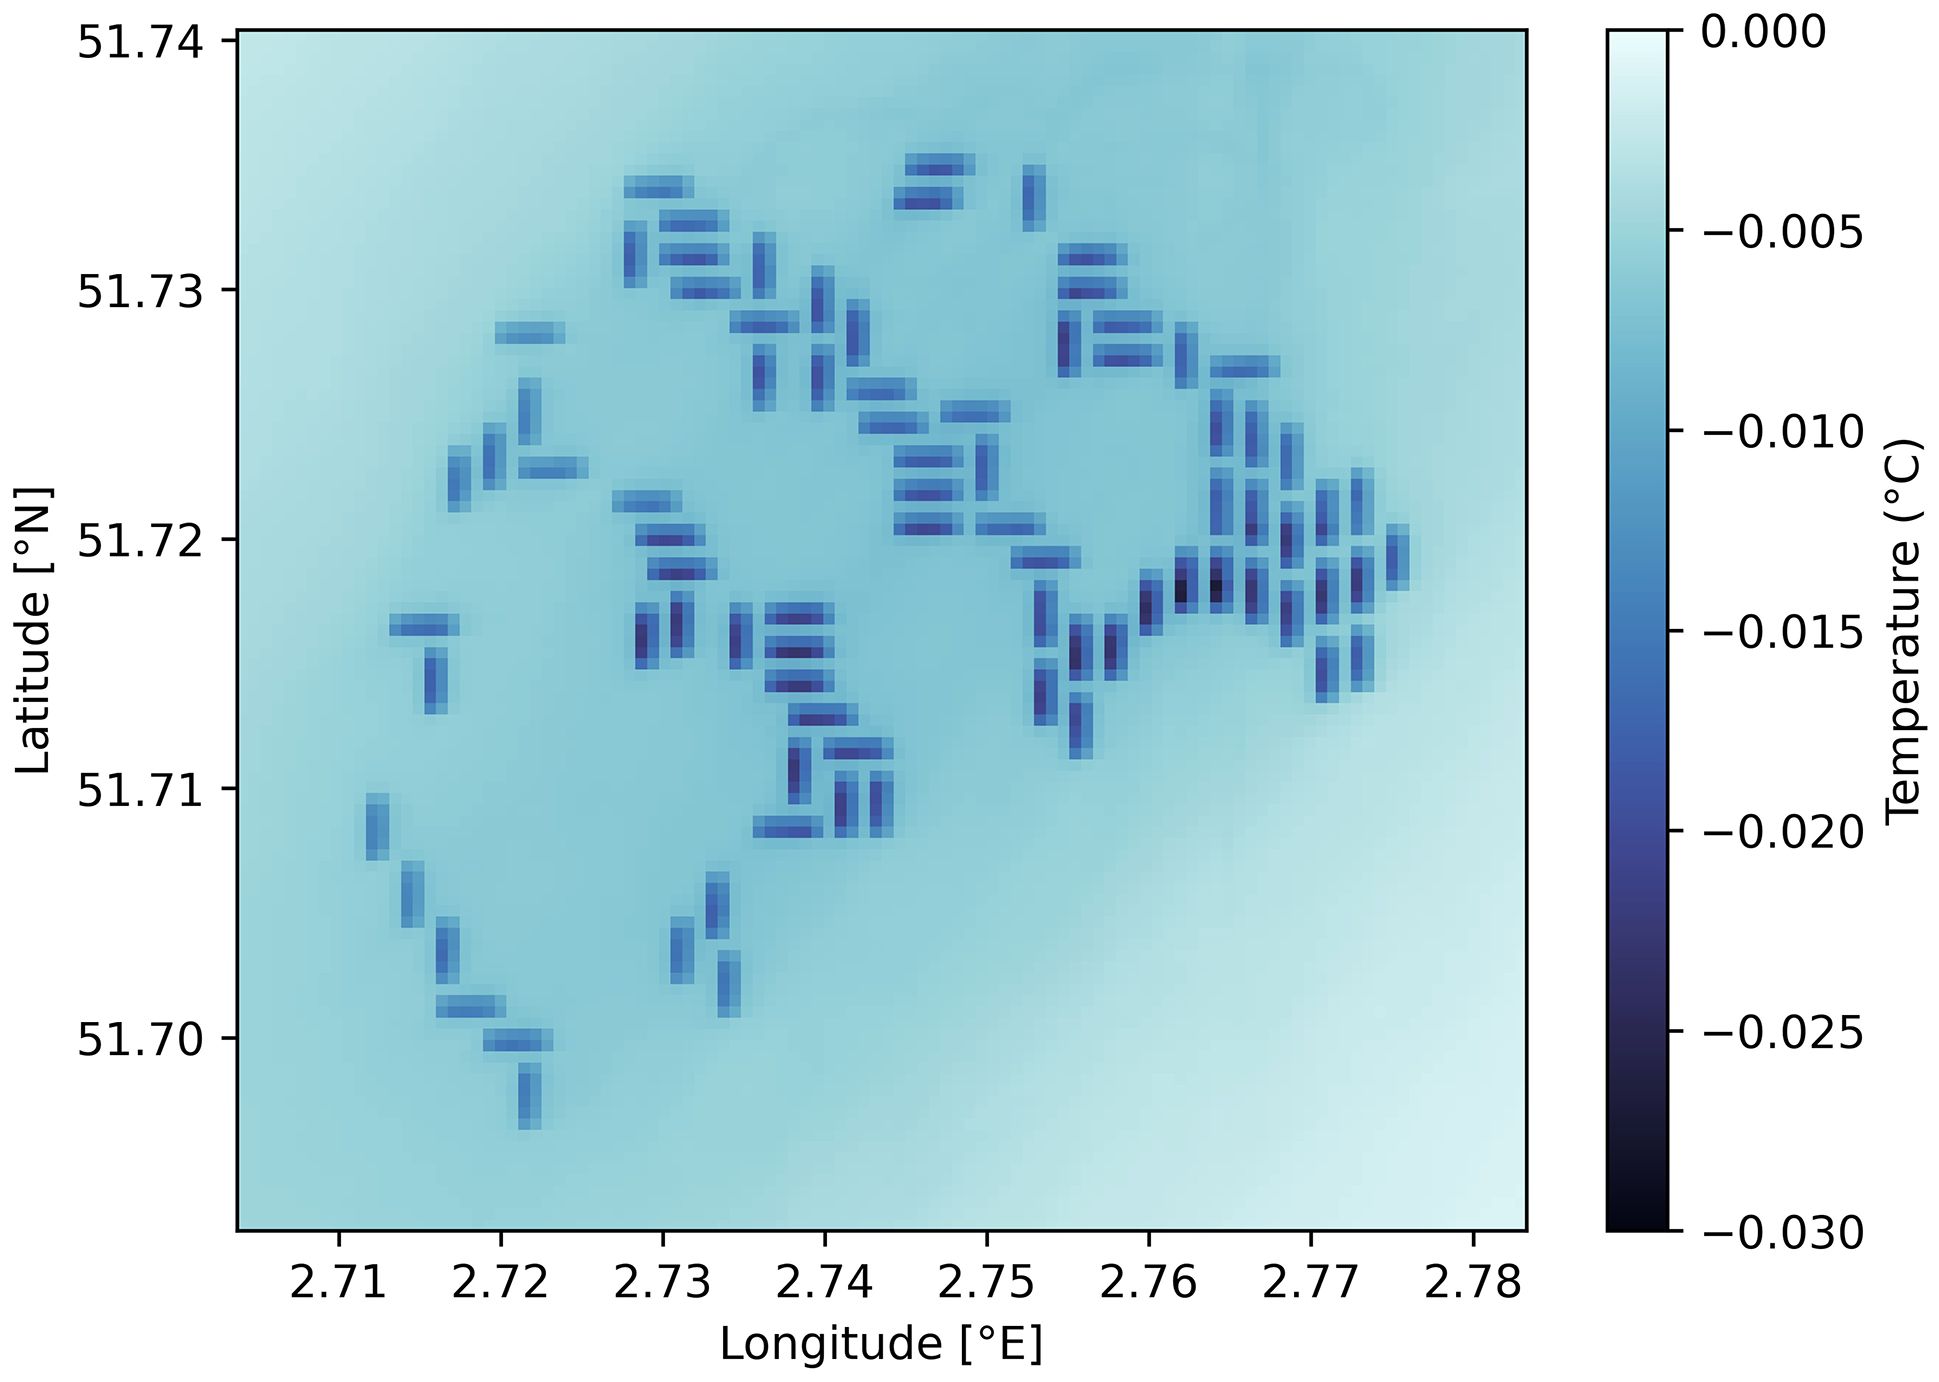
Figure 3. Sea surface temperature difference for the ‘WIND + DENSE’ scenario compared to the 'BASE' scenario without any structures. Averaged over one-month period (July 2020).
3.2 Current speed dynamics
Reduced current magnitude wakes are generated in the lee of submerged infrastructures (Figure 4). While the presence of FPV units enhances current attenuation, the impact is most pronounced within the concession area. These wakes rotate according to the tidal flow direction and tend to dissipate during slack water periods, though they remain partially visible (Figures 4J-L). Current speeds also slightly increase around the concession. Due to wake effects, the overall water mass transported through the concession is reduced and part of the flow is deviated around the concession area.
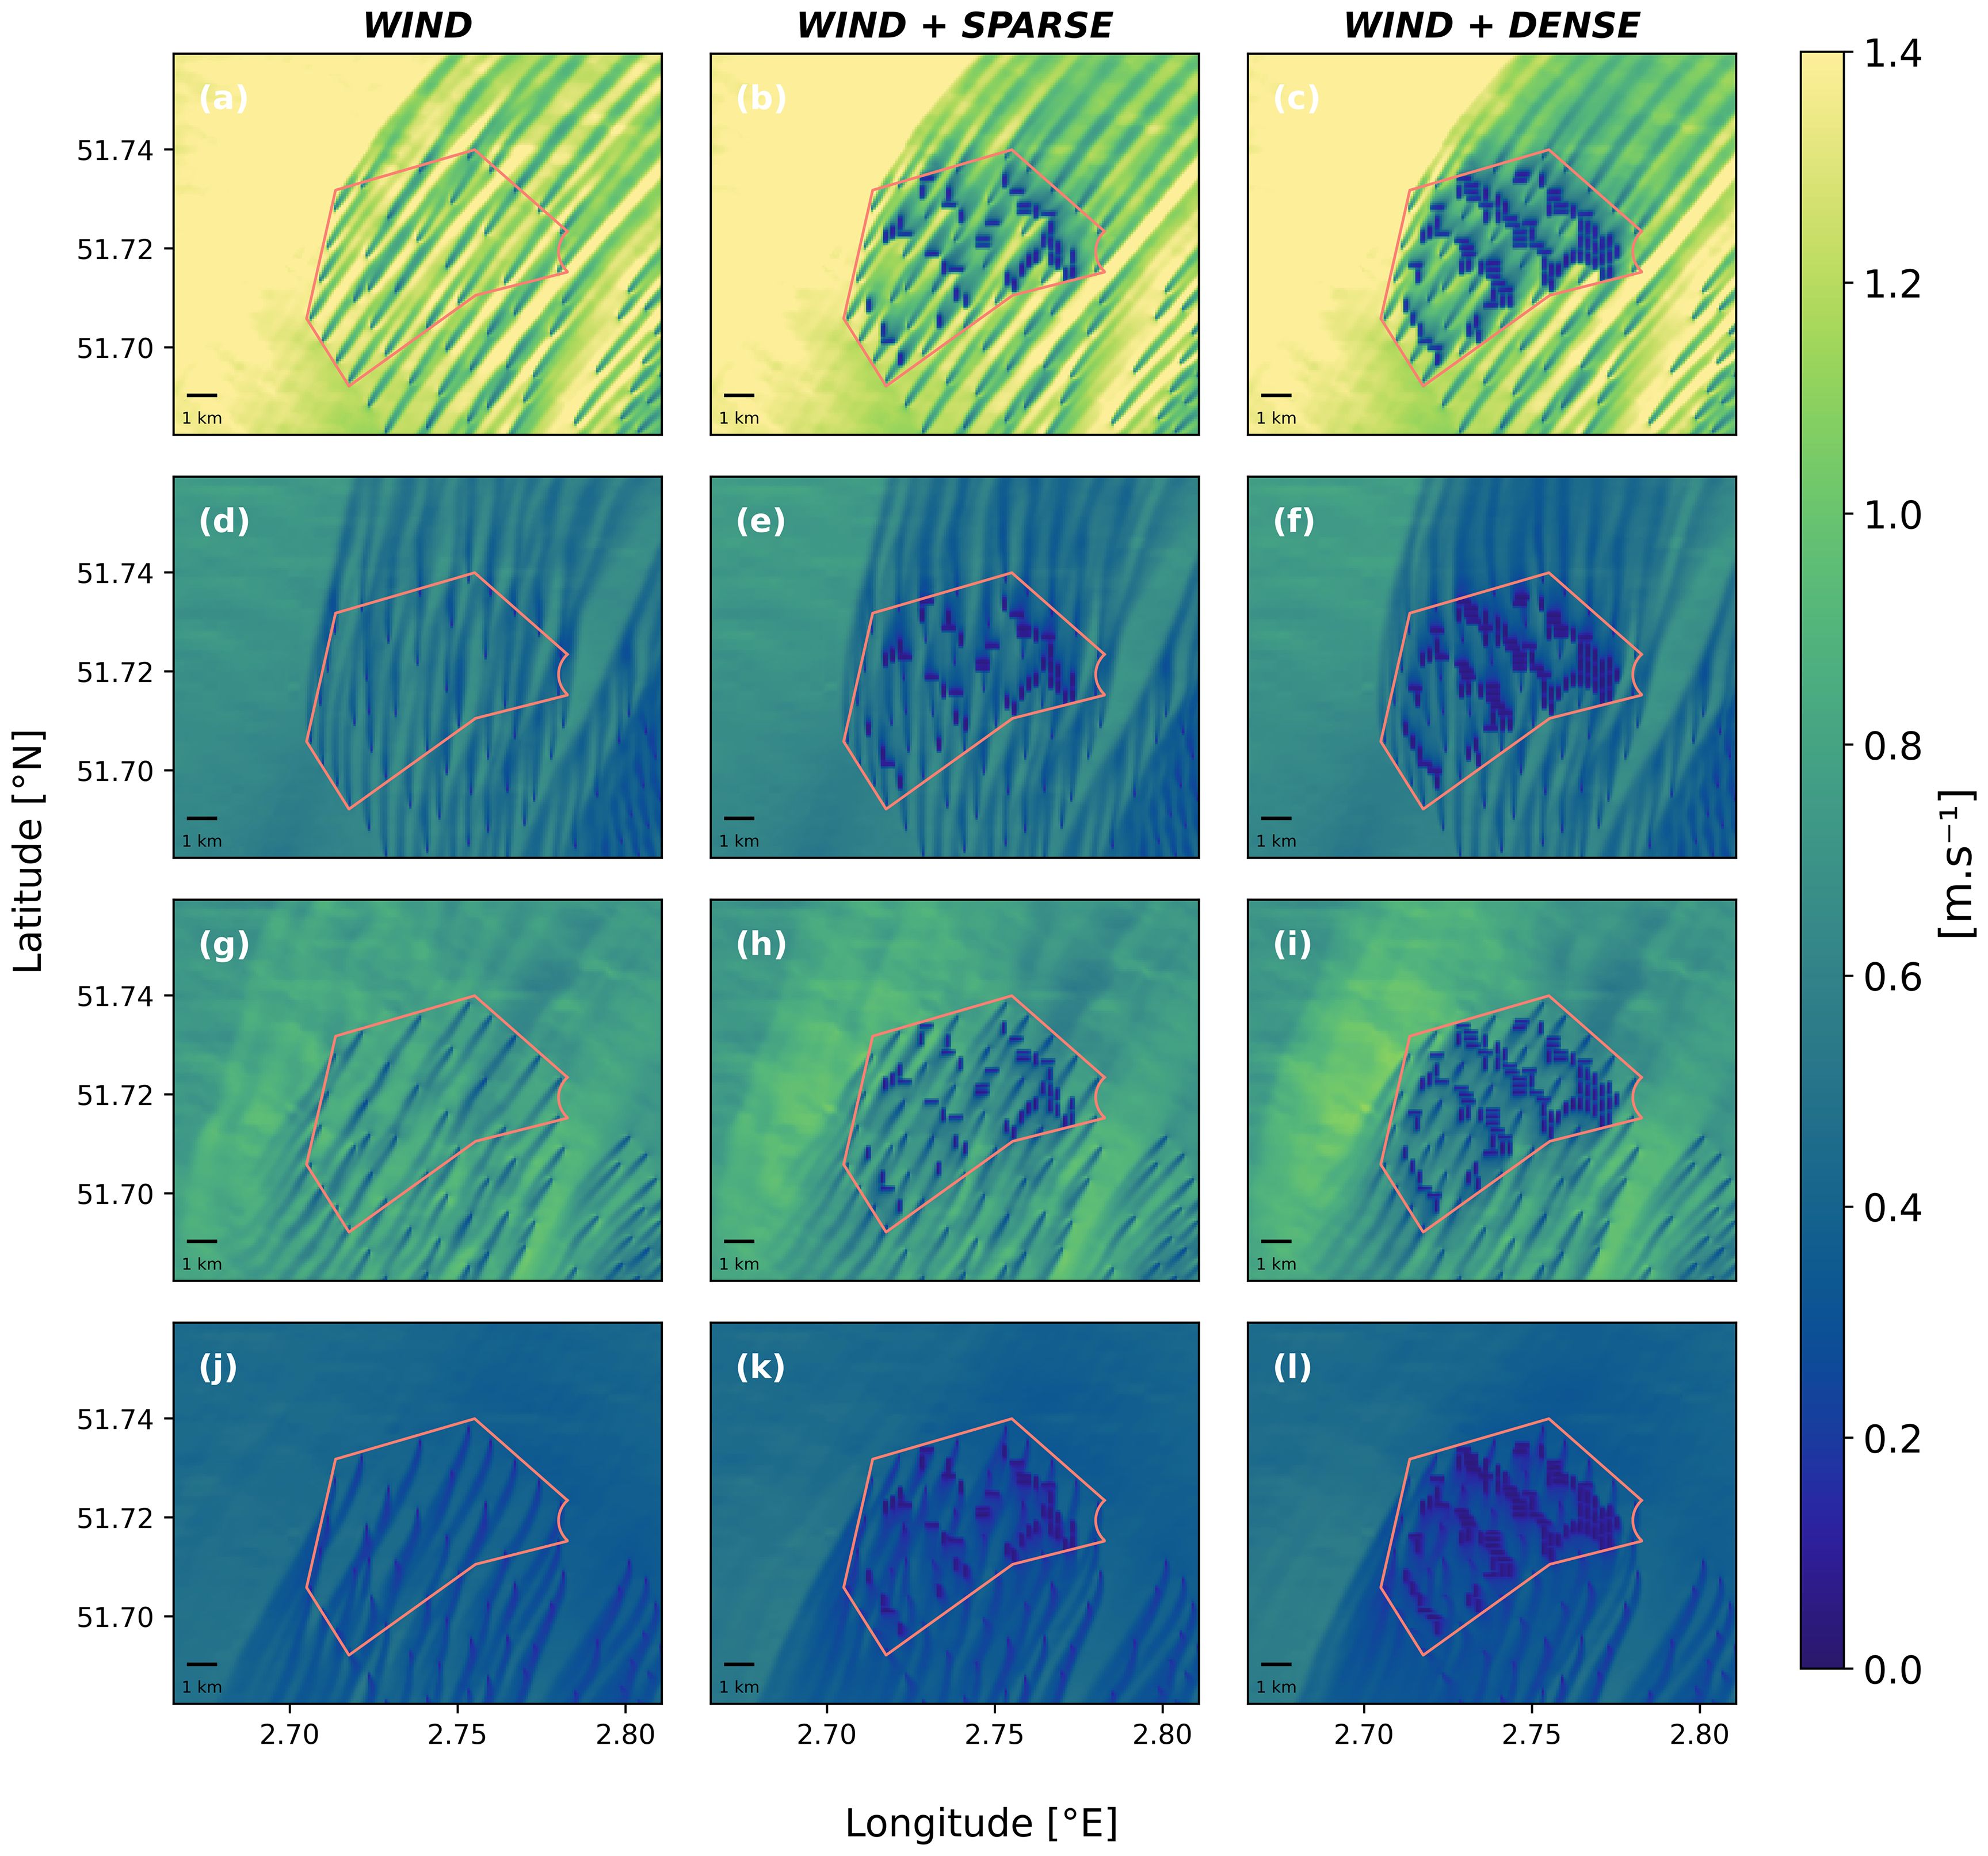
Figure 4. Surface current speed for different tidal moments and scenarios in January 2020. Left: reference scenario with only offshore wind turbines (‘WIND’). Centre: scenario with wind turbines + FPV (‘WIND + SPARSE’). Right: scenario with wind turbines + FPV (‘WIND + DENSE’). (a–c) surface current speed at high tide (HT). (d–f) HT + 3 hours. (g–i) HT + 6 hours. (j–l) HT + 9 hours. The moment of the highest tide (HT) was selected using the surface elevation at the center of the domain i.e. 1.7 m of elevation on 15/01. Orange contours indicate the Mermaid wind farm concession area.
The effect of wind turbine foundations on current speed within the concession zone (red rectangles in Figure 2) is clearly observed (Figure 4). Over a representative one-month period (e.g. January 2020), the addition of wind turbines leads to a decrease in current speed ranging from 3.6% at the seabed to 4.8% at the surface compared to the ‘BASE’ scenario (Table 1). The addition of FPV structures further amplifies this attenuation. Compared to the ‘WIND’ scenario, surface current speed decreases by an additional 12.9% in the ‘WIND + SPARSE’ configuration and 20.7% in the ‘WIND + DENSE’ configuration (Table 1). At the seabed, the effect of FPVs remains minimal, with an additional current speed reduction of 0.4% (WIND + SPARSE) and 0.5% (WIND + DENSE), compared to the ‘WIND’ scenario. More details about the areas of acceleration and deceleration of the current speed in the OWF concession are presented in Figures A1, A2 of Appendix A in Supplemetary Material.
3.3 Turbulent kinetic energy
Turbulence production increases with photovoltaic density, and follows the dynamics of tidal cycles (Figure 5). The influence of submerged structure on TKE is more pronounced during periods of strong tidal current (Figure 5A). Wind turbine foundations alone increase TKE throughout the entire water column. Compared to the ‘BASE’ scenario, this increase reaches 139% at 5 m depth and about 40% in the 10 m layer above the seafloor averaged over a 12-hours tidal cycle.
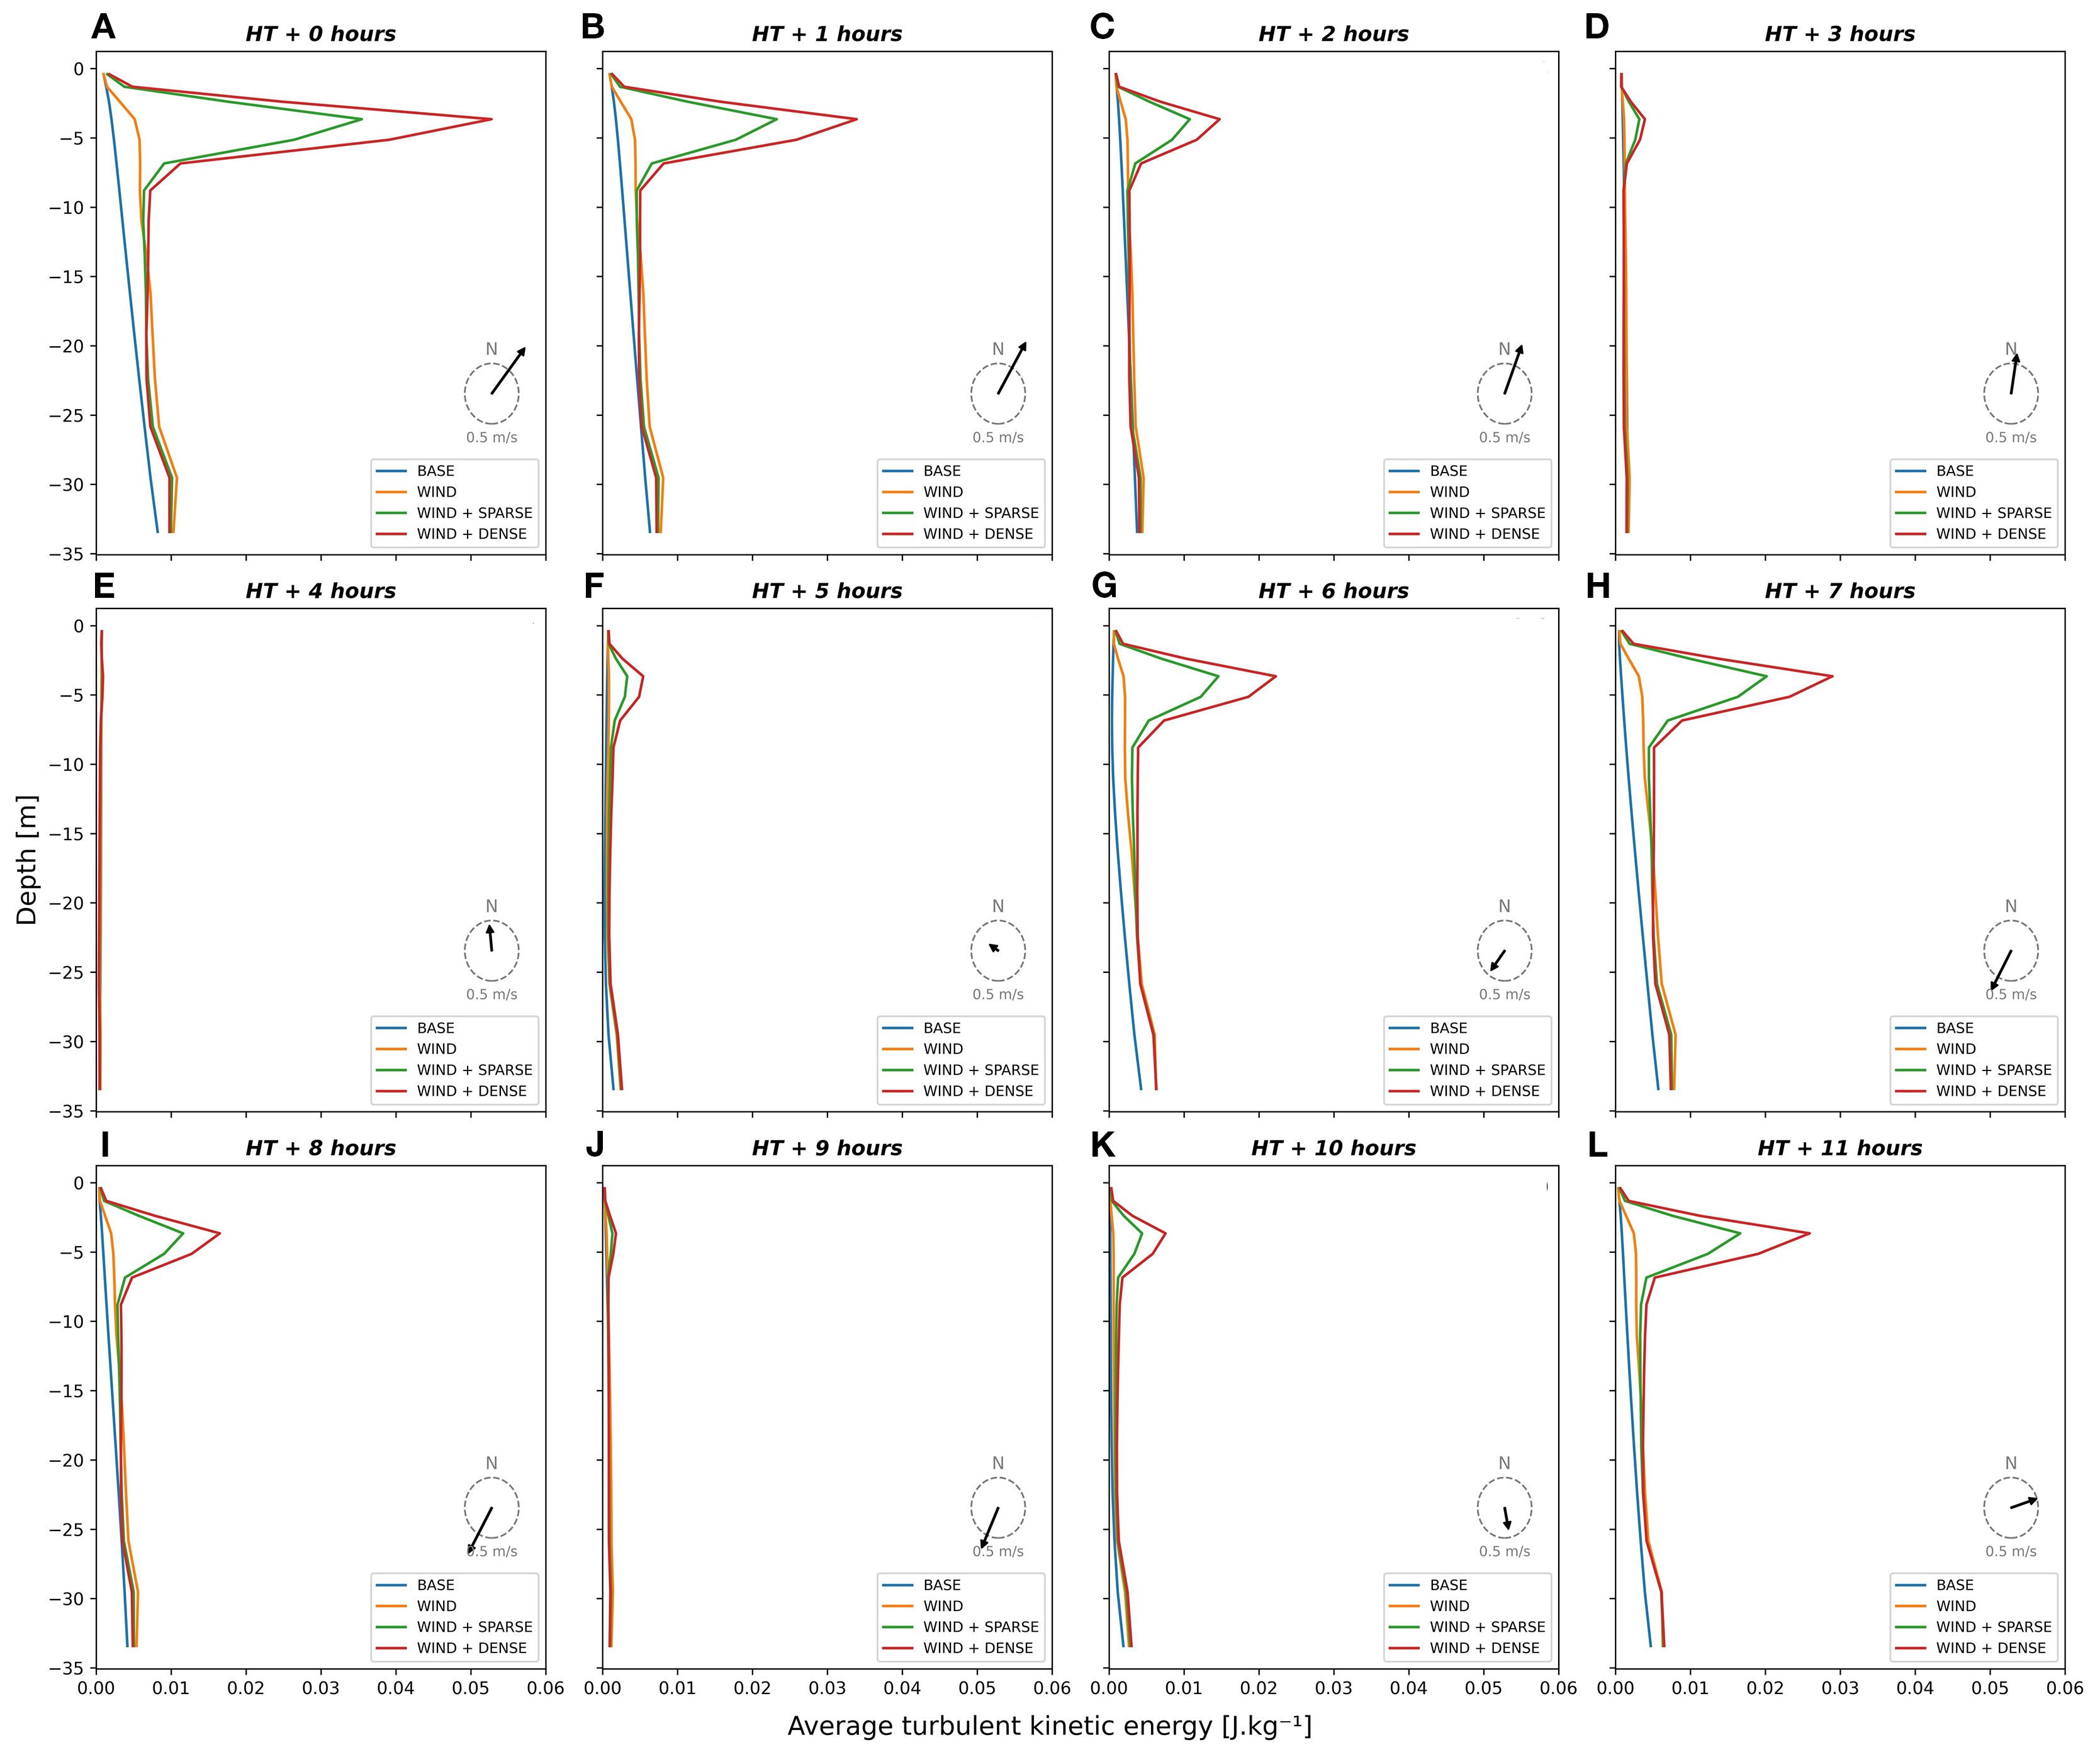
Figure 5. Vertical profiles of TKE averaged on the concession zone: 12-hours tidal cycle (A–L) in January 2020. The moment of the highest tide (HT) was selected as a reference time. Black arrows designate the intensity and the direction of the depth-average current speed.
The inclusion of FPV units generates significant vertical shear just below the floaters, at approximately 5 m depth, leading to a distinct peak in TKE. This peak represents a 275% (resp. 457%) increase in TKE for the ‘WIND + SPARSE’ (resp. ‘WIND + DENSE’ scenario), compared to the ‘WIND’ scenario. These maximum increases are computed for each hour and then averaged over the 12-hours tidal cycle. Near the seabed, the effect of FPVs on TKE remains negligible.
3.4 Average bottom shear stress
Winter and summer simulations show similar patterns of time-average bottom shear stress, with maximum perturbations reaching up to 55% (WIND + SPARSE) (Figures 6A, C) and 63% (WIND + DENSE) (Figures 6B, D) relative to the ‘WIND’ scenario. Areas of significant bottom shear stress decreases extend up to 5 km beyond the concession boundaries along the dominant SW-NE tidal axis. Perpendicular to that axis, areas of increased bottom shear stress appear, resulting from flow acceleration around the concession perimeter. The spatial extent of significantly affected areas increases considerably between the ‘SPARSE’ and ‘DENSE’ FPV scenarios (Figures 6A, B). In the latter case, the impacted area extends well beyond the concession itself, reaching up to 1.8 times the OWF surface area and 23.1 times the surface covered by FPV units (Table 2).
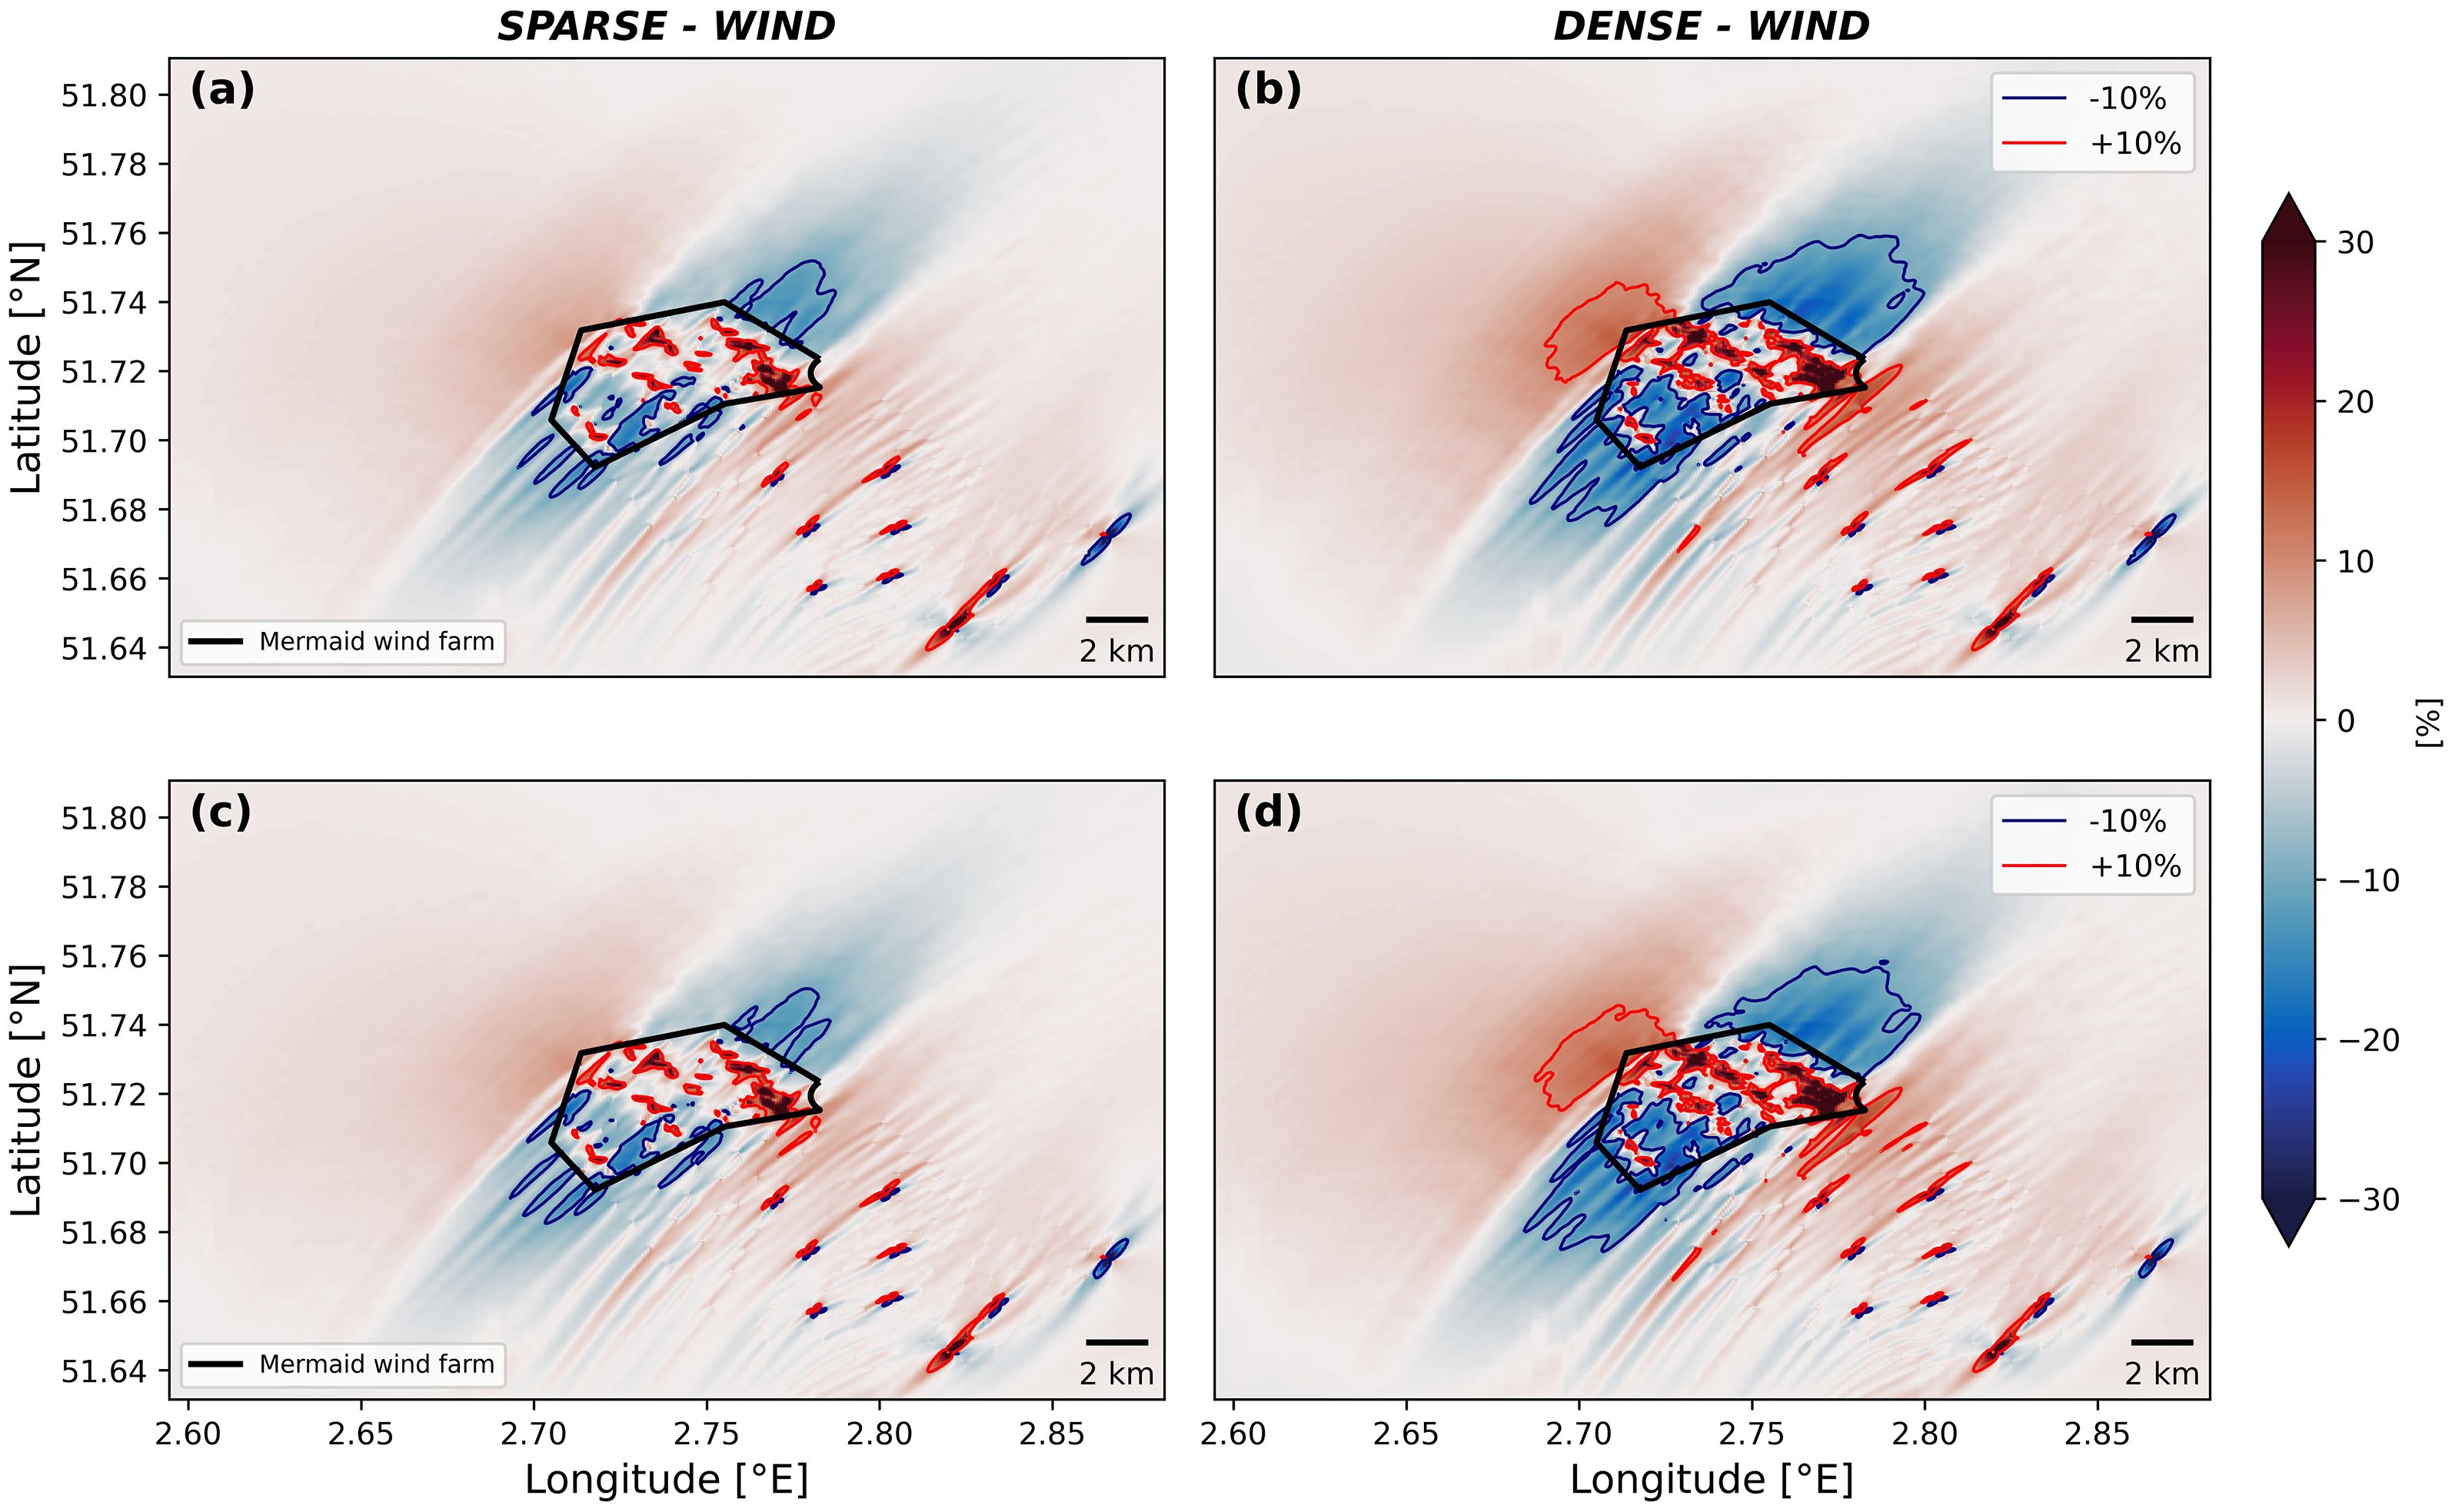
Figure 6. Relative difference of the bottom shear stress averaged over the 3-month period in winter (a, b) and summer (c, d) 2020. (a, c) ‘WIND + SPARSE’ compared to ‘WIND’. (b, d) ‘WIND + DENSE’ compared to ‘WIND’. The blue and red contour lines delineate areas with perturbations below -10% and above 10%, respectively.
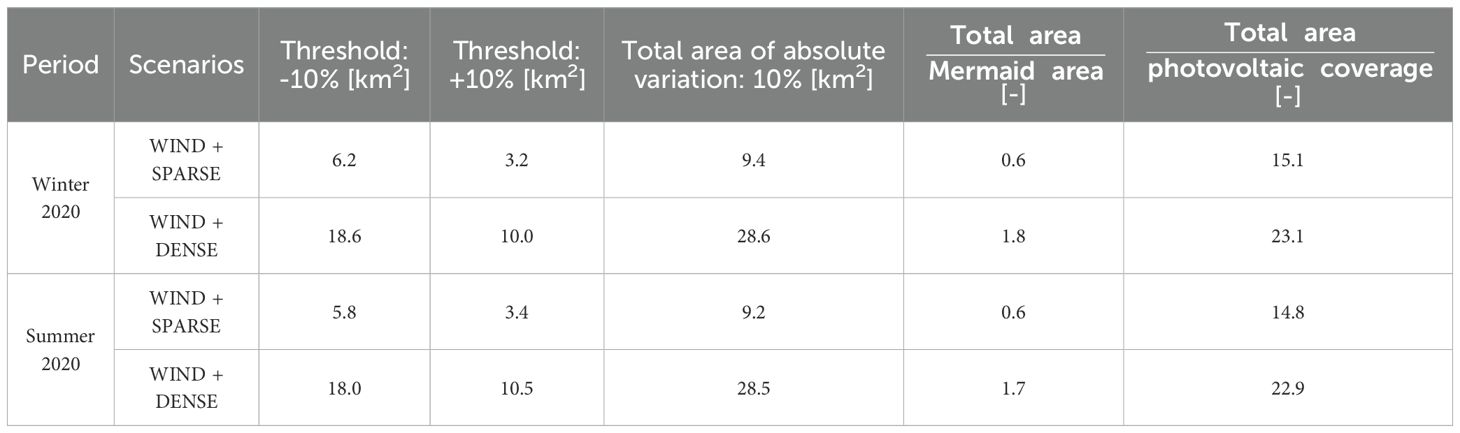
Table 2. Seabed areas with noticeable impact in average bottom shear stress.
4 Discussion
In the context of the global energy transition, marine renewable energy infrastructure is becoming increasingly widespread, with the North Sea emerging as a major development zone. The ecological and spatial consequences of this “ocean sprawl” are well documented (Firth et al., 2016; Evans et al., 2019), with recent estimates suggesting that urban and peri-urban marine developments affect approximately 1.5% of global Exclusive Economic Zones (Airoldi et al., 2021). While the environmental impacts of offshore wind energy have been increasingly studied (Rennau et al., 2012; Carpenter et al., 2016; Rivier et al., 2016; Schultze et al., 2020; Christiansen et al., 2023; Voet et al., 2023; Degraer et al., 2020), research dedicated specifically to offshore solar energy infrastructure remains in its infancy.
The results presented in this study stem from numerical simulations conducted within the context of a Belgian OWF concession and considering solar structures that are based on elevated floating platforms rising several meters above the sea surface. We show that integrating elevated-design FPVs into an existing OWF reduces surface currents, increases turbulence production and modifies the average bottom shear stress, all of which can have important consequences for the functioning of the local marine ecosystem. While our study is a modeling application focused on a specific Belgian OWF concession, we believe that the methodology and findings are transferable to other offshore locations, floating systems such as floating wind turbines (Cheng et al., 2019; Farr et al., 2021; Otter et al., 2022; Rezaei et al., 2023) or other emerging marine renewable energy technologies (Copping et al., 2025), with or without different parameter values. A more complete quantification of the hydrodynamic effects of FPVs requires investigating the impacts of mooring and anchoring systems, which were not considered in the present study. To our knowledge, our study constitutes the first detailed farm-scale assessment of hydrodynamic impacts specific to elevated floating solar infrastructure co-located with an offshore wind farm and thereby capturing the most important effects.
4.1 Shading effect
A key feature distinguishing solar from wind offshore infrastructure lies in the shading of the underlying water column. This raises concerns about potential impacts on primary production and heat fluxes. Karpouzoglou et al. (2020) highlighted potential changes in water temperature for FPV systems where solar panels rest directly on the sea surface. A pilot FPV project on a lake in the Netherlands showed monthly average variations in water temperature of less than 1% (Bax et al., 2023). However, the elevated design of FPVs investigated in this study includes a structural air gap between the sea surface and the panels. This air gap might involve a larger affected area but we assume less shading effects on water temperature. Our simulations revealed indeed only a minor sea surface temperature reduction up to a 0.03 °C over one summer period (Figure 3). This cooling is negligible compared to the variability of the surrounding temperature field and natural fluctuations (Mathis et al., 2015). The shading effects analyzed here remain however preliminary. The model assumes that photovoltaic panels are completely opaque, allowing no light transmission. However, some FPV systems may permit partial light penetration, especially in specific wavelength ranges, which could lower the effects on water column temperature. Additionally, the heat generated by the solar panels themselves was not accounted for.
4.2 Drag effect
A less intuitive consequence of FPV deployment is the substantial increase in submerged structures per unit of energy produced. Whereas OWFs generally consists of sparse, well-distanced monopiles (~ 500–1000 m apart), FPV units introduce extensive areas of densely packed artificial hard substrates into the marine environment. For one MW of installed power capacity, FPVs add up to 20 times more submerged surfaces than wind turbine foundations. Our results show that this bears substantial impact on surrounding hydrodynamic fields.
First, the deployment of elevated-design FPVs leads to measurable reductions in current velocity. Specifically, adding 235 MW of wind capacity (‘WIND’) to the baseline scenario (‘BASE’) resulted in a 4.8% decrease in average surface current speed and a 3.6% decrease at the bottom within the concession zone. These numbers, averaged spatially over the concession area, are consistent with the 10% changes in mean current velocity due to OWFs simulated in the German Bight, which were also associated with a 6.8% increase in water residence time (Christiansen et al., 2023).
By comparison, although the impact of OWF (‘WIND’) on flow velocity is smaller in amplitude than that of FPVs, it is more vertically homogeneous. In contrast, elevated-design FPVs due to their floater depth (3 to 5 m), affect surface layers more than the bottom layers. Adding 126 MW of solar power capacity (‘WIND + SPARSE’) led to a further 12.9% decrease in average surface current speed. Doubling the solar capacity to 252 MW (‘WIND + DENSE’) resulted in an additional 20.7% reduction in average surface current speed within the concession compared to the ‘WIND’ scenario (Table 1). Bottom currents are less affected in our scenarios, suggesting that FPV-induced flow attenuation is primarily confined to the upper water column. A substantial flow attenuation over the concession area may influence water column transport processes (including mixing), increase local residence time and therefore affect pollutant and larval dispersal, as well as particulate matter deposition.
Second, the presence of elevated-design FPVs significantly increases turbulent kinetic energy, especially at the depth of the FPV floater bases (approximately 5 m for the design applied here). This increase is attributed to the vertical shear generated beneath the floating structures. In the ‘WIND + DENSE’ configuration, peak TKE increased up to 457% relative to the ‘WIND’ scenario (Figure 5). Despite this large increase in upper-layer turbulence, FPVs induce only minor local changes in TKE near the seabed. Enhanced turbulence around offshore structures, such as wind turbine foundations, has been shown to reduce stratification by enhancing vertical water column mixing (Schultze et al., 2020; Austin et al., 2025), although previous studies have shown relatively minor large-scale impacts, particularly in the North Sea and the Baltic Sea (Rennau et al., 2012; Christiansen et al., 2023). However, it has also been highlighted that the impact could become more significant under future large-scale deployment scenarios (Carpenter et al., 2016). Our case study differs from these previous studies by the fact that the background environment remains well-mixed during most of the year, hence is less sensitive to the risk of perturbing the natural stratification and its subsequent biogeochemical implications. It is important to emphasize that neglecting turbulence advection may substantially affect the results, particularly with regard to the shear generated around the structures. In the present configuration, this shear is advected only through the momentum equations, and although the advected shear locally produces TKE, its magnitude might be underestimated to the TKE generated directly at the structures. However, our result shows that FPVs can create a persistent layer of maximum turbulence at the depth of the floaters across the spatial extent of the concession.
Finally, despite being deployed near the surface, elevated-design FPVs exert a clear influence on the seabed by altering average bottom shear stress. Bottom shear stress, which represents the force exerted by water flow on the seabed, plays a critical role in sediment transport processes including erosion, resuspension, and deposition. Increased bottom shear stress tends to promote erosion and sediment resuspension, thereby increasing suspended particulate matter in the water column. Conversely, lower shear stress favors sediment deposition (Stanev et al., 2009). Our results show that floating solar panels can modify average bottom shear stress by up to 63% locally compared to the ‘WIND’ scenario. These changes result mostly from the impact of FPVs on current velocity, which includes flow attenuation within the concession and flow acceleration beyond its edges, perpendicular to the main flow direction. By consequence, changes in bottom shear stress exceeding 10% of the natural conditions (either positively or negatively) are widely spread and expands well beyond the spatial limit of the concession (Figure 6).
4.3 Wider implications
Offshore renewable energy structures provide additional settlement surfaces for filter-feeding organisms, such as mussels, barnacles and amphipods (Degraer et al., 2020; Mavraki et al., 2022). These fouling communities differ significantly from pelagic and soft-bottom communities, which per se is prone to perturb local biogeochemistry and biological functioning, as has been extensively documented for OWFs in the southern North Sea (De Borger et al., 2021; Coolen et al., 2024; De Borger et al., 2025). In particular, filter feeders contribute to organic carbon deposition via fecal pellets and pseudo-feces (Ivanov et al., 2021), positively contributing to carbon accumulation in the sediments and supporting efforts to reduce CO2 emissions (De Borger et al., 2021).
Altering water flow, turbulence and bottom shear stress can influence sedimentation dynamics. Specifically, a decrease in bottom shear stress would increase deposition, whereas an increase would enhance erosion and sediment resuspension (Stanev et al., 2009). Noticeable changes of the averaged bottom shear stress (variation > 10%), induced by FPV deployment, cover areas from 9.2 km² to 28.6 km² (i.e. 1.8 times the size of the OWF concession, Table 2), potentially justifying the set-up of an additional dedicated benthic environmental monitoring programs in wind farms to study the ecological changes in the abundances and functioning of benthic communities (relation between descriptors D7 and D6C5, European Commission, 2022). From an ecological perspective, changes in bottom shear stress and sedimentation processes may affect benthic faunal communities and alter carbon and nutrient cycling.
These findings highlight the far-reaching influence of surface-deployed infrastructure on benthic processes and stress the need to consider both biogeochemical and hydrodynamical mechanisms when assessing the cumulative impact of offshore renewable energy infrastructures on the biogeochemical cycles and carbon budgets of a broader area.
4.4 Considerations
Evaluating the potential hydrodynamic impacts of floating photovoltaic structures remains a challenging task. Hydrodynamic modeling of such novel structures on these scales is still relatively uncommon, and the lack of in-situ data complicates direct validation of model outputs. For instance, acquiring reference values for turbulent kinetic energy in this part of the North Sea, particularly within offshore wind farm areas, is difficult.
The grid resolution applied in this study (50 x 50 meter) offers a first-order insight into subgrid-scale impacts but does not resolve fine-scale dynamics (e.g. non-hydrostatic effects) around wind turbine foundations or floating platforms (e.g. Van Der Eijk et al., 2024). Capturing such phenomena would require high-resolution computational fluid dynamics (CFD) modeling. Also, it has been shown that higher resolution at wind farm sites does not appear to add significant value to the regional effects of offshore structures (Christiansen et al., 2023). Nevertheless, the chosen approach is appropriate for assessing broader, large-scale hydrodynamic impacts and for supporting upscaling analyses.
Moreover, our model setup does not account for wind changes induced by offshore structures (particularly turbines). It has been shown that the sea surface, especially waves, can influence wind behavior and, consequently, offshore wind turbine performance (Kalvig et al., 2014), with ocean waves potentially altering wind power by around 3.5% (Wu et al., 2022). On the other hand, wind wakes generated by offshore wind turbines can modify local wind forcing and its interactions at the sea-surface boundary layer, potentially impacting variables such as significant wave height (McCombs et al., 2014), horizontal surface currents or stratification (Christiansen et al., 2022). The present simulations accounts for hydrodynamic alteration only. Coupled setups, involving atmospheric (wind) and surface wave dynamical components, could further improve the accuracy of hydrodynamic simulations, especially in the upper layers of the water column. Interactions between waves and FPV floaters were not considered in this study. Nevertheless, these interactions might result in extra TKE production due to horizontal displacement of the floating structures induced by the waves orbital velocity, meaning that the impacts of elevated-design FPVs on TKE might be even more than what our simulations showed.
According to Christiansen et al., 2023, the computed magnitude of hydrodynamic perturbations induced by offshore structures is highly sensitive to key model parameters, such as the drag coefficient in Equation 1 and the mixing efficiency parameter in the dissipation Equation 10 of the model. Sensitivity analyses were conducted with the present setup by varying between 0.6 and 1.75. These tests, however, did not reveal significant differences in the outputs (not shown). The drag coefficient value is decisive for the magnitude of the model results. Moreover, it has been shown (Schoefs et al., 2022) that the biofouling growth on the structures can substantially modify the drag coefficient and consequently affect the results. Future work should also consider integrating the mooring and anchoring systems of FPV structures into the model parameterization. These components likely have a non-negligeable effect on local hydrodynamics, particularly near the seabed. Mooring lines may enhance turbulence and contribute to localized current deceleration, while seabed anchors could affect near-bottom flow velocities and alter sediment dynamics. Depending on their design, anchoring systems can also induce scouring, potentially disturbing benthic sediments and consequently influencing biogeochemical processes in the water column. Additional research is needed to upscale this pioneering work to assess the spatial extent of areas affected by the installation of offshore structures, with or without the addition of FPVs. Such efforts would support Marine Spatial Planning at a sea basin scale, particularly when impacts, such as current wakes and changes in bottom shear stress, have a transboundary dimension. This is particularly relevant here, as Belgian renewable energy installations may affect the marine area of the neighboring Netherlands’ Exclusive Economic Zone.
Lastly, only limited differences were observed between the winter (January-March 2020) and summer (July-September 2020) simulated periods. This suggests that 3-month simulations encompassing multiple spring-neap tidal cycles provide a representative snapshot of general dynamics under various scenarios, at least for the reference year 2020.
5 Conclusions
By adopting a subgrid-scale parameterization into the 3D hydrodynamic model COHERENS, this study investigated the hydrodynamic impacts of FPV, specifically elevated design, within an existing Belgian OWF. The impacts on four key hydrodynamic metrics were assessed: surface irradiance reduction due to shading, and changes in current velocity fields, turbulent kinetic energy production, and bottom shear stress due to drag effect. According to our simulations, introducing 252 MW of solar power (‘WIND + DENSE’) into an OWF (with a power capacity of 235 MW) decreases average surface current speed within the concession by 20.7% (Table 1). The presence of FPV floaters increases turbulence throughout the water column, with the most significant increase occurring directly beneath the floaters. In all scenarios considered, the average bottom shear stress was significantly impacted. The seabed impacted area, defined by the MSFD as the region where bottom shear stress is altered by more than 10% (increase or decrease), can extend up to 1.8 times the total area of the concession zone. Doubling the photovoltaic capacity results in more than tripling the seabed impacted area.
The integration of floating solar structures in the North Sea, particularly within existing OWFs, is promising. Although modeling the hydrodynamic effects of these novel structures is challenging and constitutes an essential step toward understanding their environmental footprint. Hydrodynamic assessments are only the starting point for a broader evaluation of the biological and biogeochemical consequences associated with FPVs. Incorporating these dimensions will enable a more comprehensive impact assessment of FPVs both within the North Sea and in other marine environments. These cumulative effects, especially when considered alongside existing OWFs, should not be overlooked from either a MSFD perspective or an ecological one. Finally, the findings highlight the need for sustained monitoring of offshore renewable energy projects and the critical role of in-situ data collection in supporting model validation and improving parametrization.
Data availability statement
The raw data supporting the conclusions of this article will be made available by the authors, without undue reservation.
Author contributions
PD: Conceptualization, Formal Analysis, Investigation, Methodology, Software, Visualization, Writing – original draft. AC: Conceptualization, Formal Analysis, Funding acquisition, Investigation, Methodology, Software, Supervision, Visualization, Writing – review & editing. JV: Supervision, Writing – review & editing. TK: Funding acquisition, Project administration, Writing – review & editing. GL: Project administration, Writing – review & editing. SL: Conceptualization, Funding acquisition, Methodology, Supervision, Writing – review & editing.
Funding
The author(s) declare financial support was received for the research and/or publication of this article. This work was carried out in the framework of the ‘Eco-designing Marine PhotoVoltaic installations’ (EcoMPV) and ‘Solar and Wind Energy in the Belgian Marine Zone’ (SWiM) projects, both funded by the Belgian Energy Transition Fund (Federal Public Service Economy).
Acknowledgments
This work was carried out in the framework of the ‘Eco-designing Marine PhotoVoltaic installations’ (EcoMPV) and ‘Solar and Wind Energy in the Belgian Marine Zone’ (SWiM) projects, both funded by the Belgian Energy Transition Fund (Federal Public Service Economy). Five partners were involved in this project: Royal Belgian Institute of Natural Sciences (RBINS), Ghent University (UGent), Tractebel Engineering S.A. (Tractebel), Jan De Nul and Dredging International (DEME). This work was supported by the European Centre for Medium-Range Weather Forecasts (ECMWF) through computing resources provided under the ECMWF Member State framework. The authors gratefully acknowledge access to ECMWF’s High-Performance Computing Facility (HPCF).
Conflict of interest
The authors declare that the research was conducted in the absence of any commercial or financial relationships that could be construed as a potential conflict of interest.
Generative AI statement
The author(s) declare that no Generative AI was used in the creation of this manuscript.
Any alternative text (alt text) provided alongside figures in this article has been generated by Frontiers with the support of artificial intelligence and reasonable efforts have been made to ensure accuracy, including review by the authors wherever possible. If you identify any issues, please contact us.
Publisher’s note
All claims expressed in this article are solely those of the authors and do not necessarily represent those of their affiliated organizations, or those of the publisher, the editors and the reviewers. Any product that may be evaluated in this article, or claim that may be made by its manufacturer, is not guaranteed or endorsed by the publisher.
Supplementary material
The Supplementary Material for this article can be found online at: https://www.frontiersin.org/articles/10.3389/fmars.2025.1674859/full#supplementary-material
References
Airoldi L., Turón X., Bulleri F., Bugnot A. B., Steinberg P. D., Dafforn K. A., et al. (2021). Emerging solutions to return nature to the urban ocean. Annu. Rev. Mar. Sci. 13, 445–477. doi: 10.1146/annurev-marine-032020-020015
Austin M. J., Løvholt F., Carriveau R., and Lincoln B. J. (2025). Enhanced bed shear stress and mixing in the tidal wake of an offshore wind turbine monopile. Ocean Sci. 21, 81–91. doi: 10.5194/os-21-81-2025
Baeye M. and Fettweis M. (2015). In situ observations of suspended particulate matter plumes at an offshore wind farm, southern North Sea. Geo-Mar Lett. 35, 247–255. doi: 10.1007/s00367-015-0404-8
Bax V., Van De Lageweg W. I., Hoosemans R., and Van Den Berg B. (2023). Floating photovoltaic pilot project at the Oostvoornse lake: Assessment of the water quality effects of three different system designs. Energy Rep. 9, 1415–1425. doi: 10.1016/j.egyr.2022.12.080
Belgian state (2025). Stratégie pour le Milieu Marin - Partie 1 pour les eaux marines belges. État des eaux marines belges, bon état écologique et objectifs environnementaux. Directive-cadre Stratégie pour le Milieu Marin. Available online at: https://odnature.naturalsciences.be/msfd_media/documents/Belgische_Mariene_Strategie_Art_8-9-10_2025_FR.pdf (Accessed September 22, 2025).
Benjamins S., Lebreton R., Scott L., Yuan Z., Collu M., Fox C., et al. (2024). Potential environmental impacts of floating solar photovoltaic systems. Renew Sustain Energy Rev. 199, 114463. doi: 10.1016/j.rser.2024.114463
Bo T., McWilliams J. C., Yan C., and Chamecki M. (2024). Langmuir turbulence in suspended kelp farms. J. Fluid Mech. 985, A11. doi: 10.1017/jfm.2024.287
Buatois A., Rickerby D. G., Le Drézen Y., and Van Der Meijden M. (2014). Analysis of North Sea offshore wind power variability. Resources 3, 454–470. doi: 10.3390/resources3020454
Burchard H. and Baumert H. (1995). On the performance of a mixed-layer model based on the κ-ϵ turbulence closure. J. Geophys Res. Oceans 100, 8523–8540. doi: 10.1029/94JC03229
Cantalice J. R. B., Soares M. M., Silva R. G., Barbosa B., Barros Junior G., Guerra S. M. S., et al. (2019). Vegetative-hydraulic parameters generated by agricultural crops for laminar flows under a semi-arid environment of Pernambuco, Brazil. Ecol. Indic 106, 105496. doi: 10.1016/j.ecolind.2019.105496
Carpenter J. R., Merckelbach L., Callies U., Clark S., Gaslikova L., and Baschek B. (2016). Potential impacts of offshore wind farms on North Sea stratification. PloS One 11, e0160830. doi: 10.1371/journal.pone.0160830
Cheng P., Huang Y., and Wan D. (2019). A numerical model for fully coupled aero-hydrodynamic analysis of floating offshore wind turbine. Ocean Eng. 173, 183–196. doi: 10.1016/j.oceaneng.2018.12.021
Christiansen N., Daewel U., Djath B., and Schrum C. (2022). Emergence of large-scale hydrodynamic structures due to atmospheric offshore wind farm wakes. Front. Mar. Sci. 9, 818501. doi: 10.3389/fmars.2022.818501
Christiansen N., Carpenter J.R., Daewel U., Suzuki N., Schrum C., et al (2023). The large-scale impact of anthropogenic mixing by offshore wind turbine foundations in the shallow North Sea. Front. Mar. Sci. 10, 1178330. doi: 10.3389/fmars.2023.1178330
Claus R. and López M. (2022). Key issues in the design of floating photovoltaic structures for the marine environment. Renewable Sustain. Energy Rev. 164, 112502. doi: 10.1016/j.rser.2022.112502
Coates D. A., Deschutter Y., Vincx M., and Vanaverbeke J. (2014). Enrichment and shifts in macrobenthic assemblages in an offshore wind farm area in the Belgian part of the North Sea. Mar. Environ. Res. 95, 1–12. doi: 10.1016/j.marenvres.2013.12.008
Commission Decision (EU) 2017/848 (2017). Laying down criteria and methodological standards on good environmental status of marine waters and specifications and standardized methods for monitoring and assessment, and repealing Decision 2010/477/EU. In: European Commission. Criteria and methodological standards on good environmental status of marine waters and specifications and standardized methods for monitoring. Off J. Eur. Union L125, 43–74.
Coolen J. W. P., Vanaverbeke J., Dannheim J., Garcia C., Birchenough S. N. R., Krone R., et al. (2022). Generalized changes of benthic communities after construction of wind farms in the southern North Sea. J. Environ. Manag 315, 115173. doi: 10.1016/j.jenvman.2022.115173
Coolen J. W. P., van der Weide B., Bittner O., Mavraki N., Rus M., Van Der Molen J., et al. (2024). Fluxes of nitrogen and phosphorus in fouling communities on artificial offshore structures. J. Sea Res. 199, 102498. doi: 10.1016/j.seares.2024.102498
Copping A., Wood D., Rumes B., Ong E. Z., Golmen L., Mulholland R., et al. (2025). Effects and management implications of emerging marine renewable energy technologies. Ocean Coast. Manage. 264, 107598. doi: 10.1016/j.ocecoaman.2025.107598
Copernicus Climate Change Service and Climate Data Store (2018). ERA5 hourly data on single levels from 1940 to present. Copernicus Climate Change Service (C3S) Climate Data Store (CDS). doi: 10.24381/CDS.ADBB2D47
De Borger E., Ivanov E., Capet A., Braeckman U., Vanaverbeke J., Grégoire M., et al. (2021). Offshore windfarm footprint of sediment organic matter mineralization processes. Front. Mar. Sci. 8, 632243. doi: 10.3389/fmars.2021.632243
De Borger E., Van Oevelen D., Mavraki N., De Backer A., Braeckman U., Soetaert K., et al. (2025). Offshore wind farms modify coastal food web dynamics by enhancing suspension feeder pathways. Commun. Earth Environ. 6, 330. doi: 10.1038/s43247-025-02253-w
Degraer S., Carey D. A., Coolen J. W. P., Hutchison Z. L., Kerckhof F., Rumes B., et al. (2020). Offshore wind farm artificial reefs affect ecosystem structure and functioning. Oceanography 33, 48–57. doi: 10.5670/oceanog.2020.408
Delbeke O., Moschner J. D., and Driesen J. (2023). The complementarity of offshore wind and floating photovoltaics in the Belgian North Sea, an analysis up to 2100. Renewable Energy 218, 119253. doi: 10.1016/j.renene.2023.119253
DEME, Tractebel, and Nul J. (2023). SeaVolt. Available online at: https://www.seavolt.be/ (Accessed July 25, 2025).
European Commission (2022). MSFD CIS Guidance Document No. 19: Article 8 MSFD. Available online at: https://www.aquabiota.se/wp-content/uploads/european-commission-2022.-msfd-cis-guidance-document-no.-19-article-8-msfd-may-2022.pdf (Accessed July 25, 2025).
Evans A. J., Firth L. B., Hawkins S. J., Hall A. E., Ironside J. E., Thompson R. C., et al. (2019). From ocean sprawl to blue-green infrastructure – A UK perspective on an issue of global significance. Environ. Sci. Policy 91, 60–69. doi: 10.1016/j.envsci.2018.09.008
Exley G., Hernandez R. R., Page T., Chipps M., Gambro S., Hersey M., et al. (2021). Scientific and stakeholder evidence-based assessment: Ecosystem response to floating solar photovoltaics and implications for sustainability. Renew Sustain Energy Rev. 152, 111639. doi: 10.1016/j.rser.2021.111639
Farr H., Ruttenberg B., Walter R. K., Wang Y.-H., and White C.. (2021). Potential environmental effects of deepwater floating offshore wind energy facilities. Ocean Coast. Manage. 207, 105611. doi: 10.1016/j.ocecoaman.2021.105611
Firth L. B., Knights A. M., Bridger D., Evans A. J., Mieszkowska N., Moore P. J., et al. (2016). “Ocean sprawl: Challenges and opportunities for biodiversity management in a changing world,” in Oceanography and Marine Biology: An Annual Review, 193–269. doi: 10.1201/9781315368597
Grant J. and Bacher C. (2001). A numerical model of flow modification induced by suspended aquaculture in a Chinese bay. Can. J. Fish Aquat Sci. 58, 1003–1011. doi: 10.1139/f01-027
Hooper T., Armstrong A., and Vlaswinkel B. (2021). Environmental impacts and benefits of marine floating solar. Solar Energy 219, 11–14. doi: 10.1016/j.solener.2020.10.010
Hossain M. S. and Rodi W. (1982). “A turbulence model for buoyant flows and its application to vertical buoyant jets,” in Turbulent Buoyant Jets and Plumes (Elsevier), 121–178. doi: 10.1016/B978-0-08-026492-9.50007-4
Ivanov E., Capet A., Barth A., Delhez E. J. M., Soetaert K., Grégoire M., et al. (2020). Hydrodynamic variability in the Southern Bight of the North Sea in response to typical atmospheric and tidal regimes. Benefit using High resolution Model. Ocean Model. 154, 101682. doi: 10.1016/j.ocemod.2020.101682
Ivanov E., Capet A., De Borger E., Degraer S., Delhez E. J. M., Soetaert K., et al. (2021). Offshore wind farm footprint on organic and mineral particle flux to the bottom. Front. Mar. Sci. 8. doi: 10.3389/fmars.2021.631799
Ji C., Hao Y., and Xu S. (2025). Experimental and numerical study on the hydrodynamic responses of a novel offshore floating photovoltaic system. Ocean Eng. 315, 119797. doi: 10.1016/j.oceaneng.2024.119797
Kalvig S., Manger E., Hjertager B. H., and Jakobsen J. B. (2014). Wave influenced wind and the effect on offshore wind turbine performance. Energy Proc. 53, 202–213. doi: 10.1016/j.egypro.2014.07.229
Karpouzoglou T., Vlaswinkel B., and van der Molen J. (2020). Effects of large-scale floating (solar photovoltaic) platforms on hydrodynamics and primary production in a coastal sea from a water column model. Ocean Sci. 16, 195–208. doi: 10.5194/os-16-195-2020
Lefaible N., Colson L., Braeckman U., and Moens T. (2019). “Evaluation of turbine-related impacts on macrobenthic communities within two offshore wind farms during the operational phase,” in Environmental Impacts of Offshore Wind Farms in the Belgian Part of the North Sea: Marking a Decade of Monitoring, Research and Innovation, vol. 47 . Eds. Degraer S., Brabant R., Rumes B., and Vigin L. (Royal Belgian Institute of Natural Sciences, Brussels).
Lefaible N., Braeckman U., Degraer S., Vanaverbeke J., and Moens T. (2023). A wind of change for soft-sediment infauna within operational offshore wind farms. Mar. Environ. Res. 188, 106009. doi: 10.1016/j.marenvres.2023.106009
Legrand S. (2025). “Permanent alteration of hydrographical conditions in the Belgian part of the North Sea,” in Mariene Strategie Deel 1 voor de Belgische mariene wateren. Staat van Belgische mariene wateren, goede milieutoestand en milieudoelen. Kaderrichtlijn Mariene Strategie - Artikel 8, 9 en 10 (Federale Overheidsdienst Volksgezondheid, Veiligheid van de Voedselketen en Leefmilieu & Instituut voor Natuurwetenschappen, Brussel). Available online at: https://odnature.naturalsciences.be/msfd_media/documents/D7-ANS-BE-HYDR-2024-Hydrographical_alterations.pdf (Accessed September 19, 2025).
Lin J., Li C., and Zhang S. (2016). Hydrodynamic effect of a large offshore mussel suspended aquaculture farm. Aquaculture. 451, 147–155. doi: 10.1016/j.aquaculture.2015.08.039
Luyten P., Baetens K., Barbut L., Breugem A., Decrop B., Delecluyse K., et al. (2025). COHERENS: A coupled hydrodynamical ecological model for regional and shelf seas: User documentation (Version 3). Zenodo. doi: 10.5281/zenodo.11261106
Martins M. C. I., Carter M. I., Rouse S., and Russell D. J. (2023). Offshore energy structures in the North Sea: Past, present and future. Mar. Policy 152, 105629. doi: 10.1016/j.marpol.2023.105629
Mathis M., Elizalde A., Mikolajewicz U., and Pohlmann T. (2015). Variability patterns of the general circulation and sea water temperature in the North Sea. Prog. Oceanogr 135, 91–112. doi: 10.1016/j.pocean.2015.04.009
Mavraki N., Coolen J. W. P., Kapasakali D. -A., Degraer S., Vanaverbeke J., and Beermann J. (2022). Small suspension-feeding amphipods play a pivotal role in carbon dynamics around offshore man-made structures. Mar. Environ. Res. 178, 105664. doi: 10.1016/j.marenvres.2022.105664
Mavraki N., Bos O. G., Vlaswinkel B. M., Roos P., De Groot W., Van Der Weide B., et al. (2023). Fouling community composition on a pilot floating solar-energy installation in the coastal Dutch North Sea. Front. Mar. Sci. 10, 1223766. doi: 10.3389/fmars.2023.1223766
McCombs M. P., Mulligan R. P., and Boegman L. (2014). Offshore wind farm impacts on surface waves and circulation in Eastern Lake Ontario. Coast. Eng. 93, 32–39. doi: 10.1016/j.coastaleng.2014.08.001
Mesinger F. and Arakawa A. (1976). Numerical methods used in atmospheric models (Geneva, Switzerland: Tech. rept. Global Atmospheric Research Program (GARP) publication series).
Nepf H. M. (1999). Drag, turbulence, and diffusion in flow through emergent vegetation. Water Resour Res. 35, 479–489. doi: 10.1029/1998WR900069
Ostend Declaration (2023). Ostend Declaration on the North Seas as Europe’s Green Power Plant delivering cross-border projects and anchoring the renewable offshore industry in Europe. Available online at: https://northseasummit23.be/en/ostend-declaration (Accessed July 25, 2025).
Otter A., Murphy J., Pakrashi V., Robertson A., and Desmond C. (2022). A review of modelling techniques for floating offshore wind turbines. Wind Energy 25, 831–857. doi: 10.1002/we.2701
Otto L., Zimmerman J. T. F., Furnes G. K., Mork M., Saetre R., and Becker G. (1990). Review of the physical oceanography of the North Sea. Neth J. Sea Res. 26, 161–238. doi: 10.1016/0077-7579(90)90091-T
Pätsch J., Burchard H., Dieterich C., Gräwe U., Gröger M., Mathis M., et al. (2017). An evaluation of the North Sea circulation in global and regional models relevant for ecosystem simulations. Ocean Model. 116, 70–95. doi: 10.1016/j.ocemod.2017.06.005
Plew D. R., Stevens C. L., Spigel R. H., and Hartstein N. D. (2005). Hydrodynamic implications of large offshore mussel farms. IEEE J. Oceanic Eng. 30, 95–108. doi: 10.1109/JOE.2004.841387
Rennau H., Schimmels S., and Burchard H. (2012). On the effect of structure-induced resistance and mixing on inflows into the Baltic Sea: A numerical model study. Coast. Eng. 60, 53–68. doi: 10.1016/j.coastaleng.2011.08.002
Rezaei F., Contestabile P., Vicinanza D., and Azzellino A. (2023). Towards understanding environmental and cumulative impacts of floating wind farms: Lessons learned from the fixed-bottom offshore wind farms. Ocean Coast. Manage. 243, 106772. doi: 10.1016/j.ocecoaman.2023.106772
Rivier A., Bennis A. -C., Pinon G., Magar V., and Gross M. (2016). Parameterization of wind turbine impacts on hydrodynamics and sediment transport. Ocean Dyn 66, 1285–1299. doi: 10.1007/s10236-016-0983-6
Roe P. L. (1986). Characteristic-based schemes for the Euler equations. Annu. Rev. Fluid Mech. 18, 337–365. doi: 10.1146/annurev.fl.18.010186.002005
Rumes B., Brabant R., Van Maele T. M., and Vigin L. (2023). “Offshore renewable energy in the Belgian Part of the North Sea,” in Environmental Impacts of Offshore Wind Farms in the Belgian Part of the North Sea: Progressive Insights in Changing Species Distribution Patterns Informing Marine Management. Memoirs on the Marine Environment. Eds. Degraer S., Brabant R., Rumes B., and Vigin L. (Royal Belgian Institute of Natural Sciences, OD Natural Environment, Marine Ecology and Management, Brussels), 115.
Santhakumar S., Meerman H., Faaij A., Martinez Gordon R., and Florentina Gusatu L. (2024). The future role of offshore renewable energy technologies in the North Sea energy system. Energy Convers Manage 315, 118775. doi: 10.1016/j.enconman.2024.118775
Schoefs F., Bakhtiari A., and Ameryoun H. (2022). Evaluation of hydrodynamic force coefficients in presence of biofouling on marine/offshore structures, a review and new approach. JMSE 10, 558. doi: 10.3390/jmse10050558
Schultze L. K.-P., Merckelbach L. M., Horstmann J., Raasch S., and Carpenter J. R. (2020). Increased mixing and turbulence in the wake of offshore wind farm foundations. J. Geophys Res. Oceans 125, e2019JC015858. doi: 10.1029/2019JC015858
Smagorinsky J. (1963). General circulation experiments with the primitive equations: I. basic experiment. Mon Weather Rev. 91, 99–164. doi: 10.1175/1520-0493(1963)091<0099:GCEWTP>2.3.CO;2
Stanev E. V., Dobrynin M., Pleskachevsky A., Grayek S., and Günther H. (2009). Bed shear stress in the southern North Sea as an important driver for suspended sediment dynamics. Ocean Dyn 59, 183–194. doi: 10.1007/s10236-008-0171-4
Stelzenmüller V., Letschert J., Gimpel A., Kraan C., Probst W. N., Degraer S., et al. (2022). From plate to plug: The impact of offshore renewables on European fisheries and the role of marine spatial planning. Renew Sustain Energy Rev. 158, 112108. doi: 10.1016/j.rser.2022.112108
Svensson U. and Häggkvist K. (1990). A two-equation turbulence model for canopy flows. J. Wind Eng. Ind. Aerodyn 35, 201–211. doi: 10.1016/0167-6105(90)90216-Y
Sweby P. K. (1984). High resolution schemes using flux limiters for hyperbolic conservation laws. SIAM J. Numer Anal. 21, 995–1011. doi: 10.1137/0721062
Umlauf L. and Burchard H. (2003). A generic length-scale equation for geophysical turbulence models. J. Mar. Res. 61, 235–265. doi: 10.1357/002224003322005087
Umlauf L., Burchard H., and Bolding K. (2005). General ocean turbulence model. Source code documentation Vol. 63 (Warnemünde, Germany: Baltic Sea Research Institute Warnemünde).
Van Der Eijk M., Plenker D., Hendriks E., and De Wit L. (2024). Modeling the hydrodynamic wake of an offshore solar array in OpenFOAM. Front. Energy Res. 12, 1434356. doi: 10.3389/fenrg.2024.1434356
Vlaswinkel B., Roos P., and Nelissen M. (2023). Environmental observations at the first offshore solar farm in the North Sea. Sustainability 15, 6533. doi: 10.3390/su15086533
Vo T. T. E., Ko H., Huh J., and Park N. (2021). Overview of possibilities of solar floating photovoltaic systems in the offshore industry. Energies 14, 6988. doi: 10.3390/en14216988
Voet H. E. E., Vlaminck E., Van Colen C., Bodé S., Boeckx P., Degraer S., et al. (2023). Organic matter processing in a [simulated] offshore wind farm ecosystem in current and future climate and aquaculture scenarios. Sci Total Environ. 857, 159285. doi: 10.1016/j.scitotenv.2022.159285
Wang J. and Lund P. D. (2022). Review of recent offshore photovoltaics development. Energies 15, 7462. doi: 10.3390/en15207462
Wilson N. R. and Shaw R. H. (1977). A higher order closure model for canopy flow. J. Appl. Meteorol 16, 1197–1205. doi: 10.1175/1520-0450(1977)016<1197:AHOCMF>2.0.CO;2
Keywords: floating photovoltaics, hydrodynamics, solar energy, offshore renewable energy, offshore wind farm, southern North Sea, numerical modeling
Citation: Denis P, Capet A, Vanaverbeke J, Kerkhove TRH, Lacroix G and Legrand S (2025) Hydrodynamic alterations induced by floating solar structures co-located with an offshore wind farm. Front. Mar. Sci. 12:1674859. doi: 10.3389/fmars.2025.1674859
Received: 28 July 2025; Accepted: 15 September 2025;
Published: 06 October 2025.
Edited by:
Meilin Wu, Chinese Academy of Sciences (CAS), ChinaCopyright © 2025 Denis, Capet, Vanaverbeke, Kerkhove, Lacroix and Legrand. This is an open-access article distributed under the terms of the Creative Commons Attribution License (CC BY). The use, distribution or reproduction in other forums is permitted, provided the original author(s) and the copyright owner(s) are credited and that the original publication in this journal is cited, in accordance with accepted academic practice. No use, distribution or reproduction is permitted which does not comply with these terms.
*Correspondence: Pauline Denis, cGRlbmlzQG5hdHVyYWxzY2llbmNlcy5iZQ==