 Utpal Mallick
 Yashkumar Rathod
 Sumit Biswas
- ViStA Lab, Department of Biological Sciences, Birla Institute of Technology and Science, Pilani - KK Birla Goa Campus, Zuarinagar, Goa, India
The Indo-Pacific horseshoe crab, Tachypleus gigas is often referred to as a living fossil due to its 450 million years ancestry. It plays a critical ecological role in coastal ecosystems and offers unique insights into arthropod evolution. Despite being investigated for more than a century, its early embryonic development remains poorly understood. In this study, we identified and presented the first comprehensive proteomic characterization of the early-stage embryo of T. gigas from stage 2 to stage 5 using microscopy and mass spectrometry-based approaches, respectively. Peptides were analyzed in an EASY-nLC 1200 system coupled to an Orbitrap Fusion mass spectrometer, leading to the identification of 388 proteins. The dataset revealed enrichment in proteins associated with cellular growth, morphogenesis, cytoskeletal organization, and metabolic regulation. Functional annotation and pathway enrichment were performed using STRING v12.0, with Gene Ontology analysis highlighting key pathways related to energy metabolism, transcriptional control, and immune regulation. These findings provide new molecular perspectives on embryogenesis in T. gigas and offer a valuable reference point for future studies on chelicerate development, evolutionary biology, and species conservation.
1 Introduction
Counted among the most relevant invertebrates owing to their role in endotoxin detection, horseshoe crabs are unique in their biological processes (Tinker-Kulberg et al., 2020). Tracing an ancestry dating more than 450 million years with fossil records from the Palaeozoic era (Rudkin et al., 2007), these marine chelicerates have been aptly been described as ‘living fossils’. The ability to survive major extinction events and yet sustain a system which remains relatively unchanged, this marine chelicerate provides a unique perspective in terms of proteomic profile. There are only four extant species of horseshoe crabs on Earth (Lamsdell, 2019) at present - one American species, the Limulus polyphemus, and the three Asian species, Tachypleus tridentatus, T. gigas, and Carcinoscorpius rotundicauda.
Of these, the Indo-Pacific horseshoe crab T. gigas has been traditionally data deficient in the domain (John et al., 2021), with very little references to its development process. The deficiency in data sources though is generally common among all the species with respect to studies of the proteome. The American species, L. polyphemus, has seen some investigation of its proteome (Roth and Levin, 1992; Kawabata et al., 1996, D’Amato et al., 2010), and there has been a significant increase in the number of reported proteins in the past decade. The proteomic data is not too detailed, even for T. tridentatus and C. rotundicauda, with a partial investigation of the hemolymph proteome undertaken a few years back (Wang et al., 2021; Sarmiento et al., 2022). Some researchers laid emphasis on the effects of tetrodotoxin poisoning and the proteinaceous components of hemolymph in C. rotundicauda, which could counteract the toxin (Zhu et al., 2022). However, there has been a glaring gap in the literature beyond these.
The development process of the eggs of T. gigas has been enigmatic in the past, mostly due to the unavailability of techniques to image the eggs or acquire the profile of the developing proteome or the transcriptome. This has impaired the understanding of the later stages as well, which have some clarity owing to the bigger size of the eggs and the time lapse between stages, both of which contributed to their detailed investigation. This article is a novel report that presents the first detailed proteomic analysis of the early development stages of the T. gigas embryos, beginning from the designated stage 2 to stage 5, which could be differentiated on the basis of real-time imaging using an indigenously fabricated monitoring device. Using high-resolution Orbitrap mass spectrometry and optimized sample preparation methods, stage-specific protein expression was differentiated and mapped. We applied STRING-based Gene Ontology and pathway enrichment analyses (Szklarczyk et al., 2023) to interpret this data, uncovering networks of proteins involved in morphogenesis, metabolism, and immune regulation. The ensuing data allows a first glimpse into the changing profile of the proteins involved in the early stages of development in the horseshoe crab.
2 Methods
2.1 Sample collection and embryonic development
Eggs of the horseshoe crab Tachypleus gigas were collected from a natural nesting site of Chandipur (21.468369 N, 87.061295 E) along the shoreline of Odisha (Pati et al., 2015). The collection of the samples and the protocol for handling was in strict adherence to the approved guidelines issued by Odisha Wildlife (reference no. 10839/4WL-39/2019). Following collection, the eggs were transferred to an indigenously built controlled growth chamber containing filtered seawater (salinity 30 ppt). The temperature was maintained between 25 and 30 °C, with pH ranging from 7.0 to 7.5 (Suniza et al., 2011, Jawahir et al., 2017, Faizul et al., 2013). Embryonic development was continuously monitored under a stereomicroscope, and developmental stages were categorized based on previous reports from the Limulus polyphemus (Brown and Barnum, 1983; Bennett, 1974).
2.2 Staging of early embryogenesis with continuous monitoring device
The monitoring of the egg development was performed with an indigenous system that consisted of a structural platform that would hold the main chamber and other parts of the setup. The 3D model created and saved as an ‘.stl’ file was loaded into Ultimaker Cura 5.6.0 for 3D printing. The infill density was set to 20% against a chosen cubic pattern, which helped make the structure stable without using too much material. PLA filament was used for printing, since it’s biodegradable and works well with desktop 3D printers. The printer nozzle was heated to 205 °C and the bed to 60 °C to ensure good adhesion during printing as per the standard protocol (van der Borg et al., 2023). A 0.2 mm nozzle was utilized, and the print speed was kept at 30 mm/s. To take care of perturbations in the image quality during aeration, partitions on the left and right sides were added. The center had an elevated stage-like structure to hold the sample, with a glass plate fixed on top for clear viewing. A Raspberry Pi V4 unit, operating on Raspberry Pi OS (Howser, 2019), was mounted on top of this setup (Figure 1) along with a camera, and other electronics (Figure 1).
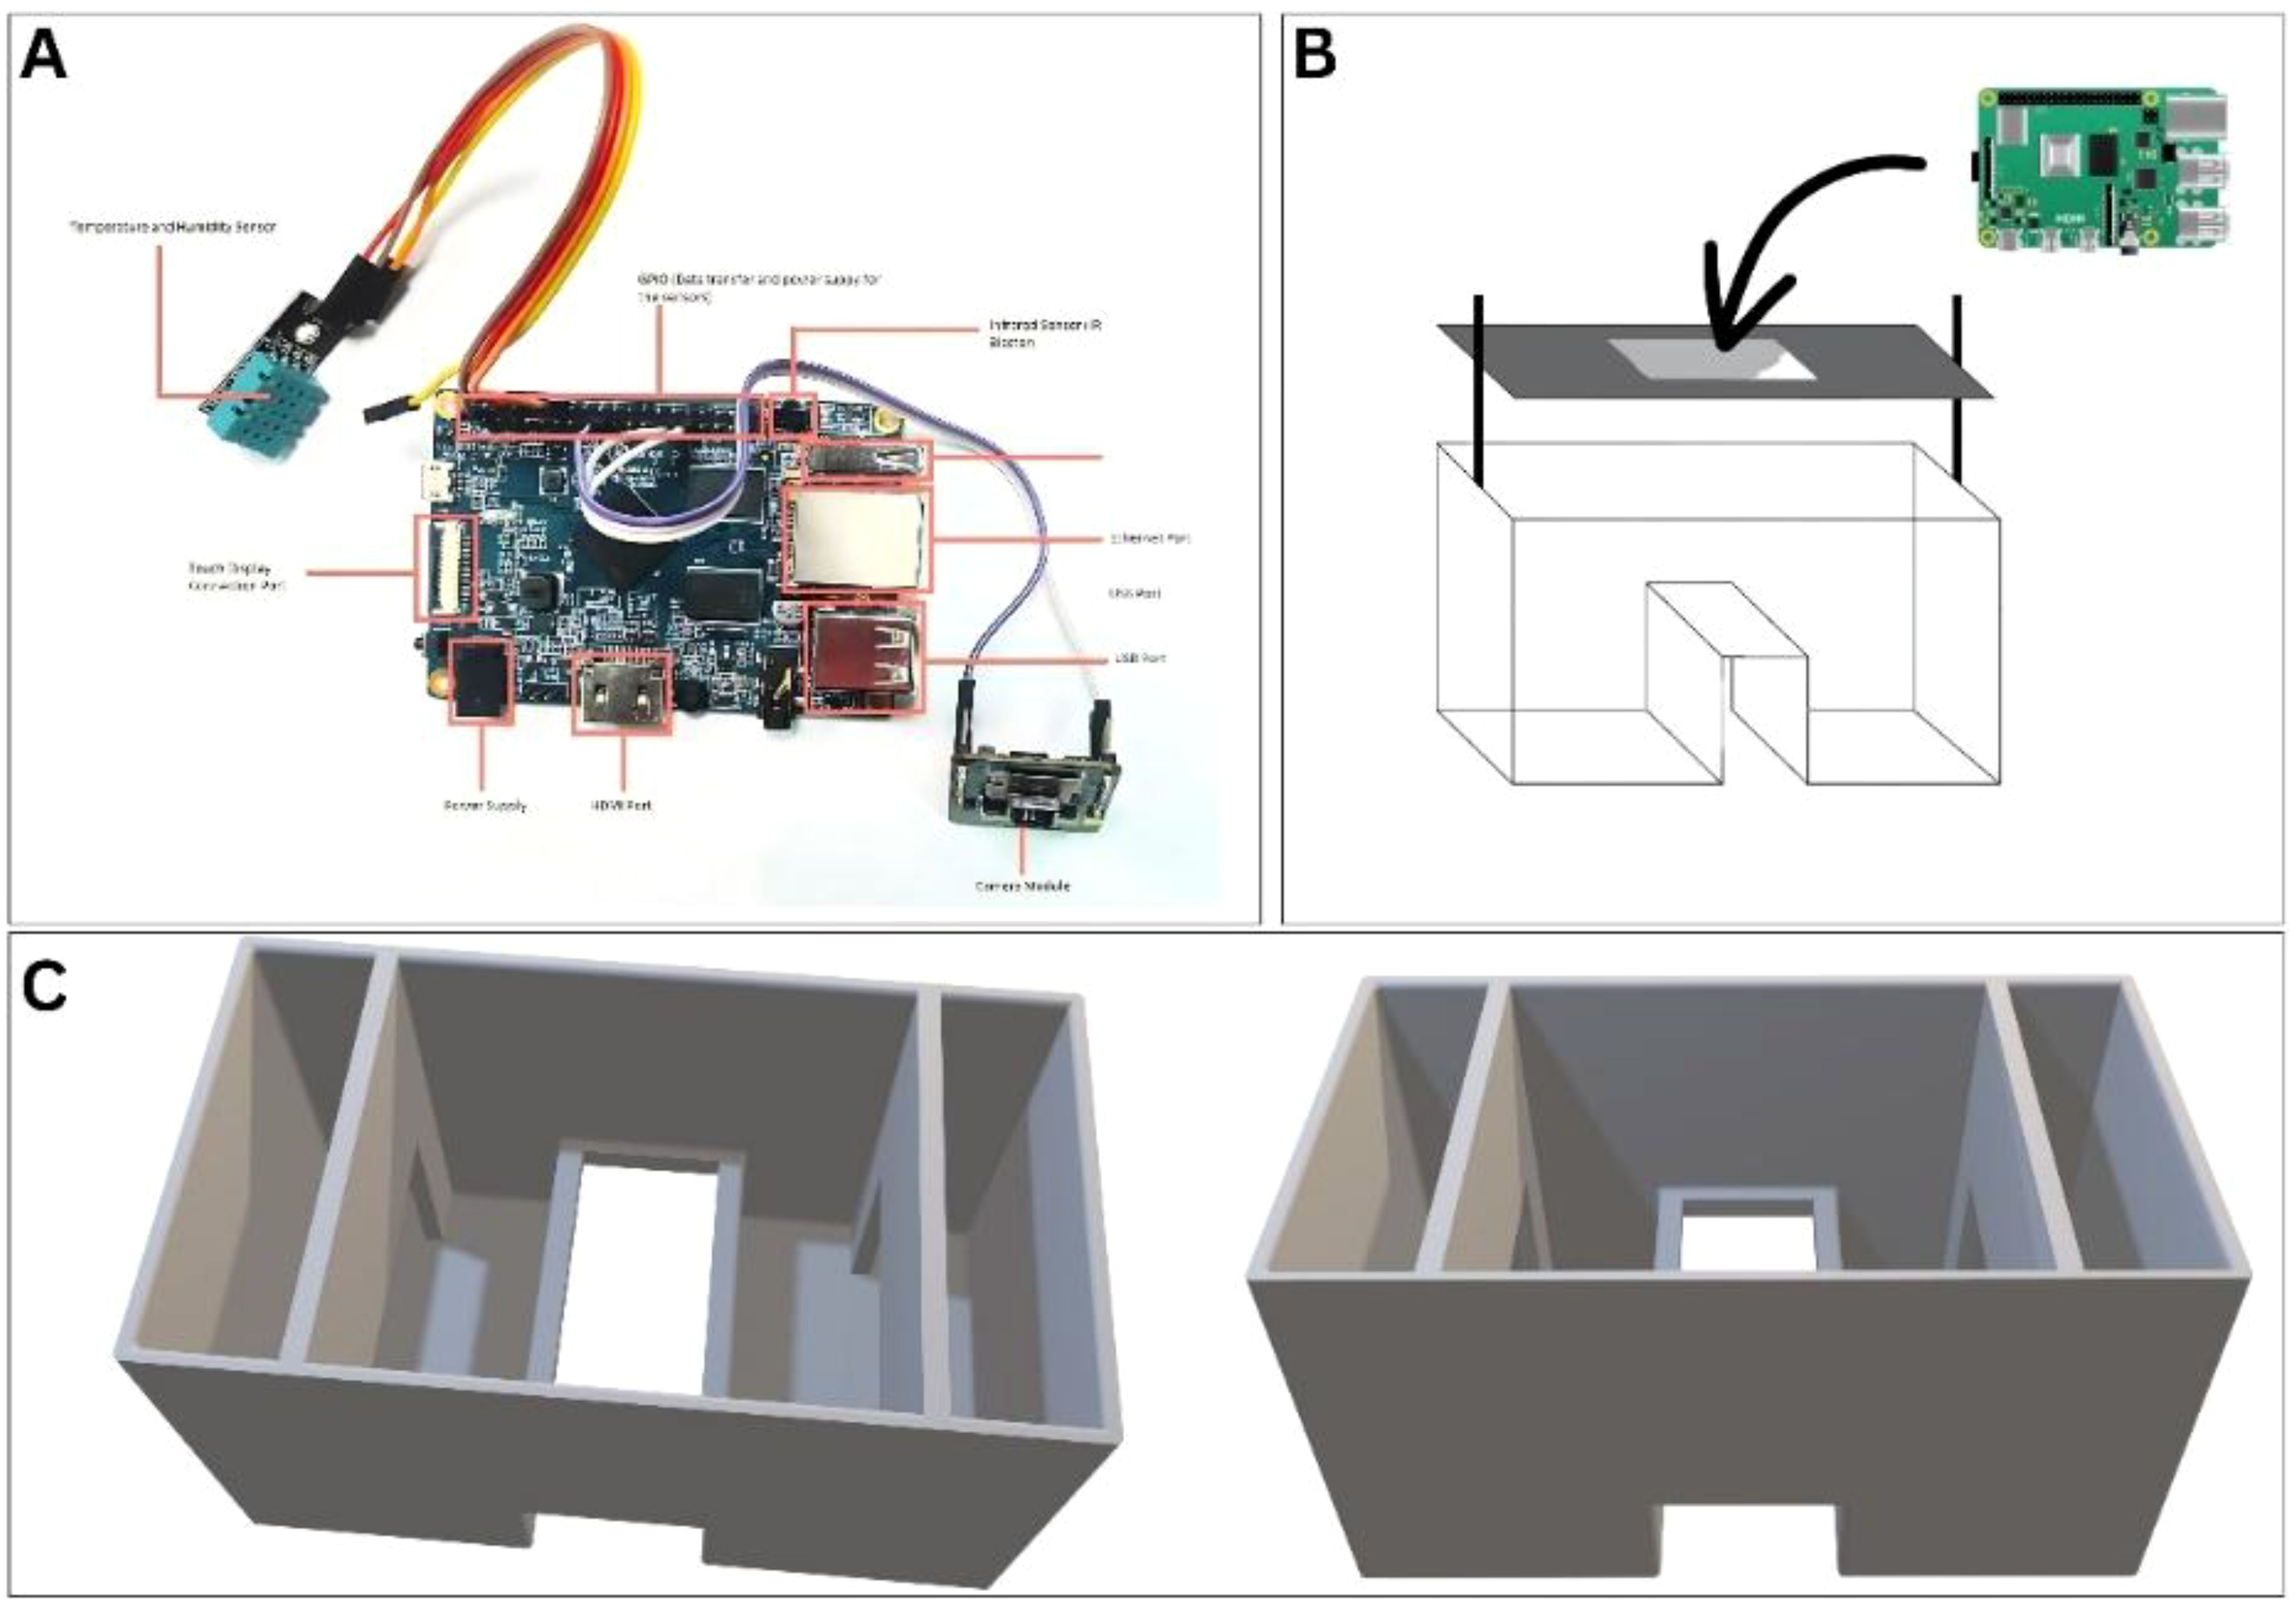
Figure 1. Design and electrical components of the continuous monitoring system. (A) The Raspberry Bi board with all the components attached. (B) The layout and positioning for the Raspberry Pi board on a platform with an attached camera facing towards the sample. (C) 3D layout of the incubator system.
The Raspberry Pi was linked to a 2 MP IMX219 camera module via a CSI cable. Two LED lights and a temperature sensor were connected using the GPIO of the Raspberry Pi (Figure 1). A distinct tiny aerator was linked through the USB port of the Raspberry Pi, and an external power source of 5V 2A was utilized to energize the system. The official Python libraries for Raspberry Pi were utilized to facilitate communication over GPIO. Custom Python code was created to collect and save video in the local storage of a Raspberry Pi. Distinct Python code was included in the main file for measuring temperature and ambient humidity, with all data recorded in a CSV file at five-minute intervals. Various Python modules, including NumPy, Pandas, and Matplotlib, were utilized for data processing and visualization. The data visualization programs were created with an automatic update feature, and the refresh rate was set at five minutes. The DHT11 sensor was calibrated for temperature in the range of 15 to 50 °C and for humidity from 50% to 90%. Calibration involved taking measurements in triplicate against reference instruments (the incubator and plant growth chamber) and calculating systematic offsets. The calibration standards and reports are attached as supplementary files (ST 1 and 2, SF 1 and 2) and a detailed procedure mentioned in the supplementary files as well. The image data had a resolution of 649 × 480 pixels at 2 megapixels and a 24-bit color depth.
The device was engineered to ensure minimum background perturbations and to keep the sample in close proximity to the camera. The eggs designated for observation were placed on the sample holder. Saline water with a salinity of 30–33 ppt was used in the chamber, and aerator pipes were inserted at the corners of the chamber. Since increased salinity affects the hatching time and metamorphosis (Greene et al., 2011), the water was changed every two days, while aeration was continuously provided during the experiments. As previously mentioned, images of the eggs were captured, and the video was stored locally.
A fertilized, growing egg was selected for continuous observation to monitor its developmental progression under standardized conditions. The selected egg was carefully transferred to a controlled environment onto the sample holder, where temperature, humidity, and other relevant parameters were maintained at optimal levels to support normal embryogenesis. To comprehensively document morphological changes during development, still images and video recordings were captured at 24-hour intervals using a calibrated imaging camera setup. These recordings enabled detailed visualization of change in the external surface of the egg, such as changes in texture, transparency, or surface integrity, as well as fluctuations in overall size.
2.3 Egg sectioning with vibratome
The eggs were sectioned using a Leica vibrating microtome VT1000S for validation of the staging. The samples were embedded in freshly prepared 4% agarose dissolved in 1X PBS to provide support and maintain the optimal natural shape of the eggs. The agarose block was then mounted onto the specimen holder of a Leica VT1000S vibrating microtome using a small amount of glue to hold it firmly in place. The vibratome tray was filled with 1X PBS to keep the tissue hydrated and reduce friction during cutting. Sectioning was carried out with the vibratome set to a slice thickness of 40 µm. Cutting speed and amplitude were adjusted as needed to obtain smooth and consistent sections. The sections were collected on glass slides and examined under an Olympus CKX53 microscope.
2.4 Protein extraction
Approximately 0.3g of eggs from each developmental stage were homogenized using a sterile micropestle in 2 mL extraction buffer (0.9% NaCl, 50 mM Tris-HCl, pH 7.5, and protease inhibitor cocktail). The homogenate was incubated on ice for 10 min and centrifuged at 12,000 rpm for another 10 min at 4 °C. The supernatant was collected and stored at -80 °C. The number of biological replicates considered across each stage was three, owing to the restrictions on collection of samples.
2.5 Protein precipitation, cleanup, and concentration
The collected supernatant was subjected to protein precipitation by the addition of 10% (w/v) TCA at a 1:4 ratio. Samples were incubated at -20 °C overnight to precipitate proteins. Precipitates were collected by centrifugation at 8,000×g for 15 min at 4 °C, and pellets were resuspended in 7 M urea prepared in 50 mM ammonium bicarbonate buffer. Protein desalting was performed using 3 kDa MWCO centrifugal filters (Amicon Ultra-0.5 mL), and concentrations were determined using the 2D Quant Kit (GE Healthcare). Fifty micrograms of protein from each sample were reduced with DTT, alkylated with iodoacetamide, and digested with trypsin at a 1:50 (w/w) ratio. Peptides were concentrated using a SpeedVac, desalted with C18 ZipTips (Millipore), and reconstituted in 0.1% formic acid for LC-MS/MS analysis on an Orbitrap Fusion mass spectrometer.
2.6 LC-MS/MS analysis
Tryptic peptides were analyzed using an Orbitrap Fusion mass spectrometer (Thermo Scientific) coupled to an EASY-nLC 1200 system equipped with a 50 cm × 75 µm ID PepMap C18 EASY-Spray column. Peptides were separated using a 140-minute linear gradient of 5-95% solvent B (80% acetonitrile, 0.1% formic acid) at a flow rate of 300 nL/min. MS1 spectra were acquired in the Orbitrap analyzer over an m/z range of 375–1700 at 60,000 resolution (AGC target 4 × 10⁵; maximum injection time 50 ms). MS2 spectra were acquired following HCD fragmentation (NCE 35) at 15,000 resolution at 200 m/z (AGC target 5 × 10⁴; maximum injection time 22 ms).
2.7 Data processing and protein identification
Raw files were analyzed using Proteome Discoverer 2.2 (Thermo Scientific) with Sequest HT, searched against T.gigas protein assembled from the annotated transcriptomic data (Dryad Digital Repository https://doi.org/10.5061/dryad.2jm63xsmc) (Shingate et al., 2020), appended with common contaminants. Search parameters included: precursor mass tolerance 10 ppm, fragment mass tolerance 0.05 Da, carbamidomethylation (C) as fixed modification, oxidation (M) and N-terminal acetylation as variable modifications, and up to one missed cleavage. Peptide spectral matches (PSMs) were filtered to 1% FDR at peptide and protein levels using Percolator. The study involved the identification of proteins present at different developmental stages instead of their relative abundance with a quantitative approach.
2.8 Data analysis
Gene ontology (GO) analysis and Protein-protein interaction (PPI) analysis were performed using the STRING database (v12.0), which integrates both experimentally validated and predicted interactions. These interactions are derived from diverse sources, including computational predictions, co-expression data, literature mining, and knowledge transfer across organisms. Following sequence matching and identification of protein, a FASTA file containing the protein sequences of different samples was submitted to the STRING database. The organism was selected from Chelicerata to ensure the closest organism match and appropriate phylogenetic context during annotation. The resulting annotated protein set was then utilized for gene ontology (GO) analysis and association network construction. GO categorization included biological process, molecular function, and cellular component domains, enabling functional interpretation of the protein dataset in the context of development and interaction networks.
3 Results
3.1 Initial development morphology
At its maximum latency, the growth and development of fertilized eggs could be monitored over a period of seven weeks. The continuous observation allows the user to capture detailed changes in the egg’s appearance and size. During the initial few days of development, the egg exhibited a slightly greenish appearance, consistent with the early stages of embryonic development described in the Limulus polyphemus embryo (Brown and Barnum, 1983). Upon closer inspection, small internal furrows were visible on the surface of the egg (yolk), associated with the initial stages of cell division and organization within the egg. The initial size of the egg was recorded as 3.04 mm to 3.12 mm across its diameters (Figure 2). By the end of the first week, the color of the egg changed, with the greenish hue beginning to disappear, and the egg took on a more neutral, translucent appearance. Additionally, new furrows appeared on the surface, suggesting further development and differentiation of the embryo. Although the increase in size was not very drastic, it was measured as 3.17 to 3.24 mm across its diameters. The initial phases, which were identified according to stages (as described in the next section), persisted till 8 days post-fertilization in the growth chamber.
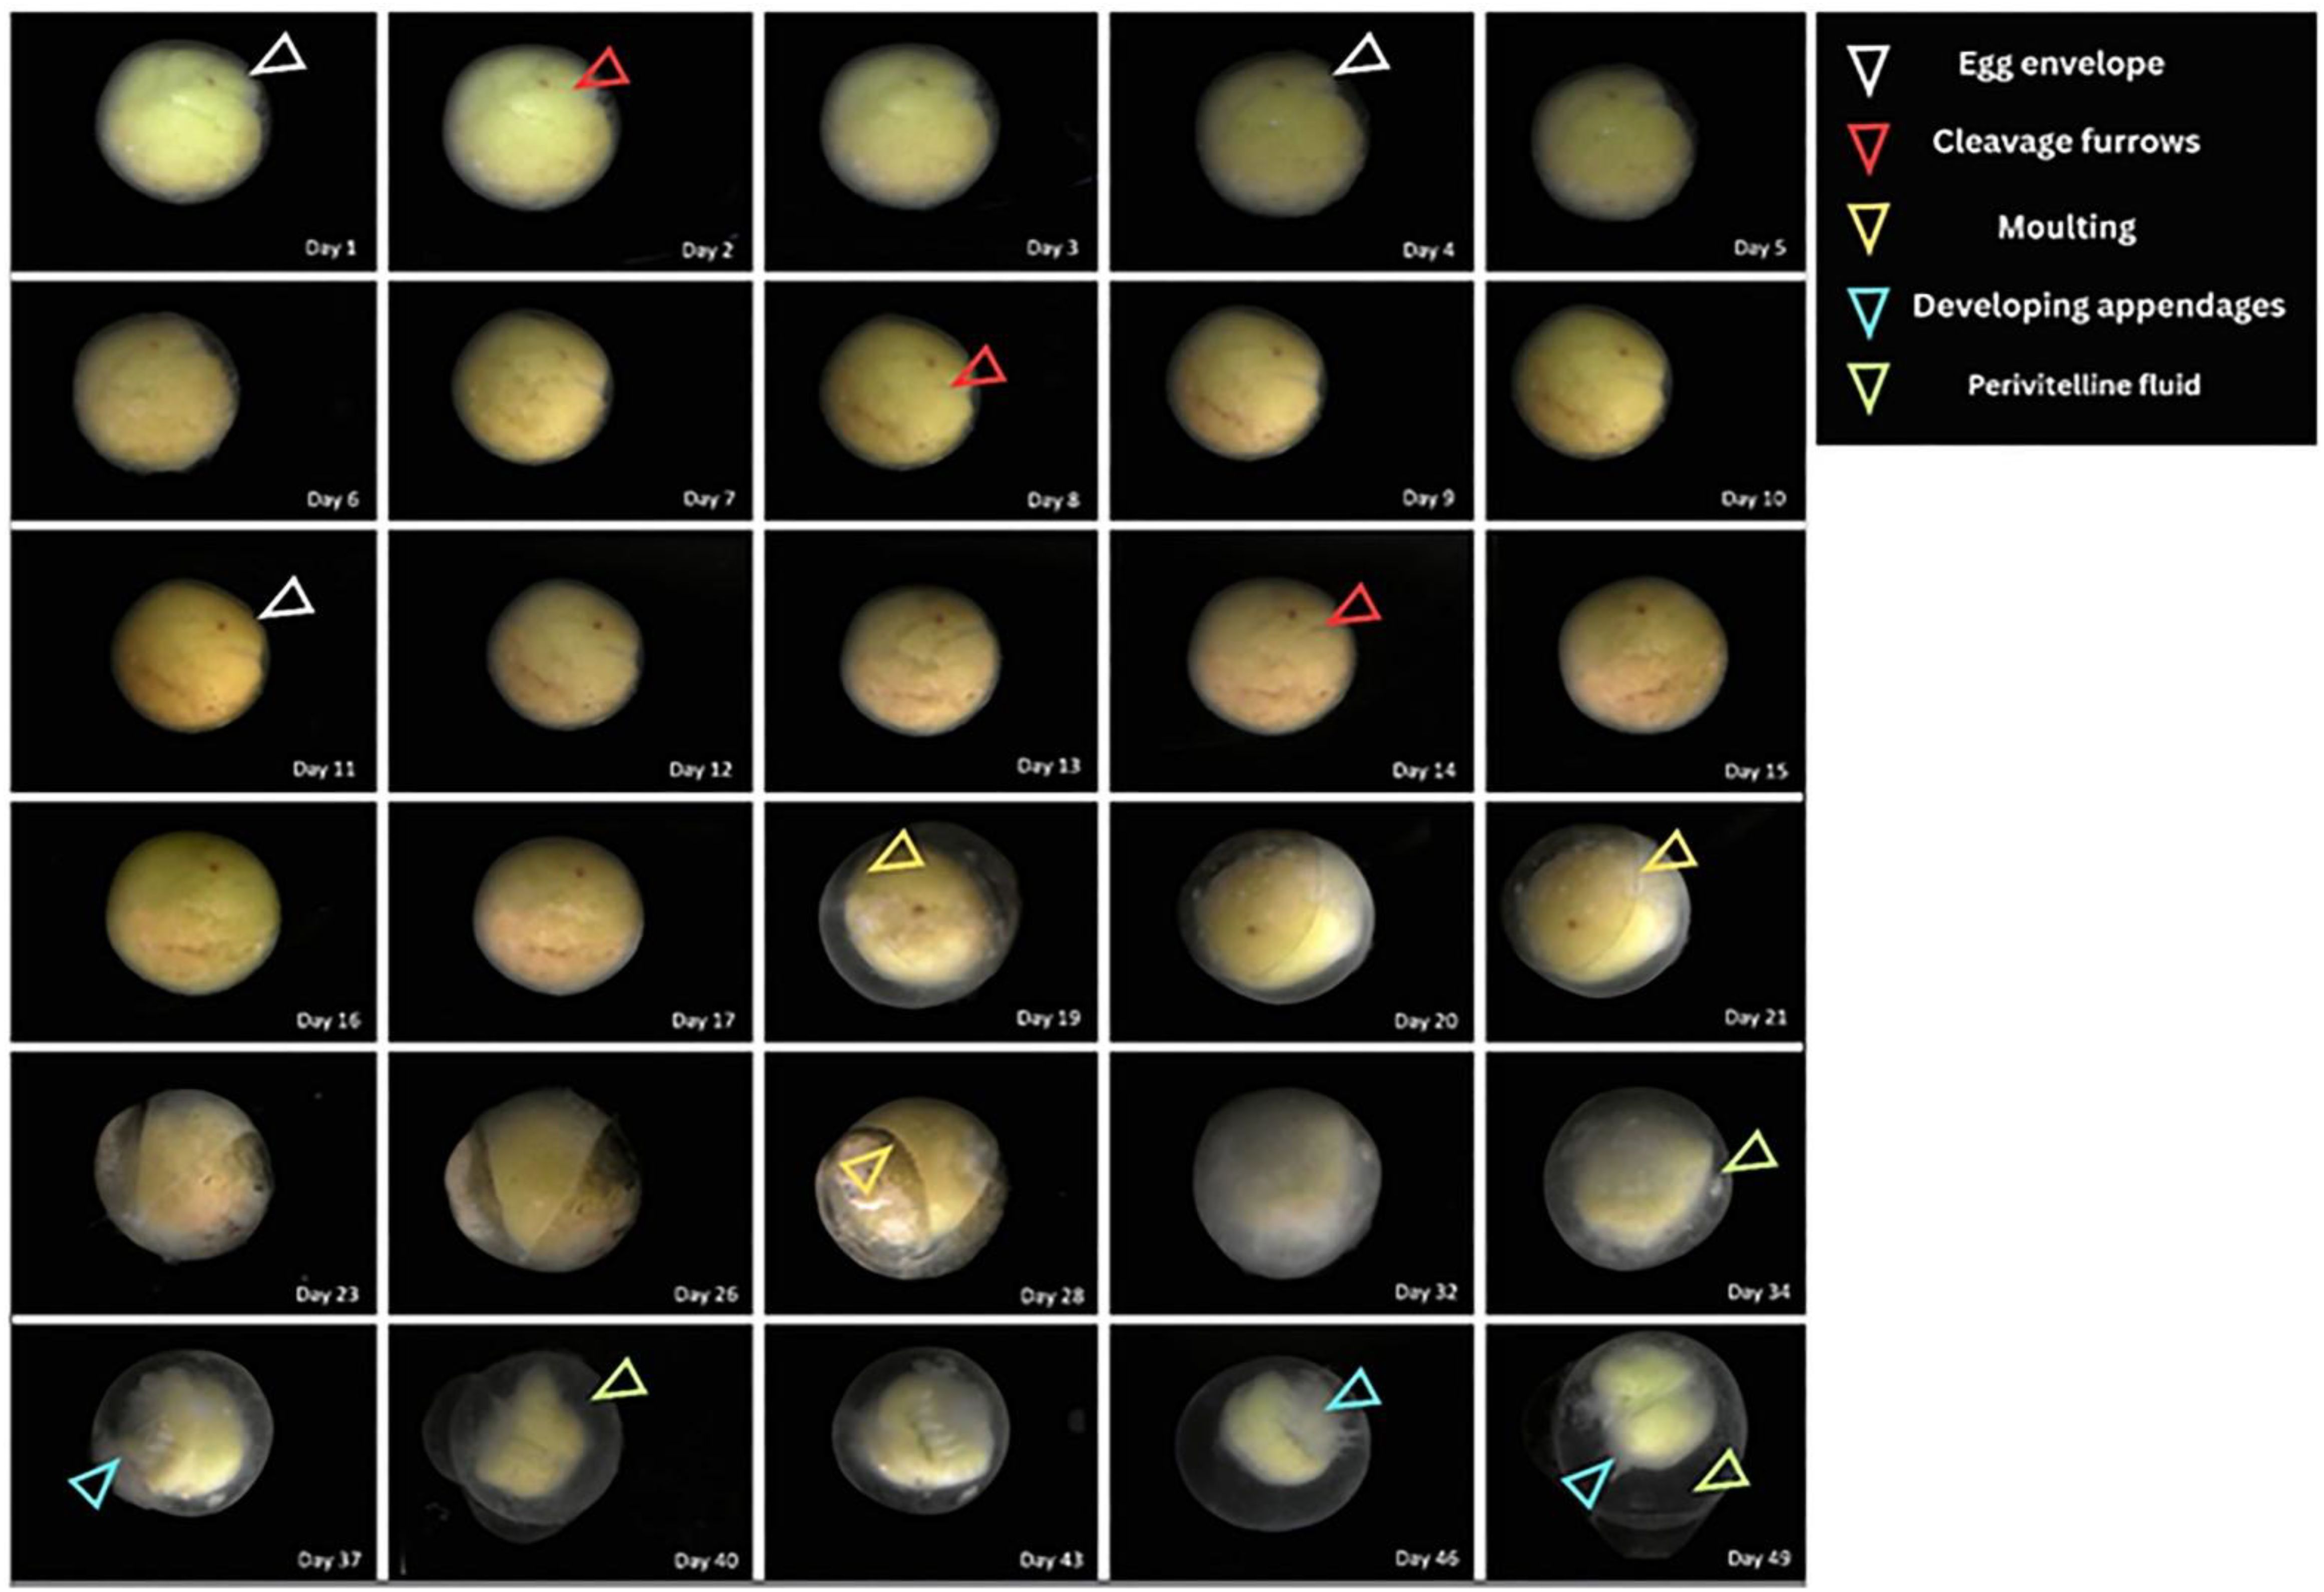
Figure 2. Day-wise changes on the surface of the egg as taken by the continuous monitoring system. The system was able to capture the changes on the surface for a period of around seven weeks. The time-lapse data illustrate development and surface transformations occurring during embryonic growth.
3.2 Staging and initial developmental stages
The early development of Tachypleus gigas embryos is marked by distinct stages of surface granulation and cell division, before the embryo surface finally becomes smooth (occasionally occluded) at the later stages of development. The freshly fertilized egg surface appeared smooth in appearance, and granulation was first observed around 6 hours post-fertilization. The appearance of a septa, dividing the egg surface into two major halves as shown in Figure 3A, is one of the hallmarks of this stage. Starting from one small indentation, the septa slowly spread across the embryo’s surface, further giving rise to a segmented yolk-like surface. This stage, which was evident for 10 to 12 hours after fertilization, has been designated stage 1. The onset of stage 2 is marked by the appearance of cylindrical grooves that extend into the yolk, marking the beginning of cell division and blastoderm formation. The T. gigas egg, being significantly larger than the L. polyphemus egg (or other species) (Itow et al., 1991), develops a dense aggregation of yolk, making it increasingly difficult to visualize the internal organization (Figure 3E). However, at this stage, deep grooves appear, dividing the yolk into large blocks (Figure 3B), very similar to stage 2 of L. polyphemus (Brown and Barnum, 1983), where the number of nuclei was also seen to increase significantly. Stage 2 lasts in these embryos for a period of 38±2 hours after fertilization. As development proceeds toward Stage 3, the egg’s surface becomes uneven, and clusters of smaller blastoderm cells begin to form beneath the thick layer of yolk (Figure 3C). At this stage (day 3 post-fertilization), the cell division mostly happens at the edges of the embryo, gradually building the blastoderm layer. The appearance of degradation bodies in the yolk mass is also significantly observed in this stage (Figure 3F) . By Stage 4 (lasting till 90±6 hours), the number of nuclei increases, and the surfaces of the eggs are fairly granular and the grooves, though smaller in size increase in number. Internal structures are hard to see, but with time, the yolk granules separate in patches and the nuclei are visible. Internally, the embryo shows all the hallmarks of gastrulation (Figure 3G). Finally, in Stage 5 (till day 6 post-fertilization), the yolk ‘islands’ (Kimble et al., 2002) are broken in extensive patches and the yolk appears to be distributed into smaller granules (Figure 3D). Internally, the embryo shows distinct involution along a crescent-shaped cleft (Figure 3H), with the inward movement of blastopore cells towards the interior of the egg, signaling the outlay of the future germ disc (which would be evident in the later stages).
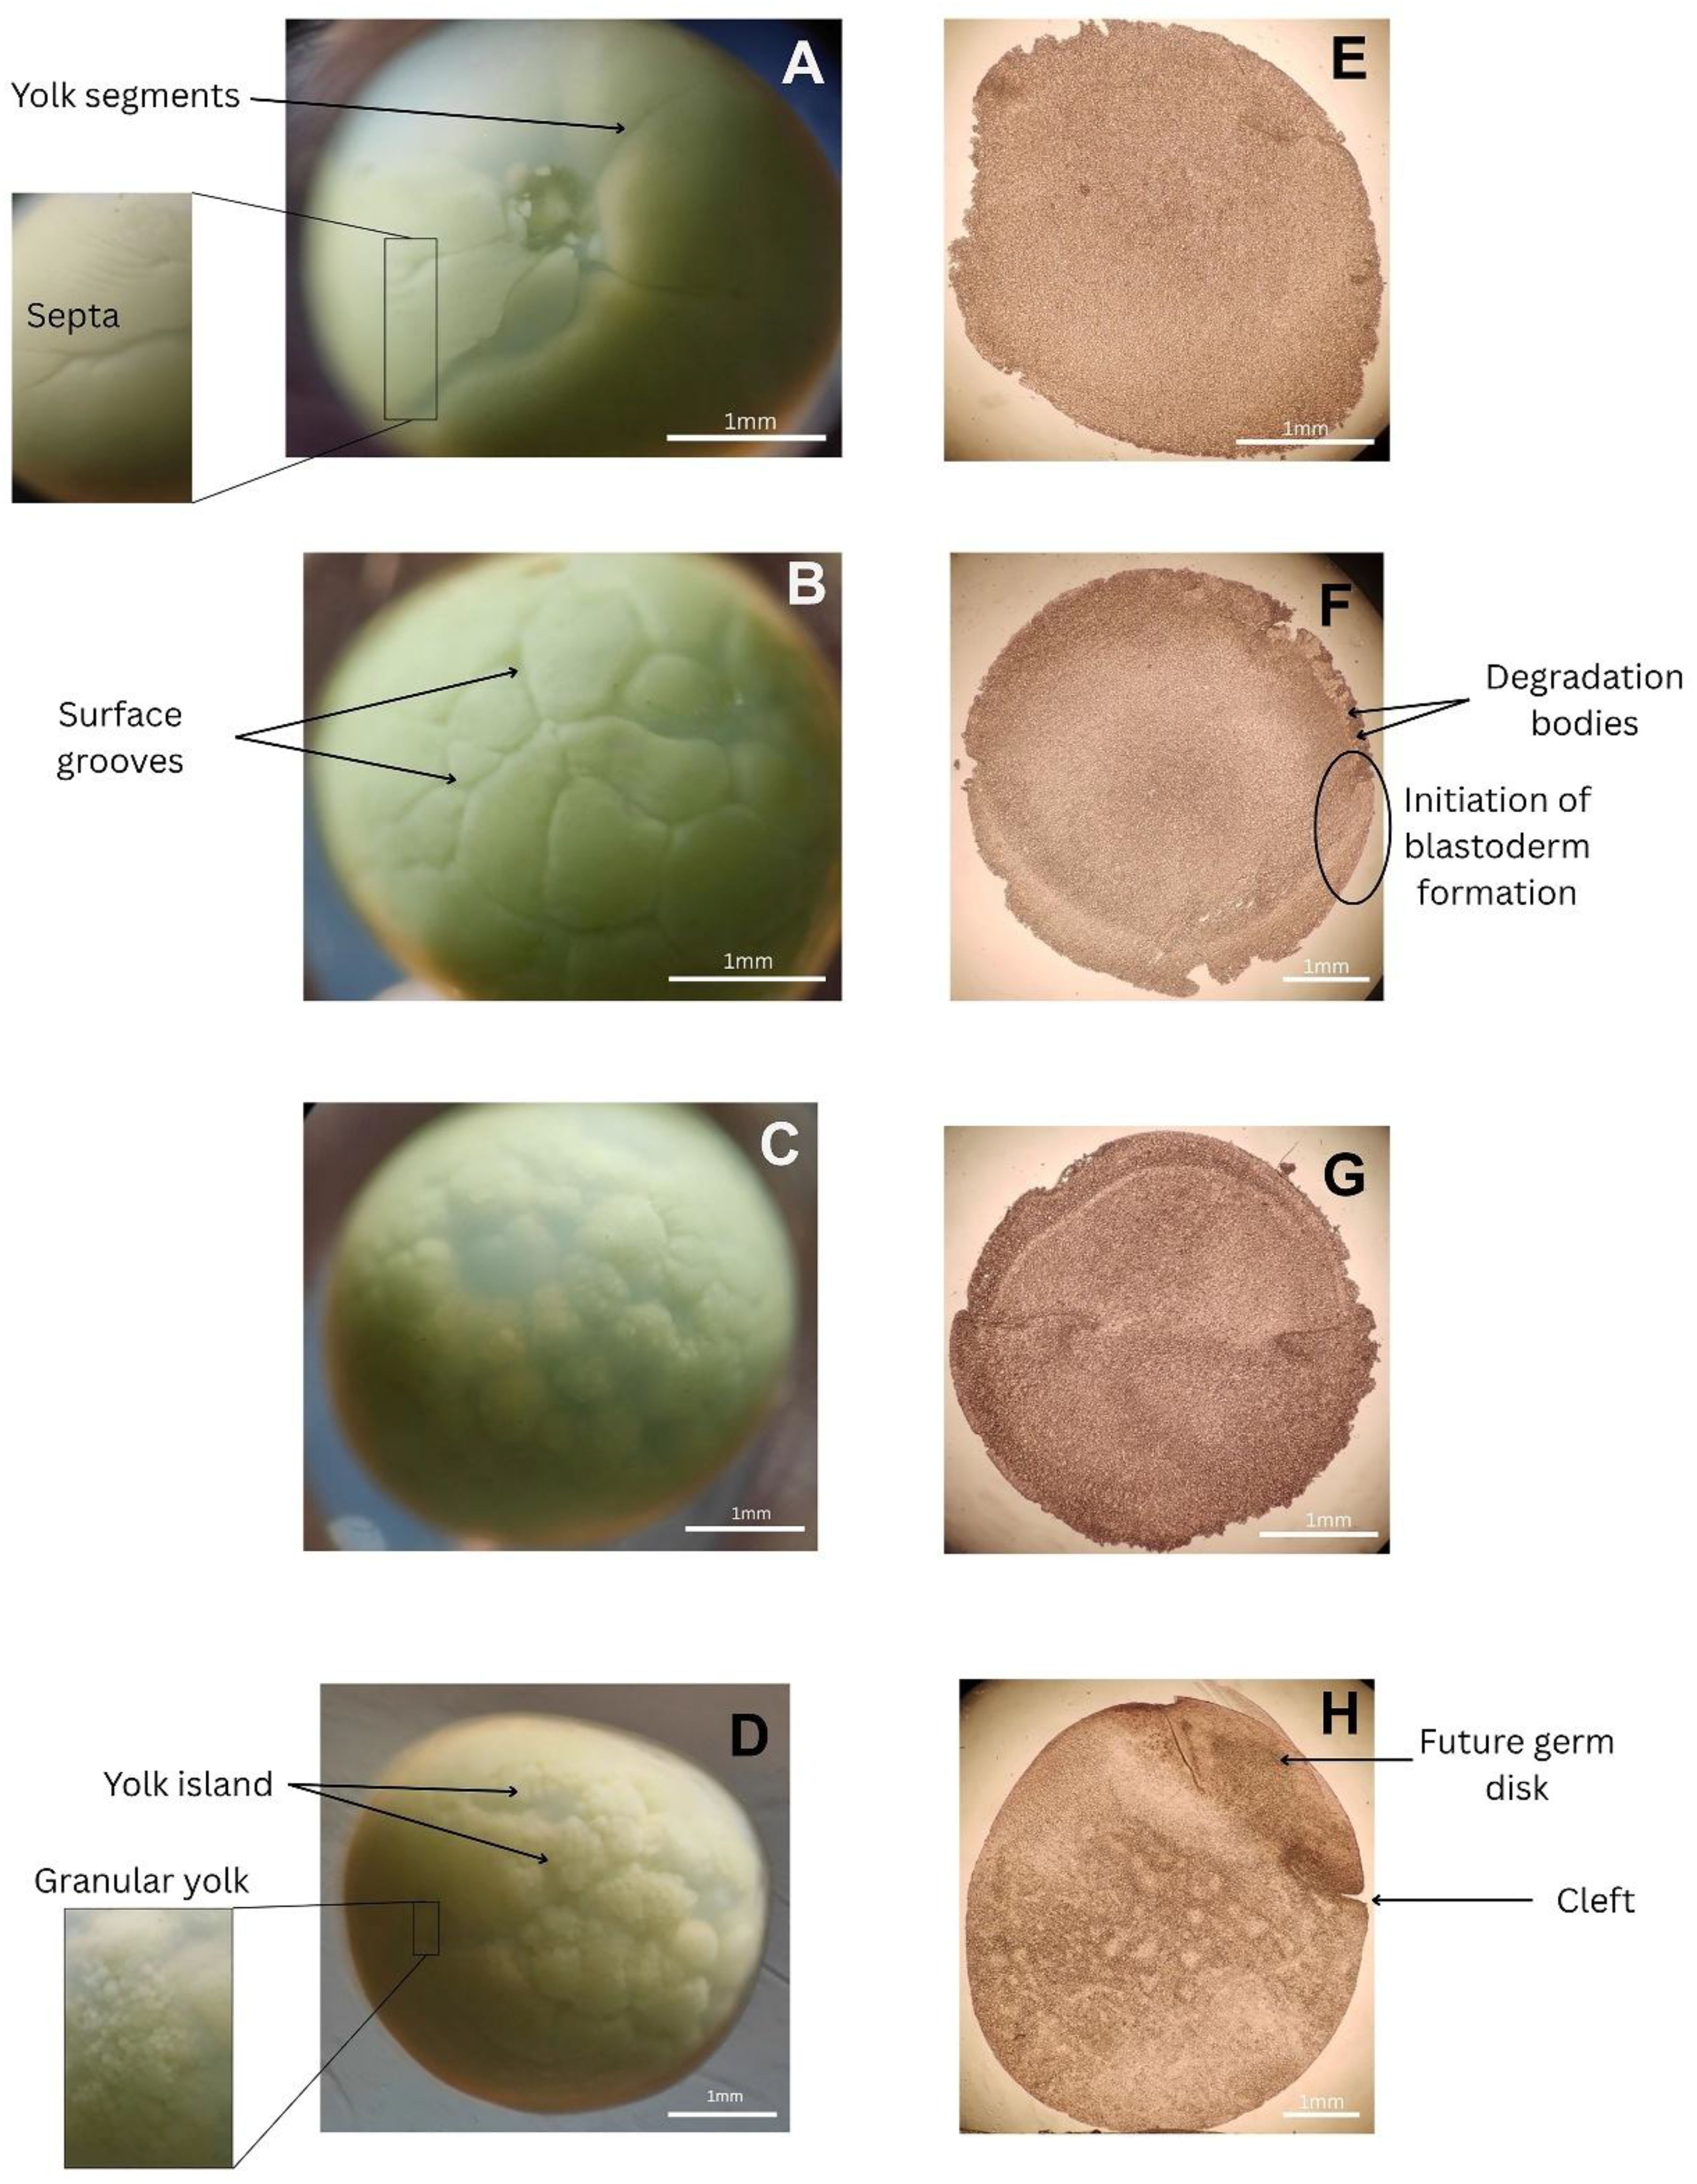
Figure 3. Surface of the developing T. gigas eggs (A–D) corresponding to stages 2 to 5 (from top to bottom). Corresponding sections (E–H) obtained using a vibrating microtome reveal internal structural changes associated with embryonic development.
3.3 The SDS-PAGE pattern of proteins
The protein samples isolated from the eggs of varying stages were labelled as S2, S3, S4, and S5, respectively for stages 2,3,4 and 5. The total protein concentration and SDS-PAGE profile of the 4 samples were analyzed to assess protein yield and quality. As shown in Figure 4, the extracted protein concentrations varied across samples, with S5 exhibiting the highest concentration of 77 µg/mL, followed by S4 (~55 µg/mL), S2 (~48 µg/mL), and S3 showing the lowest yield (~29 µg/mL).
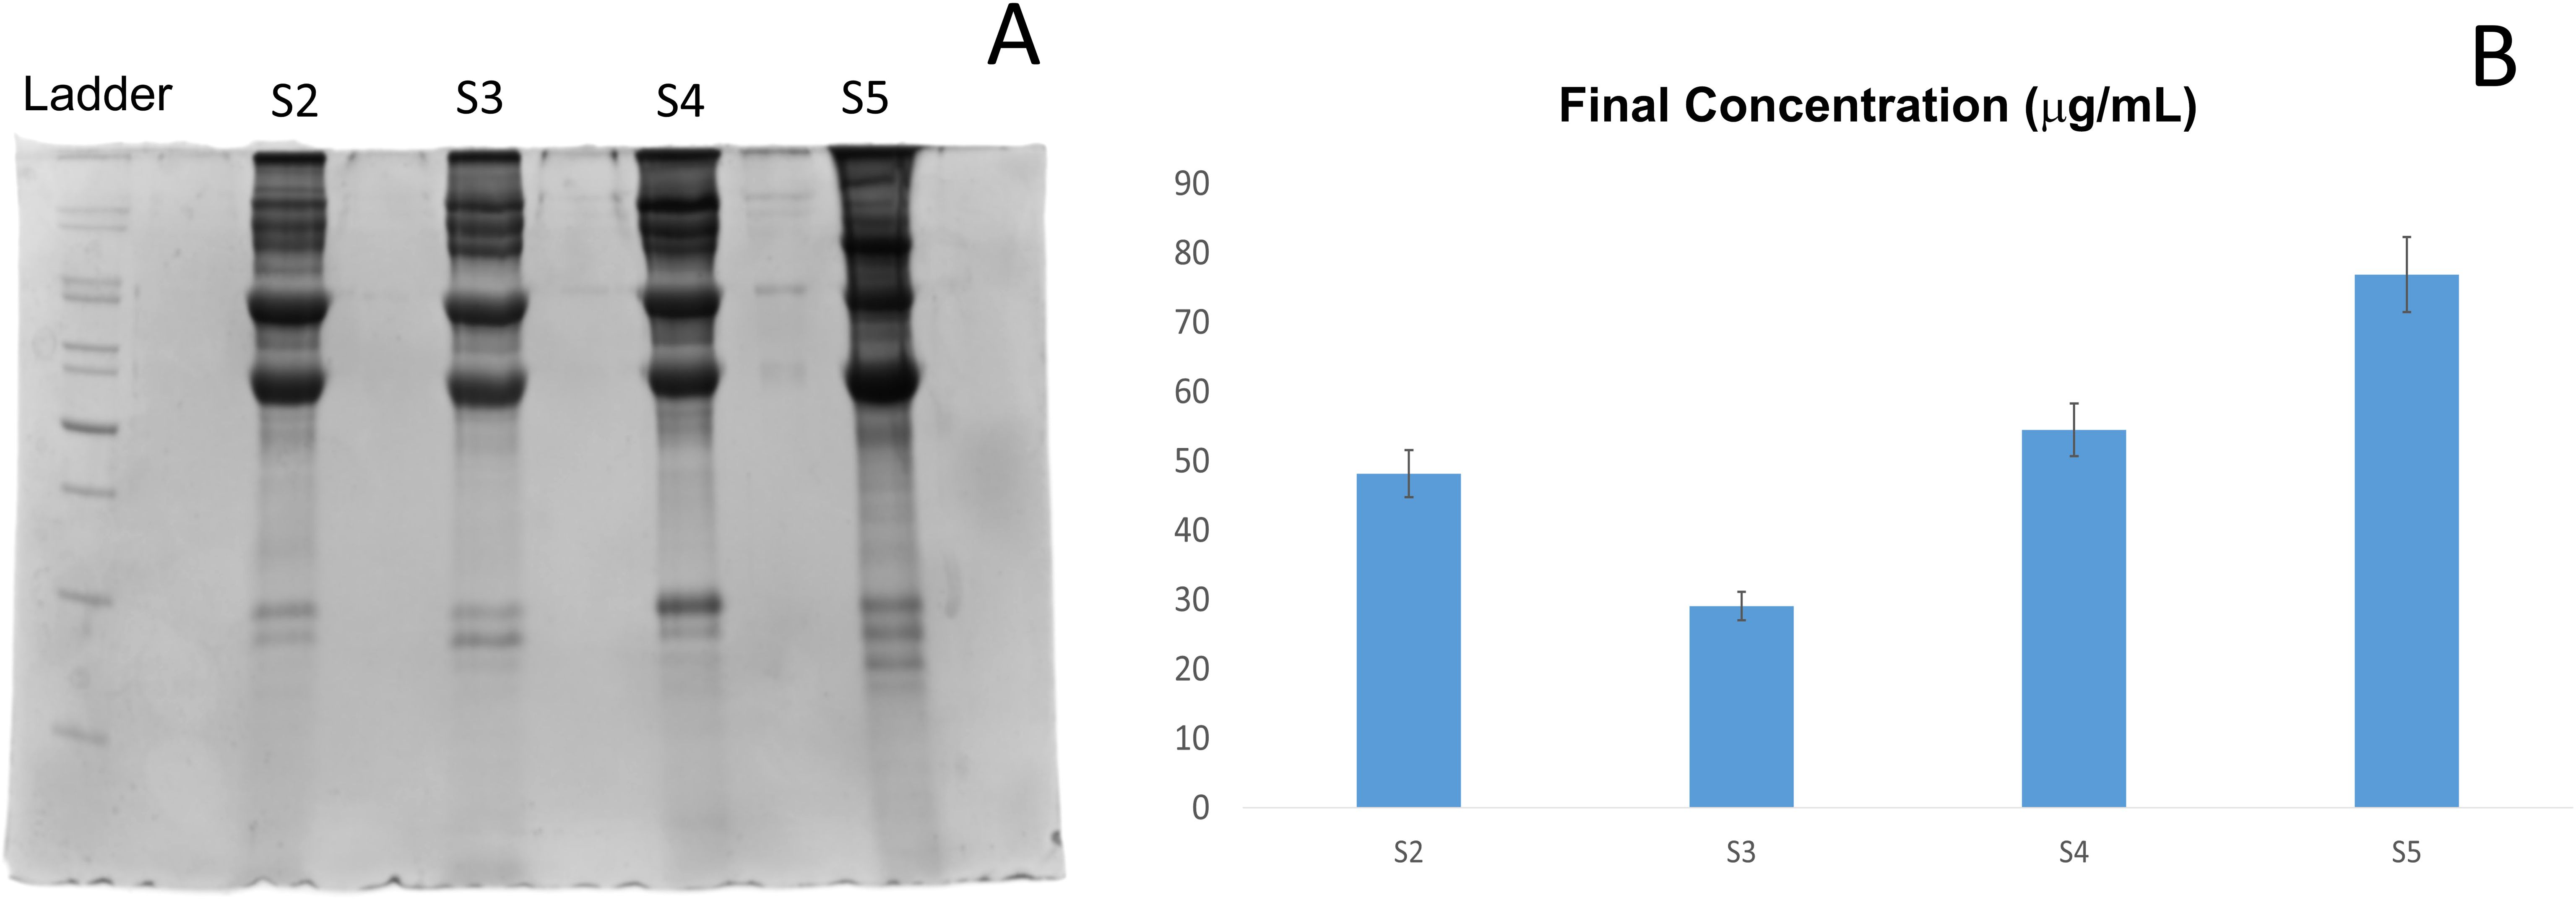
Figure 4. SDS-PAGE of proteins resolved on a 12.5% gel (A). Protein concentrations were estimated using the Bradford assay. (B) Protein concentrations from samples stage-wise (S2 to S5).
The protein aliquots were loaded in the SDS-PAGE at a uniform concentration of around 1µg. The SDS-PAGE gel image represents the protein profiles of the samples. All samples (S2-S5) showed multiple bands as shown in Figure 4, suggesting the presence of multiple proteins, mostly high molecular weight, expressed during the early stage of development. The proteins expressed at these stages appeared to be fairly uniform in distribution, with some variation in S5. The concentration of total protein increases (except in S3) from stages 2 to 5 as well.
3.4 Proteome analysis of extracted proteins
Following LC-MS/MS analysis, a large number of peptides were successfully matched to protein sequences in the reference database. From the peptide-spectrum matches (PSMs) across all four developmental stage samples (S2 to S5), a total of 1,354 proteins were identified. The overall sequence coverage for the identified proteins ranged from as low as 1%, to as high as 75%, indicating extensive peptide representation and higher confidence in protein identity. To identify proteins and their associated pathways across developmental stages, comparative analysis was performed across the four samples. Only proteins with a minimum sequence identity threshold of 2% were considered for any further analysis. Although a high cutoff ensures that only proteins with reliable and recurring representation are considered for core proteomic profiling, the number of matches was comparatively much lower in high coverage percentage. As a result, 957 proteins were found to be shared across all four samples. The distribution of these proteins across the samples is illustrated in Figure 5 using a Venn diagram. Among these, 13 proteins were found to be common to all four stages, suggesting a small but potentially essential core proteome. In contrast, a large number of accessions were stage-specific, with 196 unique to S5, 142 to S2, 121 to S3, and 80 to S4, also indicating substantial stage-specific proteomic diversity. Intermediate overlaps were also observed, including 16 proteins shared between S2 and S3, and 29 shared between S4 and S5, while smaller intersections were seen across other combinations.
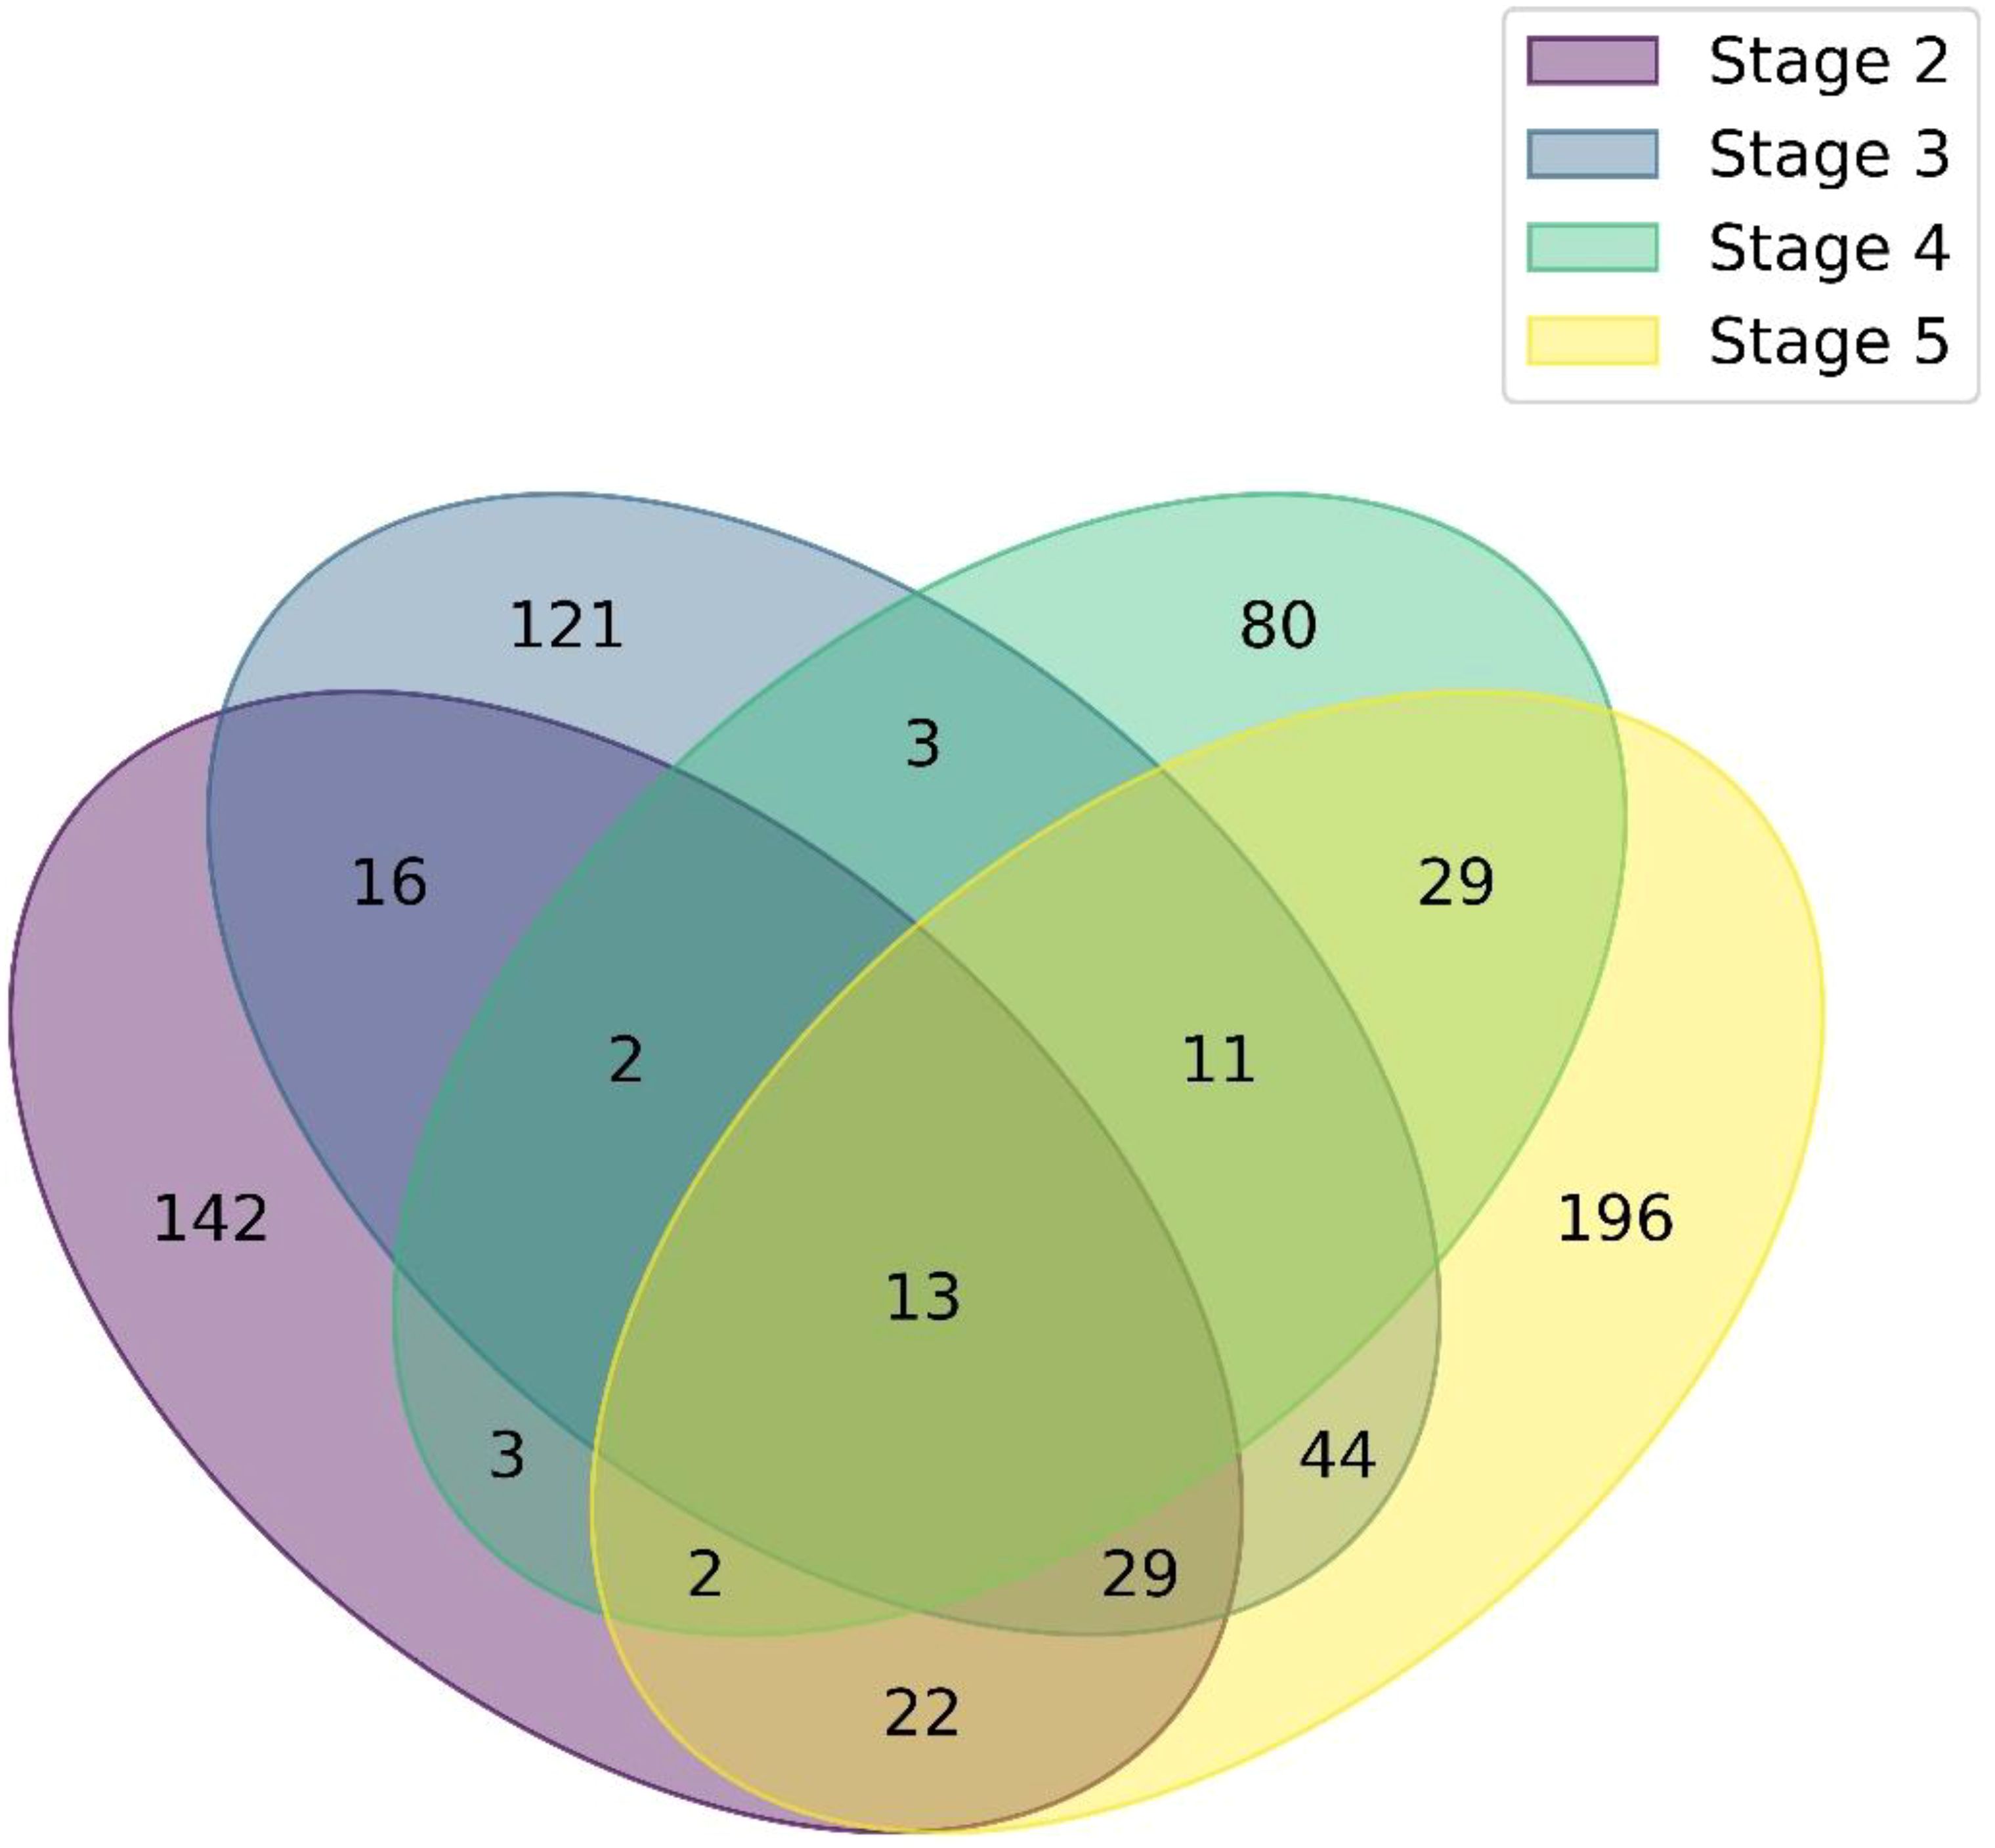
Figure 5. Venn diagram of protein distribution across developmental stages. Venn diagram showing the overlap and unique sets of identified proteins among developmental stages S2 to S5.
Sample S5 exhibited the highest number of total identified proteins (346), more than twice that of S4 (143), which showed the lowest proteome complexity. S3 and S2 revealed 239 and 229 proteins, respectively. Protein physicochemical properties (pI and molecular weight) were broadly distributed across all samples, with no sample-specific clustering. Sequence coverage was consistent across stages, with median values ranging from 11% to 14%. Peptide-level identification using both MS Amanda 2.0 and Sequest HT revealed similar patterns across all samples, with MS Amanda consistently yielding higher peptide counts per protein.
We observed a clear variation across different samples (S2-S5) in terms of calculated isoelectric point (pI), sequence coverage, and molecular weight (MW) of identified proteins (Figure 6). The calculated pI values are broadly distributed across all samples, ranging approximately from pI 4.5 to 11, indicating the presence of both highly acidic and strongly basic proteins within the proteome. This wide distribution is characteristic of complex biological systems, where proteins with diverse properties and pH are required for different cellular processes. All four samples showed similar pI distributions, suggesting that the diversity of pH (acidic and basic) of the proteomes is consistent across samples. In terms of sequence coverage, S5 displays the most prominent distribution, with many proteins showing coverage values exceeding 20% and a few above 70%, indicating more efficient or extensive protein identification in this sample. In contrast, S2, S3, and S4 mostly have coverage below 20%, pointing to lower depth or identification confidence. In terms of the molecular weight, all samples contain proteins ranging from under 25 kDa to over 300 kDa. S5 again shows a denser clustering of proteins in the 25–50 kDa range and a wider spread, suggesting higher complexity or a better resolution.
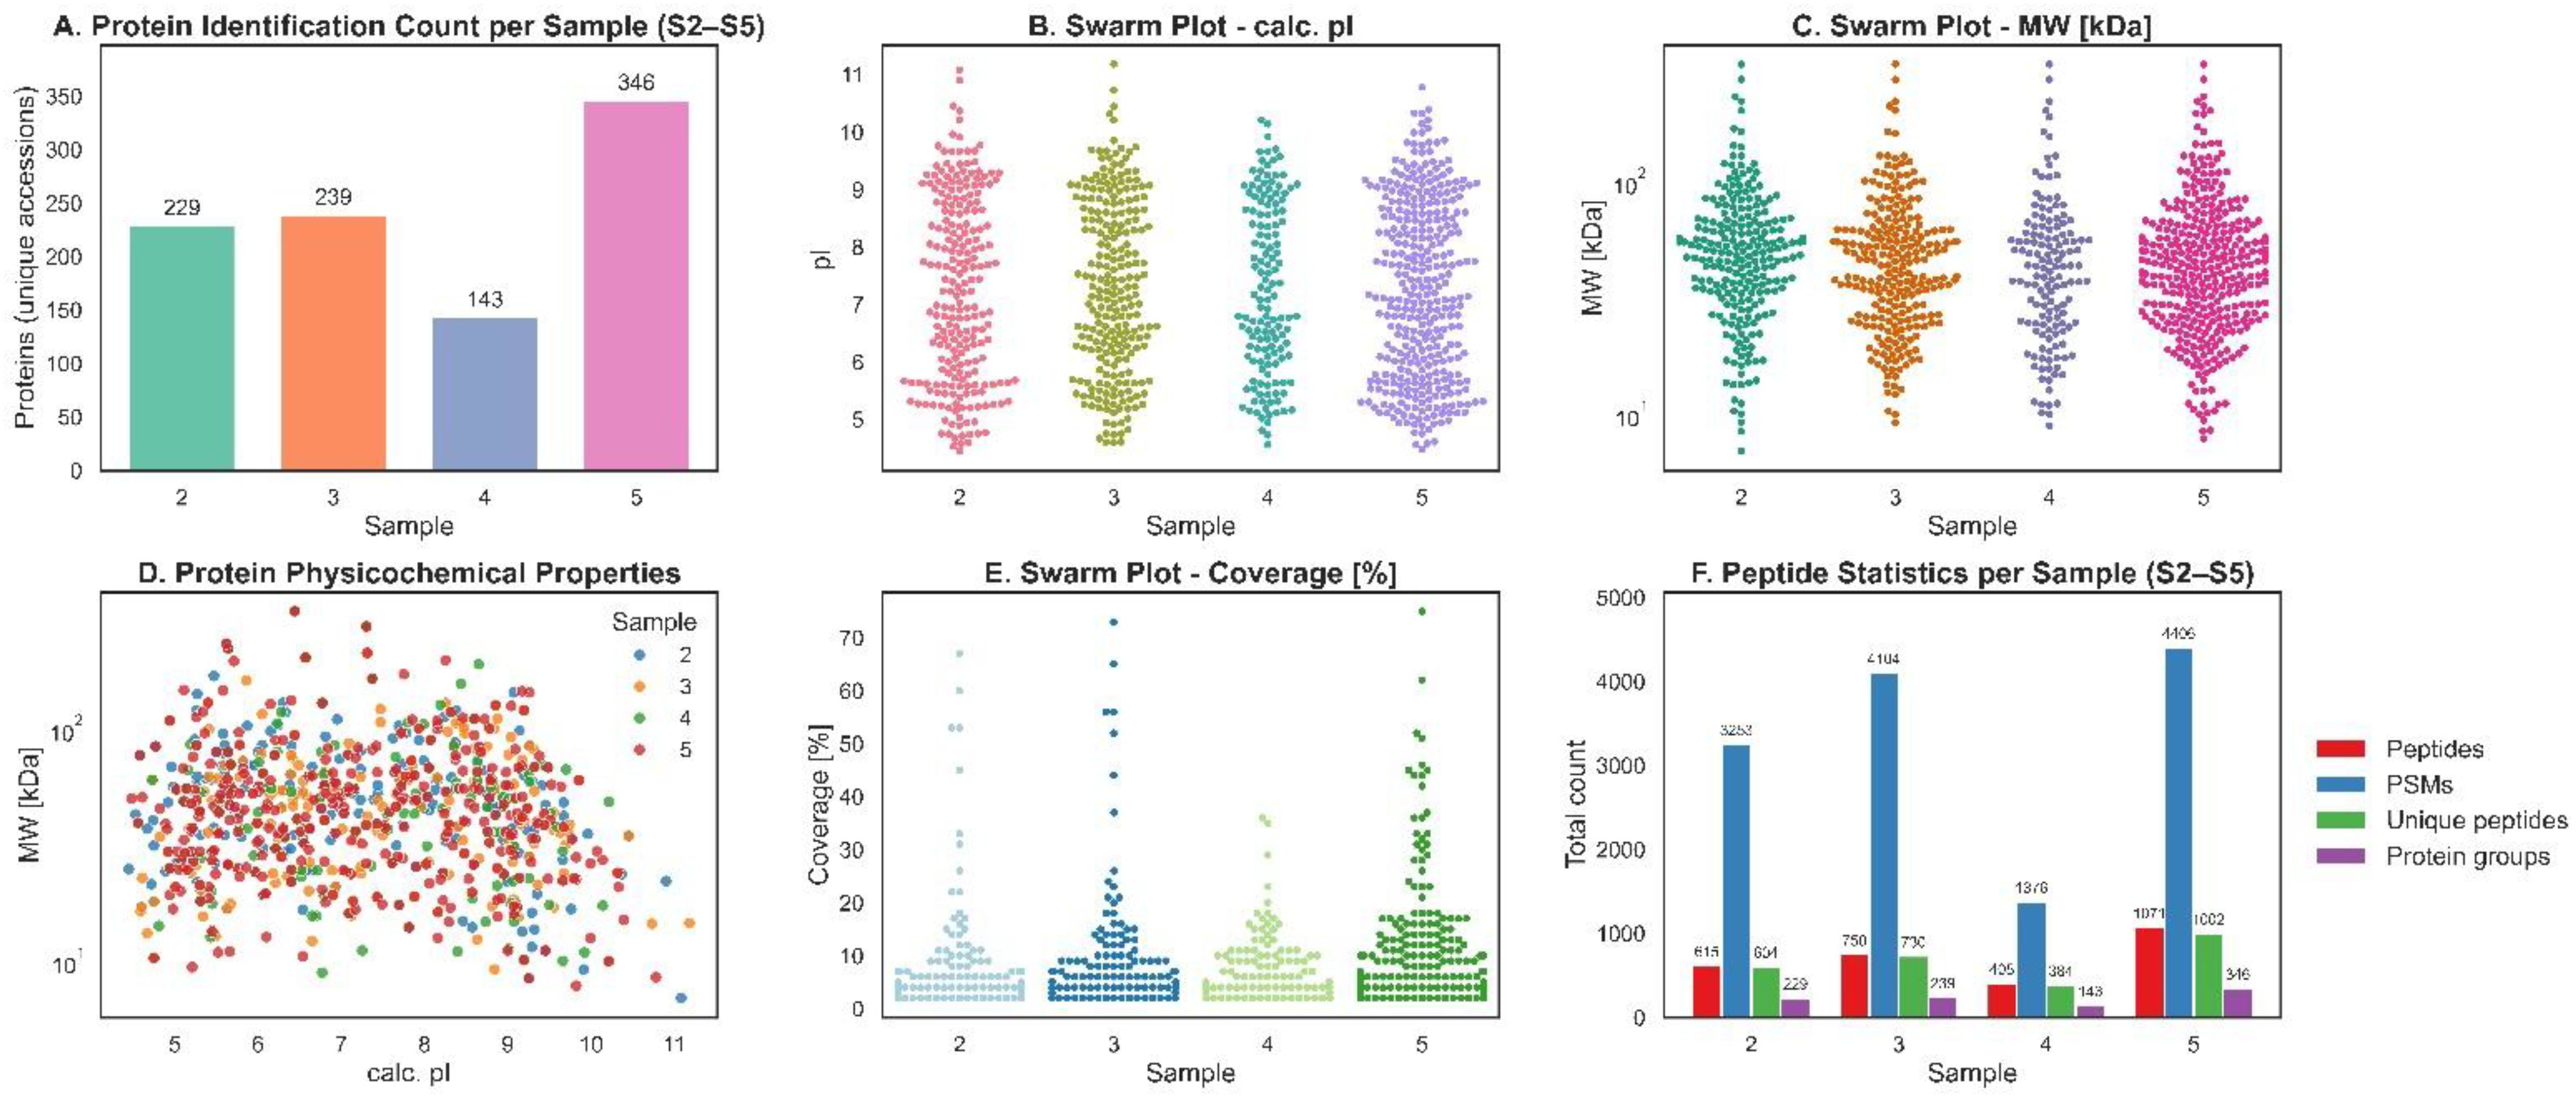
Figure 6. Sample-wise data distribution and the physicochemical properties of different developmental stages. (A) Number of proteins identified in each developmental stage (2–5). (B) Swarm plot showing distribution of calculated isoelectric points (pI). (C) Swarm plot of protein molecular weight (MW, kDa) distribution across stages. (D) Scatter plot of protein physicochemical properties (pI vs. MW). (E) Swarm plot showing percentage sequence coverage for proteins identified in each stage. (F) Peptide-level statistics per stage, including average counts of peptides, peptide-spectrum matches (PSMs), unique peptides, and protein groups.
3.5 Gene ontology and pathway analysis
STRING database analysis was performed on proteins across various developmental stages (Stage 2 to Stage 5). Among all chelicerate references, the spider Stegodyphus mimosarum consistently emerged as the top-matching organism, yielding the highest number of sequence hits across all stages. Specifically, Stage 2 returned 181 sequences, Stage 3 had 193, Stage 4 included 113, and Stage 5 showed the most extensive annotation with 286 sequences aligned to S. mimosarum. Other species such as Ixodes scapularis and Tropilaelaps mercedesae followed in match frequency but remained consistently lower than S. mimosarum.
In terms of annotation categories, as shown in Figure 7, stage 5 had the most robust enrichment, with hits in nearly all categories - particularly GO Biological Process, KEGG, Pfam, InterPro, and STRING clusters - reflecting a broader and functionally richer proteome. Significantly, stage 2 revealed significant enrichment across Gene Ontology categories too, with the exception of the KEGG pathway. Stage 4 displayed minimal enrichment, with no hits found under Pfam, and low counts in GO Cellular Function and GO Cellular Component. Functional enrichment was largely restricted to a few GO Biological Process entries. Stage 3 showed modest improvement, with the inclusion of GO Cellular Components and modest counts in GO Processes, but KEGG pathways and STRING clusters remained very low. To understand how biological functions change across different developmental stages, we performed Gene Ontology (GO) enrichment analysis as shown in Figure 8.
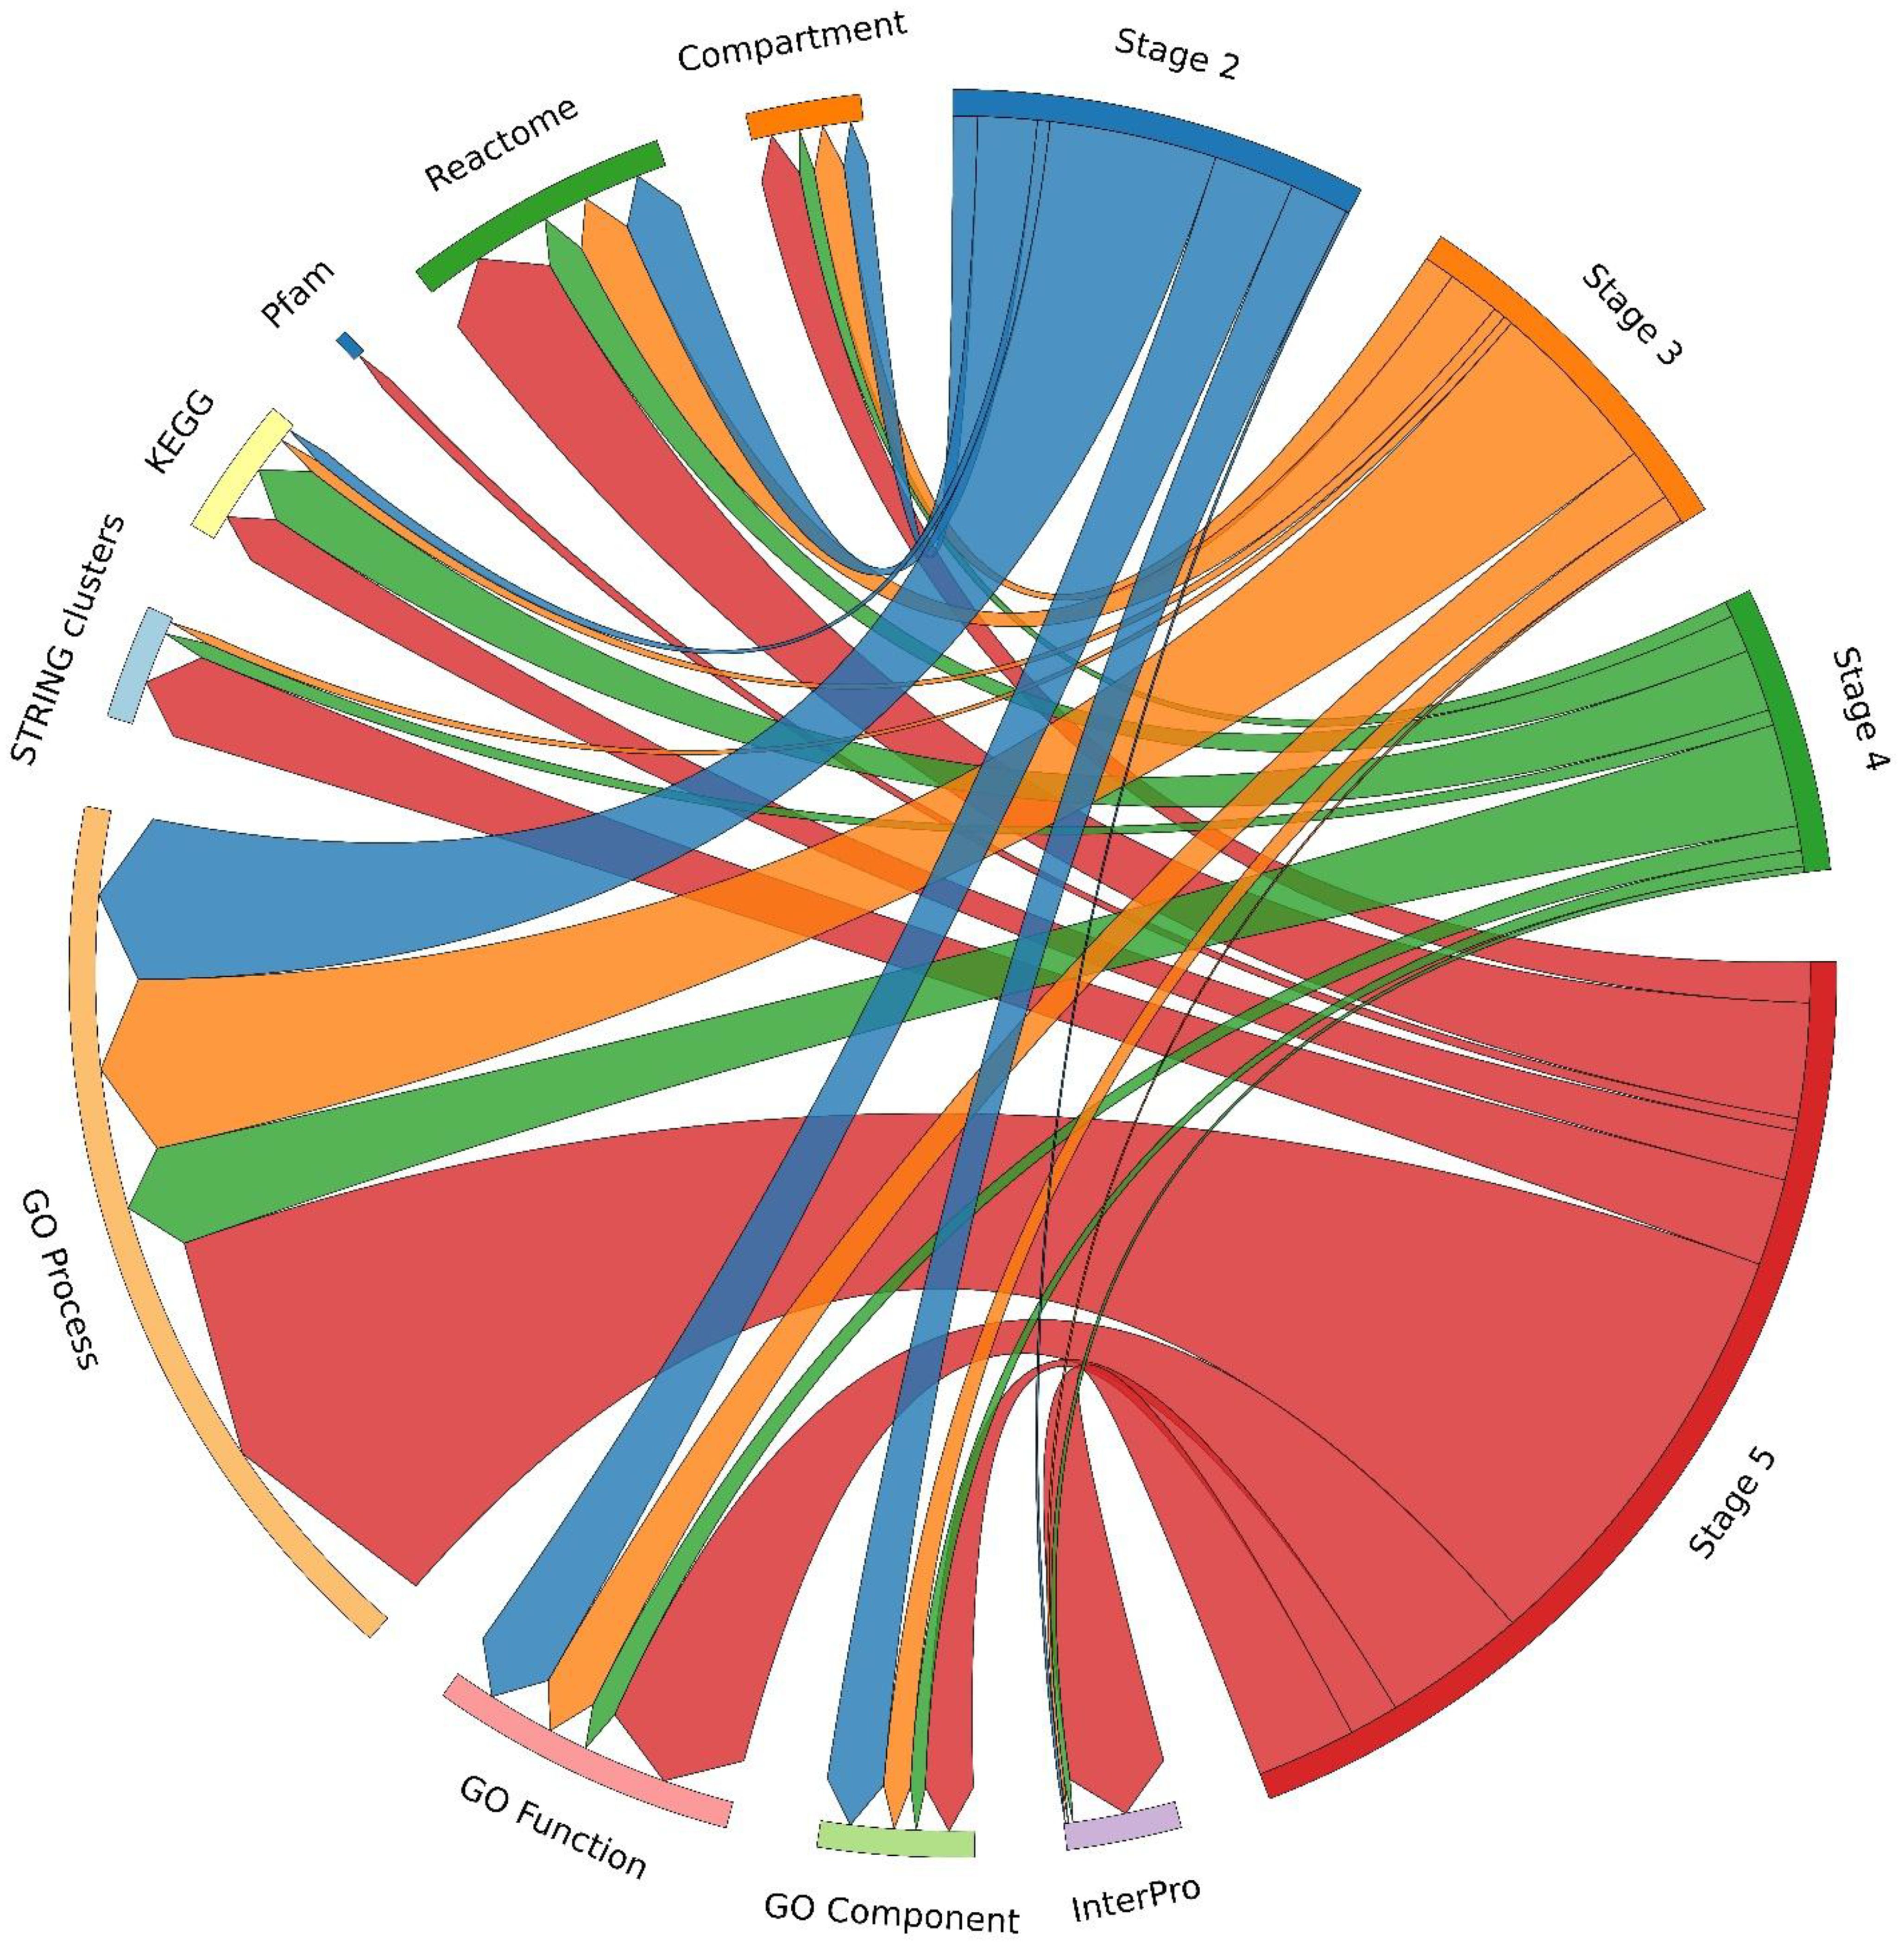
Figure 7. Circos plot of STRING term distribution across samples. Circos plot illustrating the distribution and overlap of STRING functional terms among the different developmental stages (S2-S5).
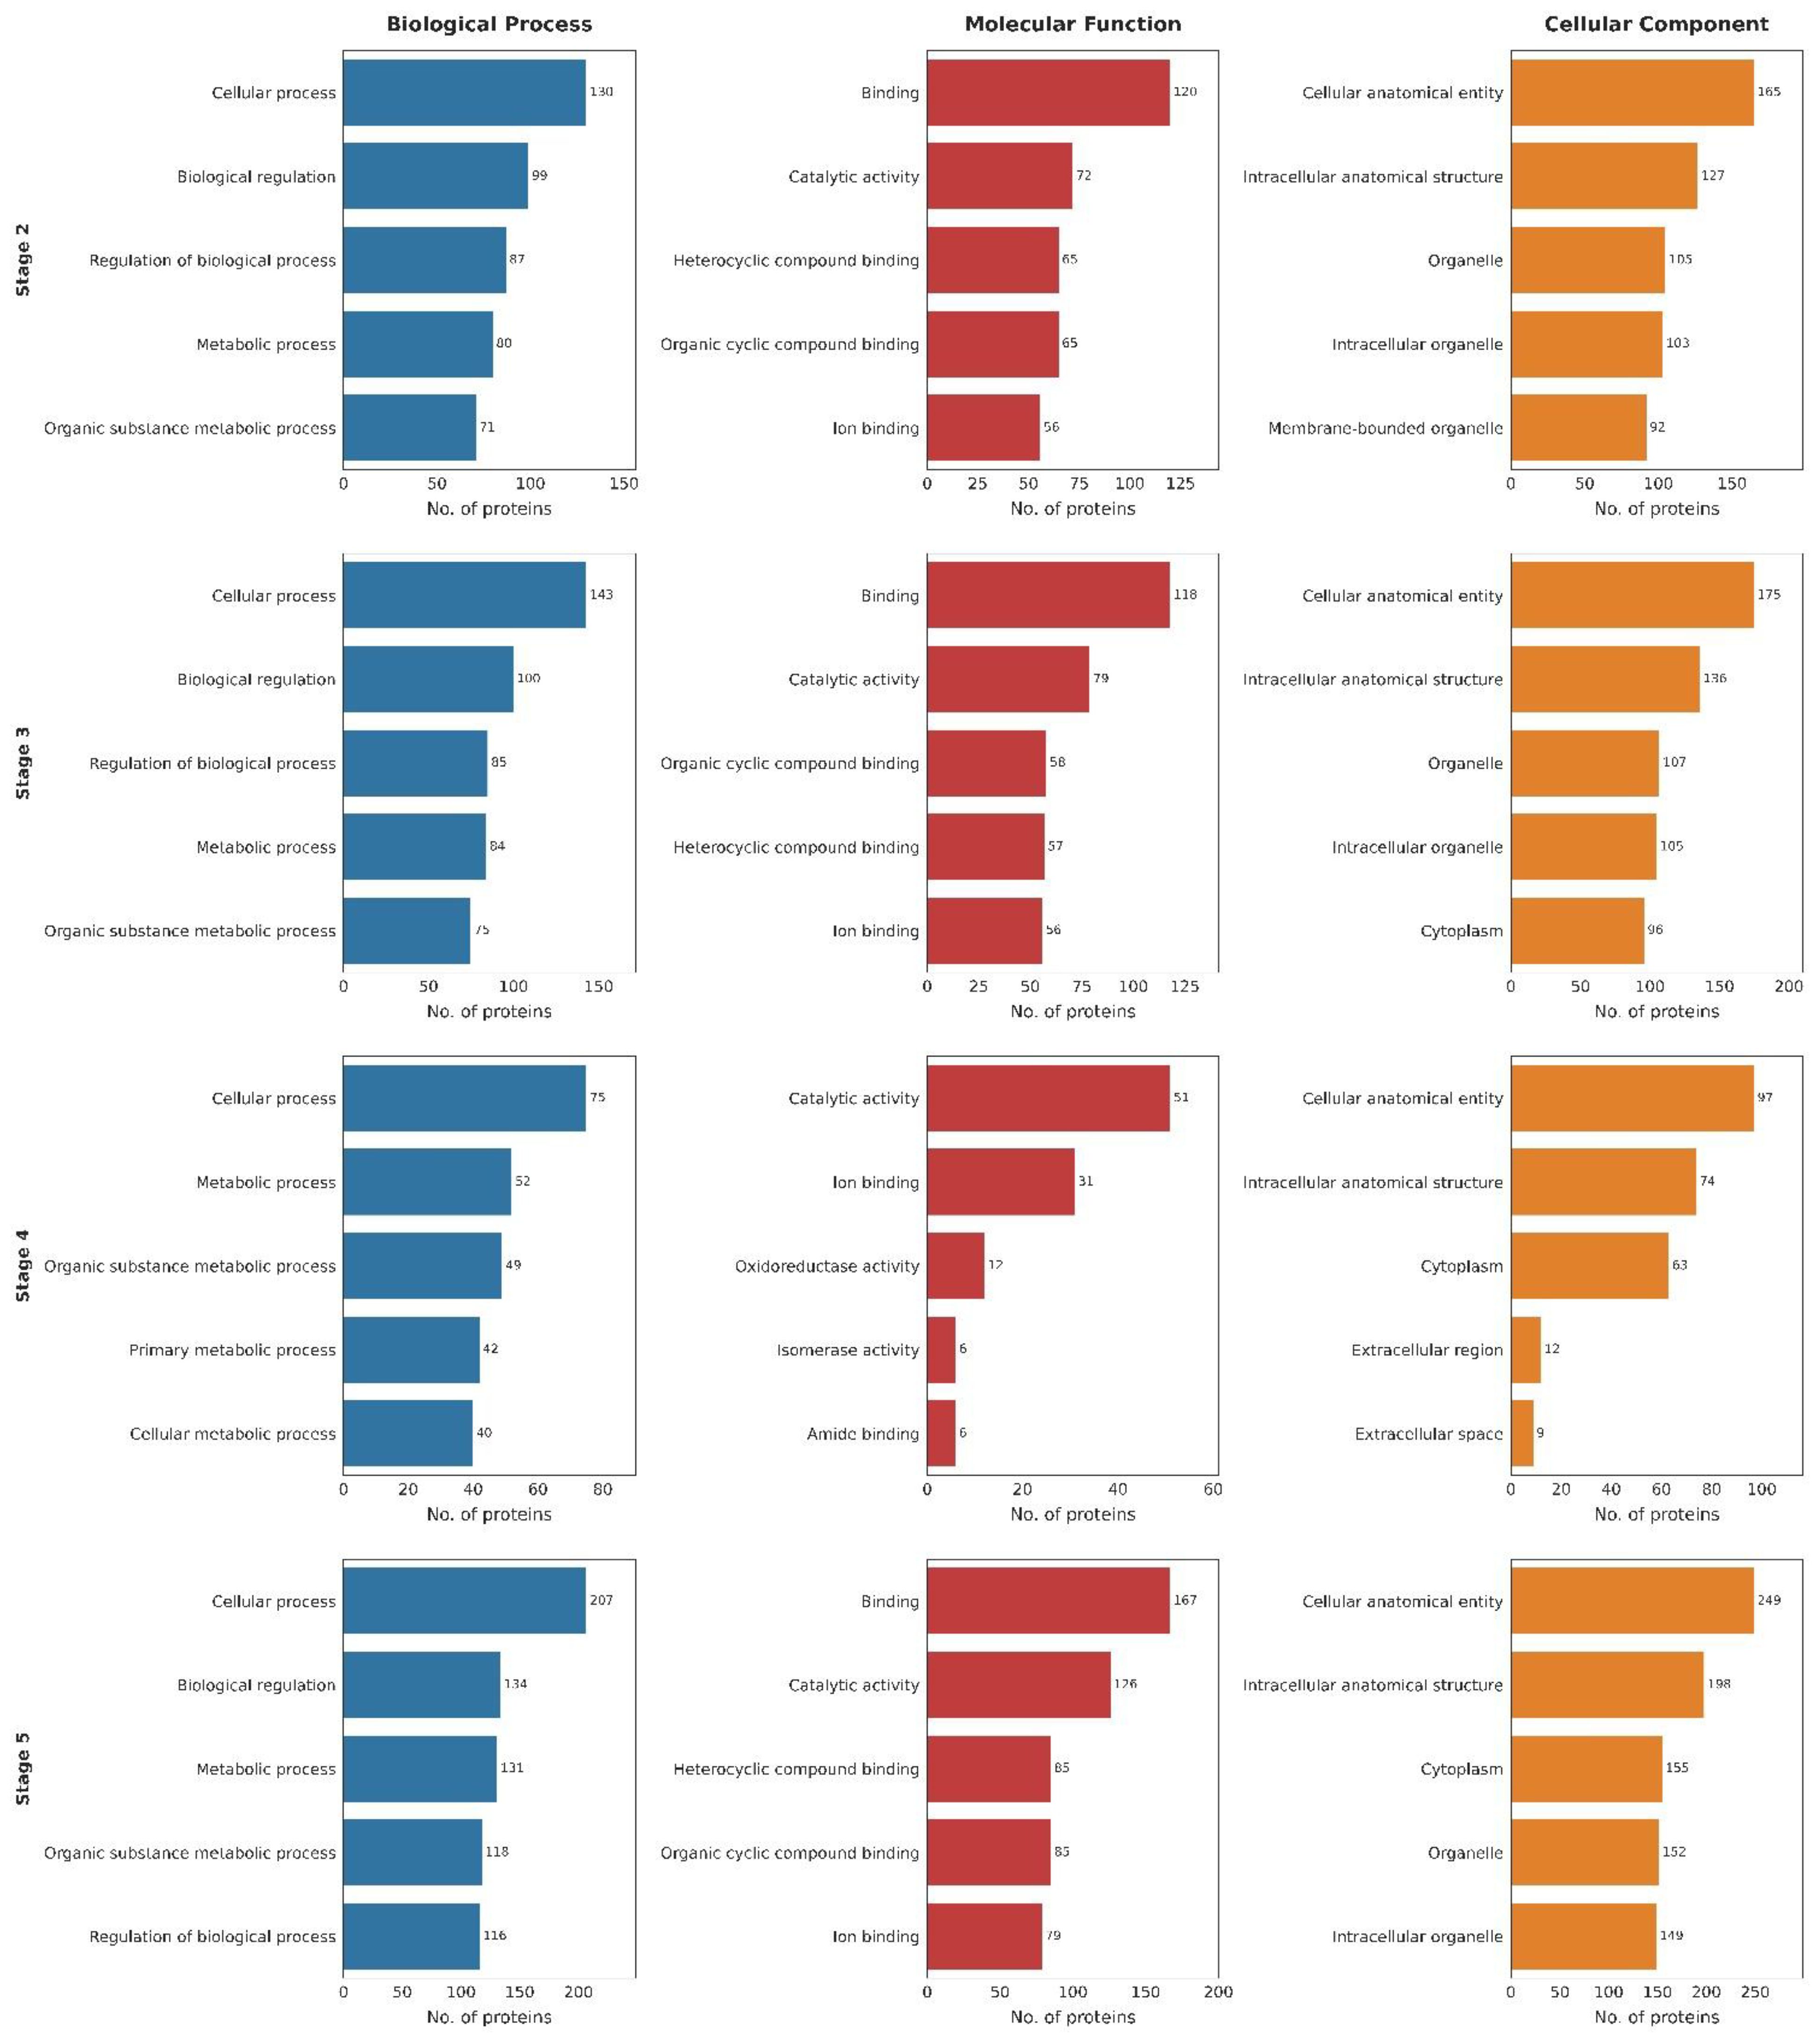
Figure 8. Gene ontology (GO) analysis of identified proteins across developmental stages (S2–S5). GO analysis summarizing the distribution of proteins into Biological Process, Molecular Function, and Cellular Component categories. The bar plot indicates the number of proteins associated with each category for stages 2, 3, 4, and 5.
The enriched GO terms were grouped into three main categories: Biological Process, Molecular Function, and Cellular Component. Our analysis revealed clear, stage-specific differences in the biological roles and processes active at each stage. In stage 2, most of the proteins expressed were responsible for the regulation of various biological processes. Specifically, 130 proteins participated in response to cellular processes, 99 in biological regulation, and 87 in regulation of biological processes, showing the initiation of the regulatory system needed for development. Metabolic processes were also prominent, with 80 proteins in metabolic process, 71 in organic substance metabolic process, and 58 in nitrogen compound metabolic process, indicative of an increased metabolic turnover, an important step for early proliferation and synthesis of biomolecules. The GO terms for molecular function were largely enriched in binding (120 proteins), followed by catalytic activity (72), cyclic organic compound binding (65), and heterocyclic compound binding (65). Specific molecular interactions such as protein binding (54) and nucleotide binding (34) suggest active transcriptional regulation. Regarding cellular components, proteins were primarily assigned to cellular anatomical entity (165 proteins), intracellular anatomical structure (127), and organelle (105), with 103 proteins associated with membrane-bound organelles, likely indicating early formation of mitochondria, nucleus, and other such structures. Together, these results suggest initiation of early core metabolic pathways and the onset of organelle biogenesis.
Stage 3 was characterized by an increase in the number and diversity of biological processes. 143 proteins were associated with cellular processes, 100 with biological regulation, and 85 with regulation of biological processes, indicating development beyond the basic regulatory systems of stage 2. Additional enrichment was seen in metabolic process (84), organic substance metabolic process (75), and cellular component organization or biogenesis (50). The appearance of the organonitrogen compound metabolic process (49) shows the synthesis of complex biomolecules. GO terms for molecular function again showed enrichment with respect to binding (118 proteins) and catalytic activity (79), but more refined categories such as heterocyclic compound binding (57), ion binding (56), anion binding (33), and carbohydrate derivative binding (32) emerged, signaling a shift towards increased transcriptional activity and protein-protein interactions. Protein localization remained centered around cellular anatomical entity (175 proteins), intracellular anatomical structure (136), and organelle (107), with 105 proteins in intracellular organelles and 96 in cytoplasm, highlighting increased molecular transport and internal organization. These observations suggest that stage 3 represents a key developmental shift as compared to stage 2.
In Stage 4, there was a significant reduction in protein counts across several core biological processes. 75 proteins were associated with cellular processes, 52 with metabolic processes, and 49 with organic substance metabolic processes, marking a stage of metabolic adjustment. The emergence of catabolic process (17 proteins) and carboxylic acid metabolic process (16) indicates possible breakdown or recycling of biomolecules. Primary metabolic process (42 proteins) and nitrogen compound metabolic process (37) were still active, suggesting previous stage metabolic functions were retained. GO enrichment for molecular function shifted away from broad binding categories and towards more enzymatic roles, with catalytic activity (51 proteins) and ion binding (31) still evident. Additionally, specific activities like oxidoreductase activity (12), amide binding (6), isomerase activity (6), and Vitamin binding (5) suggest highly specialized biochemical capacities. The presence of fatty-acyl-CoA binding (3) and L-aspartate 2-oxoglutarate aminotransferase activity (3) points to more diversified metabolic roles. Cellular localization again focused on cellular anatomical entity (97 proteins) and intracellular anatomical structure (74), with significant representation in cytoplasm (63 proteins). The appearance of extracellular region (12) and extracellular space (9) suggests secretion or involvement of extracellular matrix during this phase.
Stage 5, which is the most distinctive and pronounced in terms of the proteomic profile, highlights a shift towards a system with advanced specialization and functional integration. 207 proteins were associated with cellular processes, 134 with biological regulation, 131 with metabolic processes, and 118 with organic substance metabolic processes. Regulatory elements were also observed with 116 proteins in regulation of biological processes and 95 in nitrogen compound metabolic process, while 78 proteins participated in organonitrogen compound metabolism. Notably, 76 proteins were associated with response to stimulus, marking cellular readiness for environmental adaptation. The GO terms for molecular function were again enriched with respect to binding (167 proteins), but also included catalytic activity (126), heterocyclic compound binding (85), protein binding (72), and hydrolase activity (48) - suggesting active metabolic processing and cellular remodeling. Nucleotide binding (46) and anion binding (47) further confirm transcriptional activity. Localization remained compartmentalized with cellular anatomical entity (249 proteins), intracellular anatomical structure (198), cytoplasm (155), organelle (152), and intracellular organelle (149), reflecting spatially organized biological activity. The diversity and depth are pointers to stage 5 being the most functionally complex stage among the early stages, potentially reaching tissue-level organization, with active transcription, regulation, and stress-response mechanisms integrated into the cellular systems.
A comprehensive reactome pathway enrichment analysis across the four developmental stages (S2 to S5) revealed clear temporal shifts in biological priorities, as shown in Figure 9. Reactome pathway analysis revealed that the differentially expressed proteins across the four stages were associated with a wide range of biological processes. In stage 2, enrichment was observed in metabolism (41 genes), signal transduction (32), hemostasis (14), regulation of insulin-like growth factor (IGF) transport (9), post-translational protein phosphorylation (9), the citric acid (TCA) cycle and respiratory electron transport (9), amoebocyte degranulation (8), response to elevated amoebocyte cytosolic Ca²+ (8), and alternative complement activation (3). In stage 3, we found that the most representative pathways included metabolism (37), signal transduction (32), metabolism of proteins (30), immune system (29), innate immune system (25), post-translational protein modification (24), amoebocyte degranulation (18), sensory perception (9), visual phototransduction (8), and detoxification of reactive oxygen species (4). Stage 4 was earmarked by enriched pathways comprising metabolism (34), immune system (23), innate immune system (19), neutrophil degranulation (15), metabolism of carbohydrates (14), glucose metabolism (8), gluconeogenesis (7), regulation of insulin-like growth factor (IGF) transport (5), glycolysis (4), and aspartate and asparagine metabolism (3). In stage 5, we observed the highest representation in metabolism (68), immune system (52), innate immune system (40), neutrophil degranulation (35), metabolism of carbohydrates (21), amoebocyte degranulation (15), response to elevated amoebocyte cytosolic Ca²+ (15), glucose metabolism (10), gluconeogenesis (9) and glycolysis (8).
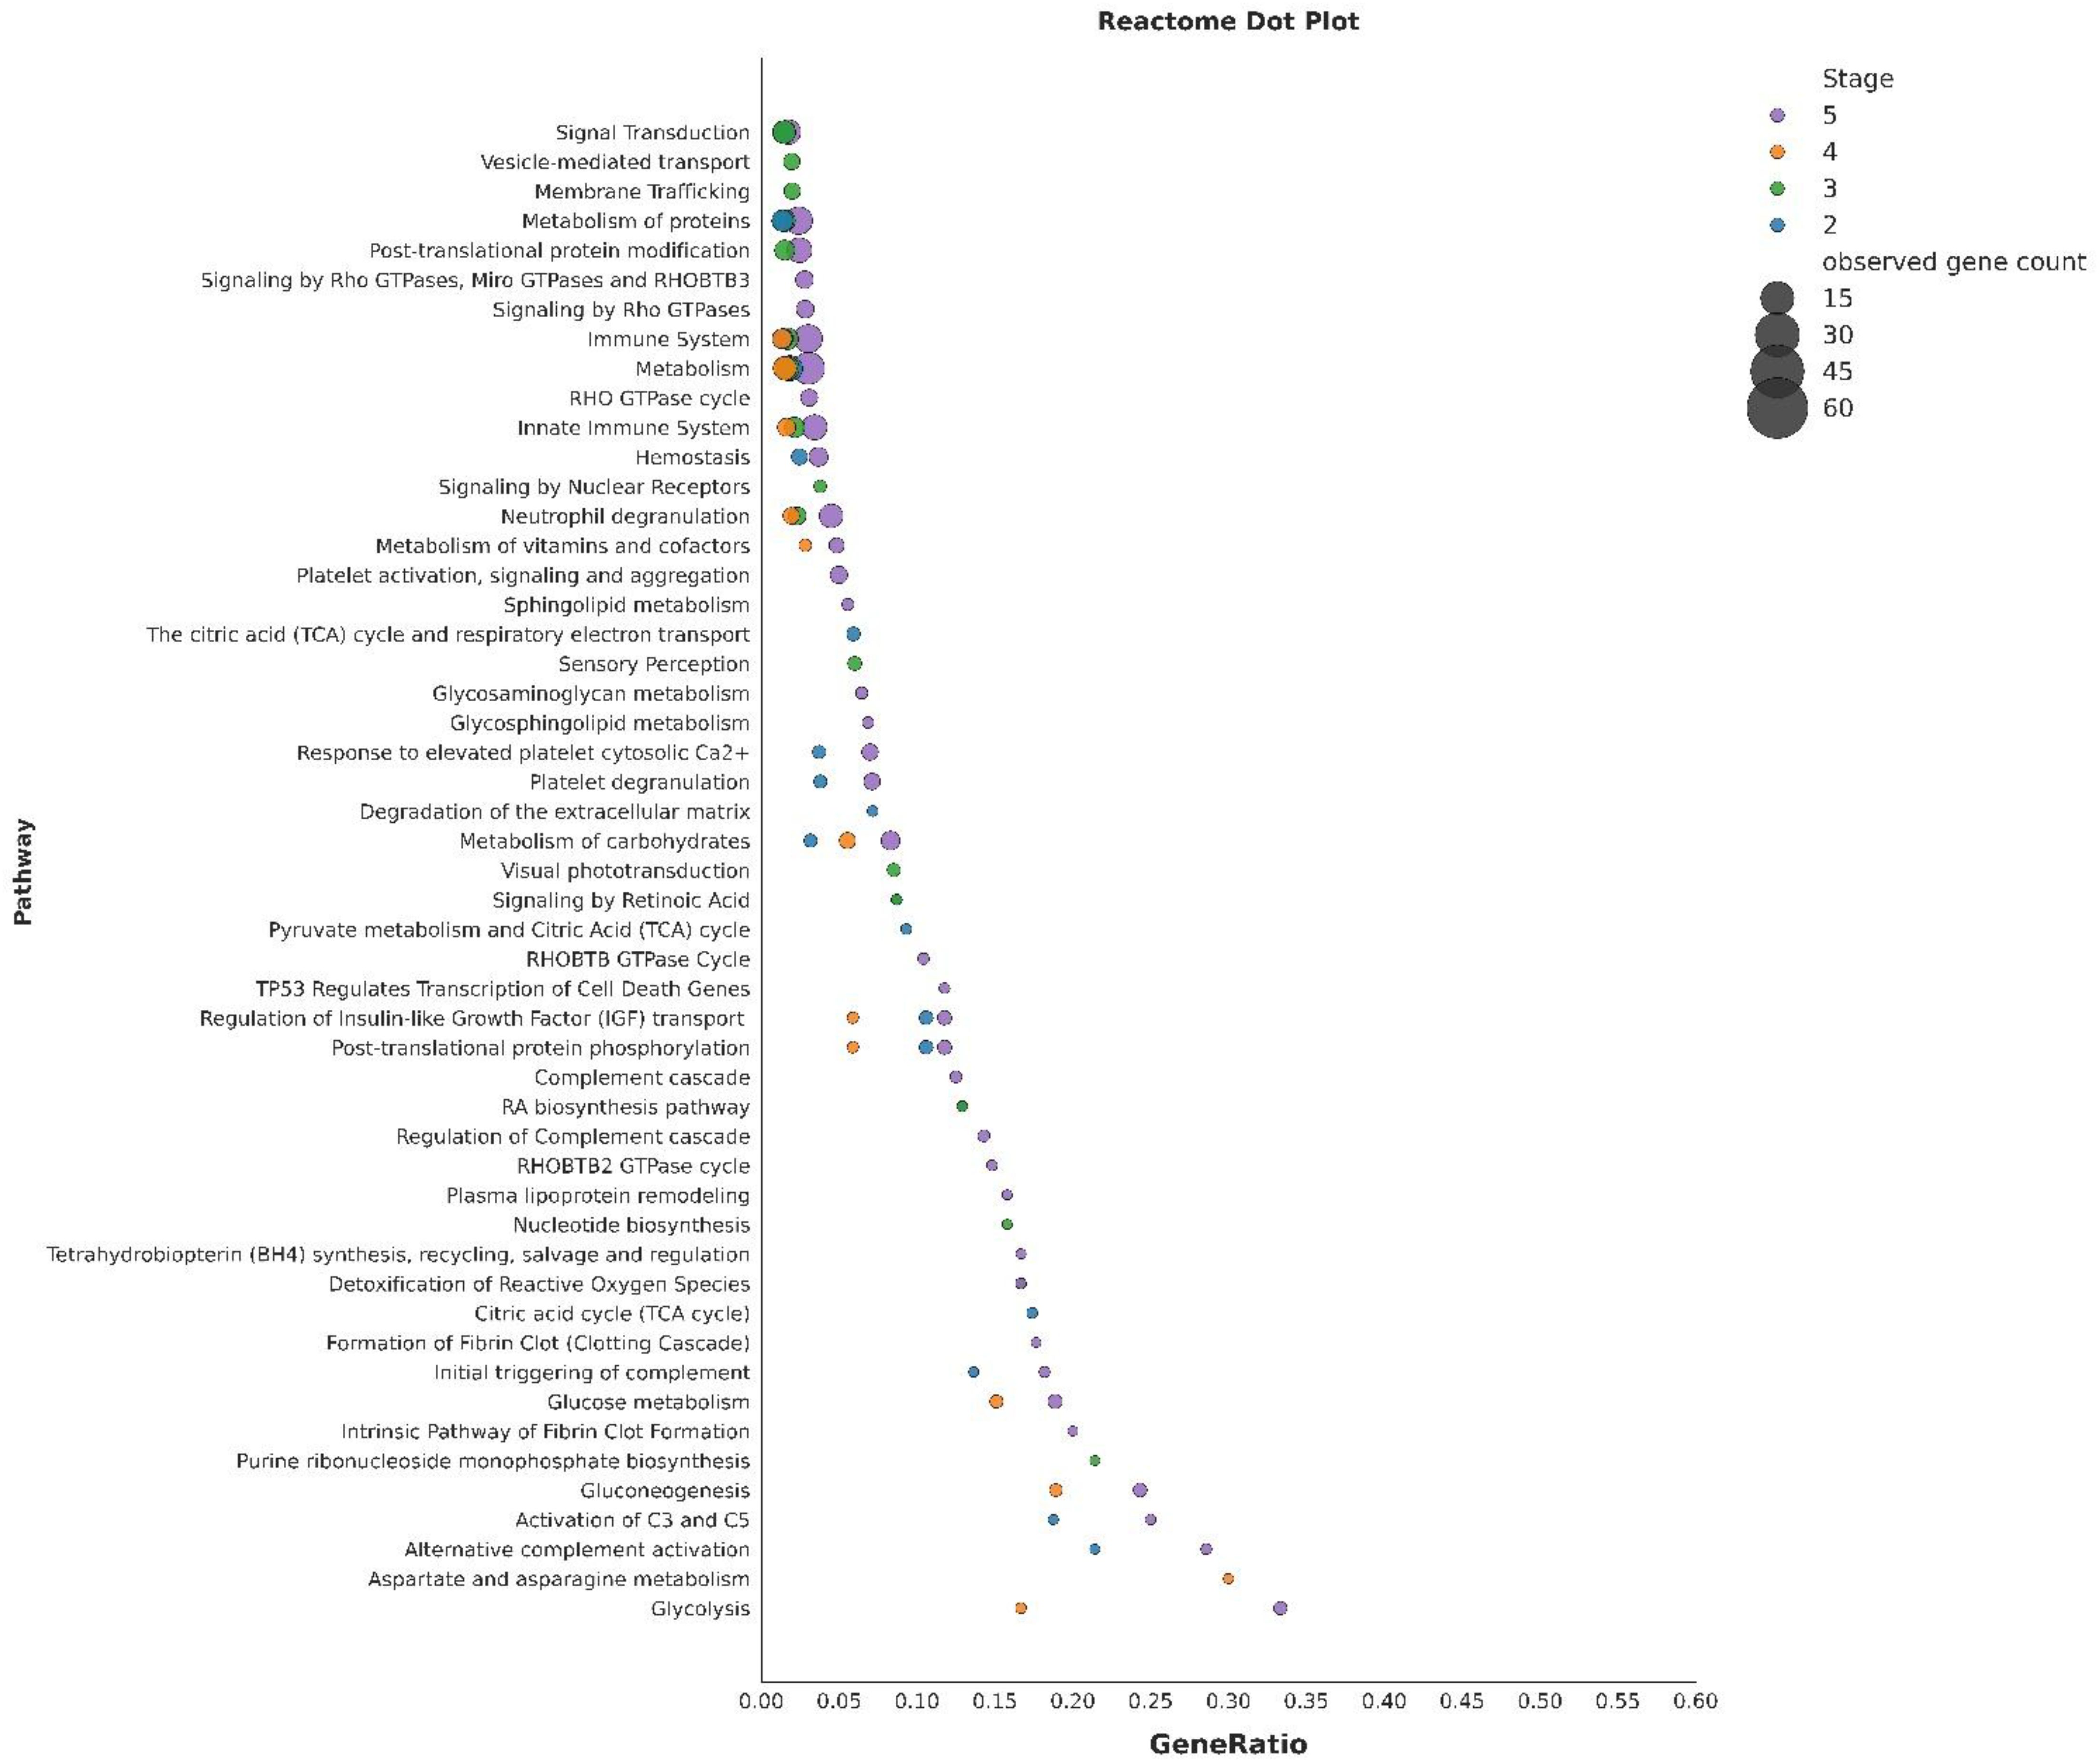
Figure 9. Reactome pathway enrichment across developmental stages of Tachypleus gigas. Enriched Reactome pathways identified using STRING for stages 2, 3, 4 and 5. Pathways are plotted with respect to the gene ratio.
3.6 Protein-protein network
Protein-protein interaction (PPI) datasets for Stages 2, 3, 4, and 5 were obtained from the STRING database. For each stage, the full interaction list was retrieved without score-based filtering. To ensure inclusion of only reliable associations (higher confidence), the datasets were subsequently filtered using a combined score threshold of ≥ 0.7, corresponding to high-confidence interactions in STRING (Bozhilova et al., 2019). Post this filtration step, interaction networks were constructed and visualized for each stage. In these networks, each node represents a protein, and each edge represents a predicted or experimentally supported interaction as per the confidence threshold (≥ 0.7), as shown in Figure 10. For interpretation, only proteins with high connectivity (degree ≥4) were annotated in the plot, i.e., the proteins which had at least four interaction partners with potentially important roles in the network were represented. Initially, annotations were performed using the preferred names provided by STRING. These were later replaced with functional term descriptions, enabling a more protein-specific interpretation of the network. ATP synthase subunit alpha consistently displayed the highest connectivity across stages, followed by ribosomal and mitochondrial proteins, and histones. Stage-specific hubs included trans-aldolase and glycolytic enzymes in stage 4, and elongation factor 1-gamma and heat shock protein 83 in stage 5. Overall, the networks highlighted hubs of ATP synthase, ribosomal, and histone proteins, along with stage specific clusters related to metabolism and stress response.
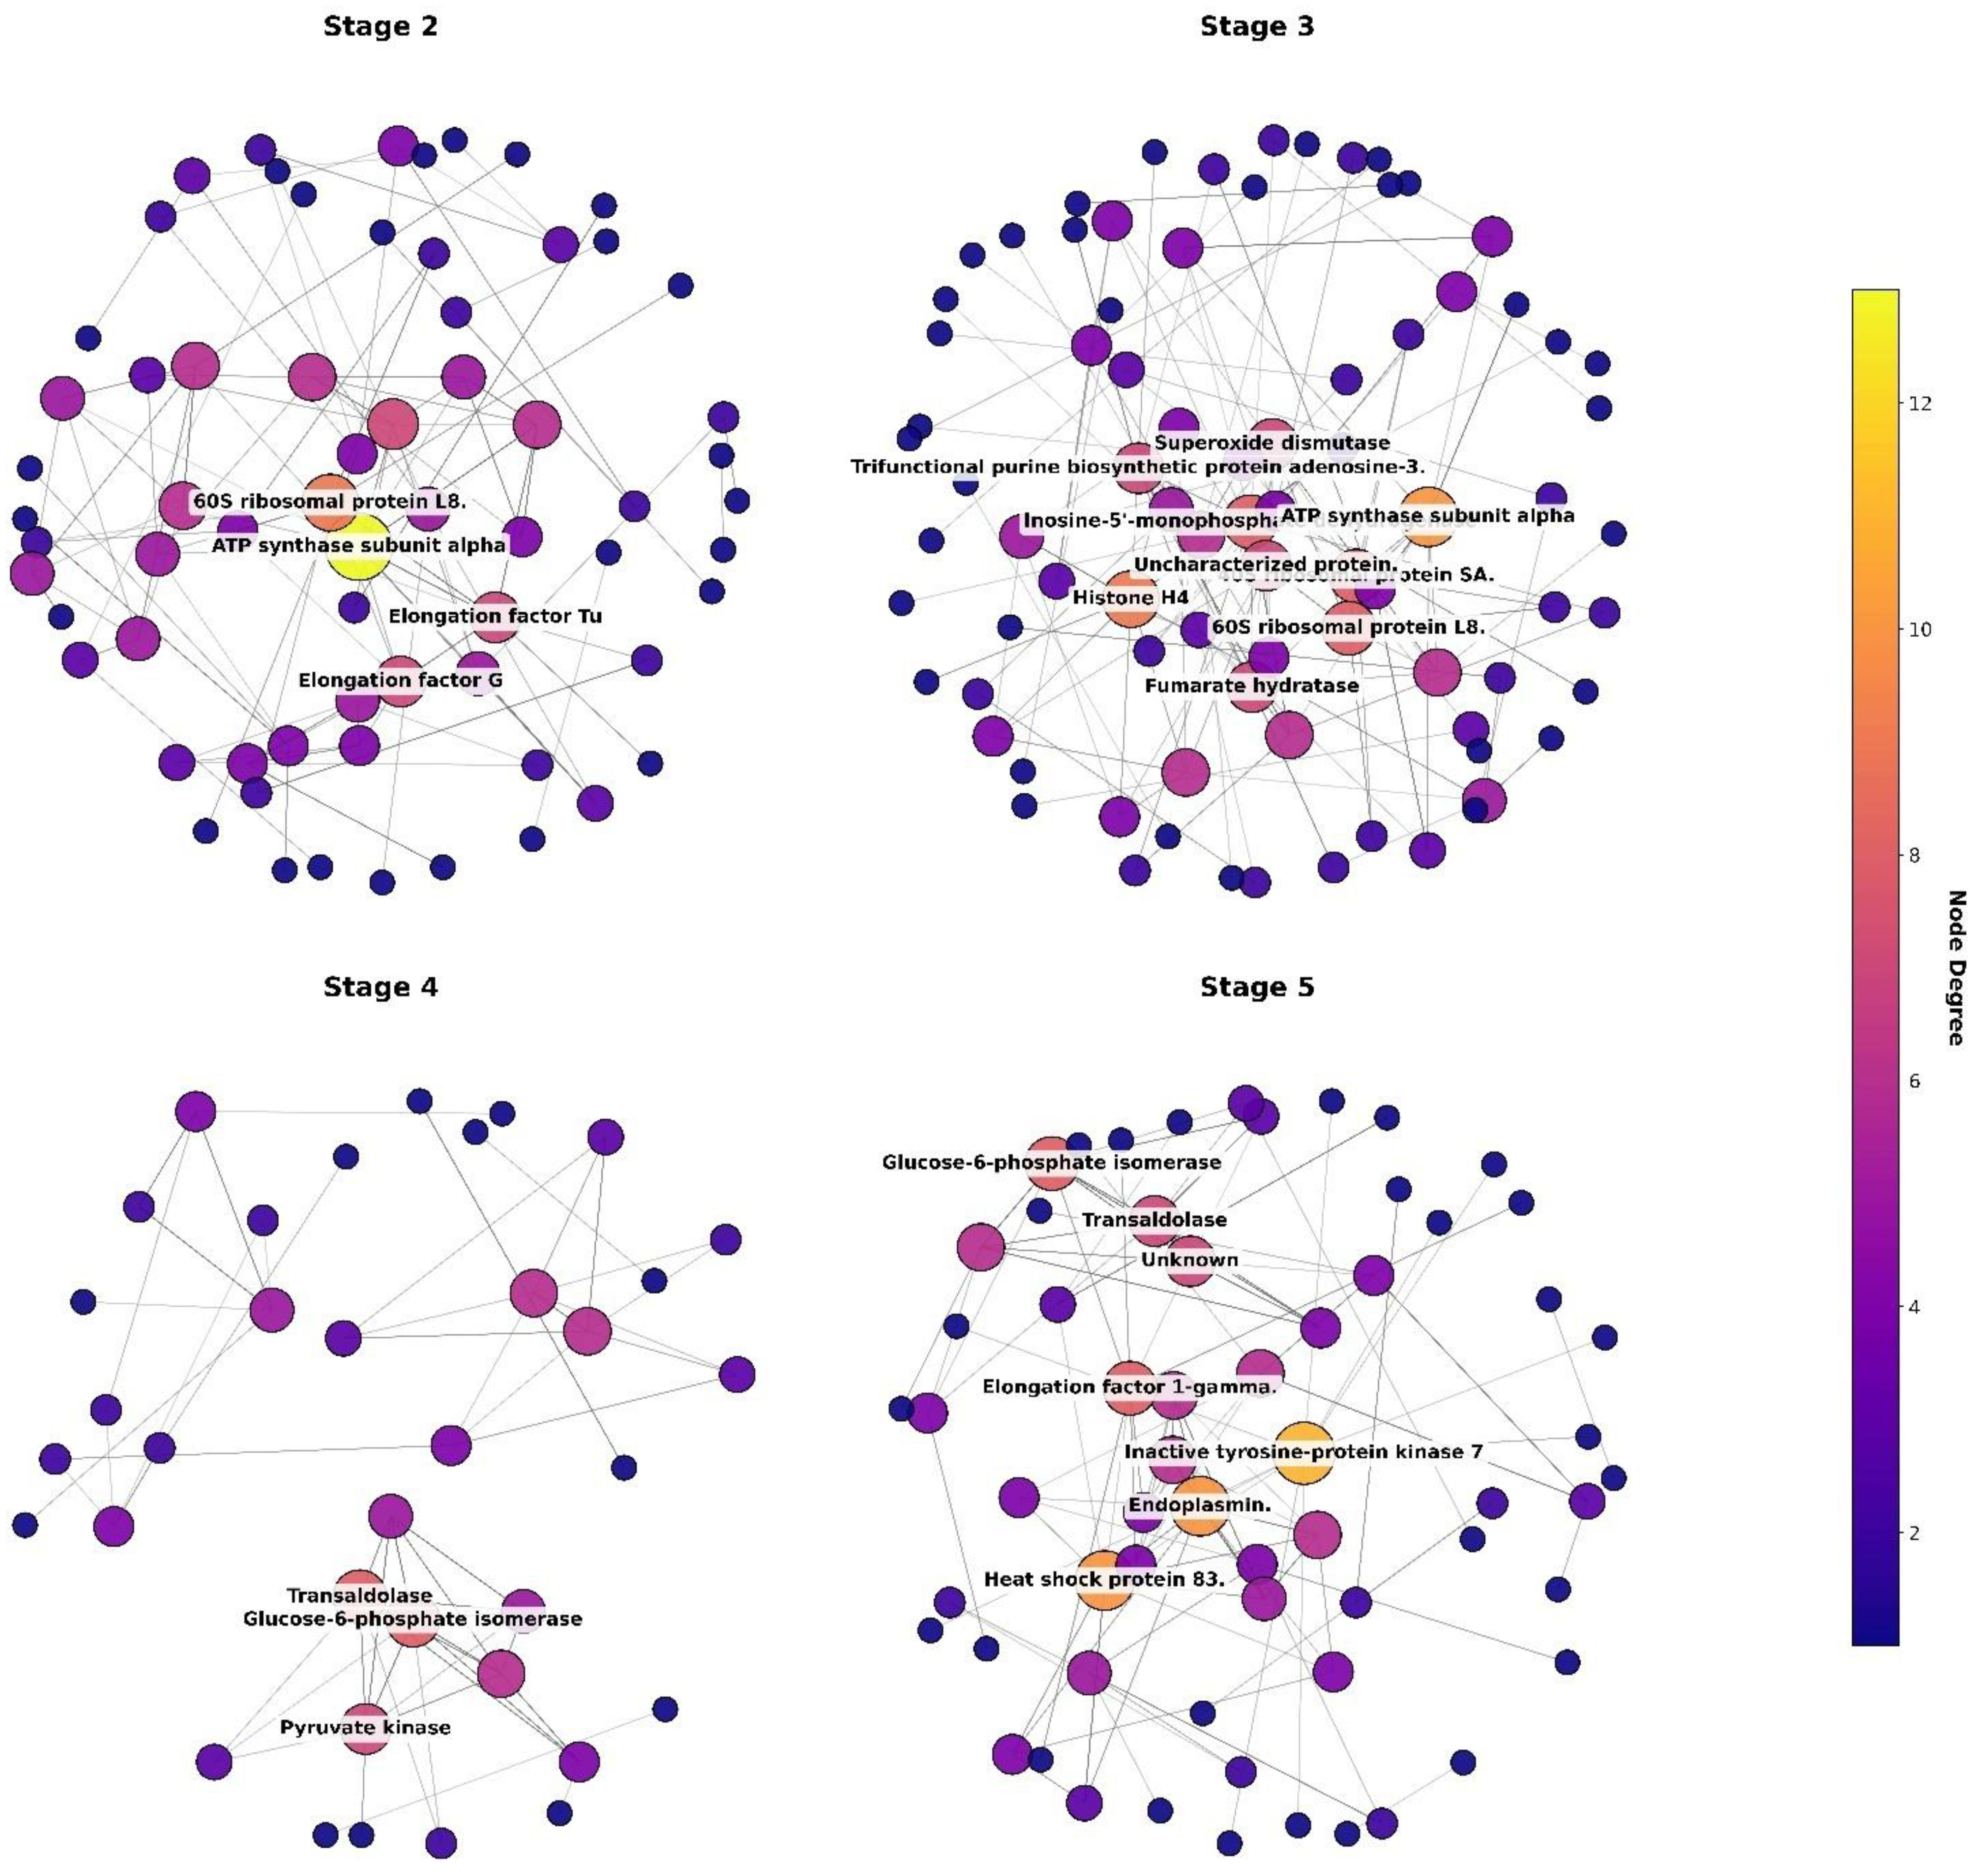
Figure 10. Protein-protein interaction (PPI) networks across developmental stages of T. gigas. STRING-based PPI networks for Stage 2, Stage 3, Stage 4, and Stage 5 showing variation in network density. In these networks, each node represents a protein, and the size of each node indicates the number of interaction partners it has, known as its “degree.” Larger nodes have more connections, meaning they interact with many other proteins. For clarity, only proteins with a degree of at least 4 (each protein has at least four interaction partners) are shown in the Figure. The highest node degree proteins only have been labelled for the sake of brevity.
4 Discussion
The early embryonic development of Tachypleus gigas is quite a complex process. The size of the egg and the rich yolk content (Kendrick et al., 2021) are factors which make it difficult to visualize the internal embryo, though there are significant visible changes on the surface. The morphological changes across developmental stages have been characterized in L. polyphemus (Botton et al., 2010; Farley, 2010; Kendrick et al., 2021), but has been totally missing for the T. gigas. At the molecular level however, the early stages remain largely unexplored, and there have been no reports of the egg proteome from any of the extant species till date. This study presents the first comprehensive proteomic analysis of the initial developmental stages of T. gigas (infact, across all horseshoe crab species), providing a molecular perspective to correlate the observable morphological transformations with dynamic shifts in protein expression and function. The work integrates staging, proteomics analysis, gene ontology (GO), reactome pathway analysis, and protein-protein interaction (PPI) networks to reveal distinct, stage-specific functional mechanisms that are undertaken during early development (SF3).
The initial stages as visible under the indigenously designed continuous monitoring system documented a clear progression of development, from the greenish, furrowed appearance of the early egg to a more complex, granular surface, concordant with the previous observations from other species (Sekiguchi, 1988; Itow and Sekiguchi, 1980). Although egg morphology varies among different species of horseshoe crabs, the development seems to follow a similar pattern. The time span of the stages however, were not identical, and showed variation from species to species. This variation may have been compounded by the shift to an artificial incubation system as well.
Samples were collected sequentially from stage 2 till stage 5. Stage 1 was difficult to distinguish due to its transient nature and the unavoidable pause in sample processing due to the time elapsed between collection of eggs and incubation. Protein abundance does not always correlate with messenger RNA (mRNA) levels, a discrepancy that underscores the profound impact of post-transcriptional, translational, and post-translational regulation (Zhan et al., 2016). Thus, the elucidation of the proteome provides a window to look for the molecular logic of development, beyond the scope of the genome and underlining the expression of proteins at the cellular stage. The total number of identified proteins and their concentrations generally increased from stage 2 to stage 5, with stage 5 exhibiting the highest proteomic complexity and protein concentration. This change is likely associated with the synthesis of a diverse group of proteins required for cell division, differentiation, and morphogenesis. It was interesting to observe the dip in the number of proteins identified in stage 4. This stage might be a key transitional phase where the embryo recycles the raw materials to build new proteins for the next steps, similar to the development seen in other arthropod eggs like the Drosophila (Farrell and O'Farrell, 2014). Later in stage 5, there is a significant surge in the variety and amount of proteins, suggesting the embryo to have started expression of genes leading to the production of its own unique proteins. This protein production happens at the same time of gastrulation, which is an intense period when cells move around to form the fundamental layers of the developing embryo.
Results from the Gene Ontology (GO) analysis revealed significant differences in the expressed proteins with respect to the stages as well. The earliest of the stages, S2, was enriched with proteins which were mostly responsible for the regulation of various processes, such as cellular processes (where 137 of them are involved), followed by proteins that were part of biological regulation and regulation of biological processes, pointing to the initiation of the regulatory system needed for development. Metabolic processes were also enriched, such as the organic substance metabolic process and the nitrogen compound metabolic process, indicative of an increased metabolic turnover, a crucial step in early proliferation and synthesis of various biomolecules. The surge in the profile of proteins involved in the biosynthetic pathway at this stage is a hallmark of early embryogenesis in other arthropods, where the primary task is the rapid proliferation of cells to form the blastoderm. Proteomic analysis of the Apis mellifera embryo reveals a “core proteome” that is present throughout all the embryonic stages and is fundamentally involved in protein synthesis and metabolic energy generation, highlighting the centrality of these processes (Fang et al., 2014). Moreover, the highly expressed cytoskeletal proteins, including microtubule-associated proteins and actin-related proteins, may play a role in promoting chromosome movement during mitosis (Zhai et al., 2008). While looking into the molecular function, most of the proteins were involved in binding – dominated by the ones involved in binding various biomolecules, further indicating high molecular interaction. Nucleotide binding and protein binding were two other categories which demonstrated the involvement of cells in transcriptional regulation. In stage 2, most of the proteins were found in cellular anatomical entities and intracellular anatomical structures. Proteins in membrane-bound organelles can be associated with further differentiation and early formation of organelles like mitochondria, nucleus and membrane-bound structures. All these together suggest early initiation of basic metabolism pathways and early formation of membrane-bound cellular organelles, akin to the lipid metabolism and genome organization and stability during early embryonic development in Drosophila sp (Li et al., 2014).
In stage 3, we observed an increase in the number and diversity of biological processes. Most of the proteins were involved in cellular processes, biological regulation, and metabolic activities, which indicates a shift from the basic regulatory system of stage 2 to a progressive developmental pathway. New categories such as cellular component organization and biogenesis, along with organonitrogen compound metabolic processes, suggest that cells are actively engaging in the synthesis of complex biomolecules. The emphasis on “cellular component organization and biogenesis” in the T. gigas proteome reflects the fundamental need for a rapidly dividing population of cells with the necessary structural and operational components. The same can be precisely observed in the developmental program of the fruit fly, Drosophila melanogaster. Proteomic analyses of its early embryogenesis (2–3 hours post-fertilization) reveal a high enrichment of proteins involved in cell cycle regulation and cytoskeleton organization (Casas-Vila et al., 2017). When examining molecular function, binding remains a major category, along with the emergence of more specific classes such as heterocyclic compound binding and anionic compound binding. These observations indicate that molecular interactions become more specific at stage 3, suggesting regulatory transcription, and protein-protein communication. Additional enrichment in carbohydrate derivative binding and purine ribonucleotide interactions points toward increased energy metabolism and nucleic acid-associated functions, highlighting a transcriptionally active stage. In terms of cellular localization, proteins were primarily mapped to cellular anatomical structures and intracellular compartments, and this stage also shows a higher concentration of proteins in the cytoplasm, indicating molecular transport within cells. All these features together suggest that stage 3 may represent a key developmental transition, where cells begin to specialize, organize their internal components, and prepare for advanced functional roles. The general sequence of appearance of basic elements (like ribosomal proteins and metabolic enzymes), followed by more complex processes (like signaling pathways) seem to have been deviated in many arthropods (ticks, honey bees, and fruit flies) where there is a significant overlap of these processes (Fang et al., 2014; Casas-Vila et al., 2017; Ojeda-García et al., 2021). The early embryo does not wait to finish one task before initiating another. Likewise, in the T. gigas proteome, there is an increase in the synthesis of essential components for metabolism and biogenesis along with the activation of specific regulatory pathways that shape development (Figure 11).
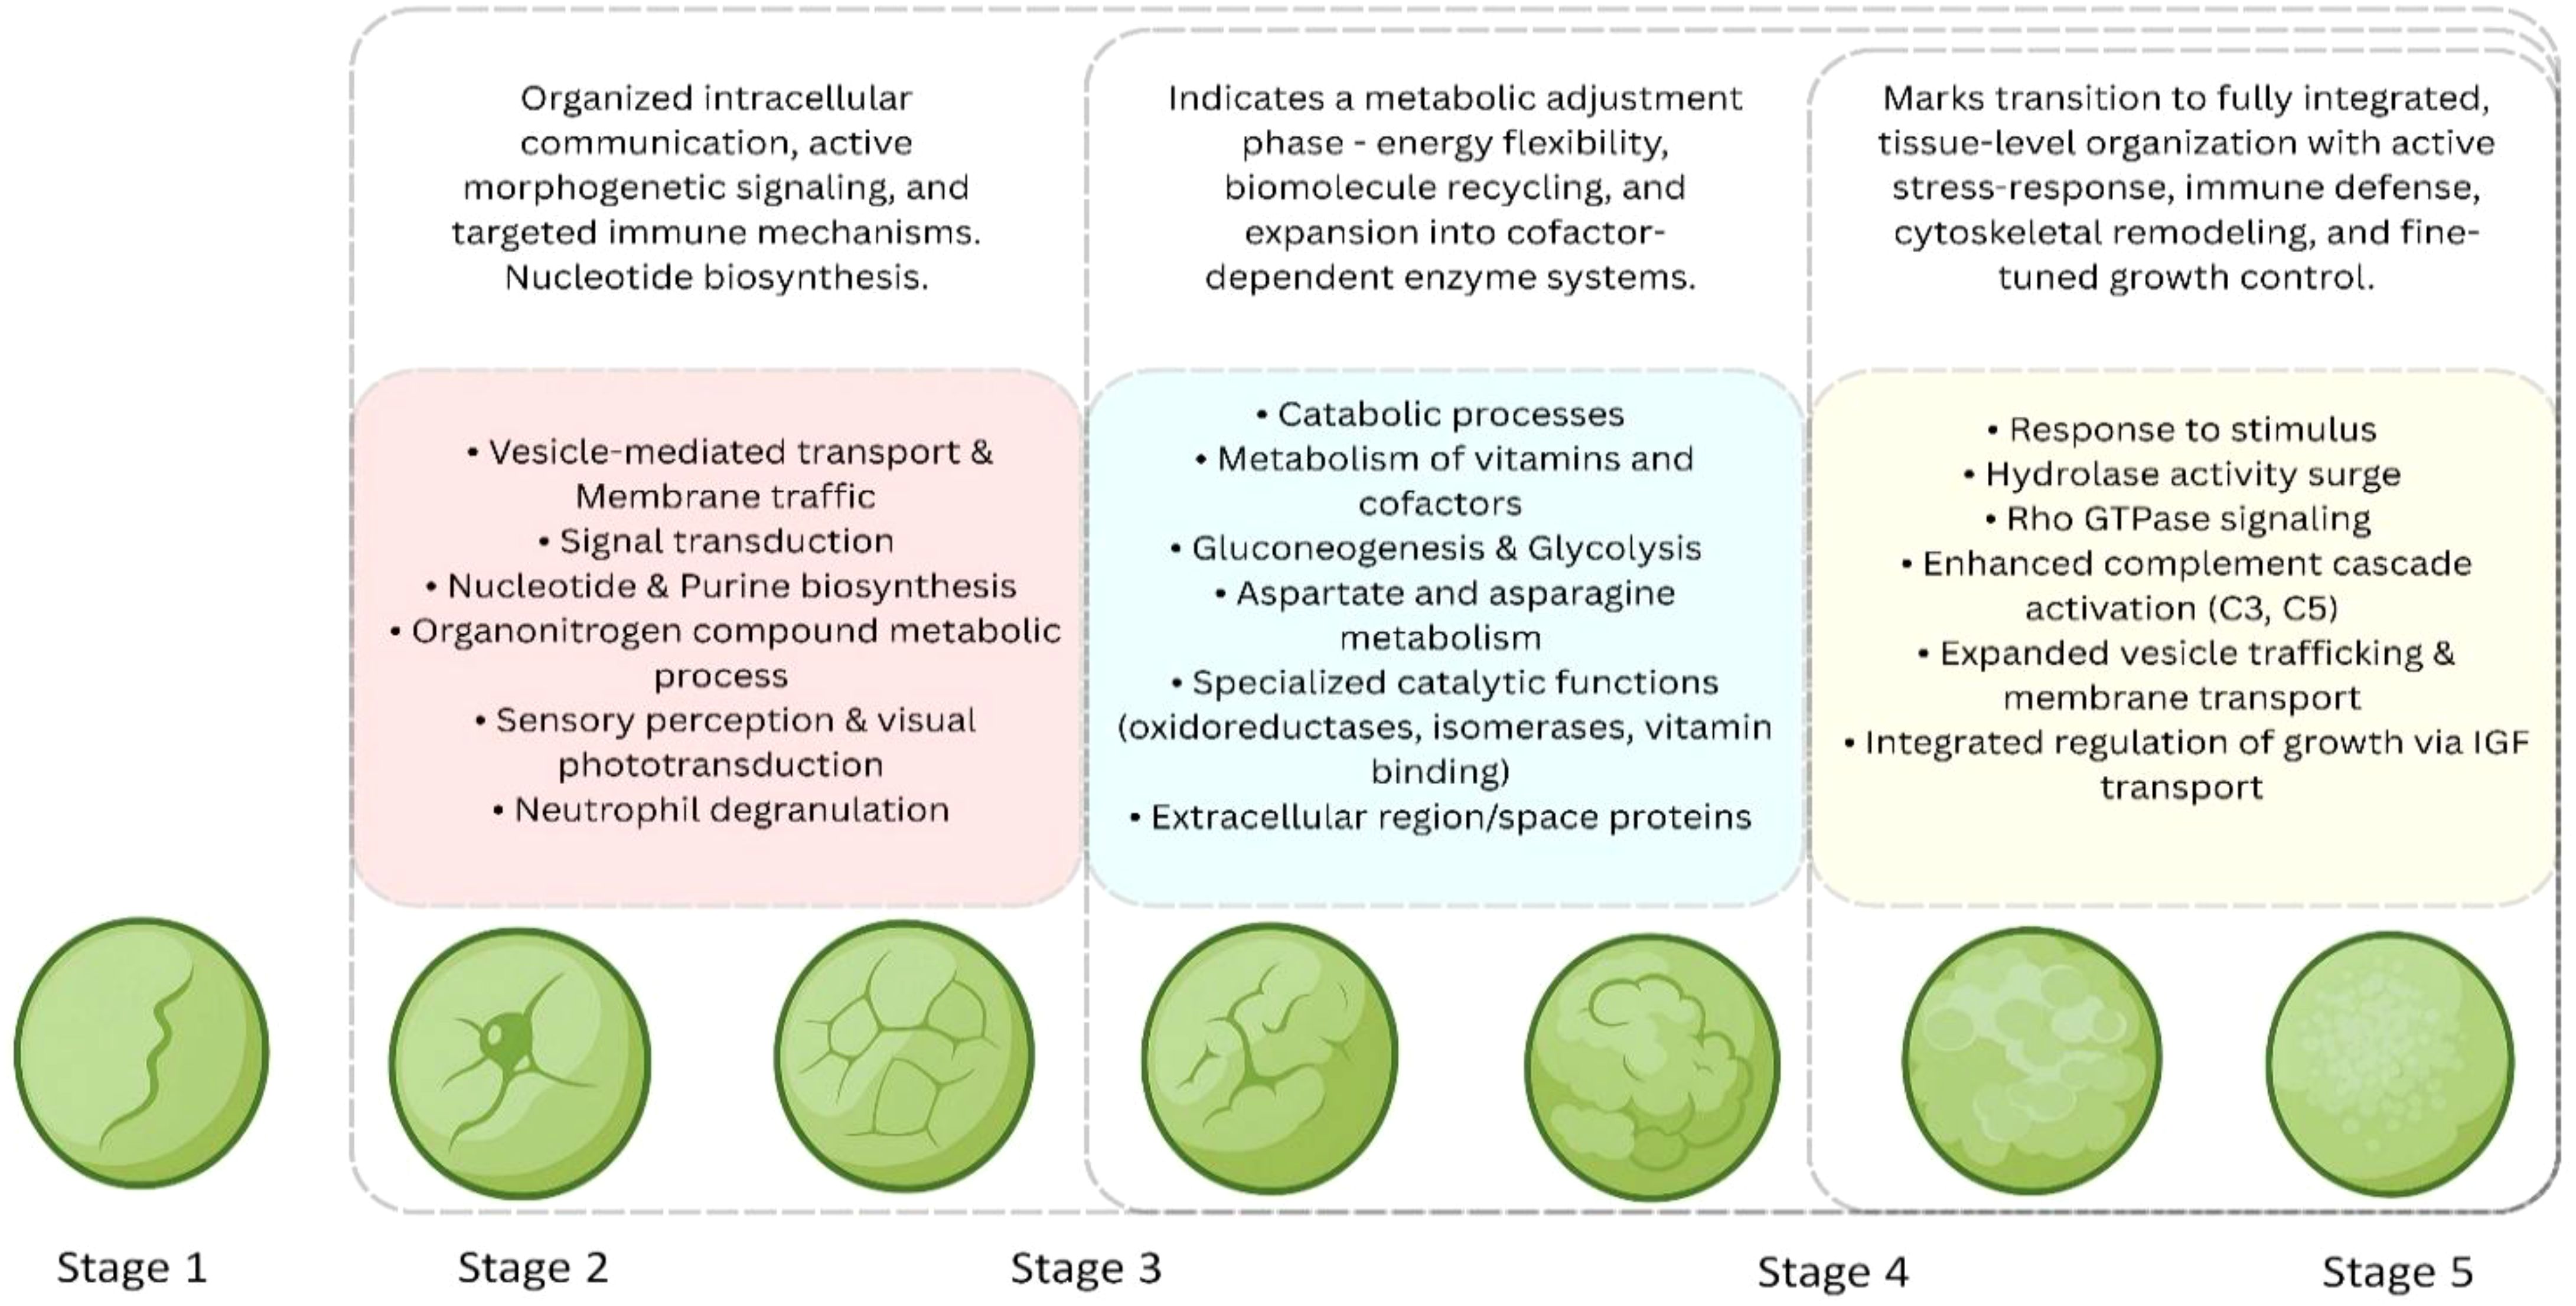
Figure 11. Summary of key biological processes and pathways associated with developmental stages S2-S5. The diagram highlights distinct and overlapping functional processes during development. stage-specific and shared pathways are grouped according to their biological categories from stage 2 to stage 5.
Stage 4, interestingly is associated with a noticeable decrease in the number of proteins associated with core biological processes. Although cellular processes and metabolic activities continued to be enriched, the number of proteins was reduced, showing a possible phase of metabolic adjustment. The appearance of proteins related to catabolic activity and carboxylic acid metabolism suggests the presence of degradative pathways that might be involved in breaking down or clearing excess biomolecules. The appearance of “catabolic activity” in the horseshoe crab proteome is a common process of yolk degradation, where stored egg nutrients are extensively used for energy during full embryo development – a process fundamental to the development in oviparous animals (Chino, 1958). The yolk, rich in proteins (vitellin), lipids, and carbohydrates, is not passively absorbed but is actively broken down by hydrolases. In crustaceans, which often rely heavily on lipid reserves, lipases play a parallel and critical role. In the freshwater prawn Macrobrachium rosenbergii, vitellogenin is not just a protein but a lipo-glyco-phosphoprotein, meaning its degradation releases a spectrum of nutrients (Roth et al., 2009). In the shrimp Macrobrachium borellii, the activity of cytosolic triacylglycerol lipase reaches its peak during stage 5 of embryogenesis, a period that coincides with active organogenesis, demonstrating a direct link between lipid mobilization and tissue construction (González-Baró et al., 2000). The stage 4 T. gigas embryo still has proteins that participate in primary metabolic and nitrogen compound metabolic activities, indicating that fundamental cellular processes remain active, but at a lower intensity. Looking at molecular function, there is a distinct shift from major binding functions in stage 3 toward a more refined enzymatic activity. Catalytic activity and ion binding are still observed; however, this stage includes more specialized roles like oxidoreductase activity, vitamin binding, and isomerase activity, suggesting that the cells are more specific in their biochemical capabilities. The emergence of specialized enzymes such as oxidoreductases signifies the maturation of complex biochemical pathways beyond basic metabolism. This is a conserved feature of early/mid embryogenesis, where the embryo begins to synthesize molecules essential for its structure and regulation (such as hormones and cuticle components). A transcriptome study of the brown planthopper, Nilaparvata lugens, provides a similar example. The stage corresponding to 96 hours after egg laying is defined by a unique transcriptomic signature that is significantly enriched for fatty-acyl-CoA reductase activity (Fan et al., 2020). The presence of unique enzymatic functions such as aminotransferase activity suggests that more specific metabolic roles may be emerging. For protein localization, cellular anatomical structures and intracellular compartments remain prominent, with an additional concentration in the cytoplasm. Appearance of proteins in the extracellular region and extracellular space shows an increase in secreted biomolecules or extracellular matrix-related components.
By stage 5, the proteomic profile indicates a highly specialized and more functional biological system. Most of the proteins were involved in essential biological processes such as cellular activities, biological regulation, and metabolism, showing an increase in overall functional enrichment. In addition, proteins associated with stress response and external stimulus regulation were also present, suggesting that the cells are now capable of adapting to and responding to external signals. Molecular function at this stage continues to be dominated by binding activities, but with the presence of catalytic activity, protein binding, hydrolase activity, and nucleotide interactions. These features reflect a dynamic cellular environment, probably with high levels of transcription, protein turnover, and metabolic processing. The increase in hydrolase and enzymatic interactions also suggests active regulation and remodeling within the cells. When looking into the cellular component, most of the proteins were localized to cellular anatomical structures, intracellular compartments, organelles, and cytoplasmic regions. This points to a highly compartmentalized and organized cellular environment, with diverse protein functions occurring in a spatially regulated manner across structures like mitochondria, endoplasmic reticulum, etc., similar to the cellularization observed during early stages of tick embryonic development (Santos et al., 2013). Stage 5 represents the most advanced stage with functional complexity and integration, where the system shows pointers to tissue-level specialization and is hypothetically actively engaged in regulatory and metabolic processes.
We also observed notable reactome pathways in our sample. In stage 2, the reactome profile shows a system undergoing basic physiological activity along with functional specialization. Representation of metabolism and metabolism of proteins suggests that the system is actively maintaining energy production and supporting protein synthesis. The enrichment of metabolism of carbohydrates, pyruvate metabolism, citric acid cycle, TCA cycle, and respiratory electron transport shows active ATP generation, which is essential for sustaining cellular function during early development. Similar to horseshoe crabs, energy metabolism is essential to supporting the molecular backbone needed for cell proliferation, differentiation, and embryonic growth in other arthropods as well. The catabolism of carbohydrates to provide the main source of energy for the developing embryo in the tick (Moraes et al., 2007) is one such example. Several regulatory and signaling pathways are also beginning to appear. Post-translational protein phosphorylation and regulation of insulin-like growth factor (IGF) transport shows the beginning of signaling networks that control growth and metabolic responses. These pathways suggest that even at this early stage, cells might be engaging in growth regulation. Degradation of the extracellular matrix shows early structural reorganization, possibly linked to tissue remodeling. Immune-related pathways also emerged – the enrichment of amoebocyte degranulation, response to elevated amoebocyte cytosolic Ca²+, initial triggering of complement, activation of C3, and alternative complement activation, suggesting innate immune processes or stress response mechanisms are expressed in this stage, a possible role in protection from early environmental perturbations. The early activation of the complement system and the degranulation of amoebocytes in early embryo may serve both as developmental signaling mechanisms and as a natural barrier against bacterial invasion or fungal colonization, since the growing embryo is exposed to infections in their natural environment. In C. rotundicauda, for example, amoebocyte granules degranulate when stimulated by endotoxin (LPS), indicating that a rapid immune response system is already present in the immune cells (amoebocytes) of adult horseshoe crabs (Sarmiento et al., 2022). In Xenopus laevis, complement component genes are expressed during early patterning and organogenesis, suggesting roles beyond host defense, such as in cell localization, migration, or apoptosis during embryogenesis (McLin et al., 2008). In spider embryos, the early detection of antimicrobial proteins suggests a protective function against microbes. Proteins are often present before environmental exposure, possibly due to maternal deposition or zygotic expression of defenses (Czerwonka et al., 2021). In Drosophila, Toll pathway components act as developmental morphogens in early embryos, helping to establish the dorsal-ventral axis, while the same pathway later functions in immune signaling (Lindsay and Wasserman, 2014), establishing the role of early defense mechanisms in arthropod eggs.
Stage 3 shows a shift in the identified pathways, reflecting increased functional complexity. The most prominent shift is the emergence of signal transduction, vesicle-mediated transport, membrane trafficking, and post-translational protein modification, all of which are essential for intracellular communication and protein regulation (González-Gaitán, 2003). Metabolic processes remain active, as seen through continued enrichment in metabolism and metabolism of proteins. However, stage 3 introduces more specialized roles with the presence of immune system proteins and innate immune system pathways. These pathways show a shift from the basic immune pathway in stage 2 to a more organized immune program capable of detecting and responding to cellular stress or pathogens. The enrichment of neutrophil degranulation further supports this immune activation, while signaling by nuclear receptor, signaling by retinoic acid (RA), and retinoic acid biosynthesis pathway point to developmental signaling mechanisms, most probably involved in morphogenesis, tissue identity, or differentiation. Surprisingly, sensory perception and visual phototransduction also emerge in this stage, suggesting that certain cells or tissues might be responsive to external sensory inputs. The appearance of nucleotide biosynthesis and purine ribonucleoside monophosphate biosynthesis indicates increased transcriptional activity and DNA/RNA synthesis, further showing high rates of proliferation or differentiation.
Stage 4 reveals hallmarks of processes with deeper functional integration, where core metabolism, immune function, and nutrient signaling are all strongly represented. The continued enrichment of immune system and neutrophil degranulation suggests an established and active immune system, likely supporting tissue maintenance and protection. The presence of metabolism and metabolism of carbohydrates confirms that energy production remains critical. New additions such as metabolism of vitamins and cofactors suggest that the cells are expanding their biochemical selection to support specialized enzymatic reactions. Enrichment of glucose metabolism, gluconeogenesis, and glycolysis shows energy management, where cells can shift between energy storage and consumption based on internal needs. The persistence of post-translational protein phosphorylation and regulation of IGF transport highlights the importance of signaling and protein-level control in this stage. Finally, the enrichment of aspartate and asparagine metabolism reflects active amino acid metabolism, which may support both biosynthetic needs and nitrogen balance. These pathways are often upregulated in proliferative systems and support the production of nucleotides and other essential biomolecules.
The reactome enrichment profile at stage 5 is distinguished by highly enriched pathways across diverse biological categories, indicative of a system that is not only metabolically active but also finely tuned for regulation and specialization. Metabolism, metabolism of proteins, and metabolism of carbohydrates, which together suggest sustained energy production, protein turnover, and cellular maintenance find a significant rise in stage 5. However, in contrast to earlier stages where general metabolic activity dominated, stage 5 shows increased representation of more specific modules like glycolysis, gluconeogenesis, glucose metabolism, and nucleotide biosynthesis. The embryo at this stage possesses a highly dynamic cellular environment with active biosynthesis, high transcriptional throughput, and robust ATP cycling, with the embryo undergoing gastrulation. Immune-related pathways show further amplification and refinement – the presence of complement cascade activation, alternative complement activation, activation of C3 and C5 – all are prospective events which probably signify the evolution of innate immunity to a more robust, responsive defense system. Such activation might be involved in clearing apoptotic cells and maintaining tissue integrity. This stage also shows pathways associated with neutrophil degranulation and TP53-regulated transcription of cell death genes, suggesting balance between immune activation, stress response and programmed cell turnover, similar immune functions have been reported to emerge in eggs in Arthropods (Fraga et al., 2013). The system shows broad engagement with signal transduction, signaling by nuclear receptors, signaling by Rho GTPases, and RA biosynthesis pathways, which together point towards extensive coordination of gene expression, cytoskeletal dynamics, and morphogenetic control. Pathways such as post-translational protein phosphorylation, vesicle-mediated transport, and membrane trafficking remain prominent, reinforcing the importance of protein-level control, intracellular communication, and compartmentalization. The continued enrichment of regulation of IGF transport shows a persistent need for nutrient-responsive growth regulation (Jones and Clemmons, 1995).
Proteins work in interconnected networks, forming stable or temporary complexes with other proteins or nucleic acids to support crucial processes like signaling, metabolism, and replication (Fionda, 2018). The result from PPI network supported the Gene ontology and reactome pathways as in stage 2, ATP synthase subunit alpha exhibited the highest degree, followed by 60S ribosomal protein L8 and several mitochondrial proteins, including elongation factor G, elongation factor Tu, and Stress-70 protein. Other notable hubs included enzymes such as glucose-6-phosphate isomerase, succinate-CoA ligase subunit beta, and uridine kinase. In stage 3, ATP synthase subunit alpha again displayed the highest degree, with histone proteins (Histone H4, Histone H2A) and ribosomal proteins (40S ribosomal protein SA, 60S ribosomal protein L8) among the other network hubs. Several metabolic enzymes (inosine-5′-monophosphate dehydrogenase, fumarate hydratase) and stress-related proteins (superoxide dismutase, Stress-70 protein) were also in the network. The stage 4 network showed trans-aldolase and glucose-6-phosphate isomerase as the top hubs, followed by glycolytic enzymes (pyruvate kinase, fructose-bisphosphate aldolase) and mitochondrial aspartate aminotransferase. In stage 5, ATP synthase subunit alpha was the most connected node, followed by elongation factor 1-gamma and heat shock protein 83. Several metabolic enzymes (glucose-6-phosphate isomerase, pyruvate kinase, phosphoglycerate kinase, fructose-bisphosphate aldolase) and stress response proteins (endoplasmin, Stress-70 protein, Heat shock proteins) were prominent hubs.
ATP synthase is central to mitochondrial energy generation. Since the early stages are associated with a high energy consumption, this protein appears as a high degree node in the PPI network. Previous studies in Drosophila had similarly shown that ATP synthase is needed for germ cell differentiation (Teixeira et al., 2015). In crustaceans, such as shrimps, ATP synthase is involved in growth and the response to pathogens (Huo et al., 2022). Almost on an equal scale, ribosomal proteins, which play a vital role in acting as structural components of the ribosome and as essential regulators of protein synthesis rates, show a dynamic increase as embryogenesis progresses from the cleavage stages to organogenesis. In T. gigas, the early stages of embryonic development are marked by rapid cell divisions, the establishment of germ layers, and morphogenetic remodeling. All these processes require a precise increase in translational output. The higher concentration of ribosomal proteins in stage-specific proteomes likely reflects the embryo’s need to support the biosynthesis of histones, metabolic enzymes, cytoskeletal proteins, and signaling molecules essential for driving morphogenesis. During T. gigas embryogenesis, histone proteins might play important roles which is not just restricted to chromatin packaging. As seen in Drosophila, with the advent of development, from early cleavage to gastrulation, histone acetylation increases as more zygotic genes are activated and the chromatin structure opens (Li et al., 2014). Similar regulation of histone modification/deposition in T. gigas could control the stage-specific onset of transcription (including immune genes), regulate the timing of developmental gene expression, and facilitate the chromatin remodeling necessary for morphogenesis.
On the other hand, glucose-6-phosphate isomerase catalyzes the interconversion of glucose-6-phosphate and fructose-6-phosphate in glycolysis and gluconeogenesis, thereby supporting energy metabolism. In embryos, energy demand increases rapidly as cells divide, differentiate, and build new structures. Comparative studies in zebrafish indicate that glucose-6-phosphate isomerase is deposited maternally during the early cleavage and blastula stages, followed by zygotic expression in organs and proliferative tissues later on (Lin et al., 2009). A very similar trend is also observed with respect to the developing embryos of T. gigas as well.
5 Conclusion
In conclusion, this is the first report of a global analysis of the protein composition of eggs of the horseshoe crabs, relating to the early stages of development. The early stage proteome reveals a dynamic system that aligns with key morphological transitions as development advances from stage 2 to stage 5. Development begins with basic metabolic and regulatory processes in stage 2, then shifts to a potential transition toward increased complexity and specific signaling in stage 3, followed by a phase of metabolic adjustment and differentiation involving yolk breakdown (stage 4) and culminating in a highly integrated system prepared for gastrulation in stage 5 (characterized by peak metabolic activity, a hypothetically refined immune system, and complex signaling networks). Throughout these stages, protein-protein interaction networks consistently highlight essential hub proteins, including ATP synthase, ribosomal proteins, histones, and glucose-6-phosphate isomerase, emphasizing ongoing needs for energy, protein production, and metabolic adaptability. The elucidation of the changing proteome in the early stages lays out the basis for understanding the expression of proteins in the mid embryonic and later stages of development. This work clarifies the molecular mechanisms guiding T. gigas embryogenesis, providing a valuable resource for comparative chelicerate evolution.
Data availability statement
The data has been deposited in the Zenodo database, and the proteins identified at various developmental stages can be accessed at https://doi.org/10.5281/zenodo.17307447.
Ethics statement
The manuscript presents research on animals that do not require ethical approval for their study.
Author contributions
UM: Investigation, Methodology, Writing – original draft, Formal Analysis, Data curation. YR: Software, Visualization, Writing – original draft. SB: Project administration, Validation, Resources, Supervision, Funding acquisition, Writing – review & editing, Conceptualization.
Funding
The author(s) declare financial support was received for the research and/or publication of this article. The authors are grateful for the financial support of the DBT (Department of Biotechnology), India, under the grant number: BT/PR40435/NDB/39/745/2020.
Acknowledgments
The effort and help in sample collection and sectioning from Akhilesh Upadhyay is gratefully acknowledged and greatly appreciated. The Proteomic facility at NCCS Pune and Prof Srikanth Rapole in the collection of MS data and the process pipeline is gratefully acknowledged. We would like to acknowledge Prof. Vidita Vaidya, TIFR Mumbai, who helped us with the vibratome sections.
Conflict of interest
The authors declare that the research was conducted in the absence of any commercial or financial relationships that could be construed as a potential conflict of interest.
Generative AI statement
The author(s) declare that no Generative AI was used in the creation of this manuscript.
Any alternative text (alt text) provided alongside figures in this article has been generated by Frontiers with the support of artificial intelligence and reasonable efforts have been made to ensure accuracy, including review by the authors wherever possible. If you identify any issues, please contact us.
Publisher’s note
All claims expressed in this article are solely those of the authors and do not necessarily represent those of their affiliated organizations, or those of the publisher, the editors and the reviewers. Any product that may be evaluated in this article, or claim that may be made by its manufacturer, is not guaranteed or endorsed by the publisher.
Supplementary material
The Supplementary Material for this article can be found online at: https://www.frontiersin.org/articles/10.3389/fmars.2025.1692457/full#supplementary-material
References
Bennett J. (1974). Ultrastructural and cytochemical studies on sperm-egg interactions of the horseshoe crab, Limulus polyphemus L (Ames, United States: Iowa State University).
Botton M. L., Tankersley R. A., and Loveland R. E. (2010). Developmental ecology of the American horseshoe crab Limulus polyphemus. Curr. Zool. 56, 550–562. doi: 10.1093/czoolo/56.5.550
Bozhilova L. V., Whitmore A. V., Wray J., Reinert G., and Deane C. M. (2019). Measuring rank robustness in scored protein interaction networks. BMC Bioinf. 20, 446. doi: 10.1186/s12859-019-3036-6
Brown G. G. and Barnum S. R. (1983). Postfertilization changes in the horseshoe crab Limulus polyphemus L. Biol. Bull. 164, 163–175. doi: 10.2307/1541136
Casas-Vila N., Bluhm A., Sayols S., Dinges N., Dejung M., Altenhein T., et al. (2017). The developmental proteome of Drosophila melanogaster. Genome Res. 27, 1273–1285. doi: 10.1101/gr.213694.116
Chino H. (1958). Carbohydrate metabolism in the diapause egg of the silkworm, Bombyx mori—II: Conversion of glycogen into sorbitol and glycerol during diapause. J. Insect Physiol. 2, 1–12. doi: 10.1016/0022-1910(58)90024-6
Czerwonka A. E., Sawadro M. K., and Babczyńska A. I. (2021). Does only egg sac protect spider embryos from pathogens? Detection of antibacterial proteins in embryos of theridiidae and lycosidae representatives. Preprint (V1), Research Square, doi: 10.21203/rs.3.rs-447883/v1
D’Amato A., Cereda A., Bachi A., Pierce J. C., and Righetti P. G. (2010). In Depth Exploration of the Hemolymph of Limulus polyphemus via Combinatorial Peptide Ligand Libraries. J. Proteome Res. 9, 3260–3269. doi: 10.1021/pr1002033
Faizul M. I. M., Faizal M. M., Christianus A., and Amin S. M. N. (2013). Incubation and hatching of Tachypleus gigas (Muller 1785) eggs in sand and water media. Asian J. Anim. Vet. Adv. 8, 333–340. doi: 10.3923/ajava.2013.333.340
Fan X., Pang R., Li W., Ojha A., Li D., and Zhang W. (2020). An overview of embryogenesis: external morphology and transcriptome profiling in the hemipteran insect nilaparvata lugens. Front. Physiol. 11. doi: 10.3389/fphys.2020.00106
Fang Y., Feng M., Han B., Lu X., Ramadan H., and Li J. (2014). In-depth Proteomics Characterization of Embryogenesis of the Honey Bee Worker (Apis mellifera ligustica). Mol. Cell. Proteomics 13, 2306–2320. doi: 10.1074/mcp.M114.037846
Farley R. D. (2010). Book gill development in embryos and first and second instars of the horseshoe crab Limulus polyphemus L. (Chelicerata Xiphosura). Arthropod Struct. Dev. 39, 369–381. doi: 10.1016/j.asd.2010.04.001
Farrell J. A. and O'Farrell P. H. (2014). From egg to gastrula: how the cell cycle is remodeled during the Drosophila mid-blastula transition. Annu. Rev. Genet. 48, 269–294. doi: 10.1146/annurev-genet-111212-133531
Fionda V. (2018). Networks in biology. Encycl. Bioinform. Comput. Biol. 1, 915–921. doi: 10.1016/B978-0-12-809633-8.20420-2
Fraga A., Ribeiro L., Lobato M., Santos V., Silva J. R., Gomes H., et al. (2013). Glycogen and glucose metabolism are essential for early embryonic development of the red flour beetle Tribolium castaneum. PloS One 8, e65125. doi: 10.1371/journal.pone.0065125
González-Baró M. R., Heras H., and Pollero R. J. (2000). Enzyme activities involved in lipid metabolism during embryonic development of Macrobrachium borellii. J. Exp. Zool. 286, 231–237. doi: 10.1002/(SICI)1097-010X(20000215)286:3<231::AID-JEZ2>3.0.CO;2-1
González-Gaitán M. (2003). Endocytic trafficking during Drosophila development. Mech. Dev. 120, 1265–1282. doi: 10.1016/j.mod.2003.06.002
Greene M. P., Hamilton M. G., and Botton M. L. (2011). Physiological responses of horseshoe crab (Limulus polyphemus) embryos to osmotic stress and a possible role for stress proteins (HSPs). Mar. Biol. 158, 1691–1698. doi: 10.1007/s00227-011-1682-y
Howser G. (2019). “Raspberry pi operating system,” in Comput. Netw. Internet (Springer, Cham). doi: 10.1007/978-3-030-34496-2_8
Huo L. J., Lu P. Y., Li D. X., and Shi X. Z. (2022). The sORF-encoded peptides, ATP synthase subunits, facilitate WSSV duplication in shrimp. Viruses 14, 2449. doi: 10.3390/v14112449
Itow T., Kenmochi S., and Mochizuki T. (1991). ). Induction of Secondary Embryos by Intra- and Interspecific Grafts of Center Cells under the blastopore in Horseshoe Crabs. Dev. Growth Differ. 33, 251–258. doi: 10.1111/j.1440-169X.1991.00251.x
Itow T. and Sekiguchi K. (1980). Morphogenic movement and experimentally induced decrease in number of embryonic segments in the Japanese horseshoe crab, Tachypleus tridentatus. Biol. Bull. 158(3), 324–338. doi: 10.2307/1540859
John A., Shin P. K. S., Botton M. L., Gauvry G., Cheung S. G., and Laurie K. (2021). Conservation of Asian horseshoe crabs on spotlight. Biodivers. Conserv. 30, 253–256. doi: 10.1007/s10531-020-02078-3
Jones J. I. and Clemmons D. R. (1995). Insulin-like growth factors and their binding proteins: biological actions. Endocr. Rev. 16, 3–34. doi: 10.1210/edrv-16-1-3
Kawabata S., Tokunaga F., Kugi Y., Motoyama S., Miura Y., Hirata M., et al. (1996). Limulus factor D, a 43-kDa protein isolated from horseshoe crab hemocytes, is a serine protease homologue with antimicrobial activity. FEBS Lett. 398, 146–150. doi: 10.1016/s0014-5793(96)01224-0
Kendrick M. R., Brunson J. F., Sasson D. A., Hamilton K. L., Gooding E. L., Pound S. L., et al. (2021). Assessing the viability of american horseshoe crab (Limulus polyphemus) embryos in salt marsh and sandy beach habitats. Biol. Bull. 240(3), 145–156. doi: 10.1086/714277
Kimble M., Coursey Y., Ahmad N., and Hinsch G. W. (2002). Behavior of the Yolk Nuclei during Embryogenesis, and Development of the Midgut Diverticulum in the Horseshoe Crab Limulus polyphemus. Invertebr. Biol. 121, 365–377. doi: 10.1111/j.1744-7410.2002.tb00137.x
Lamsdell J. C. (2019). Evolutionary history of the dynamic horseshoe crab. Int. Wader Stud. 21, 1–15. doi: 10.18194/db.00173
Li X. Y., Harrison M. M., Villalta J. E., Kaplan T., and Eisen M. B. (2014). Establishment of regions of genomic activity during the Drosophila maternal to zygotic transition. eLife 3, e03737. doi: 10.7554/eLife.03737
Li Z., Johnson M. R., Ke Z., Chen L., and Welte M. A. (2014). Drosophila lipid droplets buffer the H2Av supply to protect early embryonic development. Curr. Biol. 24, 1485. doi: 10.1016/j.cub.2014.05.022
Lin W. W., Chen L. H., Chen M. C., and Kao H. W. (2009). Differential expression of zebrafish gpia and gpib during development. Gene Expr. Patterns 9, 238–245. doi: 10.1016/j.gep.2008.12.006
Lindsay S. A. and Wasserman S. A. (2014). Conventional and non-conventional Drosophila Toll signaling. Dev. Comp. Immunol. 42, 16–24. doi: 10.1016/j.dci.2013.04.011
McLin V. A., Hu C.-H., Shah R., and Jamrich M. (2008). Expression of complement components coincides with early patterning and organogenesis in Xenopus laevis. Int. J. Dev. Biol. 52, 1123–1133. doi: 10.1387/ijdb.072465v
Moraes J., Galina A., Alvarenga P. H., Rezende G. L., Masuda A., da Silva Vaz I. Jr., et al. (2007). Glucose metabolism during embryogenesis of the hard tick Boophilus microplus. Comp. Biochem. Physiol. A Mol. Integr. Physiol. 146, 528–533. doi: 10.1016/j.cbpa.2006.05.009
Noor Jawahir A., Samsur M., Shabdin M., and Khairul Adha A. (2017). Distribution of two species of Asian horseshoe crabs at west coast of Sarawak's Waters, East Malaysia. Egypt. J. Aquat. Res. 43, 135–140. doi: 10.1016/j.ejar.2017.03.002
Ojeda-García K. K., Corona-Cervantes K., Villegas-Ruiz V., Nakajima-Shimada J., and Hernández-Rivas R. (2021). Transcriptomic analysis of the embryogenesis of the cattle tick Rhipicephalus microplus reveals the regulatory networks that orchestrate development. Ticks Tick-Borne Dis. 12, 101755. doi: 10.1016/j.ttbdis.2021.101755
Pati S. and Dash B. P. (2015). Availability of Tachypleus gigas (Müller) along the river estuaries of Balasore district, Odisha, India. Int. J. Fish. Aquat. Stud. 2, 334–336.
Roth R. I. and Levin J. (1992). Purification of Limulus polyphemus proclotting enzyme. J. Biol. Chem. 267, 24097–24102. doi: 10.1016/S0021-9258(18)35951-9
Roth Z., Parnes S., Wiel S., Sagi A., Zmora N., Chung J. S., et al. (2009). N-Glycan moieties of the crustacean egg yolk protein and their glycosylation sites. Glycoconj. J. 27, 159–169. doi: 10.1007/s10719-009-9268-3
Rudkin D. M., Young G. A., and Nowlan G. S. (2007). The oldest horseshoe crab: a new xiphosurid from late ordovician konservat-lagerstätten deposits, Manitoba, Canada. Palaeontology 51, 1–9. doi: 10.1111/j.1475-4983.2007.00746.x
Santos V. T., Ribeiro L., Fraga A., de Barros C. M., Campos E., Moraes J., et al. (2013). The embryogenesis of the tick Rhipicephalus (Boophilus) microplus: the establishment of a new chelicerate model system. Genesis 51, 803–818. doi: 10.1002/dvg.22717
Sarmiento M. E., Chin K. L., Lau N., Ismail N., Norazmi M. N., Acosta A., et al. (2022). Transcriptomic signature of horseshoe crab carcinoscorpius rotundicauda hemocytes’ Response to lipopolysaccharides. Curr. Issues Mol. Biol. 44, 5866–5878. doi: 10.3390/cimb44120399
Shingate P., Ravi V., Prasad A., Tay B. H., and Venkatesh B. (2020). Data from: Chromosome-level genome assembly of the coastal horseshoe crab (Tachypleus gigas). Dryad. 20(6), 1748–1760. doi: 10.5061/dryad.2jm63xsmc
Suniza A. M. S., Kassim Z., and Chatterji A. (2011). Effects of different environmental parameters on the respiratory metabolism of the larvae of Malaysian horseshoe crab, Tachypleus gigas (Müller). Pertanika J. Sci. Technol. 19, 1–9.
Szklarczyk D., Kirsch R., Koutrouli M., Nastou K., Mehryary F., Hachilif R., et al. (2023). The STRING database in 2023: protein-protein association networks and functional enrichment analyses for any sequenced genome of interest. Nucleic Acids Res. 51, D638–D646. doi: 10.1093/nar/gkac1000
Teixeira F. K., Sanchez C. G., Hurd T. R., Seifert J. R., Czech B., Preall J. B., et al. (2015). ATP synthase promotes germ cell differentiation independent of oxidative phosphorylation. Nat. Cell Biol. 17, 689–696. doi: 10.1038/ncb3165
Tinker-Kulberg R., Dellinger K., Brady T. E., Robertson L., Levy J. H., Abood S. K., et al. (2020). Horseshoe crab aquaculture as a sustainable endotoxin testing source. Front. Mar. Sci. 7. doi: 10.3389/fmars.2020.00153
van der Borg G., Warner H., Ioannidis M., van den Bogaart G., and Roos W. H. (2023). PLA 3D printing as a straightforward and versatile fabrication method for PDMS molds. Polymers 15, 1498. doi: 10.3390/polym15061498
Wang W., Xie X., Chen K., Chen X., Zhu W., and Wang H. (2021). Immune responses to gram-negative bacteria in hemolymph of the chinese horseshoe crab, tachypleus tridentatus. Front. Immunol. 11. doi: 10.3389/fimmu.2020.584808
Zhai B., Villén J., Beausoleil S. A., Mintseris J., and Gygi S. P. (2008). Phosphoproteome analysis of drosophila melanogaster embryos. J. Proteome Res. 7, 1675–1682. doi: 10.1021/pr700696a
Zhan C., Li X., Zhao Z., Yang T., Wang X., Luo B., et al. (2016). Comprehensive analysis of the triterpenoid saponins biosynthetic pathway in Anemone flaccida by transcriptome and proteome profiling. Front. Plant Sci. 7. doi: 10.3389/fpls.2016.01094
Keywords: Tachypleus gigas, proteome, development, embryogenesis, mass spectrometry, horseshoe crab
Citation: Mallick U, Rathod Y and Biswas S (2025) An insight into the development stages and proteome of the early-stage embryo in the horseshoe crab species T. gigas. Front. Mar. Sci. 12:1692457. doi: 10.3389/fmars.2025.1692457
Received: 25 August 2025; Accepted: 07 November 2025; Revised: 30 October 2025;
Published: 01 December 2025.
Edited by:
Qiu-Ning Liu, Yancheng Teachers University, ChinaReviewed by:
Yin Zhang, Shantou University, ChinaHena Chakraborty, Central Inland Fisheries Research Institute (ICAR), India
Copyright © 2025 Mallick, Rathod and Biswas. This is an open-access article distributed under the terms of the Creative Commons Attribution License (CC BY). The use, distribution or reproduction in other forums is permitted, provided the original author(s) and the copyright owner(s) are credited and that the original publication in this journal is cited, in accordance with accepted academic practice. No use, distribution or reproduction is permitted which does not comply with these terms.
*Correspondence: Sumit Biswas, c3VtaXRAZ29hLmJpdHMtcGlsYW5pLmFjLmlu