 Arnau Garcia Tort1*‡
 Paula Gomes da Silva1‡
 Erica Pellón1‡
 Verónica Cánovas1‡
 Mauricio González1‡
 Raúl Medina1‡
 Antonio Henrique da Fontoura Klein2‡
- 1IHCantabria – Instituto de Hidráulica Ambiental de la Universidad de Cantabria, Santander, Spain
- 2Coastal Oceanography Laboratory, Federal University of Santa Catarina, Florianópolis, SC, Brazil
Current models for long-term shoreline response to sea-level rise (SLR), such as the Bruun Rule, have significant limitations as they fail to account for site−specific processes and often misrepresent the influence of dunes, rocky platforms, or estuarine sediment sources and sinks. Here we integrate four previously published formulations into the Composite Shoreline−Retreat Workflow (CoShReW), a compound sequence that can be adapted or expanded according to data availability. The workflow needs several topo−bathymetric variables and shoreline data to calculate the expected shoreline retreat. It is distributed as open source code (GitHub) to guarantee reproducibility. As a first study-case, CoShReW is applied to 1281 cross-shore profiles along the highly heterogeneous Andalusian coast (SW Spain). To capture this coastal variability, we conduct a detailed characterization along the study area using Principal Component Analysis (PCA) of significant wave height, peak period, tidal range and sediment grain size, defining four different profile types. Resulting shoreline retreat projections differ by more than an order of magnitude among these classes, with dune elevation and estuary capacity emerging as dominant controls in dissipative sectors, and historical erosion rates prevailing on reflective or cliff−backed shores. Sensitivity analysis quantifies the relative importance of the governing variables for each profile type, indicating where local data collection would most improve forecast confidence. The present study findings reveal that local geomorphology can equal or exceed SLR as a driver of shoreline change in some habitats, emphasizing the need to consider and integrate site-specific adaptation measures in long-term shoreline retreat assessments for complex coastal environments.
Highlights
● Implements a shoreline retreat large-scale assessment along the Andalusian coast.
● Introduces site-specific adaptations for complex coastal settings.
● Considers profile morphology, dunes, estuaries and shoreline change rates.
● Offers a practical workflow and guidance for coastal management.
● The presented workflow can be equally applied to different spatial scales.
1 Introduction
The effect of climate change on coastal areas is a major environmental concern worldwide, as it significantly impacts sandy-beach morphodynamics through changes in long-term (e.g., rising sea-levels) and meso- short-term processes (e.g., changes in wave climate, storm surge and increase in storm frequency) (Vousdoukas et al., 2020a). These changes propagate across the nearshore hydrodynamic zone, modifying sediment transport, shoreline position, and the coastal habitats that support biodiversity, fisheries nursery grounds, and other ecosystem services (IPCC, 2023). An estimated 680 million people reside in low-lying coastal zones, a figure expected to surpass one billion by 2050 (Pörtner et al., 2019). This population faces escalating risks, including those related to enhanced coastal erosion and more frequent flooding (Nicholls and Cazenave, 2010; Nurse et al., 2014; Mycoo and Donovan, 2017; Cutler et al., 2020). The potential for future shoreline erosion due to sea-level rise (SLR) is a global issue (Bird, 1985), but patterns of shoreline change during transgression are highly variable and depend heavily on site-specific factors and source–sink dynamics (Cooper and Pilkey, 2004). In this context, there is an urgent need for alternative predictive models and methods that can forecast shoreline changes due to climate change in different time scales while explicitly linking physical drivers to ecological exposure (e.g., dunes, beaches, saltmarshes, seagrass meadows, and estuarine habitats) and to management-relevant metrics such as habitat connectivity and coastal resilience. Such models and methodologies should consider the regional effect of SLR, but also the influence of local drivers and factors affecting coastal change, such as wave climate, storm surges, morphological changes along with sedimentological processes, vegetation, and human activities (Stive et al., 2002; Cooper and Pilkey, 2004; Cooper et al., 2019; Itzkin et al., 2022 or Seenath and Dale, 2024). Developing simple, open, and reproducible science-based tools to assess and predict the impact of climate change at different types of coastlines can help policymakers and managers to incorporate local factors into their coastal conservation planning, improving adaptation and sustainable ocean stewardship in vulnerable socio-ecological coastal systems.
However, integrating short- and long-term processes into a single model is both challenging and computationally expensive, often requiring simplifications to generate estimates over various time scales. None of the currently available models considers the full range of local factors and processes influencing shoreline response, including wave climate variability (Guisado et al., 2013; Vousdoukas et al., 2020b), sediment characteristics and transport dynamics (Cooper and Pilkey, 2004), morphological settings such as dune systems and rocky substrates (Le Cozannet et al., 2019; McCarroll et al., 2021), coastal infrastructure and human interventions (Beuzen et al., 2018; Seenath and Dale, 2024), and estuarine basin infilling processes (Ranasinghe et al., 2012; Toimil et al., 2017).
The most widely used method to estimate long-term shoreline retreat is the Bruun Rule (Bruun, 1962), a simple model that directly relates the profile slope to the shoreline retreat after a certain SLR. The Bruun Rule assumes that the active coastal profile maintains a time-averaged equilibrium shape determined by local beach parameters. In response to SLR, the profile tends to shift upward to maintain the equilibrium shape and depth. The volume of sand to fill this upward shift will come from the upper beach, resulting in shoreline retreat and a landward shift or setback (Bruun, 1954, 1962).
Figure 1 shows a schematic representation of the translation process and the resultant shoreline retreat (). According to Bruun (1954, 1962), the shoreline retreat can be estimated as presented in Equation 1:
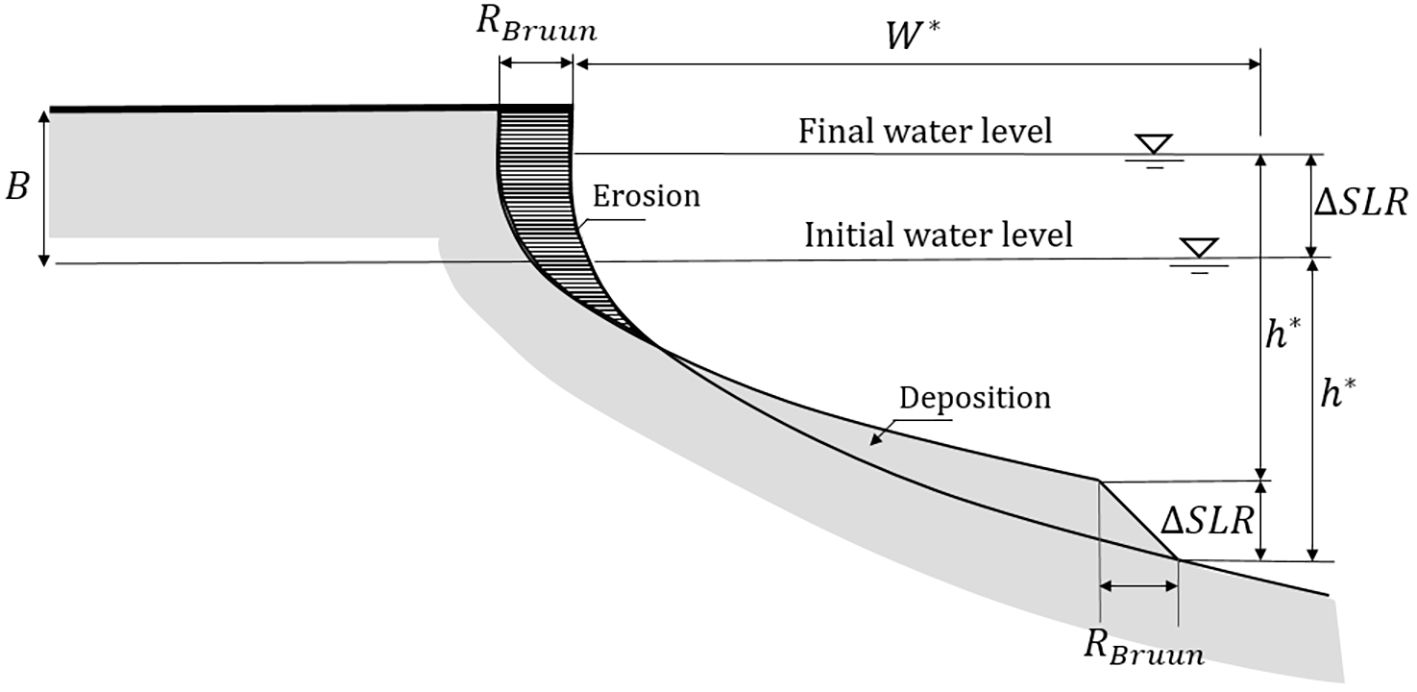
Figure 1. The Bruun Rule model of shoreline retreat and their involved variables, adapted from Bruun (1962).
Where B is the berm height of the beach, is the active beach profile width up to the closure depth and represents the projected sea-level rise over the timescale considered that will henceforth be referred to simply as SLR.
Given the simplicity of its application, the Bruun Rule is very popular and widely used in studies that aim to estimate the effect of SLR on beaches, particularly at large spatial scales (Vousdoukas et al., 2020b). However, some authors highlighted the limitations of this model —such as a static equilibrium profile or its inability to account for local characteristics like the presence of coastal defences (e.g., seawalls, promenades) or rocky substrates that limit sediment availability. Additionally, it overlooks landward sand sources, like rivers or sandy dunes, which can significantly influence sediment dynamics and the consequent shoreline responses (Cooper and Pilkey, 2004; Zhang et al., 2004; Le Cozannet et al., 2019; Kinsela et al., 2022; Nguyen and Takewaka, 2020). Some authors have attempted to propose alternative models or proxies to address the limitations of Bruun Rule (Ranasinghe et al., 2012; Rosati et al., 2013; Dean and Houston, 2016; Toimil et al., 2017; Atkinson et al., 2018; Seenath and Dale, 2024), although the recent methodologies are based on variables that are complex to estimate and applications are mostly limited to sites where detailed information on local processes is available. Despite its limitations, the Bruun Rule remains the most popular approach for linking shoreline change to SLR, which is often regarded as the main driver of mesoscale coastal changes (Nicholls et al., 1999; Stive et al., 2002; Hallin et al., 2019; Vousdoukas et al., 2020b), and the scientific community acknowledges its usefulness for probabilistic analysis and for coastal management purposes (Seenath and Dale, 2024). Actually, several mesoscale shoreline models has the Bruun Rule as the basis of their shoreline retreat estimates (e.g., CoSMoS-COAST from Vitousek et al. (2017), LX-Shore from Robinet et al. (2018) or IH-LANS from Alvarez-Cuesta et al. (2021a)). Some studies have leveraged the characteristics into long-term shoreline change predictions, expanding it with probabilistic models for shoreline change (e.g., Ranasinghe et al., 2012; Thiéblemont et al., 2021; Dastgheib et al., 2022; or Masselink et al., 2022). Probabilistic modelling accounts for intrinsic uncertainties in the data used in the Bruun Rule, enabling an investigation into potential shoreline responses due to natural variability in climatic or stochastic forcing conditions (Stripling et al., 2017). However, a persistent challenge remains in incorporating simple and viable site-specific models into large-scale applications (Ritphring et al., 2018; Sharaan and Udo, 2020; Bagheri et al., 2023).
This work applies, for the first time, CoShReW—a synthesis of well−established, reviewed formulations—to 1281 cross−shore profiles along the Andalusian highly variable coast. By coupling those existing equations with a Principal Component Analysis (PCA), we derive profile−specific retreat projections showcasing the critical influence of geomorphological characteristics and sediment dynamics on the shoreline response induced by SLR. The scientific contribution therefore lies not in proposing a new model, but in demonstrating—through a large, real−world dataset—how a carefully parameterised combination of known processes can capture the spatial heterogeneity of shoreline response and provide managers with practical, locally tailored guidance for adaptation planning.
CoShReW is grounded on the foundational Bruun Rule, but incorporates several refinements drawn from prior research. The additional berm retreat is modelled following of Rosati et al. (2013), while estuarine sediment demand is included based on the methodologies of Ranasinghe et al. (2013) and Toimil et al. (2017). Long-term shoreline dynamics are further captured through Shoreline Evolution Rates (SER), as introduced by Ferreira et al. (2006), which account for decadal shoreline change rates. The proposed workflow stands out for its simplicity, ease of interpretation, and rapid implementation. The source code is open-access and available on GitHub (https://github.com/IHCantabria/CoShReW.git), in full compliance with FAIR principles and ready for replication or further refinement.
The paper is structured as follows: Section 1 includes the Introduction. Section 2 describes the Study area. Then, section 3 details the Methodology used in this work. The obtained results are included on section 4. Finally, section 5 contains the Discussion, followed by the Conclusions on section 6, which summarizes the findings, concluding the paper while addressing potential future challenges. As a Supplementary Data, Appendix A1, contains all the abbreviations used in this study and Appendix A2, contains more details about data description and finally Appendix A3, contains a detailed image of each one of the control beaches used as validation sites.
2 Study area and data description
In this study, the coast of Andalusia, South Spain, was selected to show the potential application in regional-scale (see Figure 2). The study area presents considerable longshore variability in coastal morphologies and backshore typologies, providing a robust case-study for evaluating the proposed workflow in several heterogeneous environments.
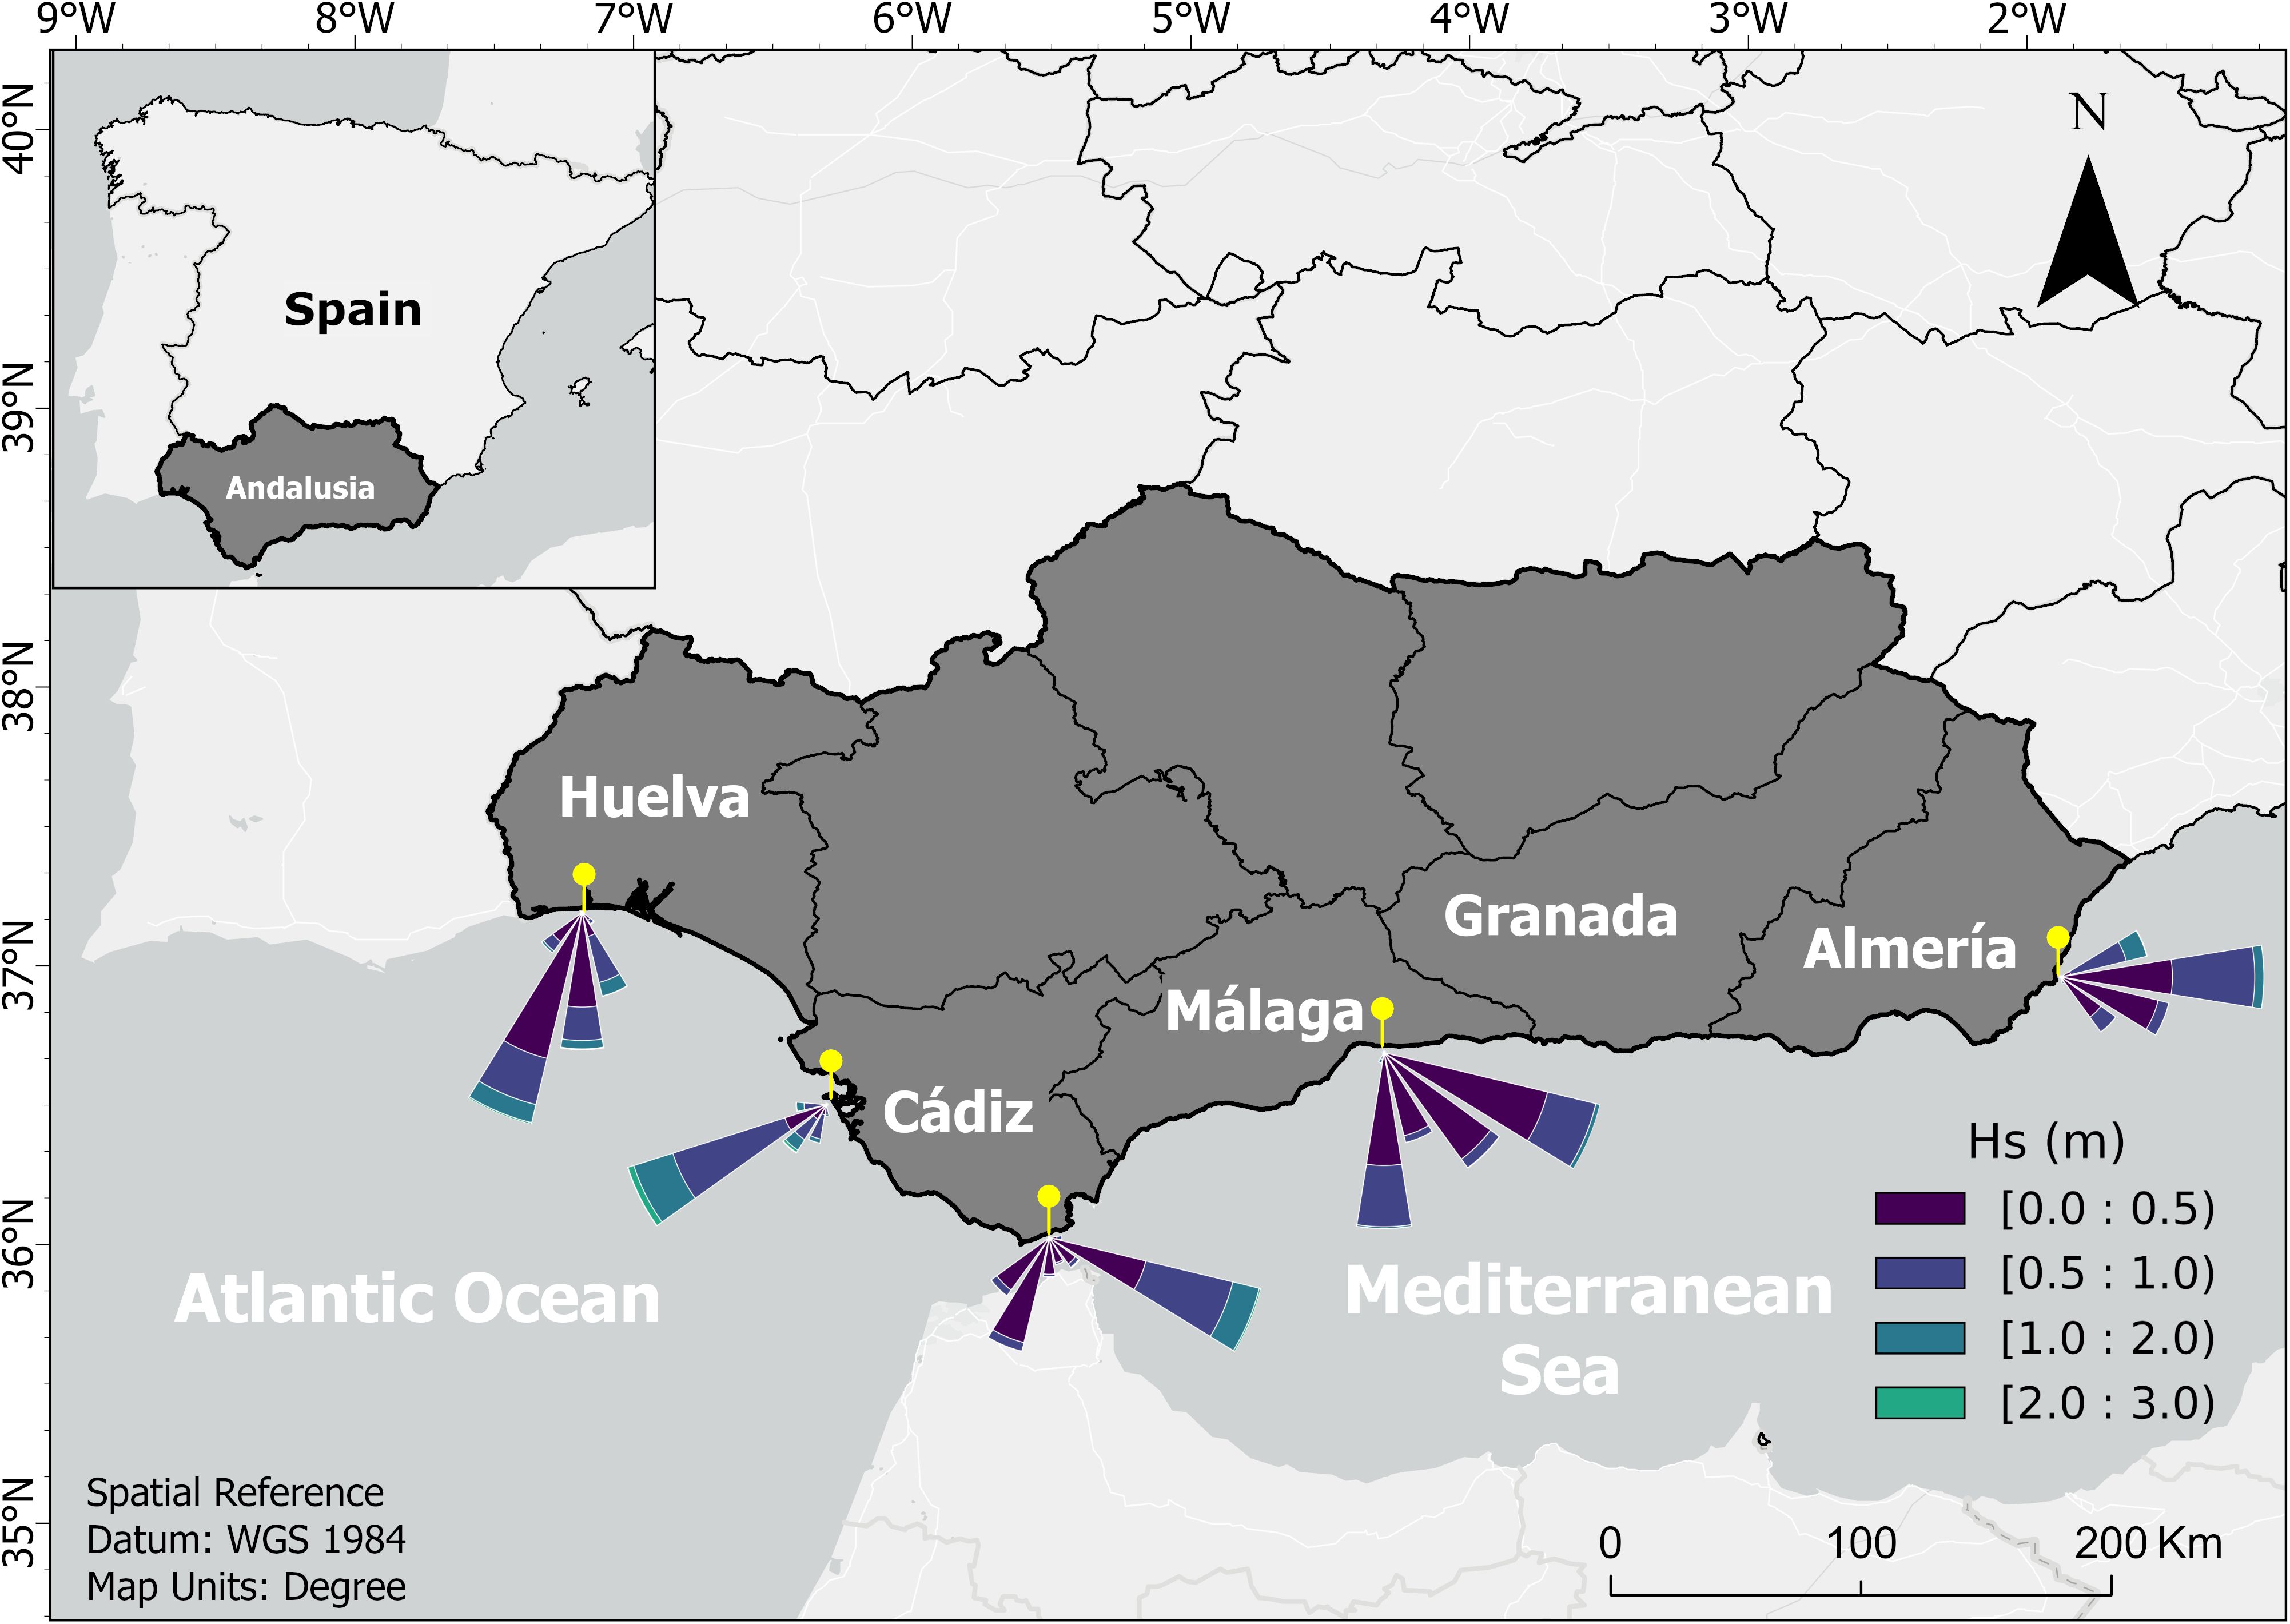
Figure 2. Study area: Andalusian coastline and its marine climate variability.
2.1 Study area
The stretch of Andalusian coastline analysed in this study spans over 670 km across five provinces (Huelva, Cádiz, Málaga, Granada, and Almería), bordered by the Atlantic Ocean and Mediterranean Sea. This dual exposure, combined with distinct geomorphological and hydrodynamic characteristics, divides the coastline into three well-differentiated sections: (i) the western Atlantic sector, (ii) the Strait of Gibraltar, and (iii) the eastern Mediterranean sector.
The Andalusian wave climate is predominantly characterized by long periods of calm (more than 77% of the year), punctuated by high-energy events. These events are dominated by high-frequency storm waves with peak wave periods (Tp) of less than 7 seconds and maximums of significant wave heights (Hs) exceeding 5 meters (Guisado et al., 2013). Each coastal section exhibits unique characteristics: (i) the western Atlantic sector, extending from the Portuguese border to the Strait of Gibraltar, is defined by significant ocean swells from the Atlantic (long fetch), a mesotidal regime with tidal ranges of 2–4 meters and the prevalence of sandy formations, estuaries and tidal flats. Dominant winds in this area blow from the ESE (19.6% annual occurrence) and WNW (12.8%). The nearshore wave climate direction is primarily influenced by WSW-SW swells, with Hs generally under 1 meter during calm periods but reaching up to 3 meters during storms (Reyes et al., 1999); (ii) the Strait of Gibraltar is a highly dynamic transition zone where the exchange of water masses between the Atlantic Ocean and the Mediterranean Sea occurs. This area is characterized by its unique morphology, which, combined with the confluence of strong winds and powerful currents, creates highly variable hydrodynamic conditions. The strait is further distinguished by steep cliffs, rocky platforms and intricate current systems, making it a region of significant oceanographic and geomorphological complexity. Cádiz’s marine climate is the most energetic section, reaching the maximum values during winter storm events. Some energetic events, like the easterly storm of the 11th of October 2008, affected significantly the coast of Marbella in the south of Málaga, registering waves of up to Hs >7 m, and Tp > 10 s (Guisado et al., 2013); and (iii) the north-eastern Mediterranean sector, is characterized by microtidal conditions (< 1 m) with minimum tidal ranges of 0.12 m in Almería and with maximums of up to 0.2 meters. It is shaped by geomorphological features such as narrow beaches (< 15m wide), and rocky coastlines (IHCantabria, 2019; Molina et al., 2020; Torrecillas et al., 2024). Mediterranean sector experiences in general lower wave energy conditions, with typical waves and periods that range Hs of 0.5–1.5 m, Tp; of 5–6 s (Guisado et al., 2013).
While the characterisation of the maritime climate is critical, equally essential is the understanding of backshore environments and their involved variables. The Andalusian region backshore types are notably diverse, encompassing well-developed dune systems and urbanized areas with seawalls, promenades or similar infrastructure, reflecting varying degrees of human intervention (Molina et al., 2020). These backshore features interact with the local coastal dynamics, which are further shaped by bathymetric variations (CEDEX, 2013). For instance, the Atlantic side features a wider and shallower continental shelf, extending 40–70 km offshore in some areas, while the Mediterranean shelf is narrower and steeper, typically spanning just 5–15 km. Coastal processes are strongly shaped by sediment transport dynamics, with the Mediterranean coast experiencing a dominant westward littoral drift driven by easterly winds and intensified by storm wave activity during the winter months (Molina et al., 2019). On the Atlantic front, the regressive sections are mostly related to the effects of the sedimentary deficit caused by the presence of transversal infrastructures (breakwaters, ports, etc.), which intersect the longshore drift, which is very strong on the Huelva coast, generating a sedimentary deficit in the adjacent sections (Campos and Jose, 2024).
For this study, the Andalusian coastline, which features over 405 predominantly sandy beaches but also including gravels, rock platforms, and dune-backed areas, was divided into 1281 cross-shore profiles, each spaced 500 meters apart. Each profile starts at the backshore boundary—such as a seawall or dune foot—and extends seaward, allowing for a detailed spatial analysis of the morphological and hydrodynamic processes shaping the coastline.
2.2 Data sources
CoShReW requires multiple data sources. Hydrodynamic data were extracted from IHData wave climate databases (IHData-Documentation, 2024), specifically the GOW2 (Global Ocean Waves), GOS (Global Ocean Surge), and GOT (Global Ocean Tides) datasets, which provide continuous and homogeneous climatic records for significant wave height (Hs), peak period (Tp), and tidal data critical for modelling shoreline dynamics under sea-level rise scenarios (see Figure A2.1 on Apendix2-Data Descriptor). The GOW2 dataset, developed using the WAVEWATCH III model (Tolman, 1991), offers hourly sea state records at over 40,000 coastal locations globally. Storm surge data from GOS (Menéndez et al., 2015) are modelled with the ROMS system, and tidal data are derived from the GOT dataset, based on the TPXO9 global tidal model (Egbert and Erofeeva, 2002). To validate these data, sea-level observations from REDMAR (Red de medida del nivel del mar y agitación de Puertos del Estado) tide gauges and satellite altimetry records from ESA (European Space Agency) Sea State Climate Change Initiative project were used (Figure A2.2). Further climate projections were derived from six global and five regional climate models, estimating sea-level rise and storm surge impacts for the periods 2026–2045 and 2081–2100, under SSP2-4.5 and SSP5-8.5 emission scenarios (IPCC, 2023), with a spatial resolution of 10 km, see Figure A2.4.
Morphological data were sourced from detailed topographic and bathymetric surveys compiled by IHCantabria, with all measurements standardized to zero Mean Sea Level (MSL) at Alicante. The resulting Digital Terrain Model (DTM) visible on Figure A2.3, was used to characterize coastal profiles along the Andalusian coast. This dataset was compiled at the request of the local Government of Andalusia (Dirección General de Calidad Ambiental y Cambio Climático).
Additionally, some initial data were sourced from the CEDEX (Centro de Estudios y Experimentación de Obras Públicas) reports, specifically the 2013 study on coastal dynamics and improvement proposals for beaches between the mouths of the Guadiana and Guadalquivir rivers, and the 2017 study on coastal dynamics in Granada, which includes considerations of climate change impacts on erosive beaches. These reports provided valuable baseline information for shoreline behaviour and management strategies in specific regions (CEDEX, 2013; MITECO, 2019).
To account for local processes unrelated to SLR, shoreline change rates visible on Figure A2.5, were obtained over a 6-11-year period for each profile, using the most recent estimates available in local databases (conducting a specific shoreline change rate analysis was considered to be outside the scope of this work). Along the Andalusian coast, change rates were obtained from the Andalusian Government database (REDIAM, 2020) and characterized shoreline changes from 2007 to 2013. The shoreline change rates were produced by digitizing multiple shorelines from orthophotos and satellite imagery and, along cross-shore transects, computing the Linear Regression Rate (LRR)—the ordinary least-squares slope of shoreline position versus time along each transect (m yr-¹), with 95% confidence intervals. LRR is the standard estimator adopted in Digital Shoreline Analysis System (DSAS). The selected time window (6–11 year) is assumed to be appropriate, as it is large enough to represent medium-term processes but short enough to not include significant changes driven by SLR, which occur on a long-term scale.
For further details on the used datasets and their calibration, please refer to the Annex A2-Data descriptor.
3 Methodology
This study applies a composite workflow to estimate long-term shoreline retreat under various SLR scenario projections, integrating multiple data sources and coastal characteristics across the Andalusian coast. The methodology is structured into two stages: (i) classification of coastal profiles and (ii) shoreline retreat estimation through CoShReW. Hereafter we refer to the methodology as CoShReW.
After processing the aforementioned datasets, they were categorized into homogeneous coastal zones using Principal Component Analysis (PCA). We performed the coastal classification in two stages. First, we applied a hydrodynamic PCA to characterize the wave–tide–sediment setting of each profile. Second, we applied a morphological PCA to group profiles by shape, length and steepness of the active beach profile. The first PCA analysis allowed for the classification of the Andalusian coast into four distinct profile classes based on hydrodynamical and sedimentary characteristics. The primary variables used in this phase were: significant wave height (Hs12) and its associated peak period (Tp12), tidal range (TR), and median grain size (d50) for each profile. On the second stage, the classification allowed for the identification of nine different profile types with similar morphologies. The variables analysed were the depth of closure (h*) and the cross-shore extent of the profile (W*) up to this point. The explained variance and supplementary plots can be found in Appendix 2.
The procedure was:
1. Active-profile bounds: For each transect, we defined the active profile landward by the high-water level and seaward by the depth of closure ℎ*. The high-water level was taken from the GOT tide database, and ℎ* was estimated with the formulation of Birkemeier (1985) using Hs12 and Tp12.
2. Normalization: Profiles were normalized in distance (x/xmax) and elevation/depth (ℎ/ℎmax) so that sections with different extents or depths could be compared on a common, dimensionless space.
3. Principal Component Analysis: We reduced dimensionality with PCA and retained the components explaining ≥99% of total variance for clustering.
4. Clustering (K-means): K-means was applied to the retained PCs, yielding nine morphological groups (morphotypes). Profiles dominated by rocky platforms and estuaries/inlets were excluded from this morphological classification.
The two-stage approach separates forcing context (Stage 1) from profile shape (Stage 2), providing hydrodynamically coherent classes and, independently, morphologically homogeneous groups suitable for subsequent analyses. These variables formed the basis for the classification analysis, which was performed using the K-means clustering technique, grouping of elements with similar characteristics into a predefined number of clusters. A detailed explanation of the K-means technique, as well as its comparison to other clustering and classification algorithms, can be found in Camus et al. (2011).
For the shoreline retreat calculation, CoShReW extends beyond the original Bruun Rule by incorporating a broader range of coastal variables that were not considered in the original formulation, combining insights from four different previous authors. These additional variables account for coastal processes and site-specific characteristics that the Bruun Rule overlooks. Users can access the code for applying the CoShReW formulas in GitHub (see link at the end of section 1, Introduction).
Here, the total shoreline change () is estimated as a result of four components, each of them representing distinct process:
i. refers to the shoreline retreat due to the demand of sand to fill the submerged profile and reach the profile’s equilibrium shape after SLR. This term can be estimated by the original Bruun’s Rule, using Equation 1.
ii. refers to the additional shoreline retreat due to the demand of sand to fill the dry beach (berm volume) after the profile’s translation. This term can be estimated with the adaptation proposed by Rosati et al. (2013).
iii. represents the additional shoreline retreat induced by the sediment demand required to fill the estuary basin in response to SLR (only affects profiles of beaches adjacent to estuaries). This process, known as estuary basin infilling, was identified by Ranasinghe et al. (2013) and further explored and estimated by Toimil et al. (2017).
iv. shoreline retreat due to factors unrelated to SLR (e.g., beach nourishment, chronic erosion due to the disruption in the littoral drift, etc). This term is based on Ferreira et al. (2006) and calculated using the shoreline change rate estimates (see section 3.4).
The shoreline retreat, comes from a combination of these four physical contributions.
where f represents the relative importance among each one. Because the workflow is flexible, any of the four components can be turned on or off to suit local conditions, making the method easy to adapt to different types of coastline or site-specific conditions.
In the initial implementation, however, CoShReW adopts a simplified procedure in which the total retreat is calculated as the linear compound of the four shoreline retreat terms—namely —in that order. This aggregation assumes that interactions between the four components and their differences in temporal or spatial scales can be disregarded for the purpose of generating first-order estimates.
In that sense, can be estimated using the following Equation 2:
Figure 3 illustrates the followed procedure, showing the progressive shoreline retreat as the contribution of each term is sequentially added. By tailoring CoShReW to the unique characteristics of a study site, users can select only the parts relevant to their analysis while setting inapplicable modules to zero. As a result, the estimated retreat remains both context-specific and operationally adaptable, enhancing the versatility of CoShReW.
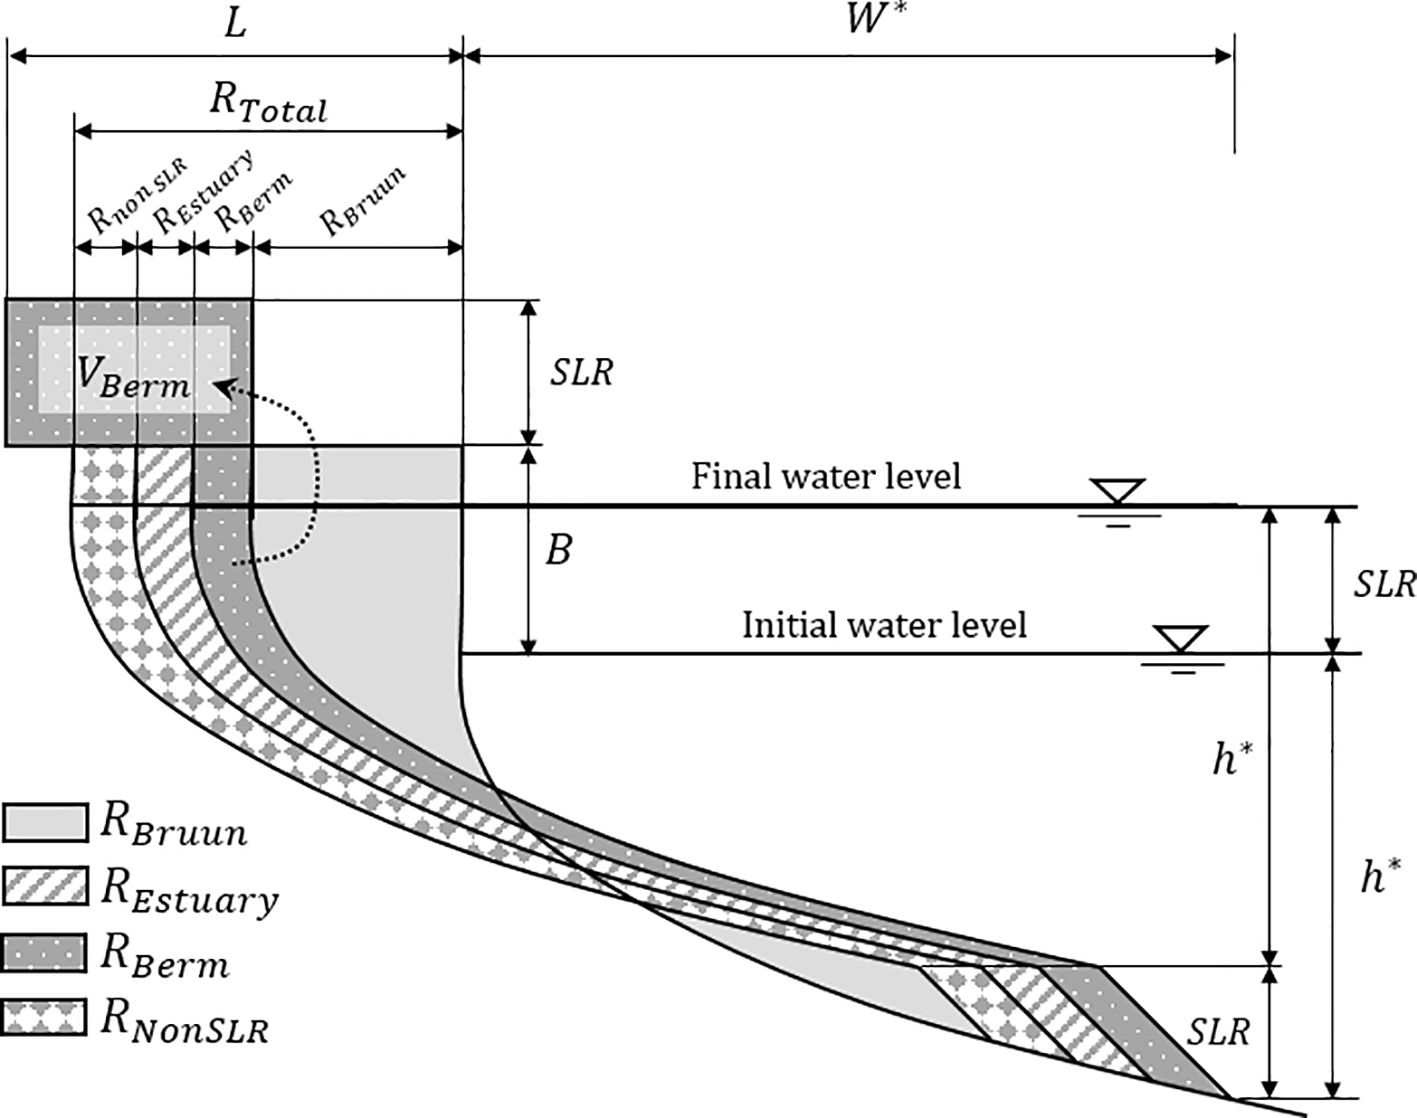
Figure 3. Schematic section of a beach profile and the four components of shoreline retreat considered in this study.
Following this initial estimation—and acknowledging that such setback values may be overestimated—the calculations are subsequently refined and turned into (section 3.5) by accounting for local characteristics and boundary conditions, particularly those related to seafloor and backshore profile types.
The following sections describe each retreat term and the specific corrections applied based on site-specific conditions, as illustrated in Figure 4 and Table 1.
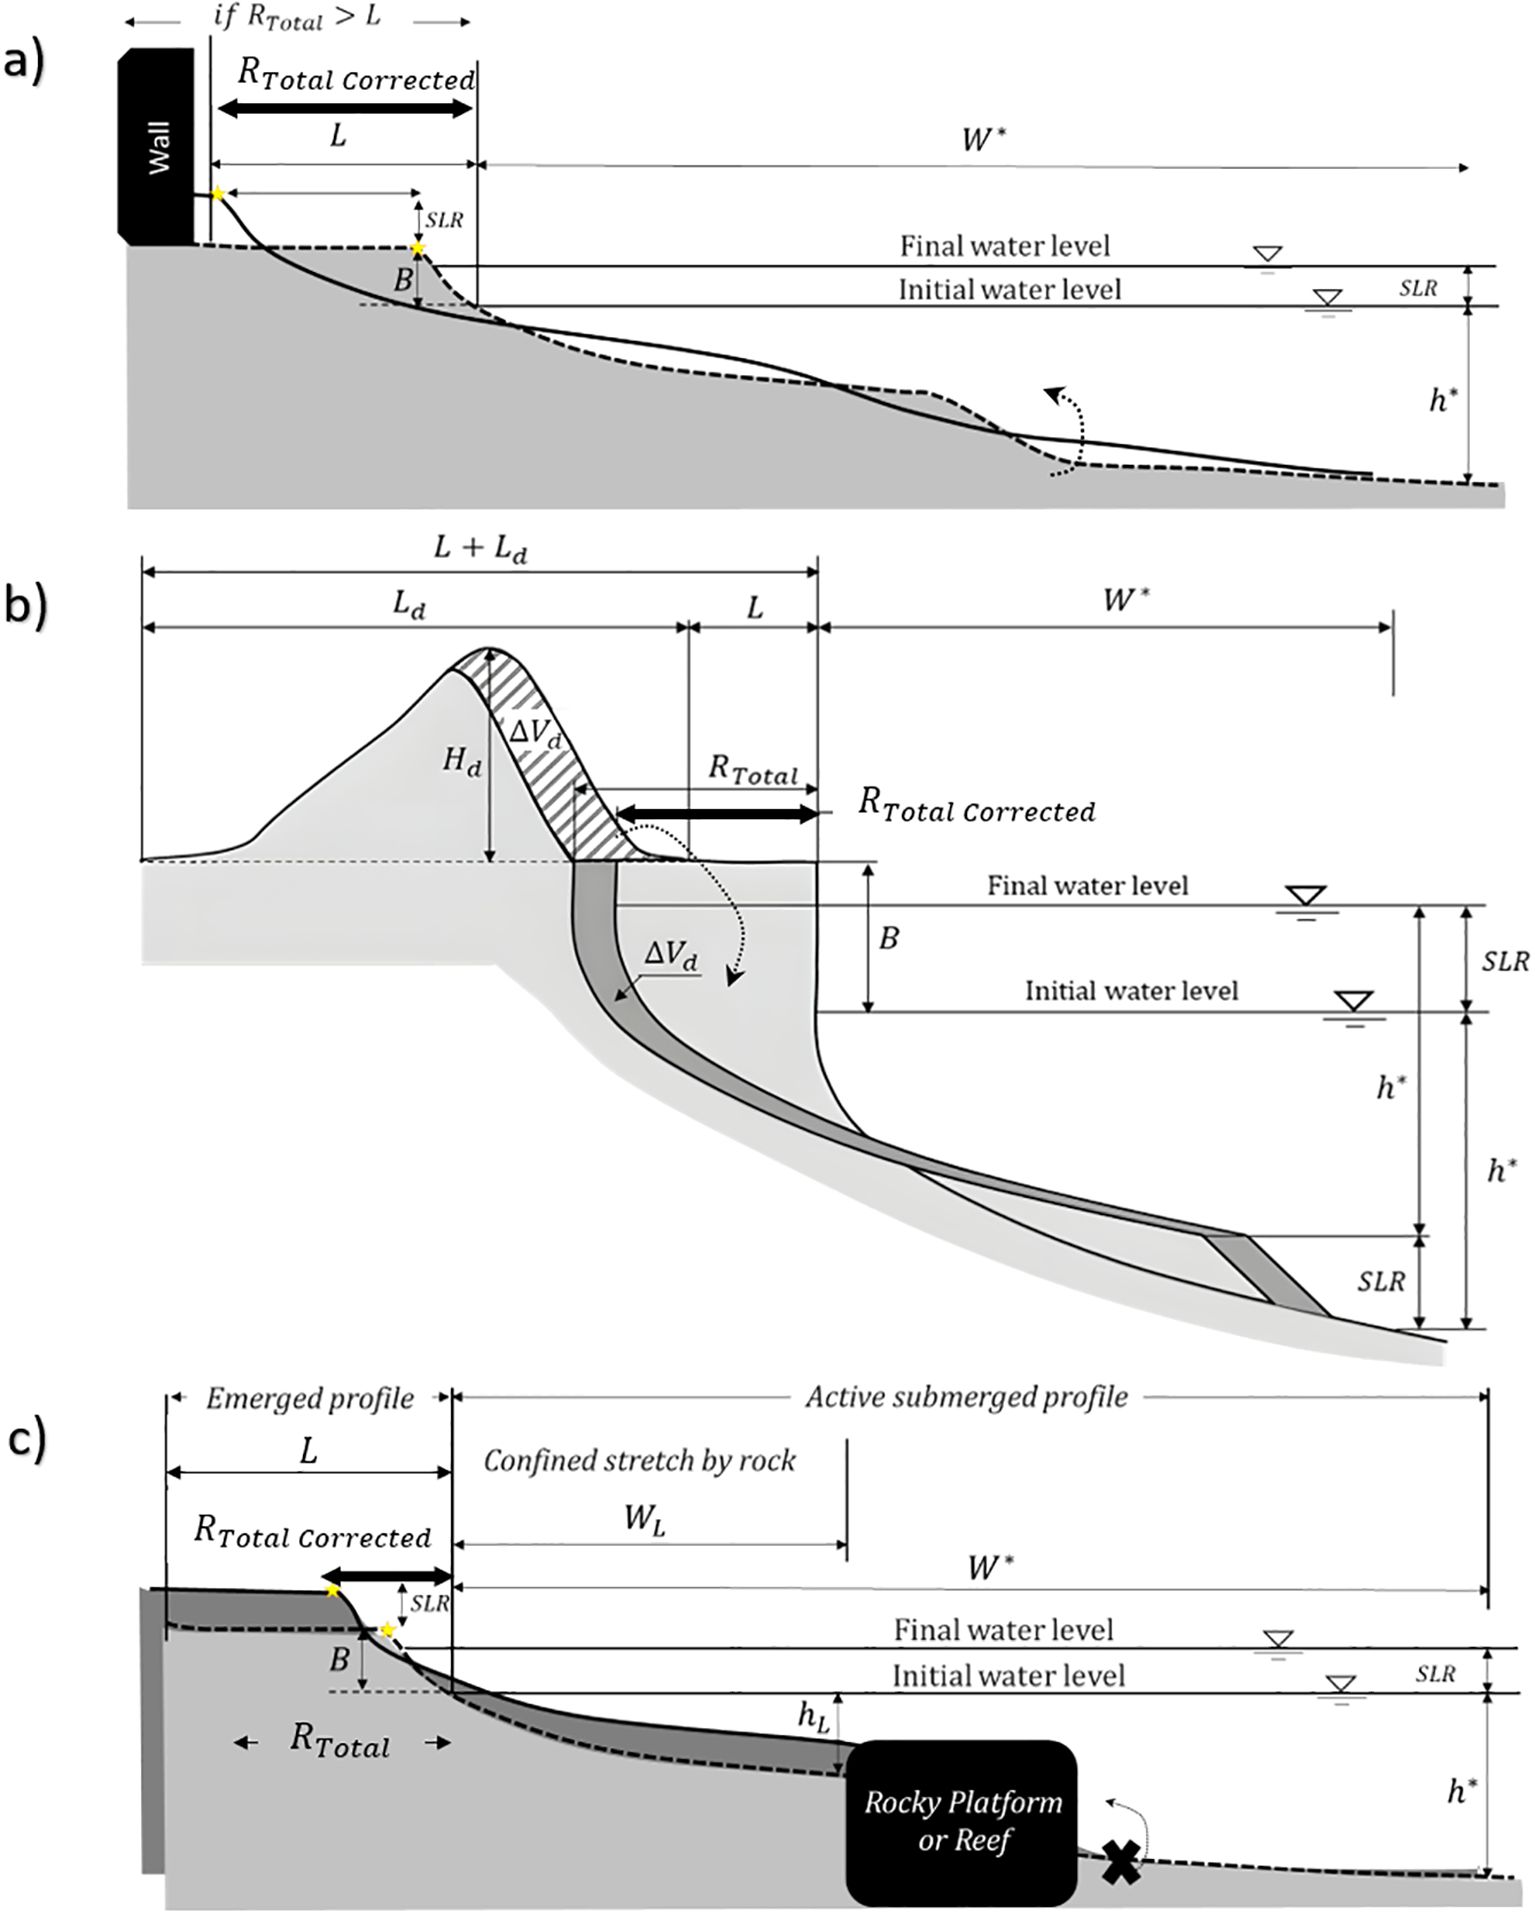
Figure 4. Adaptation purposed for (a) sea-wall ended beach profile, (b) dune-backed beach profile and (c) confined rocky platform or reef profile. Each sketch contains the relevant variables for shoreline retreat in these environments.
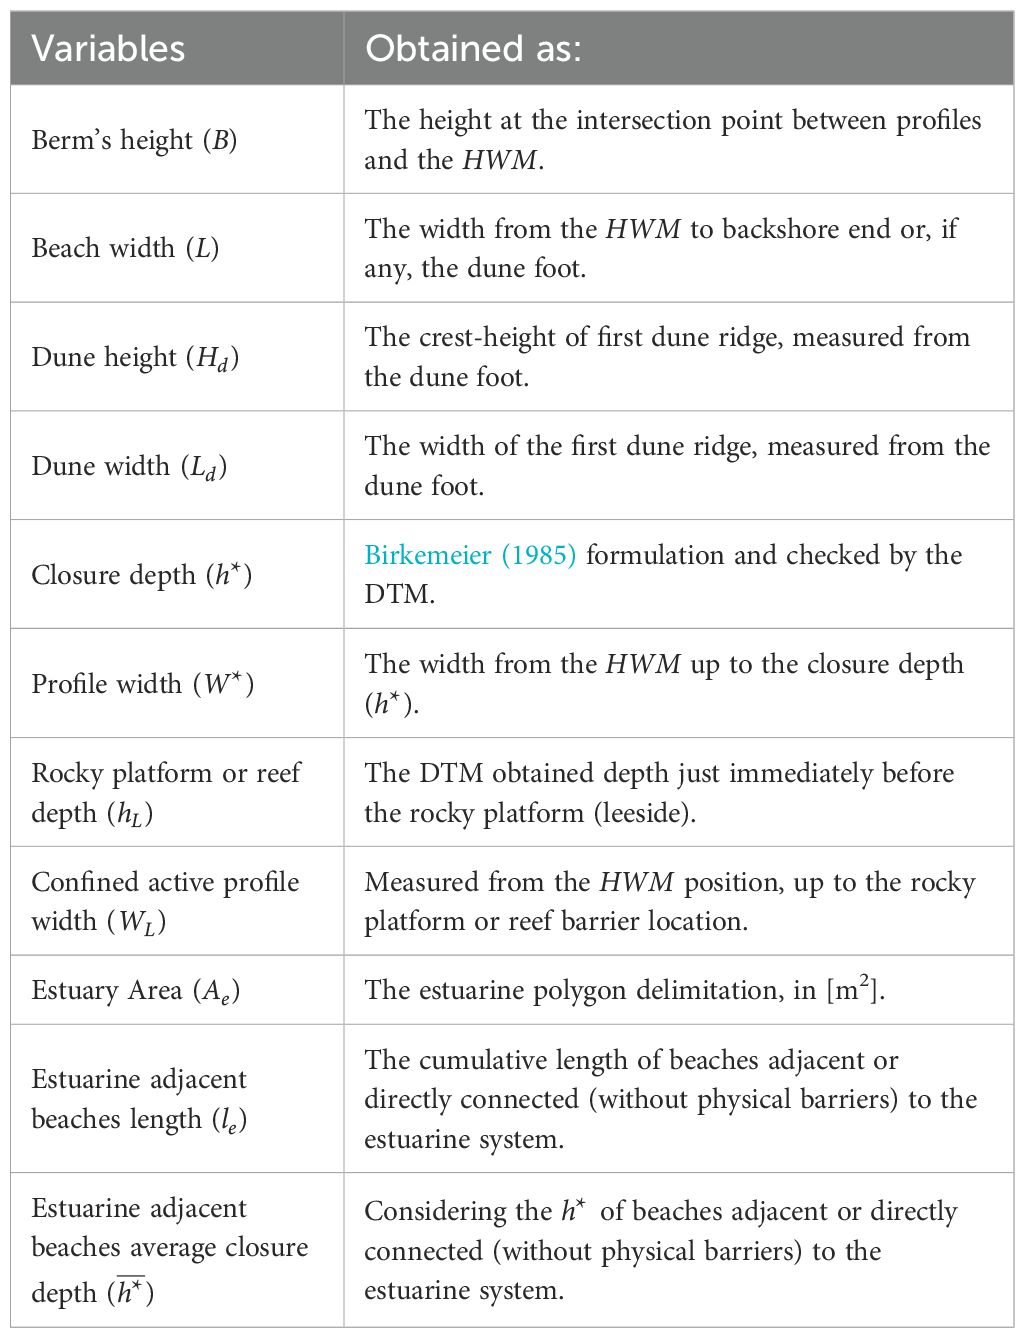
Table 1. Coastal variables derived from topobathymetric data. All units are in [m], except indicated.
3.1
According to the Bruun Rule, the profile is considered to move landward and upward in response to the SLR without changing its form and shape. This is the basis of our estimates and it is computed with the original Bruun Rule formulation, aforementioned in Equation 1.
3.2
The formula proposed by Bruun (1962) does not account for the volume of sand necessary to fill the dry beach () after the translation due to a SLR. Assuming the Bruun hypothesis that there is no sediment flux from > (landward transport) and no sediment unbalance longshore, the amount of sediment necessary to fill the dry beach must come from the inland area, which means an additional retreat to fill the upper beach profile. Considering this, Rosati et al. (2013) expressed the total retreat in a single formulation that combines the classical Bruun translation with the additional retreat needed to fill the dry beach (Equation 3:
In this study, we explicitly decouple these contributions, retaining the Bruun component and isolating the berm-related term . The latter is computed from the volume of sand required to fill the dry beach, VD, via Equation 4, where VD is obtained from Equation 5 using the dry-beach width L, and a 1-m alongshore unit width. Thus, , which allows the berm contribution to be evaluated independently of the Bruun component.
3.3
When the sea-level rises, estuaries tend to restore their equilibrium position, requiring sand to fill the volume of the interior tidal flats and restore the original bathymetry. This process, known as basin infilling, was descripted by Ranasinghe et al. (2013). The sand demand to fill the estuary after can come from river discharges on the estuary and from the beaches nearby the estuary mouth. This leads to an additional shoreline retreat term in profiles located nearby or adjacent to estuary basins, hereafter referred to as . According to Toimil et al. (2017), the can be obtained using Equation 6 and Equation 7:
where is the required sand volume (basin infilling), is the estuary area [m2], is the tidal flat growth (inside the estuary) [m], is the length of the adjacent beaches [m], is the berm height [m] and is the average depth of closure of beaches adjacent to the estuary.
3.4
This component represents all shoreline−change trends not caused by SLR, whether erosive or accretional, such as sediment−budget imbalances, alongshore transport gradients, or coastal engineering works. Grounded on the formulation of Ferreira et al. (2006), non‐SLR ‐driven shoreline change is quantified by recent Shoreline change rates () derived from aerial‐photograph analyses over the period 2001 to 2013. The use of a decadal time scale (6–11 years) for shoreline change analysis is sufficient to integrate most of the long-term causes of coastal evolution and largely reduces the influence of short-term shoreline fluctuations due to, for example, the effects of inter-annual storms. Ferreira et al. (2006) show that “if the main factors and processes responsible for recent and current variations in the movement of the shoreline do not change in the near future and there are no major change in nourishment interventions, a future shoreline position can be estimated by multiplying the obtained by the number of years of interest”. Accordingly, the contribution of () from processes unrelated to SLR is then estimated as presented in Equation 8:
where [m yr-¹] denotes the 6–11-year shoreline change rate and [years] is the interval from the present to the target horizon, under the assumption of a constant rate. Positive trends (0), indicate erosive rates, while ( 0) indicate accretional trends. It is important to note that significant accretion rates (large negative values) can reduce, mask or even reverse the shoreline’s retreat trend due to SLR.
3.5 Considerations about site-specific local characteristics
Along the Andalusian coast, certain typologies of profiles present local features that can alter the magnitude of shoreline retreat predicted by the general formulations discussed thus far. To address this issue, specific adaptations are introduced in this section to incorporate two key site-specific features: i) the backshore type and ii) the presence of rocky platforms, reefs or similar barriers below lower than the closure depth, . These accounts for sea-wall or cliff-ended profiles, dune-backed beach profiles or confined rocky profiles by physical barriers.
Out of the 1281 profiles analysed, 380 (30%) were affected by some of these conditions, while the remaining 901 (70%) were evaluated directly without modifications. This section focuses exclusively on the subset of profiles for which such specific adaptations were necessary.
Figure 4 shows a schematic overview of the beach profiles considered, illustrating the three different types of backshore and seafloor conditions accounted and incorporated into the CoShReW calculation formulae.
3.5.1 Type of backshore
The presented workflow distinguishes between two backshore types (Figure 4): (a) profiles ending in rigid structures such as cliffs, seawalls, or promenades, and (b) dune-backed beach profiles or similar sedimentary accumulations on their backshore.
For profiles ending in rigid constrains like sea-walls or cliffs, once sediment from the dry beach is fully eroded and the shoreline reaches the rigid backshore limit, the assumptions underlying the Bruun Rule no longer holds, and the shoreline retreat cannot be estimated using the standard formulations. Under this condition, shoreline retreat estimation is physically constrained and limited by the amount of dry beach width L. Accordingly, we limit total retreat through a correction (), as defined by Equation 9:
In profiles with dunes on the backshore, if the shoreline retreat reaches the landward limit of the dry beach (), the dune sediment budget can partially offset the total retreat, assuming that the sand eroded from the dune will be redistributed across the active beach profile. This affects the total shoreline retreat, which is corrected using Equation 10, as follows:
where is the height of the first dune ridge, see the sketch in Figure 4. Note that is the potential volume of sand transferred from the dune to the submerged profile.
To limit the estimates to the area of the dune, the calculation with equation Equation 10 is maintained until the dune is completely eroded, that is, when is limited to the dune sediment available, establishing the maximum retreat (), where and are the dune and beach widths. Limiting shoreline retreat to the beach width (in the case of a seawall) or to the end of the dune ridge does not imply that erosion ceases; rather, it indicates that the presented workflow is no longer applicable.
3.5.2 Type of seafloor
In profiles where the presence of rocky platforms or reef barriers is in between the shoreline and the closure depth, as illustrated in Figure 4C, the active submerged active profile is effectively constrained by the seafloor obstruction and only the shallower, rock−confined stretch can be adjusted to SLR. Consequently, the extent of the active profile is shorter than would be calculated using the full active profile extension up to the closure depth. In such cases, the total shoreline retreat must therefore be calculated with the limiting depth and width of that segment (and ), rather than with the conventional closure depth and the active beach profile width (and ). For profiles exhibiting this condition, the value of and are replaced by and in Equations 1, 4, 6, and 10 to ensure more accurate estimation of the expected shoreline retreat.
Failing to account for this can lead to overestimations in shoreline retreat, particularly in areas where sediment transport is naturally limited by geological constraints. The High-Water Mark (), the Low Astronomical-Tide () and the contact backshore/foredune, cliff foot or line of infrastructure () levels were used as vertical and horizontal references respectively, which are the most widely used proxies for this kind of analysis (Díaz-Cuevas et al., 2020). According to Crowell et al. (1991), is one of the most consistently detectable and measurable shoreline indicators along the beach. A summary of all extracted topobathymetric variables used for these adjustments is provided in Table 1.
4 Results
This section contains a general overview of the obtained results in both assessments (the PCA component analysis and the shoreline retreat analysis) on the study area, followed by a summary of the key findings for each case. The site-specific considerations in both assessments are highlighted, along with a concise description of the main outcomes. Finally, a sensitivity analysis allowed to identify the differences in the future shoreline retreat response, according to the different profile types.
4.1 Principal component analysis
Based on the classification results of the first stage (hydrodynamic PCA), four distinct clusters were identified, representing four characteristic coastal archetypes along the Andalusian coastline. On the following section, Figure 5 illustrates the spatial distribution of the four identified classes, while Table 2 presents the mean, minimum and maximum values obtained for each class, giving a visual summary of its variability. The four groups of profiles were defined as follows:
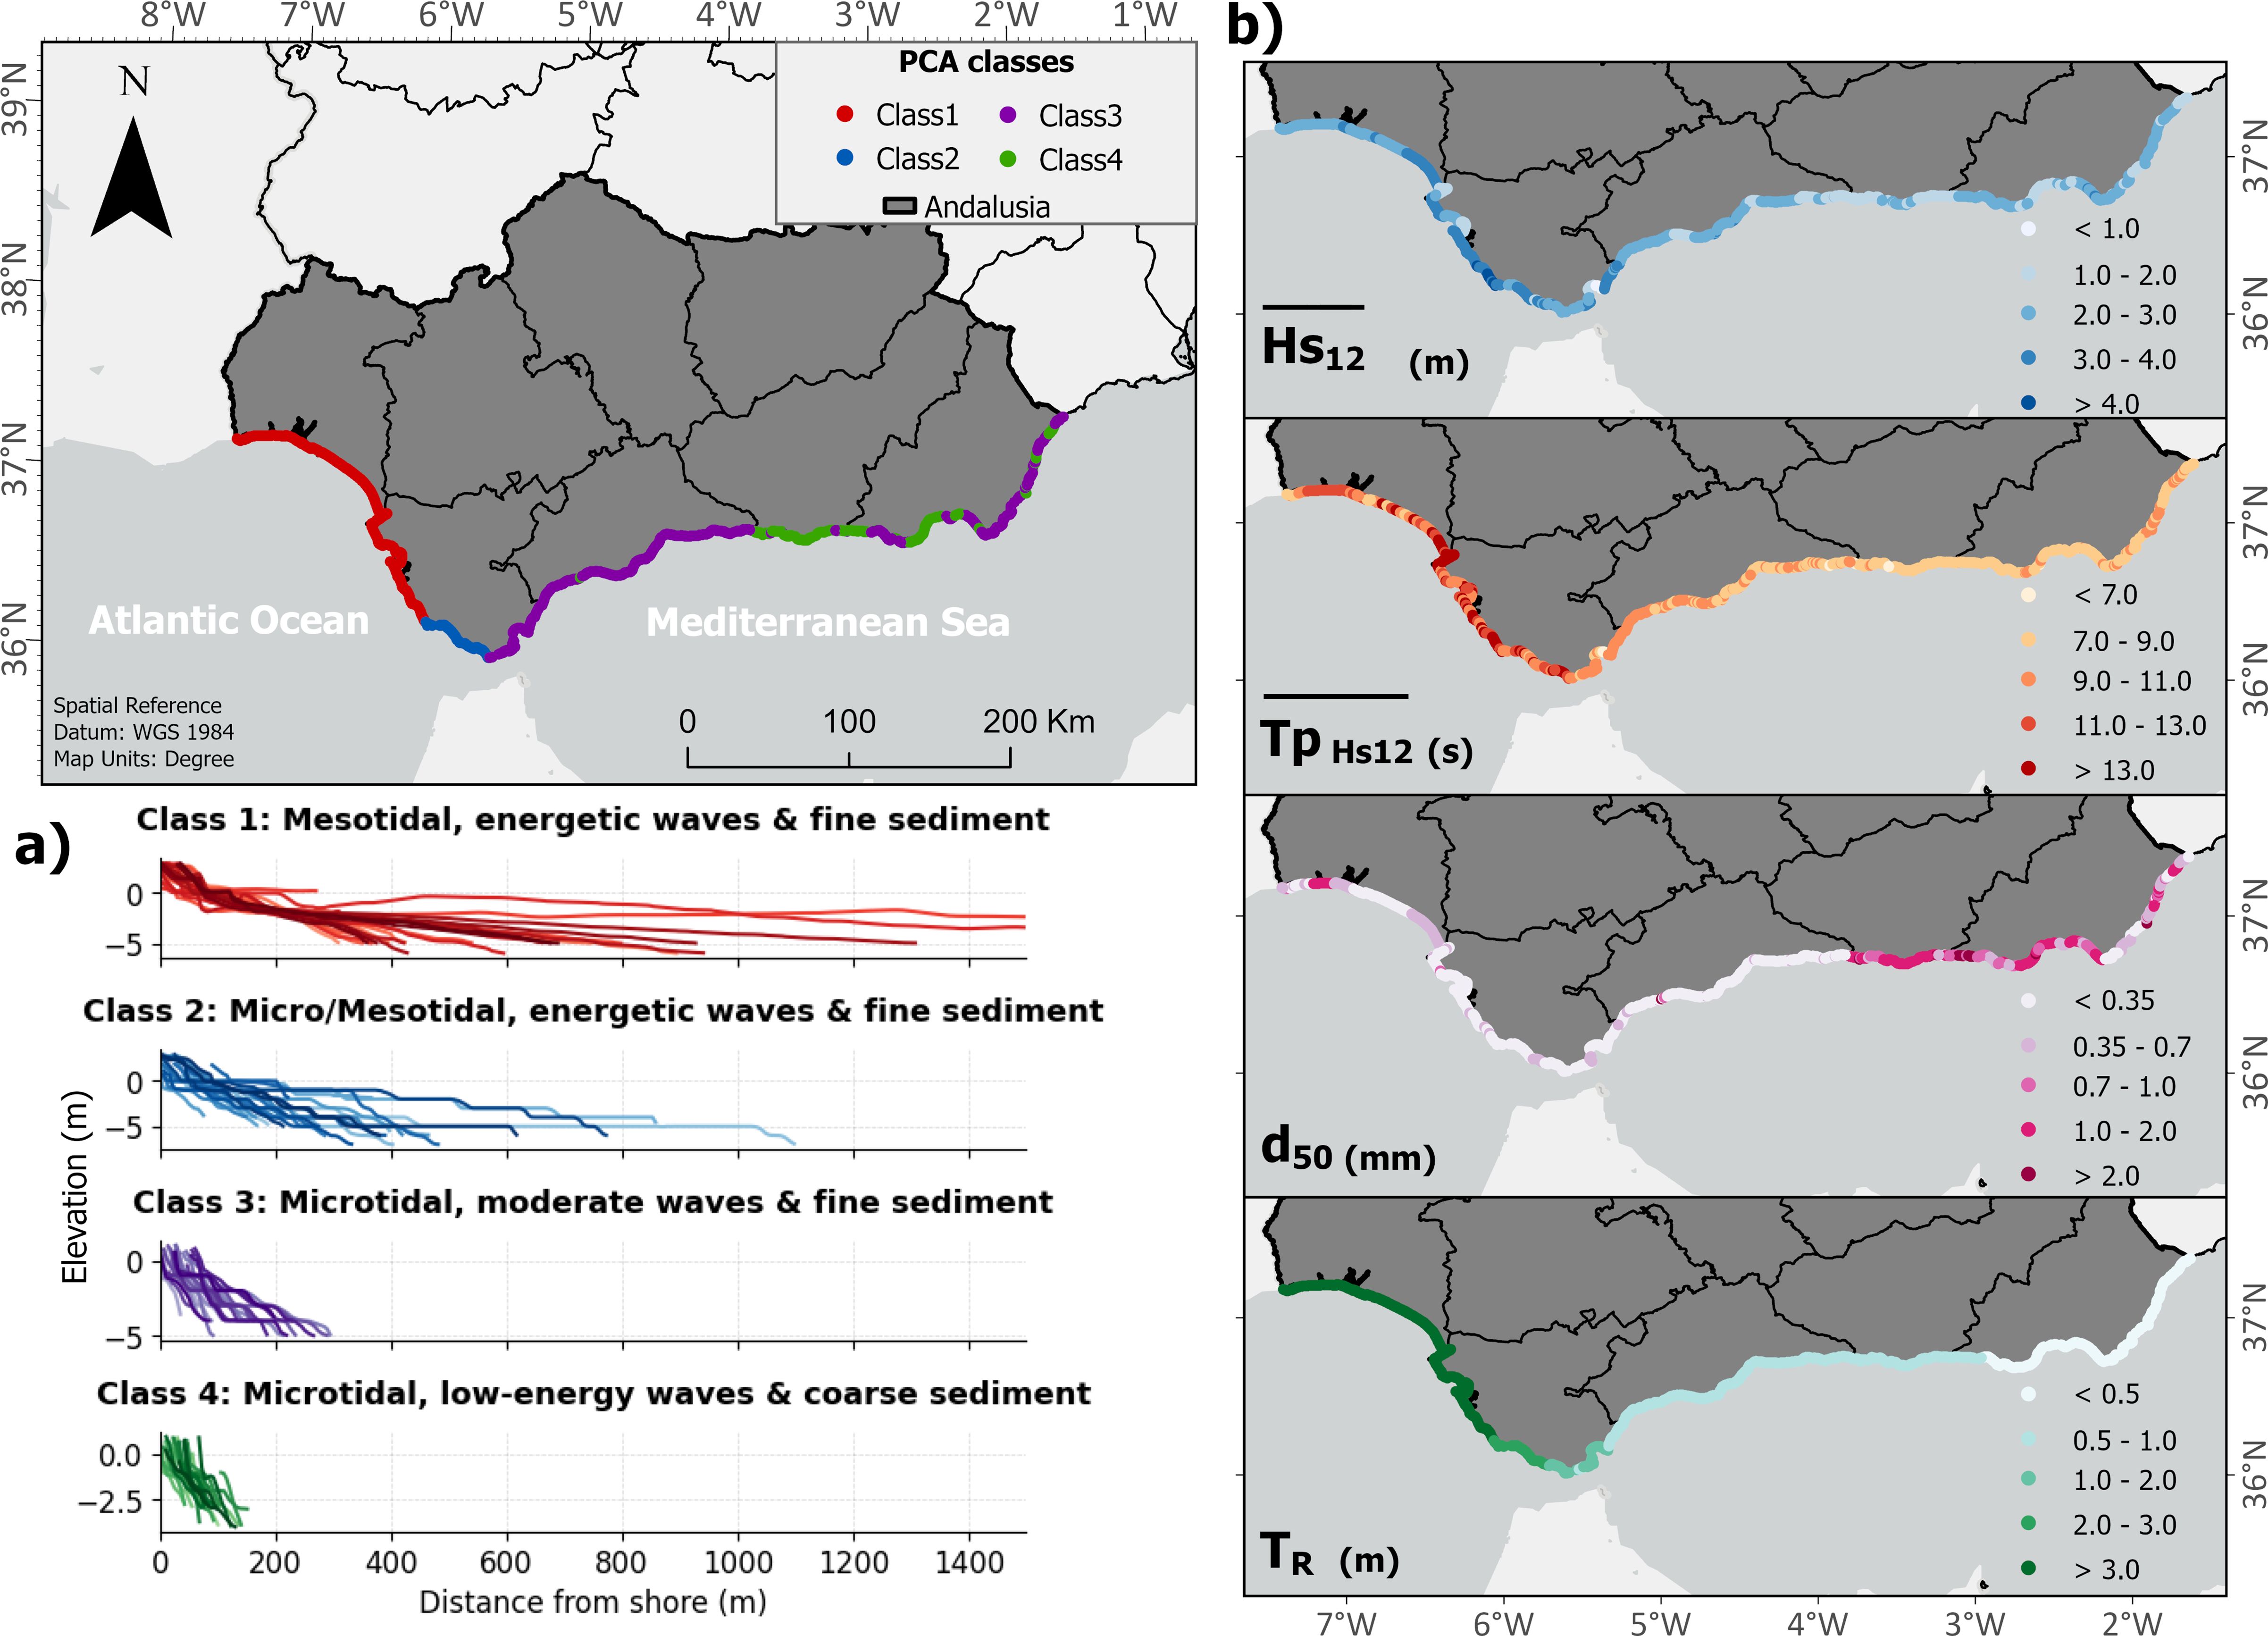
Figure 5. (a) Detail of profiles and spatial distribution of each PCA class along the Andalusian coast, based on (b) its morphodynamical variables.
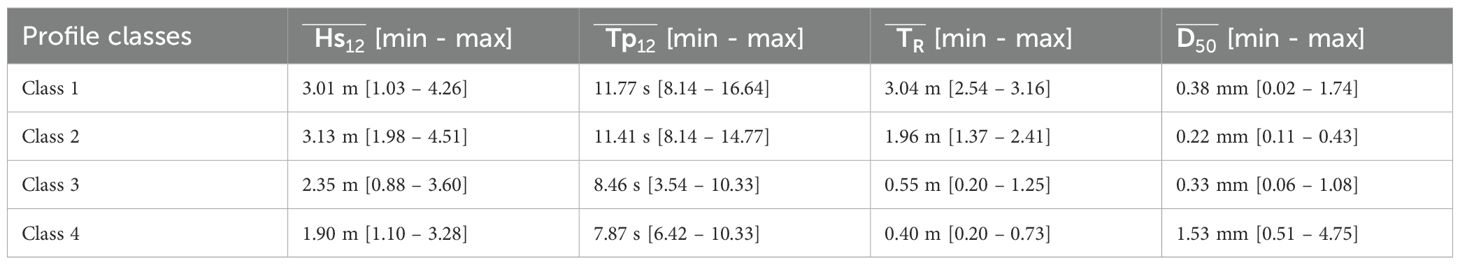
Table 2. Morphodynamical variables obtained for the four classes of profiles.
● Class 1: Mesotidal beaches with energetic wave conditions and fine sediment.
● Class 2: Micro and mesotidal beaches with energetic wave conditions and fine sediment.
● Class 3: Microtidal beaches with moderate wave energy and fine sediment.
● Class 4: Microtidal beaches with low-energy waves and coarse sediment.
A total of 1281 coastal profiles were analysed, resulting in the following distribution: 451 profiles in Class 1, 251 in Class 2, 402 in Class 3, and 177 in Class 4. The spatial distribution of the four profile classes, while differing slightly in total number of profiles, is generally homogeneous along the Andalusian coastline—particularly for Classes 1, 2, and 3. These three groups show well-defined and continuous coastal segments that correspond closely with regional wave and tidal regimes. Class 1 and 2 profiles dominate the Atlantic front, while Class 3 is widespread across the Mediterranean coast. In contrast, Class 4 stands out as a spatially isolated group, concentrated in a very specific sector embedded within the broader distribution of Class 3 profiles. This distinct localization closely aligns with the occurrence of profiles exhibiting coarse sediment (d50> 2.0mm), suggesting a strong control of sediment type on profile behaviour in this region.
On the Atlantic coast, profiles fall into Classes 1 and 2, differentiated by tidal range—Class 1 being mesotidal and Class 2 including both micro- and mesotidal conditions. As shown in the right panels of Figure 5, both classes are characterized by energetic wave climates and fine sediments, but Class 2 generally exhibits a lower tidal range. In terms of profile extension, both Class1 and 2 lead to broader and more dissipative morphologies with longer active profiles (mean 500 m). Otherwise, profiles along the Mediterranean coast are generally characterized by smaller tidal ranges (< 1m), lower wave energy, and higher median sediment sizes values, up to coarse sand and pebbles. These profiles generally have low values and, consequently, are short (mean ≈ 200 m).
The consistency between spatial clustering and sediment distribution highlights the robustness of the classification and its potential for supporting coastal erosion assessments across contrasting coastal settings.
As a result of the second classification (morphological PCA) a total of 838 profiles were analysed and nine different groups of beach profiles with similar morphology were identified. Profiles with rocky slabs or nearby estuary basin profiles were excluded from this classification. Figure 6 shows the classification results in a 3x3 matrix. The normalised profiles of each class are shown in grey, and the representative profile of each class is shown in red.
![Nine scatter plots labeled as “Profile type” one through nine, each showing normalized profiles in grey lines with a representative cluster profile in red dashes. The y-axis is labeled “h/h_max [m]” and the x-axis is labeled “X/X_max [m]”. Each plot specifies a different number of profiles, ranging from five to 125.](https://www.frontiersin.org/files/Articles/1695289/fmars-12-1695289-HTML-r1/image_m/fmars-12-1695289-g006.jpg)
Figure 6. Classification results based on the morphological shape of the beach profiles. The N number represents the total amount of profiles identified in each group.
Both classifications can be also analysed together. For example, Figure 7 shows the heatmaps of cluster-mean morphodynamic parameters used in both classifications, where darker colours indicate higher values within each parameter range. These panels illustrate the relative distribution of conditions across the identified profile classes. Besides, combining Figure 5A) and Figure 8, the classification revealed clear spatial patterns along the Andalusian coast. Profile types 1, 3, 4, 6, 8, and 9 (Class3, in purple) predominate in the Mediterranean sector, where tidal range and wave energy are comparatively low and median grain size (d 50) is higher. These morphologies are characterized by low closure depths (ℎ*) and therefore short active profiles, with mean cross-shore extents (W*) of around 200 m.
![Six heatmaps display various metrics in shades of read. Top row (T.R [m]), (Hs12 [m]), (Tp12 [s]) with scales 1 to 2.5, 2.2, to 2.8, 8 to 11, respectively. Bottom row: (d50 [m]), (h* [m]), (W* [m]), with scales 0.6 to 0.9, 3.5 to 4.5, 200 to 1400, respectively. The darkest red indicates higher values.](https://www.frontiersin.org/files/Articles/1695289/fmars-12-1695289-HTML-r1/image_m/fmars-12-1695289-g007.jpg)
Figure 7. Heatmaps of cluster-mean morphodynamic parameters used in both classifications. Heatmaps are arranged according to the order of the profile classes (from left to right, top to bottom).
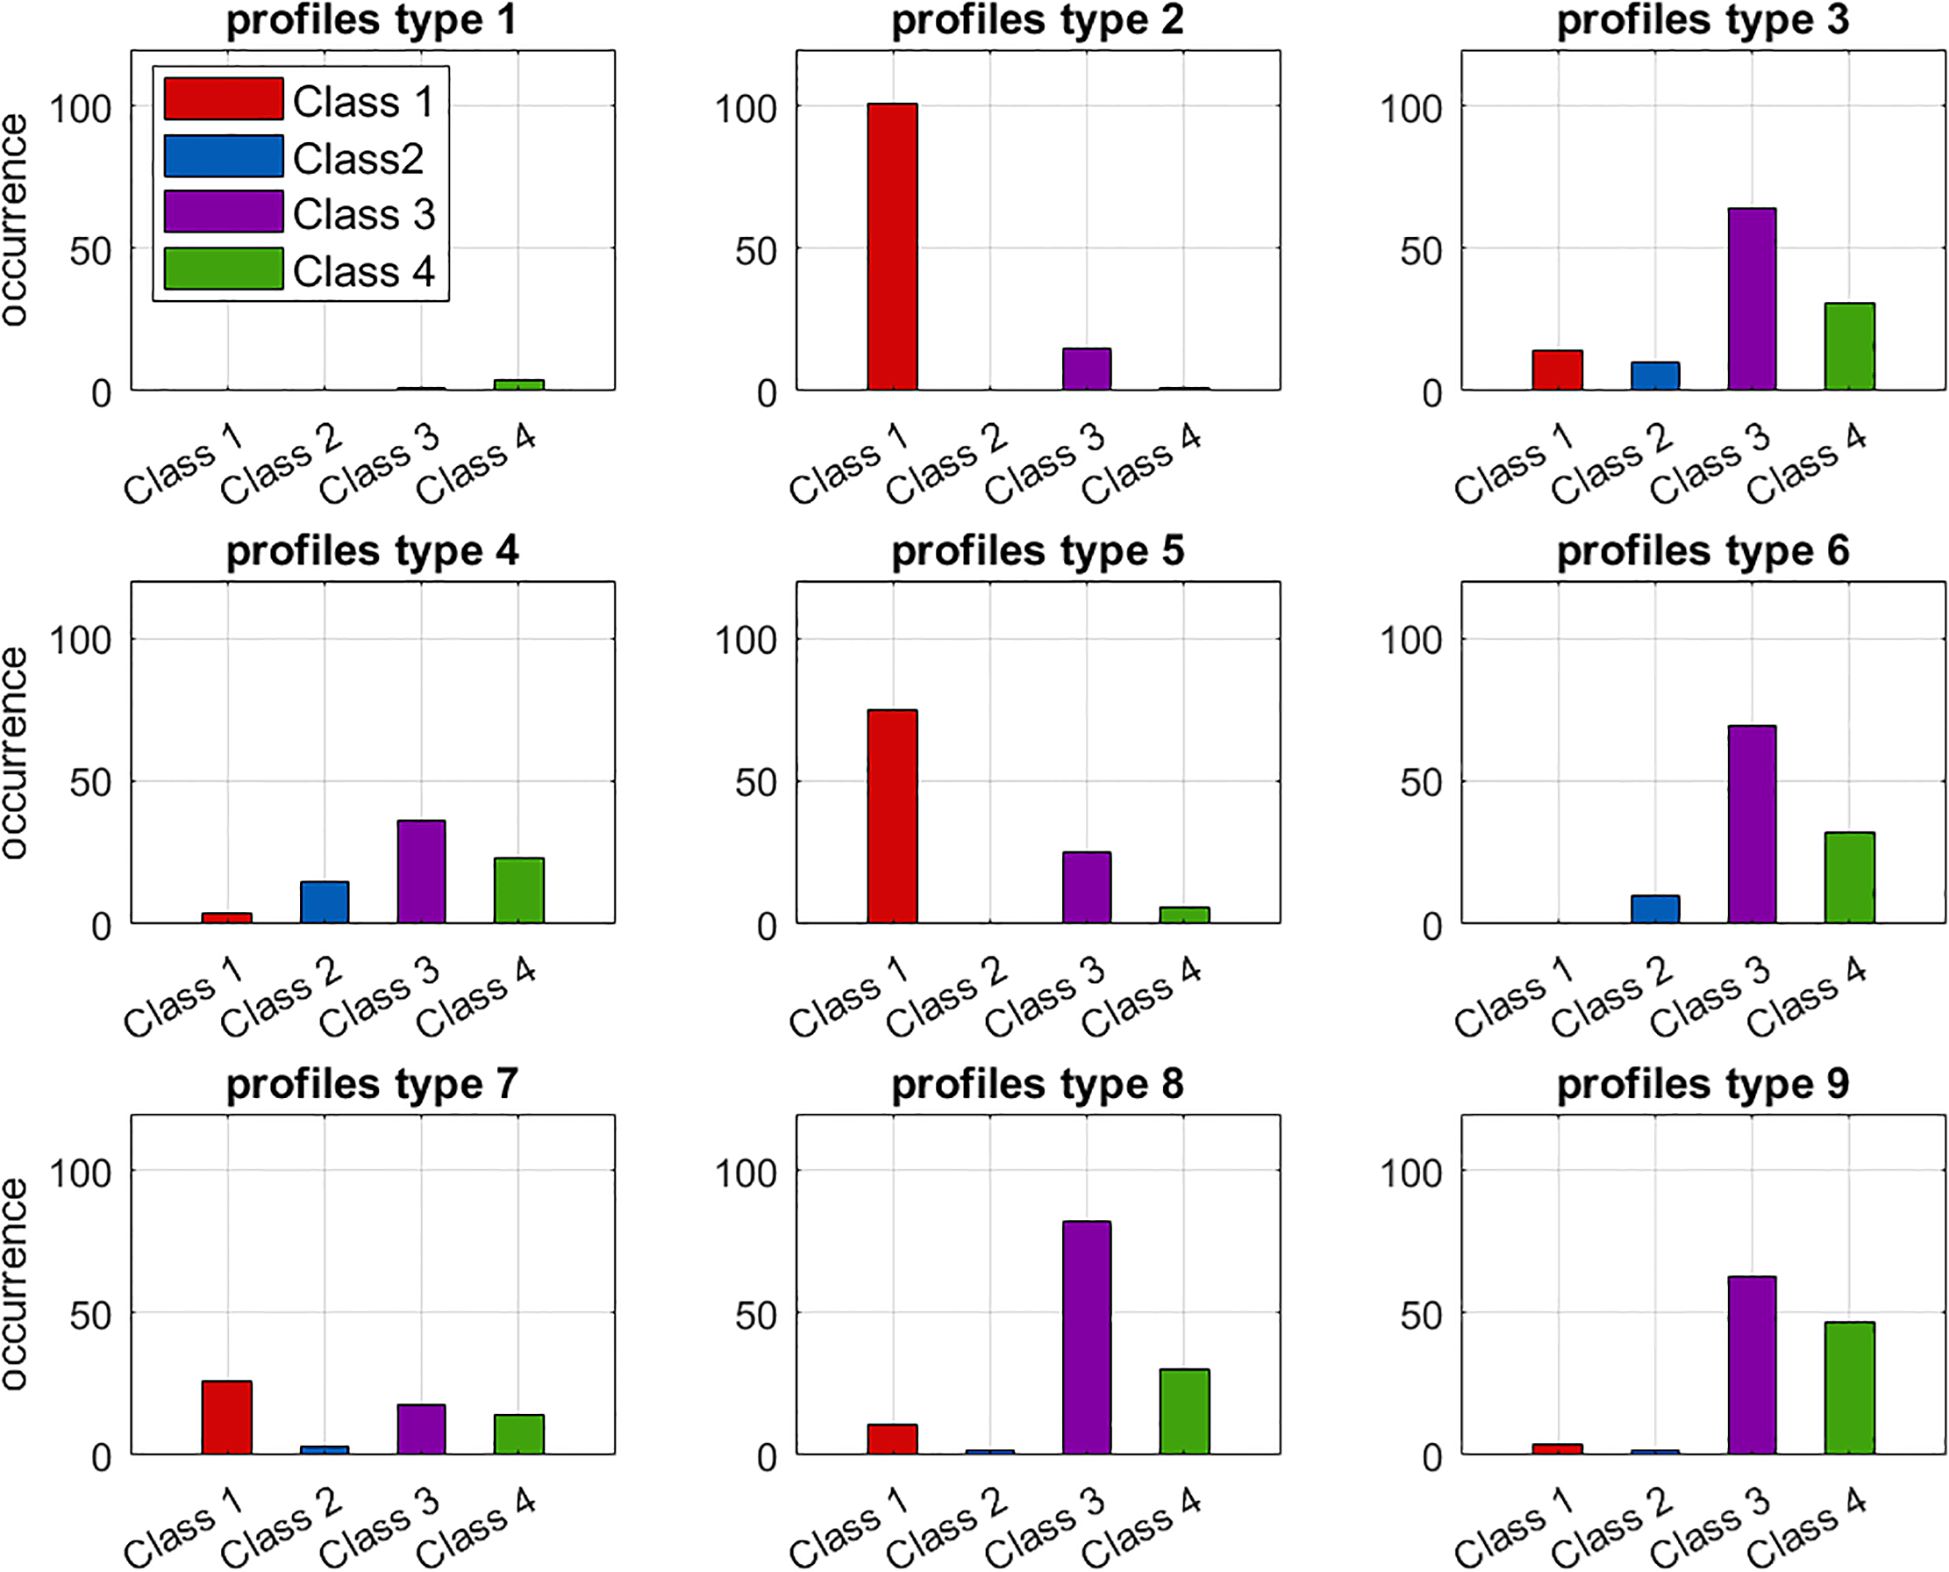
Figure 8. Bar cross-tabulation of hydrodynamic Classes 1–4 against morphological clusters (Types 1–9).
In contrast, profile types 2 and 5 (Class1, red profiles in Figure 5A) are mainly associated with the Atlantic coast of Huelva, where higher significant wave heights and peak periods lead to concave shapes (Figure 6) and more extensive active profiles (W* > 600 m) as well as greater tidal ranges (mean tidal excursion > 2 m). Profiles type 7, although less frequent, are distributed across the entire coastline. This group represents an intermediate morphology, combining high-energy forcing (Hs12 ≈ 2.9 m, Tp12 ≈ 11 s) with steep profiles (high ℎ*, low W*). These are concentrated along the Cádiz coast but can also be found sporadically in Málaga, Granada, and Almería. The geographical distribution of these nine profile types is consistent with the hydrodynamic gradients observed along the Andalusian coast and is summarized in Figure 5A).
4.2 Shoreline retreat
Following the described workflow, shoreline retreat () was first calculated for the years 2050 and 2100 using the simplified Equation 2 as the baseline. These initial estimates were then refined and adjusted using additional equations to account for specific coastal features, such as dunes, estuary basins or rocky platforms. Figure 9 and Figure 10 illustrate the results obtained at the 1281 cross-shore profiles along the Andalusian coast, corresponding to the projections under the IPCC SSP2-4.5 and SSP5-8.5 scenarios, respectively.
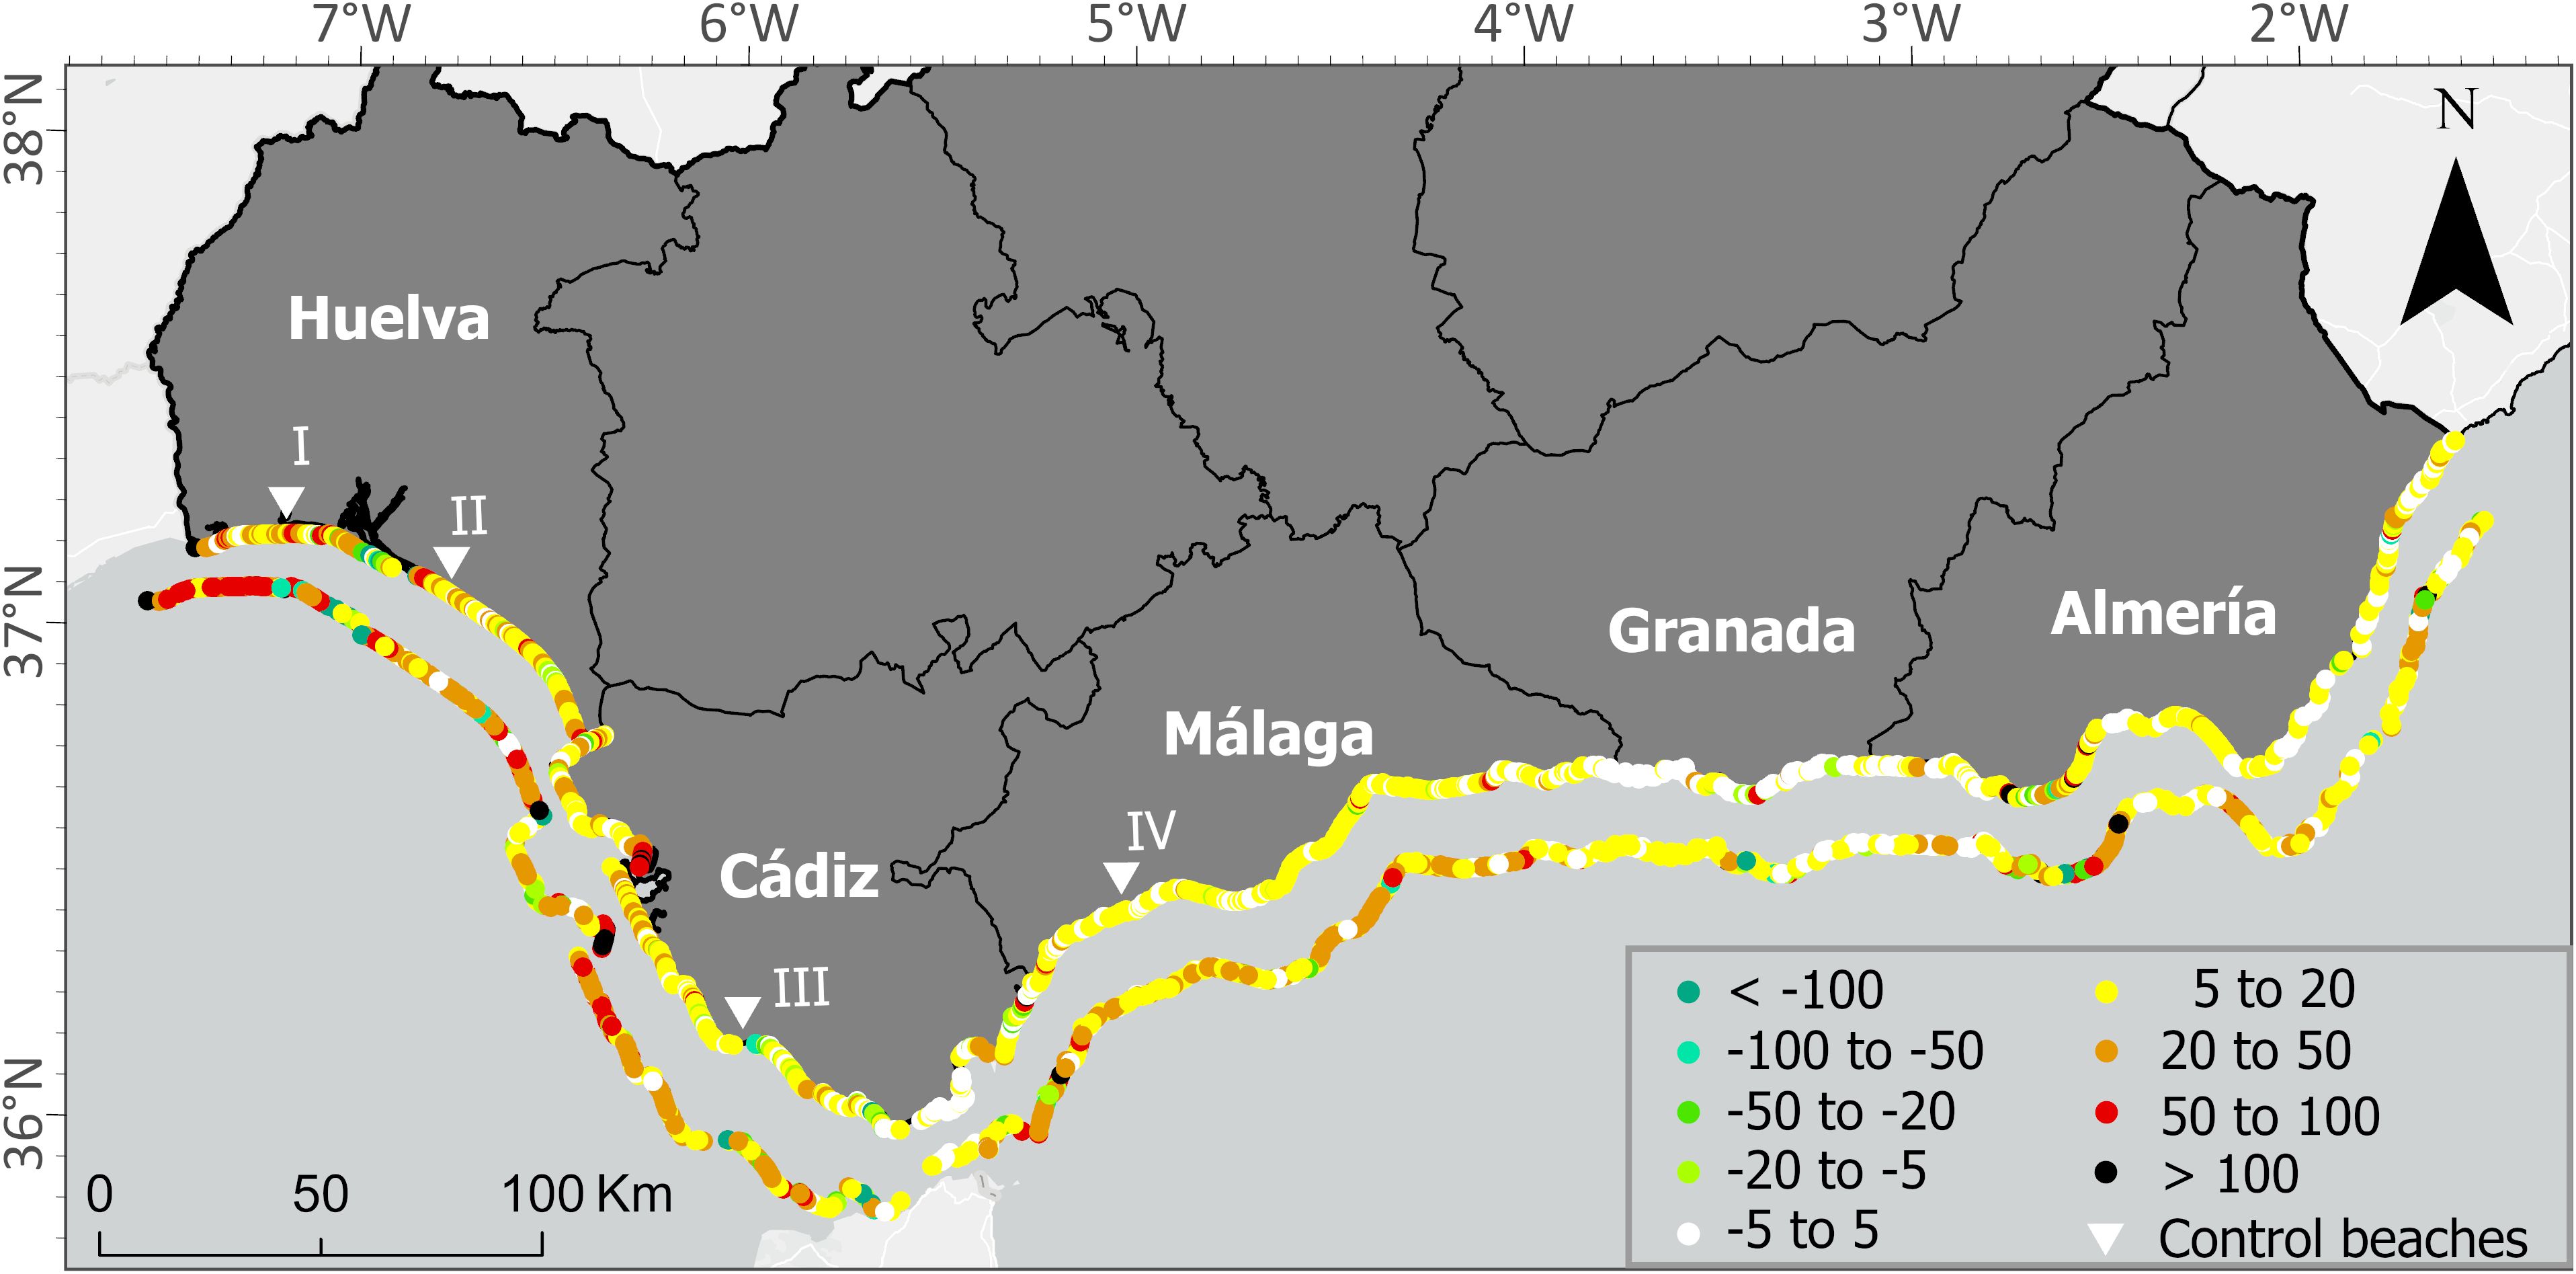
Figure 9. Total shoreline retreat () obtained for the year 2050 (near the coast) and 2100 (far from the coast) along the Andalusian coast, according to SSP2-4.5 scenario. Units in [m].
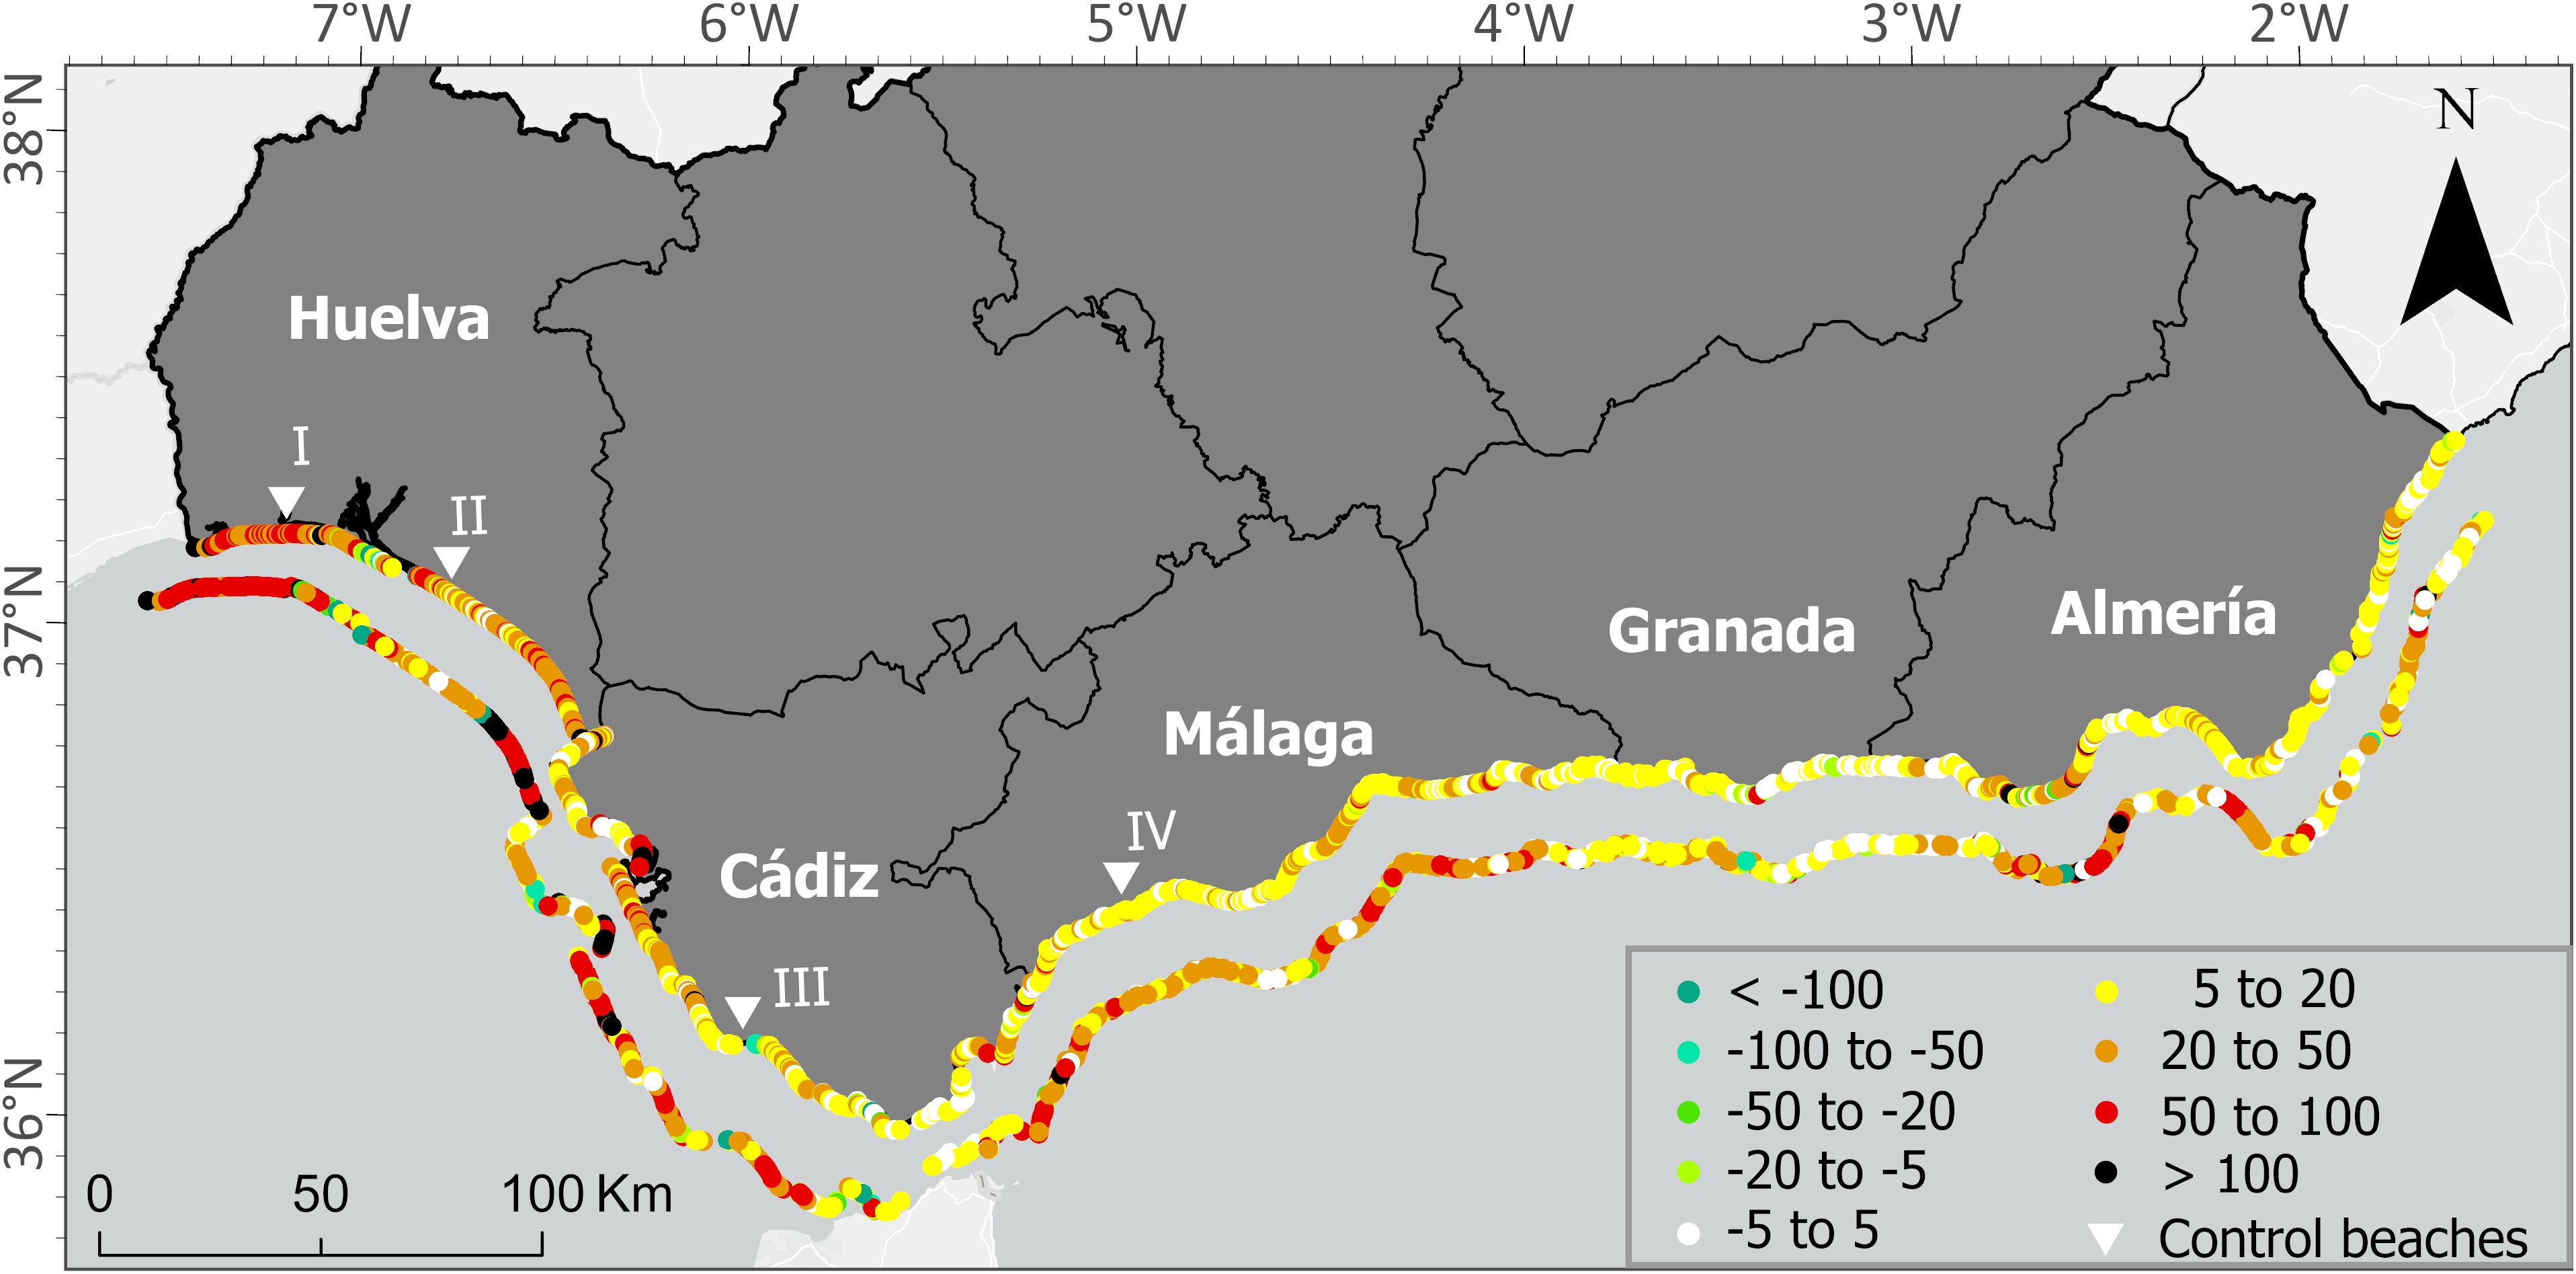
Figure 10. Total shoreline retreat () obtained for the year (near the coast) and 2100 (far from the coast) along the Andalusian coast, according to SSP5-8.5 scenario. Units in [m].
From the results, it is possible to identify areas where erosion hotspots are concentrated, revealing the zones that are expected to experience the greatest coastal retreat in the target years. For example, the coastline stretch of Huelva, is projected to experience a retreat of 21 to 66 meters by the year 2050, equating to an average shoreline retreat rate of approximately 1 m/year. The persistent erosive situation prompted the Ministry for Ecological Transition (MITECO) to approve nourishment projects (>700,000 m³) and the improvement of protective groynes on 2024. Other endangered coastlines include beaches of Vera, located in southern Almería, where recent sand nourishments (~50,000 m³) were required to mitigate flooding and wave overwash. In both figures, the projections for shoreline retreat by 2050 are represented in the upper layer, closer to the coastline, while the projections for 2100 are depicted immediately below. Additionally, four control beaches were selected for a detailed analysis of shoreline retreat patterns. The control beach names are: I: Nueva Umbría, II: Matalascañas, III: Peginas and IV: El Charcón. Nueva Umbría and Matalascañas were selected as examples of dynamic extensive sandy beaches ( > 30 m), located near estuaries with dunes in the backshore. On the other hand, Peginas and El Charcón beach present narrow beach widths ( ~10 m) and rocky morphologies.
In both scenarios, the values of shoreline retreat vary from a few meters (white spots in Granada and Almería) to over 100 meters (e.g., black and dark-red spots along the shoreline of Huelva, Cádiz, and Málaga). Figure 10 shows greater shoreline retreats than Figure 9, as the SSP5-8.5 scenario (SLR ~0.6–0.8 m) is worse than SSP2-4.5 (SLR ~0.24–0.26 m). The results clearly show the difference in terms of the wave climate’s impact between the Atlantic and Mediterranean coasts. Consequently, the Mediterranean sector, being subjected to less energetic dynamics, generally presented lower beach mobility compared to the Atlantic sector.
Furthermore, high shoreline retreat values seemed to be strongly related to beach slope (see Figure 5A), as longer and more gently sloping profiles require larger volumes of sediment to return to equilibrium after SLR. This explains the 50–100 m of retreat observed in certain profiles from Huelva, which are characterized by long profiles (> 800 m) and gentle slope values. In most cases, the additional retreat for berm filling was less than 5 m. However, particularly in short profiles (< 300 m) with extensive dry beach widths ( > 30 m) and/or high berm elevations ( > 2.5 m) and where berm filling requires more sediment than equilibrium profile adjustments, this term can contribute with >10 m of additional retreat, highlighting the importance of considering this type of process. The estuarine retreat term was notable in 252 profiles. Beach profiles nearby estuaries with small volumes (e.g., estuaries from southern Málaga) presented lower values, compared to those located nearby larger estuaries, (e.g., estuaries from Huelva and Cádiz), where exceeded 15 m in some cases.
Critical erosion hotspots ( > 100 m) considering mid-term shoreline change rates, were identified in Matalascañas beach in Huelva, Punta de Los Toruños in Cádiz, and Levante Beach on Almerimar, Almería, in agreement with previous studies (CEDEX, 2013; Gomes da Silva et al., 2022; MITECO, 2019). These locations are particularly vulnerable to local erosive processes, as the reduction in sediment supply due to the littoral drift is interrupted by the effects of coastal transversal infrastructures, exacerbated by the sedimentary deficit due to the regulation of the basins. An extreme case is the Almerimar Port with erosion rates of up to 10 m/year (Campos and Zújar, 2024), a problem that will likely worsen in the future.
A summary of the shoreline retreat results from the four selected control beaches is presented in Figure 11. Note that the vertical axis scale differs between the two upper panels, so absolute values should not be compared directly.
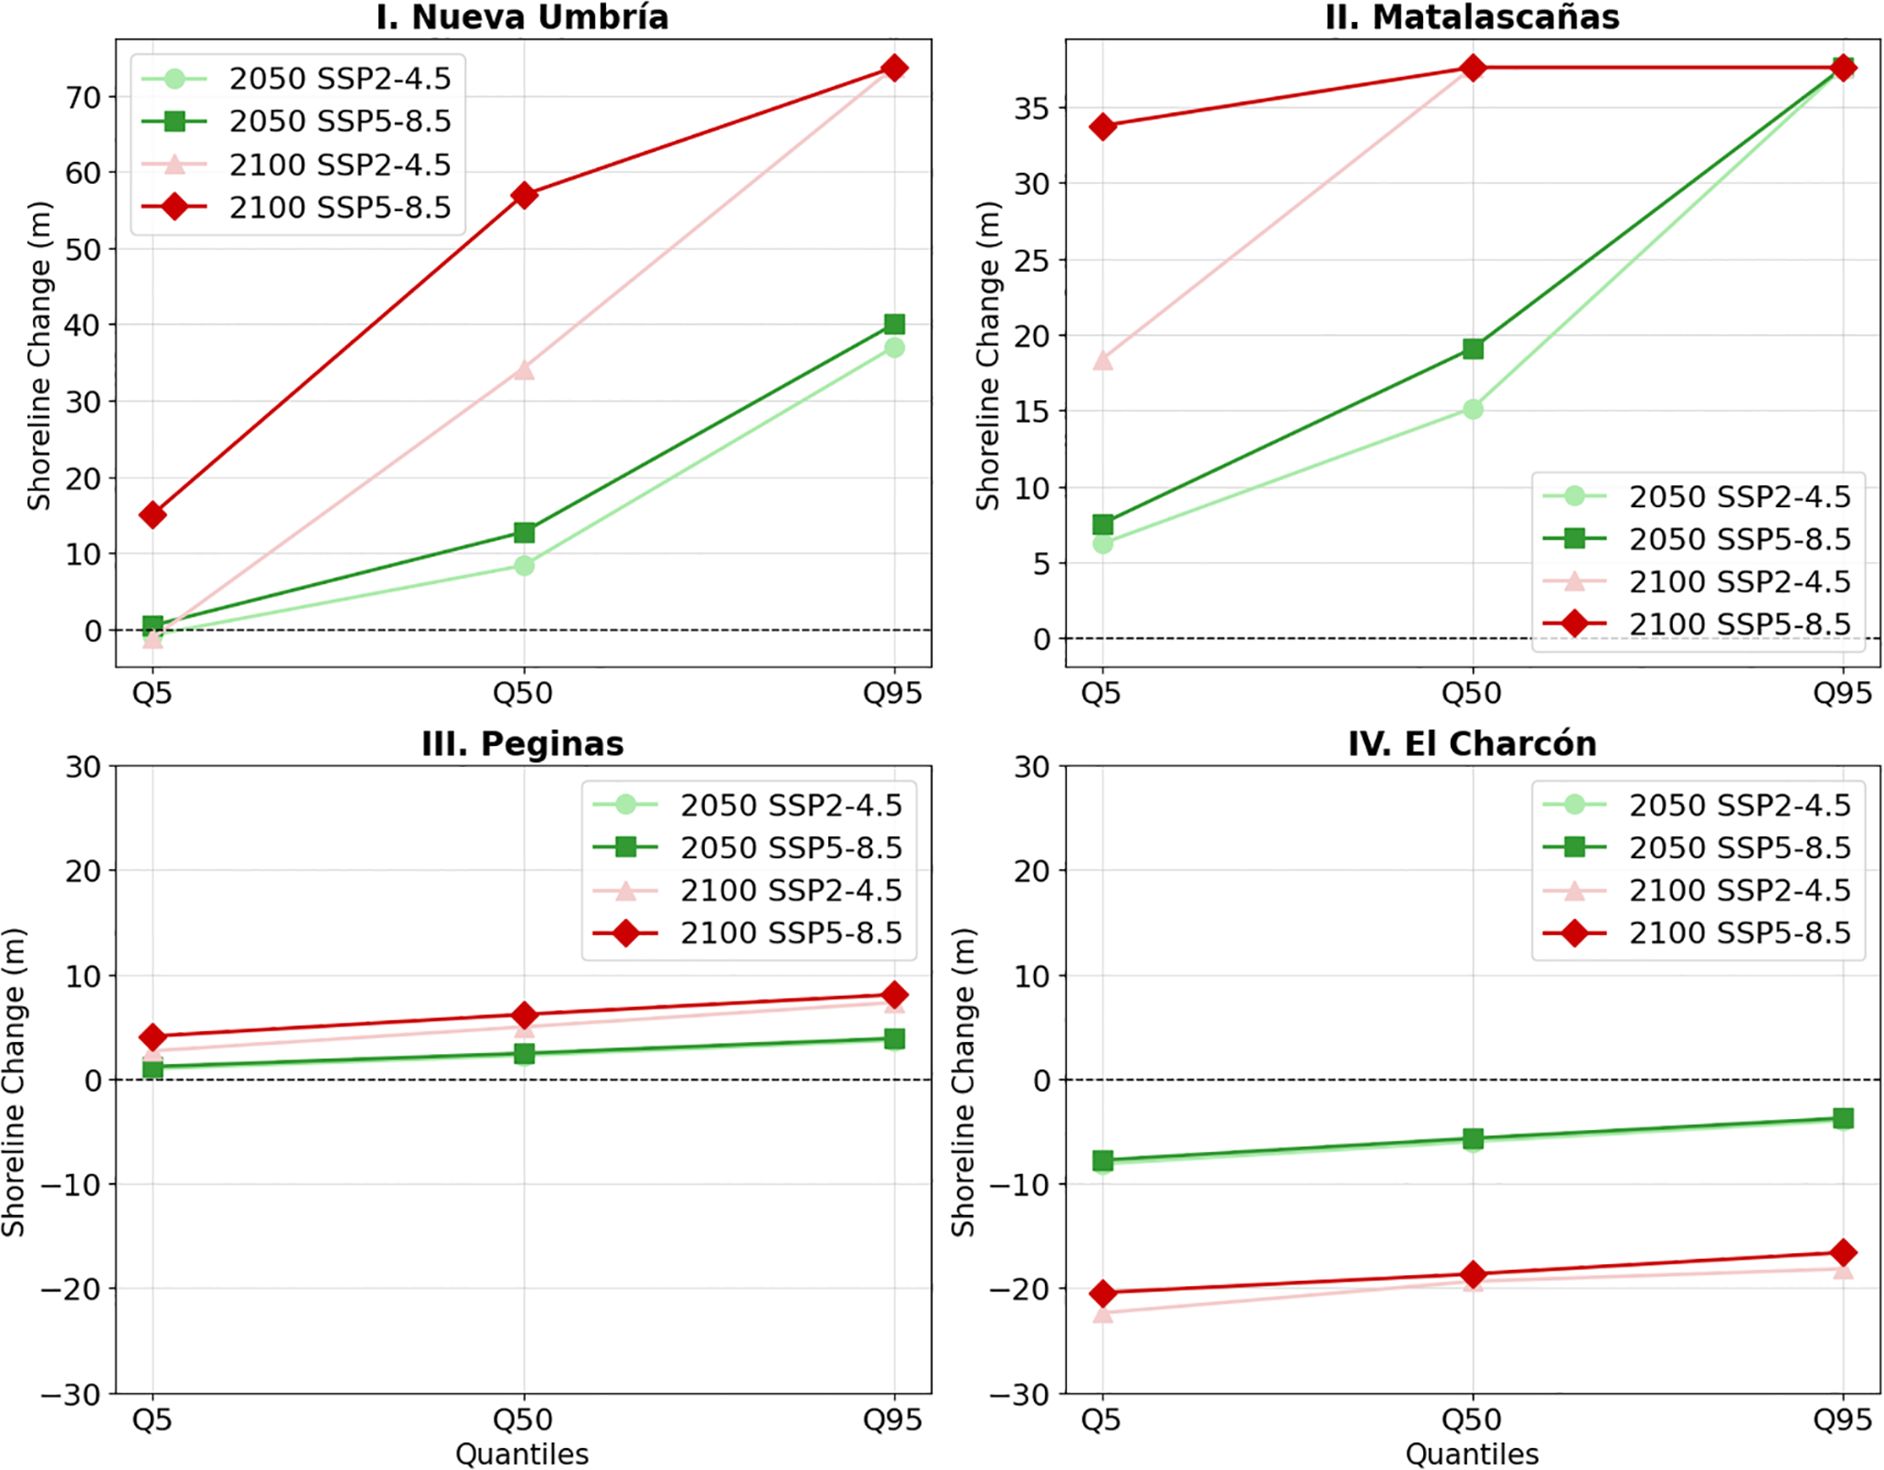
Figure 11. results applying SLR values related to quantiles Q05, Q50, Q95, at the four control beaches. Note that, positive values indicate an erosive trend and negative values indicate an accretion trend.
The results demonstrate the distinct shoreline responses among the four beaches under different SLR scenarios, time horizons and quantiles. Nueva Umbría beach, located in Huelva, is a potential future erosion hotspot along the Andalusian coast. Visible on Figure A3.1, this beach features a dune-backed profile and is simultaneously affected by the Guadiana & Carreras and Piedras estuaries. With a beach width of 33 m backed by a large dune field ( > 3.2 m and > 42 m), it presents a change rate of -0.22 m/year (accretion trend). represents up to 50% of the total retreat in some scenarios, revealing that the estuarine basin infilling after SLR is expected to become an important term in this beach. However, Nueva Umbría beach demonstrates some resilience due to its gentle accretion trend (mid-term trend rates) and mainly, the presence of large dunes in the backshore. For instance, it can be seen on Figure 11, that results visually differ depending if we consider 2050 (green lines) or 2100 horizon (red lines). The different slopes between green and red lines up to Q50 reflect that the dune-sand redistribution reduces retreat until the dune is progressively eroded. At Q95, the dune is fully consumed, so both 2100 scenarios (red) converge to the same retreat value despite higher SLR under SSP5-8.5: the limit L + Ld has been reached. This does not mean erosion stops; it means our method’s applicability ends once the dune reservoir is empty and the shoreline reaches the dune’s landward limit. This type of profile highlights the critical role of incorporating dunes in shoreline change modelling, as it potentially reduces the magnitude of expected retreat. This beach is expected to be eroded by SLR, but its accretion trend and robust dune system would likely reduce the damages.
Matalascañas beach showed high values. While this beach shares some similarities with Nueva Umbría, such as being influenced by two estuaries, it differs in its backshore type, see Figure A3.2. Matalascañas features a promenade on the backshore with a dry beach width of 37 meters. This beach is continuously affected by storm damage during winter, such as those experienced in December 2009 and January 2013, which left a significant portion of the beach submerged and allowed wave action to directly impact parts of the promenade. In this case, no resilience is evident from the obtained results. Figure 11 shows that in 2100, the shoreline retreat related to the Q50 and Q95’s quantiles is expected to present the same values (37.62 m for both scenarios – see red and green lines), indicating that the upper beach has been completely eroded in both cases, with the shoreline retreating to the seawall.
Peginas beach in Cádiz (Figure A3.3), is characterized by a narrow variable beach width ( ~ 8-11m) and a defined berm ( = 2.57 m), exhibits a linear retreat response as SLR increases. The maximum retreat is projected at 8.07 m under the 2100 SSP5-8.5 scenario (Q95). The shoreline retreat on this beach is strongly influenced by the limited extent of the submerged beach profile, constrained by the rocky platform and the significant volume of sand (relative to the whole profile) in the dry beach area. Notably, the expected retreat at this beach is primarily driven by Bruun’s Rule (52%) and berm adjustment (45%), highlighting the significant interplay between these two processes.
Finally, although similarly narrow beach constrained by rocky platforms and featuring a cliff-backed profile, the El Charcón beach in Málaga (Figure A3.4), is influenced by local accretionary dynamics, with a shoreline change rate of -0.33 m/year (indicating a persistent accretional trend). As a result, this beach consistently showed negative retreat values across all scenarios in Figure 11, indicating that local mid-term accretive processes currently dominate and are assumed to persist during the projection horizon, effectively compensating the retreat expected from SLR.
4.3 Components relevance
In this section, a sensitivity analysis was performed to identify the most influential terms driving shoreline retreat, based on the PCA classification results showed in Figure 5. The SSP2-4.5 scenario for 2050 was selected to represent a moderate sea-level rise trajectory. Two complementary analyses were conducted. In the first, focused on percentage contributions (Figure 12), only profiles with net erosion were included (i.e., excluding cases of accretion or negative total retreat), resulting in a filtered sample of 750 profiles.
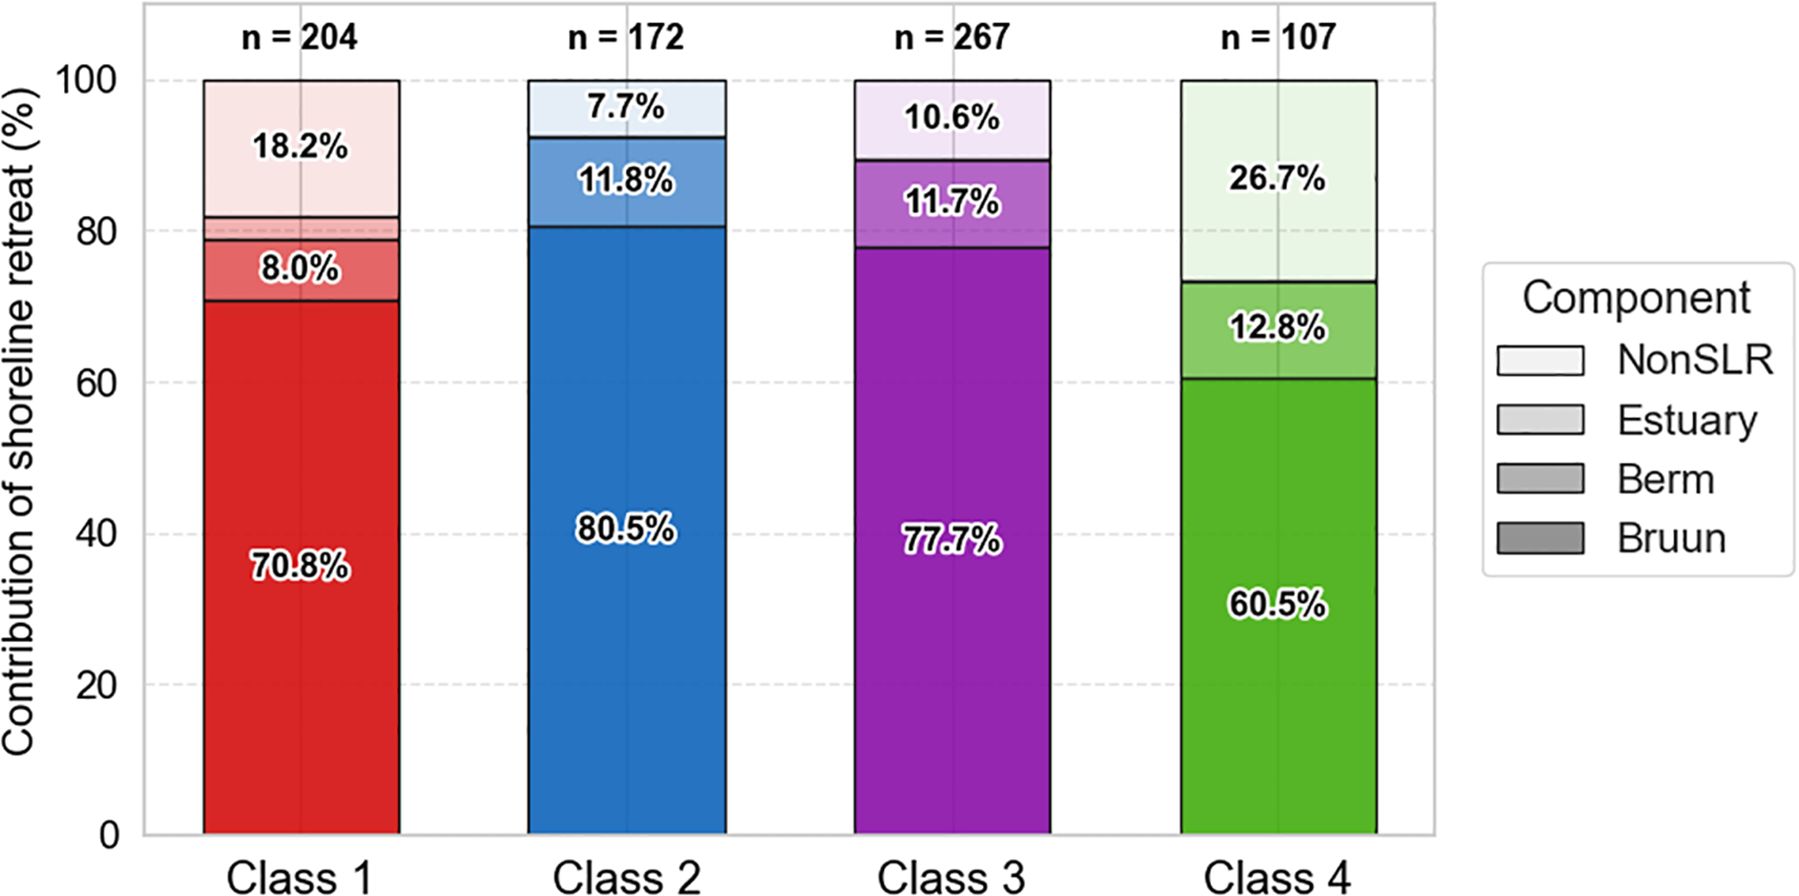
Figure 12. Average percentage contribution of the four shoreline retreat terms by PCA class for SSP2-4.5 scenario 2050.
Figure 12 shows the mean percentage contribution of each retreat term—Bruun, Berm, Estuary, and Non_SLR—for each PCA class. The stacked bar format provides a clear comparison across profile types. The results indicate that the Bruun term consistently dominates shoreline retreat across all four classes, accounting for over 60% of the total in every case. Notably, Class 1 is the only group where the contributes significantly, which is consistent with the geographical location of the major estuarine systems along the northern Atlantic coast of Andalusia (Huelva and northern Cádiz). Meanwhile, Class 4 stands out for having the highest relative contribution from non-SLR-related processes, reflecting the influence of localized factors in coarse-grained, microtidal environments.
In the second analysis (Figure 13), aimed to compare the absolute magnitude and variability of each term, all profiles were retained and only statistical outliers were excluded.
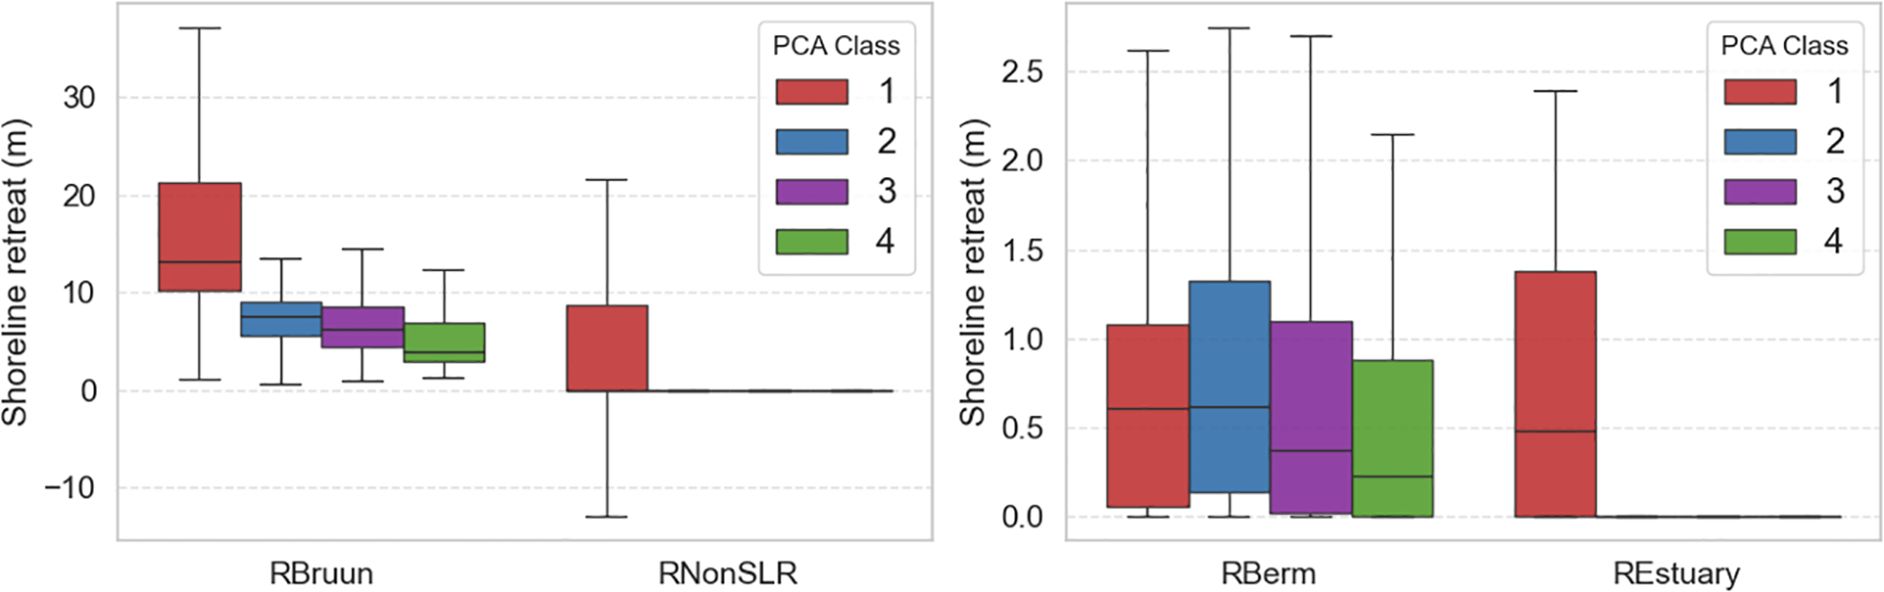
Figure 13. Boxplots showing the absolute magnitude and variability of the four shoreline retreat terms, grouped by PCA class, under the SSP2-4.5 scenario for 2050.
The absolute magnitude and variability of each term were explored through boxplots, separating major and minor terms for clarity. These plots confirm, for instance, the dominance in contribution of and the variability of in Class 1, reflecting that local shoreline change rates can either exacerbate or mitigate retreat. In contrast, the contributions from remain relatively small and quite similar across all cases, ranging under 3 m of extra shoreline retreat. Again, is only visible on Class 1 due to the geographical location of the major estuarine systems.
5 Discussion
The interplay between SLR and sediment transport is highly complex, context-dependent and related to site-specific characteristic of the coast. In the following subsections, we discuss the sedimentary key processes represented in CoShReW, compare our results with other studies and point out the limitations that stem from the assumptions adopted.
5.1 Onshore and offshore sediment transport
Our workflow assumes that net sediment transport occurs in a seaward direction, with no sediment transport taking place when . However, some studies suggest that under certain marine conditions, such as extreme waves and elevated water levels, sediment transport can occur in the onshore direction (Cowell et al., 1995). This may result in the accumulation of material in the active beach profile (Hallin et al., 2019; Rosati et al., 2013). Additionally, if accommodation space is available in the backshore, the beach can migrate landward in response to SLR, which could alter the shoreline dynamics (Cooper et al., 2020).
Currently, no established methodology exists for estimating inland beach migration or onshore sediment transport using simple proxies, which is why these processes were excluded from this study. However, as methodologies advance, they can be integrated as additional terms into the proposed workflow, thereby enhancing the accuracy of shoreline change predictions.
This nuanced understanding reinforces the need to consider bidirectional sediment transport in predicting shoreline change, particularly as tools for modelling inland beach migration and sediment dynamics continue to advance.
5.2 Dune migration and accommodation space availability after SLR
Dunes are complex and highly dynamic systems that influence beach morphodynamical processes and are, in turn, affected by them (McCarroll et al., 2021). The proposed formulation in Equation 10, assumes that the dune will be eroded when the shoreline retreat exceeds the beach width. Reaching the edge of the dune ridge should be interpreted as a sign of extreme erosion within the beach profile. When it happens, the dune acts as a source of sediment to the beach reducing the shoreline retreat. This implies two hypotheses: i) the dune volume is conserved during SLR and ii) all the sediment removed from the dune remains in the active beach profile after erosion (de Almeida et al., 2019).
Other studies, however, suggest that the dunes can migrate inland to adapt and maintain the equilibrium shape after SLR as it does the beach profile (Davidson-Arnott and Bauer, 2021). Brodie et al. (2024) suggest heterogeneous behaviour of dunes including gaining sediment and advancing, gaining sediment and retreating, losing sediment and retreating, and losing sediment and advancing. That means that dunes can respond to erosion in different ways, including situations in which the sediment may be transported offshore (out from the active profile), retained in transitional features like tidal deltas or even that the dune may work as a sediment trap, locking sediment out of the active beach system under certain conditions, especially when human interventions take place (Cowell et al., 1995; Kinsela and Hanslow, 2017; Beuzen et al., 2018; Cooper et al., 2020; McCarroll et al., 2021). The timescale of these processes is still unclear and, given the complexity of dune dynamics, those authors highlight the need for advanced models that account for that in long-term predictions at regionals scales. This study assumes that the shoreline change occurs in a shorter timescale and dune erosion occurs before such migration.
5.3 Limitations
In this study, we introduce a workflow that combines the classic Bruun Rule with three additional, peer−reviewed terms to reflect site−specific controls on long−term shoreline retreat. However, the hypothesis and assumptions made in this work lead to some limitations that are worth noting. For example, SLR is considered as the only climatic forcing, a simplification supported by AR6 regional projections for Andalusia, which foresee only minor future changes in wave climate and storm surge. Where those dynamics do intensify and significant intervention occurs, the workflow may yield conservative estimates. Specifically, where nourishment or structural interventions occurred, Scr may primarily reflect management rather than background trends. We therefore treat Scr as valid under a ‘no major change in interventions’ assumption and recommend site-specific re-estimation (e.g., excluding post-nourishment years or using an alternative window) where local records document substantial interventions. Likewise, CoShReW focuses on decadal shoreline trends and the cross−shore component of sediment exchange; short storm impacts and alongshore transport are excluded but can be evaluated with complementary tools such as the event−scale formulation of Ferreira et al. (2006). We acknowledge that CoShReW requires a considerable number of variables to be able to quantify the expected shoreline retreat. Incorporating multiple site-specific factors may add complexity, potentially challenging the application in sites with data scarcity (Pazini et al., 2022).
Encouragingly, the shoreline retreat values obtained here are consistent with recent Andalusian studies based on independent methods and time frames. For example, our shoreline change rates align closely with Campos and Zújar (2024), who identified intensified erosion using decadal erosion rates (2001-2019) in natural beach sectors and greater retreat along the Atlantic façade. Similarly, Díaz-Cuevas et al. (2020), reported mid-term erosion rates (1977-2013) based on shoreline proxies that reflect the same spatial variability observed in our results. Specifically, in the case of Playa de la Victoria, Aguilera-Vidal et al. (2022) projected a shoreline retreat of up to 58–73 meters by 2100 using RCP 4.5 & RCP 8.5, which is comparable to the higher-end estimates from our analysis. Furthermore, regional-scale projections by Alvarez-Cuesta et al. (2021b) also point to permanent beach losses under various climate change scenarios, reinforcing the higher shoreline retreat values obtained in the analysis carried out. The consistency of these outcomes across multiple lines of evidence and study areas supports the reliability and robustness of our results and underscores the increasing vulnerability of Andalusia’s coastline to climate-driven erosion.
CoShReW does not account for longshore sediment transport, focusing solely on the cross-shore component of sediment dynamics. While this provides valuable insights into local shoreline retreat, it does not capture the broader influence of alongshore processes, which could affect shoreline evolution in certain cases. The workflow further presumes that beaches and estuaries maintain an invariant equilibrium morphology describable by the current shape parameters, thereby omitting long term adjustments in profile slope, sediment supply, and dune vegetation. There are also limitations related to the impact of other aspects of climate change not considered here, including potential changes in storminess, aeolian and dune-sedimentary transferences during overwash and overtopping events (Brodie et al., 2024) and a potential lag between SLR and the shoreline response (Mariotti and Hein, 2022). The complexity of those processes compromises a simple and practical application as proposed here. Nevertheless, the modular design permits the later addition of streamlined expressions for these processes as new empirical relationships become available.
Finally, the lack-off of large−scale field campaigns and shoreline records along the Andalusian coast precludes formal validation of the long−term component at this stage. As continuous monitoring programmes mature, we recommend benchmarking CoShReW outputs against observed multi−decadal retreat to refine parameter values and further enhance predictive skill.
6 Conclusions
By applying the CoShReW to 1281 shoreline profiles that span the full diversity of the Andalusian coast, this study demonstrates that local geomorphology, sediment dynamics and existing non−climatic trends govern the magnitude—and in some cases even the sign—of long−term shoreline retreat under SLR. Variations in dune height, estuary infilling capacity, rocky platforms barriers and decadal erosion rates generate shoreline retreat projections that can differ by an order of magnitude across neighbouring sectors, underscoring the inadequacy of uniform regional estimates. In several profiles, the non-SLR component rivals or exceeds the SLR−driven component. The obtained results highlight the diverse shoreline responses that can occur along the same coast and emphasize the need to consider the unique characteristics of each beach type. The observed variability arises from the interplay between global climate-driven SLR and local geomorphological factors.
These findings underscore the importance of integrating diverse coastal variables into shoreline retreat models. By incorporating these sector-specific factors, CoShReW offers a more versatile and adaptable framework for coastal management, providing a valuable tool for developing integrated local coastal management plans. The application to different coastal environments emphasizes the critical influence of local geomorphological characteristics and sediment dynamics on the response of shoreline to SLR. This underscores that local processes unrelated to SLR can be equally important in shoreline response and should be accounted for in shoreline predictions, to link coastal processes to ecosystem resilience and conservation strategies.
CoShReW offers a highly adaptable workflow for coastal management. Each module can be activated, de−activated or replaced, allowing practitioners to tailor the calculation chain to the data availability and dominant processes of any given pilot site, allowing future integration of additional features related to processes not yet accounted. Its open-source, flexible architecture enables transfer to other regions and iterative updates as new data arrive, strengthening adaptive planning under coastal processes. In its present form, the workflow already provides a defensible first approximation for long−term planning; when combined with higher−resolution storm or alongshore transport analyses, it can guide the prioritisation of adaptation measures and the design of site−specific interventions for coastal management. Furthermore, combined with habitat-relevant exposure metrics, it can become a practical bridge between monitoring investments and adaptative conservational ecosystem-based pathways.
The consistency of our results with independent studies along the same coastline lends confidence to both the workflow and the regional projections. Nevertheless, continued improvement will depend on expanding long−term observational datasets and on distilling additional processes—such as storm−induced change and profile lag effects—into similarly tractable modules. Until then, CoShReW offers coastal managers a scalable, transparent and reproducible tool for translating global sea−level scenarios into locally relevant shoreline−retreat estimates.
Data availability statement
The data analyzed in this study is subject to the following licenses/restrictions: The workflow is public and open access, publicly accessible on: GitHub (https://github.com/IHCantabria/CoShReW.git). The dataset has privacy restrictions and belongs to Consejería de Sostenibilidad, Medio Ambiente y Economía Azul CSMAEA (Junta de Andalucía). Requests to access these datasets should be directed to https://www.juntadeandalucia.es/organismos/sostenibilidadymedioambiente.html.
Author contributions
AG: Data curation, Formal Analysis, Investigation, Project administration, Software, Validation, Writing – original draft, Writing – review & editing. PG: Conceptualization, Data curation, Investigation, Methodology, Project administration, Software, Validation, Writing – review & editing. EP: Conceptualization, Project administration, Writing – review & editing. VC: Conceptualization, Data curation, Funding acquisition, Methodology, Supervision, Writing – review & editing. MG: Conceptualization, Funding acquisition, Methodology, Project administration, Resources, Supervision, Writing – review & editing. RM: Conceptualization, Funding acquisition, Methodology, Project administration, Resources, Supervision, Writing – review & editing. AK: Supervision, Writing – review & editing.
Funding
The author(s) declare financial support was received for the research and/or publication of this article. This study is part of the ThinkInAzul programme and was supported by the Ministerio de Ciencia, Innovación y Universidades (PRTR-C17.I1) with funding from the NextGeneration EU and the Comunidad de Cantabria, as well as by the research project PID2023-153343OA-I00, funded by MICIU/AEI (10.13039/501100011033) and co-financed by FEDER, EU. The role of ThinkInAzul programme was to cover the Grant of the corresponding author, while the FEDER fundings covered the article publishing charges (APCs).
Acknowledgments
This study is part of the ThinkInAzul programme and was supported by the Ministerio de Ciencia, Innovación y Universidades (PRTR-C17.I1) with funding from the NextGeneration EU and the Comunidad de Cantabria, as well as by the research project PID2023-153343OA-I00, funded by MICIU/AEI (10.13039/501100011033) and co-financed by FEDER, EU. The authors extend their heartfelt appreciation to the involved Brazilian authorities, especially the Laboratório de Oceanografia Costeira, Departamento de Geociências, Universidade Federal de Santa Catarina, Florianópolis, SC, Brazil, for their invaluable support during the internal discussions. Special thanks go to the Consejería de Sostenibilidad, Medio Ambiente y Economía Azul (CSMAEA) and Junta de Andalucía for their collaboration and assistance throughout this work. During the preparation of this work the author(s) used ChatGPT-4-o in order to improve the clarity of redaction on some parts of the document. After using this tool/service, the author(s) reviewed and edited the content as needed and take(s) full responsibility for the content of the publication.
Conflict of interest
The authors declare that the research was conducted in the absence of any commercial or financial relationships that could be construed as a potential conflict of interest.
Generative AI statement
Any alternative text (alt text) provided alongside figures in this article has been generated by Frontiers with the support of artificial intelligence and reasonable efforts have been made to ensure accuracy, including review by the authors wherever possible. If you identify any issues, please contact us.
Publisher’s note
All claims expressed in this article are solely those of the authors and do not necessarily represent those of their affiliated organizations, or those of the publisher, the editors and the reviewers. Any product that may be evaluated in this article, or claim that may be made by its manufacturer, is not guaranteed or endorsed by the publisher.
Supplementary material
The Supplementary Material for this article can be found online at: https://www.frontiersin.org/articles/10.3389/fmars.2025.1695289/full#supplementary-material
References
Aguilera-Vidal M., Muñoz-Perez J. J., Contreras A., Contreras F., Lopez-Garcia P., and Jigena B. (2022). Increase in the erosion rate due to the impact of climate change on sea level rise: Victoria beach, a case study. J. Mar. Sci. Eng. 10, Article 12. doi: 10.3390/jmse10121912
Alvarez-Cuesta M., Toimil A., and Losada I. J. (2021a). Modelling long-term shoreline evolution in highly anthropized coastal areas. Part 1: Model description and validation. Coast. Eng. 169, 103960. doi: 10.1016/j.coastaleng.2021.103960
Alvarez-Cuesta M., Toimil A., and Losada I. J. (2021b). Reprint of: Modelling long-term shoreline evolution in highly anthropized coastal areas. Part 2: Assessing the response to climate change. Coast. Eng. 169, 103985. doi: 10.1016/j.coastaleng.2021.103985
Atkinson A. L., Baldock T. E., Birrien F., Callaghan D. P., Nielsen P., Beuzen T., et al. (2018). Laboratory investigation of the Bruun Rule and beach response to sea level rise. Coast. Eng. 136, 183–202. doi: 10.1016/j.coastaleng.2018.03.003
Bagheri M., Farshforoush N., Bagheri K., and Shemirani A. I. (2023). Applications of artificial intelligence technologies in water environments: From basic techniques to novel tiny machine learning systems. Process Saf. Environ. Prot. 180, 10–22. doi: 10.1016/j.psep.2023.09.072
Beuzen T., Turner I. L., Blenkinsopp C. E., Atkinson A., Flocard F., and Baldock T. E. (2018). Physical model study of beach profile evolution by sea level rise in the presence of seawalls. Coast. Eng. 136, 172–182. doi: 10.1016/j.coastaleng.2017.12.002
Bird E. C. F. (1985). Coastline changes. A global review. OSTI ID:7194242. Available online at: https://www.osti.gov/biblio/7194242 (Accessed January 22, 2025).
Birkemeier W. A. (1985). Field data on seaward limit of profile change. J. Waterway Port Coastal Ocean Eng. 111, 598–602. doi: 10.1061/(ASCE)0733-950X(1985)111:3(598
Brodie L., Stokes C., Gerd M., Konstantinou A., Scott T., and Timothy P. (2024). Quantification of Decadal-Scale Dune Evolution on a Regional Scale for Coastal Management (SSRN Scholarly Paper No. 4874641). (Rochester, NY: SSRN Scholarly Paper). doi: 10.2139/ssrn.4874641
Bruun P. (1954). Coast erosion and the development of beach profiles. Environ. Sci. Geography Geol. doi: 10.9753/icce.v5.21
Bruun P. (1962). Sea-level rise as a cause of shore erosion. J. Waterways Harbors Division 88, 117–130. doi: 10.1061/JWHEAU.0000252
Campos A. and Jose O. (2024). Methodology of data generation and calculation of erosion rates applied to littoral areas: Evolution of the Andalusian shoreline on exposed beaches during the 21st century, (2001-2019). Investigaciones Geográficas 81, 9–31. doi: 10.14198/INGEO.25242
Campos A. P. and Zújar J. O. (2024). Methodology of data generation and calculation of erosion rates applied to littoral areas: Evolution of the Andalusian shoreline on exposed beaches during the 21st century, (2001-2019). Investigaciones Geográficas 81, Article 81. doi: 10.14198/INGEO.25242
Camus P., Mendez F. J., Medina R., and Cofiño A. S. (2011). Analysis of clustering and selection algorithms for the study of multivariate wave climate. Coast. Eng. 58, 453–462. doi: 10.1016/j.coastaleng.2011.02.003
CEDEX (2013). Estudio de la dinámica litoral, defensa y propuesta de mejora en las playas con problemas: Estudio de actuación del tramo de costa comprendido entre las desembocaduras de los ríos Guadiana y Guadalquivir. (Madrid, Spain: Miteco.gob.es).
Cooper A., Coco G., Castelle B., Rogers K., Anthony E., Green A. N., et al. (2020). Sandy beaches can survive sea-level rise. Nat. Climate Change 10, 993–995. doi: 10.1038/s41558-020-00934-2
Cooper J. A. G., Green A. N., Vital H., and Lima-Filho F. P. (2019). Geomorphology and clast assemblages of intertidal beachrock: Implications for submerged shoreline preservation. Geomorphology 343, 106–118. doi: 10.1016/j.geomorph.2019.07.003
Cooper J. A. G. and Pilkey O. H. (2004). Sea-level rise and shoreline retreat: Time to abandon the Bruun Rule. Global Planetary Change 43, 157–171. doi: 10.1016/j.gloplacha.2004.07.001
Cowell P. J., Roy P. S., and Jones R. A. (1995). Simulation of large-scale coastal change using a morphological behaviour model. Mar. Geol. 126, 45–61. doi: 10.1016/0025-3227(95)00065-7
Crowell M., Leatherman S. P., and Buckley M. K. (1991). Historical shoreline change: error analysis and mapping accuracy. J. Coast. Res. 7, 839–852.
Cutler E. M., Albert M. R., and White K. D. (2020). Tradeoffs between beach nourishment and managed retreat: Insights from dynamic programming for climate adaptation decisions. Environ. Model. Software 125, 104603. doi: 10.1016/j.envsoft.2019.104603
Dastgheib A., Martinez C., Udo K., and Ranasinghe R. (2022). Climate change driven shoreline change at Hasaki Beach Japan: A novel application of the Probabilistic Coastline Recession (PCR) model. Coast. Eng. 172, 104079. doi: 10.1016/j.coastaleng.2021.104079
Davidson-Arnott R. G. D. and Bauer B. O. (2021). Controls on the geomorphic response of beach-dune systems to water level rise. J. Great Lakes Res. 47, 1594–1612. doi: 10.1016/j.jglr.2021.05.006
de Almeida L. R., González M., and Medina R. (2019). Morphometric characterization of foredunes along the coast of northern Spain. Geomorphology 338, 68–78. doi: 10.1016/j.geomorph.2019.04.019
Dean R. G. and Houston J. R. (2016). Determining shoreline response to sea level rise. ScienceDirect 114, 1–8. doi: 10.1016/j.coastaleng.2016.03.009
Díaz-Cuevas P., Prieto-Campos A., Fraile-Jurado P., Ojeda-Zújar J., and Álvarez-Francoso J. I. (2020). Shoreline proxies evaluation for mid-term erosion rates calculation in mesotidal and microtidal beaches (Andalusia, Spain). J. Coast. Res. 95, 1062–1066. doi: 10.2112/SI95-207.1
Egbert G. D. and Erofeeva S. Y. (2002). Efficient inverse modeling of barotropic ocean tides. Available online at: https://journals.ametsoc.org/view/journals/atot/19/2/1520-0426_2002_019_0183_eimobo_2_0_co_2.xml (Accessed November 18, 2024).
Ferreira Ó., Garcia T., Matias A., Taborda R., and Dias J. (2006). An integrated method for the determination of set-back lines for coastal erosion hazards on sandy shores. Continental Shelf Res. 26, 1030–1044. doi: 10.1016/j.csr.2005.12.016
Gomes da Silva P., Martinez Sanchez J., Medina Santamaría R., Beck A.-L., and Taji M. A. (2022). On the use of satellite information to detect coastal change: Demonstration case on the coast of Spain. Coast. Eng. 191, 104517. doi: 10.1016/j.coastaleng.2024.104517
Guisado E., Malvárez G. C., and Navas F. (2013). Morphodynamic environments of the Costa del Sol, Spain. J. Coast. Res. 65, 500–505. doi: 10.2112/SI65-085.1
Hallin C., Almström B., Larson M., and Hanson H. (2019). Longshore transport variability of beach face grain size: implications for dune evolution. J. Coast. Res. 35, 751–764. doi: 10.2112/JCOASTRES-D-18-00153.1
IHCantabria (2019). Elaboración de la metodología y bases de datos para la proyección de impactos de cambio climático a lo largo de la costa Española. Tarea 2: Proyecciones de alta resolución de variables marinas en la costa Española. (Cantabria, Spain: IHCantabria).
IHData (2024). IHData | Climatic Database developed by the Environmental Hydraulics Institute of the Universidad de Cantabria (Versión Last) [Private] (IHData). Available online at: https://ihdata.ihcantabria.com/?_ga=2.136697523.2016329491.1731929867-848162907.1731929867 (Accessed November 18, 2024).
IPCC (2023). AR6 synthesis report: climate change 2023. Available online at: https://www.ipcc.ch/report/ar6/syr/ (Accessed September 10, 2024).
Itzkin M., Moore L. J., Ruggiero P., Hovenga P. A., and Hacker S. D. (2022). Combining process-based and data-driven approaches to forecast beach and dune change. Environ. Model. Software 153, 105404. doi: 10.1016/j.envsoft.2022.105404
Kinsela M. and Hanslow D. J. (2017). Second-pass assessment of potential exposure to shoreline change in New South Wales, Australia, using a sediment compartments framework. doi: 10.3390/jmse5040061
Kinsela M. A., Hanslow D. J., Carvalho R. C., Linklater M., Ingleton T. C., Morris B. D., et al. (2022). Mapping the shoreface of coastal sediment compartments to improve shoreline change forecasts in New South Wales, Australia. Estuaries Coasts 45, 1143–1169. doi: 10.1007/s12237-020-00756-7
Le Cozannet G., Bulteau T., Castelle B., Ranasinghe R., Wöppelmann G., Rohmer J., et al. (2019). Quantifying uncertainties of sandy shoreline change projections as sea level rises. Sci. Rep. 9, 42. doi: 10.1038/s41598-018-37017-4
Mariotti G. and Hein C. J. (2022). Lag in response of coastal barrier-island retreat to sea-level rise. Nat. Geosci. 15, 633–638. doi: 10.1038/s41561-022-00980-9
Masselink G., Brooks S., Poate T., Stokes C., and Scott T. (2022). Coastal dune dynamics in embayed settings with sea-level rise – Examples from the exposed and macrotidal north coast of SW England. Mar. Geol. 450, 106853. doi: 10.1016/j.margeo.2022.106853
McCarroll R. J., Masselink G., Valiente N. G., Scott T., Wiggins M., Kirby J.-A., et al. (2021). A rules-based shoreface translation and sediment budgeting tool for estimating coastal change: ShoreTrans. Mar. Geol. 435, 106466. doi: 10.1016/j.margeo.2021.106466
Menendez M., Medina R., and Mendez F. (2015). “An European historical reconstruction of sea surface dynamics (waves and storm surge) for coastal impact studies,” in EGU General Assembly Conference Abstracts, Vol. 17.
Miteco M. (2019). Estrategias para la protección de la costa. Cádiz, Málaga y Almería (Ministerio para la Transición Ecológica y el Reto Demográfico). Available online at: https://www.miteco.gob.es/es/costas/temas/proteccion-costa/estrategias-proteccion-costa/cadiz/estrategia-proteccion-cadiz-malaga-almeria.html (Accessed September 10, 2024).
Molina R., Anfuso G., Manno G., and Gracia Prieto F. J. (2019). The Mediterranean coast of Andalusia (Spain): medium-term evolution and impacts of coastal structures. Sustainability 11, Article 13. doi: 10.3390/su11133539
Molina R., Manno G., and Anfuso G. (2020). Dune systems’ Characterization and evolution in the Andalusia Mediterranean coast (Spain). Water 12, 2094. doi: 10.3390/W12082094
Mycoo M. and Donovan M. G. (2017). A Blue Urban Agenda: Adapting to Climate Change in the Coastal Cities of Caribbean and Pacific Small Island Developing States (NW Washington, DC: IDB Publications). doi: 10.18235/0000690
Nguyen Q. H. and Takewaka S. (2020). Land subsidence and its effects on coastal erosion in the Nam Dinh Coast (Vietnam). Continental Shelf Res. 207, 104227. doi: 10.1016/j.csr.2020.104227
Nicholls R. J. and Cazenave A. (2010). Sea-level rise and its impact on coastal zones. Science 328, 1517–1520. doi: 10.1126/science.1185782
Nicholls R. J., Hoozemans F. M. J., and Marchand M. (1999). Increasing flood risk and wetland losses due to global sea-level rise: Regional and global analyses. Global Environ. Change 9, S69–S87. doi: 10.1016/S0959-3780(99)00019-9
Nurse L., Mclean R., Agard J., Briguglio L., Duvat V., Pelesikoti N., et al. (2014). “Chapter 29: Small islands,” in Climate Change 2014: Impacts, Adaptation, and Vulnerability. Part B: Regional Aspects. Contribution of Working Group II to the Fifth Assessment Report of the Intergovernmental Panel on Climate Change, (Cambridge, United Kingdom and New York, NY, USA: Cambridge University Press). 1654.
Pazini K. C., Bonetti J., da Silva P. G., and Klein A. H. F. (2022). Spotting areas critical to storm waves and surge impacts on coasts with data scarcity: A case study in Santa Catarina, Brazil. Natural Hazards 112, 2493–2521. doi: 10.1007/s11069-022-05275-1
Pörtner H.-O., Roberts D., Masson-Delmotte V., Zhai P., Tignor M., Poloczanska E., et al. (2019). “IPCC Special Report on the Ocean and Cryosphere in a Changing Climate,” in Changing Ocean, Marine Ecosystems, and Dependent Communities. (Geneva, Switzerland: Intergovernmental Panel on Climate Change (IPCC)). IPCC, 2019: Summary for Policymakers.
Ranasinghe R., Callaghan D., and Stive M. J. F. (2012). Estimating coastal recession due to sea level rise: Beyond the Bruun rule. Climatic Change 110, 561–574. doi: 10.1007/s10584-011-0107-8
Ranasinghe R., Uhlenbrook S., Roelvink D. J. A., and Stive M. (2013). Climate-change impact assessment for inlet-interrupted coastlines. Nat. Climate Change 3, 83–87. doi: 10.1038/nclimate1664
REDIAM (2020). Caracterización de la línea de costa andaluza, 2013. Available online at: https://portalrediam.cica.es:/geonetwork/static/api/records/19824cc1-c8c2-4183-aa52-7fa69a14a597 (Accessed November 18, 2024).
Reyes J. L., Martins J. T., Benavente J., Ferreira O., Gracia F. J., Alveirinho-Dias J. M., et al. (1999). Gulf of Cadiz beaches: A comparative response to storm events. Boletin - Instituto Espanol Oceanografia 15, 221–228.
Ritphring S., Somphong C., Udo K., and Kazama S. (2018). Projections of Future Beach Loss due to Sea Level Rise for Sandy Beaches along Thailand’s Coastlines. J. Coast. Res. 85, 541–545. doi: 10.2112/SI85-109.1
Robinet A., Idier D., Castelle B., and Marieu V. (2018). A reduced-complexity shoreline change model combining longshore and cross-shore processes: The LX-Shore model. Environ. Model. Software 109, 1–16. doi: 10.1016/j.envsoft.2018.08.010
Rosati J. D., Dean R. G., and Walton T. L. (2013). The modified Bruun Rule extended for landward transport. Mar. Geol. 340, 71–81. doi: 10.1016/j.margeo.2013.04.018
Seenath A. and Dale J. (2024). On the Bruun Rule suitability for modelling shoreline change. Ocean Coast. Manage. 255, 107237. doi: 10.1016/j.ocecoaman.2024.107237
Sharaan M. and Udo K. (2020). Projections of Proper Beach Nourishment Volume as an Adaptation to Beach Recession based SLR along the Nile Delta Coastline of Egypt. J. Coast. Res. 95, 637–642. doi: 10.2112/SI95-124.1
Stive M. J. F., Aarninkhof S. G. J., Hamm L., Hanson H., Larson M., Wijnberg K. M., et al. (2002). Variability of shore and shoreline evolution. Coast. Eng. 47, 211–235. doi: 10.1016/S0378-3839(02)00126-6
Stripling S., Panzeri M., Blanco B., Rossington K., Sayers P., and Borthwick A. (2017). Regional-scale probabilistic shoreline evolution modelling for flood-risk assessment. Coast. Eng. 121, 129–144. doi: 10.1016/j.coastaleng.2016.12.002
Thiéblemont R., Le Cozannet G., Rohmer J., Toimil A., Álvarez-Cuesta M., and Losada I. J. (2021). Deep uncertainties in shoreline change projections: An extra-probabilistic approach applied to sandy beaches. Natural Hazards Earth System Sci. 21, 2257–2276. doi: 10.5194/nhess-21-2257-2021
Toimil A., Losada I. J., Díaz-Simal P., and Camus P. (2017). Managing coastal erosion under climate change at the regional scale. Coast. Eng. 128, 106–122. doi: 10.1016/j.coastaleng.2017.08.004
Tolman H. L. (1991). A third-generation model for wind waves on slowly varying, unsteady, and inhomogeneous depths and currents. doi: 10.1175/1520-0485(1991)021<0782:ATGMFW>2.0.CO;2
Torrecillas C., Payo A., Cobos M., Burke H., Morgan D., Smith H., et al. (2024). Sediment thickness model of Andalusia’s nearshore and coastal inland topography. J. Mar. Sci. Eng. 12, Article 2. doi: 10.3390/jmse12020269
Vitousek S., Barnard P., Limber P., Erikson L., and Cole B. (2017). A model integrating longshore and cross-shore processes for predicting long-term shoreline response to climate change: CoSMoS-COAST. J. Geophysical Research: Earth Surface 122. doi: 10.1002/2016JF004065
Vousdoukas M. I., Mentaschi L., Hinkel J., Ward P. J., Mongelli I., Ciscar J.-C., et al. (2020a). Economic motivation for raising coastal flood defenses in Europe. Nat. Commun. 11, 2119. doi: 10.1038/s41467-020-15665-3
Vousdoukas M. I., Ranasinghe R., Mentaschi L., Plomaritis T., Athanasiou P., Luijendijk A., et al. (2020b). Sandy coastlines under threat of erosion. Nat. Climate Change 10, 260–263. doi: 10.1038/s41558-020-0697-0
Keywords: shoreline change, long-term, beach morphology, Bruun Rule, climate change
Citation: Garcia Tort A, Gomes da Silva P, Pellón E, Cánovas V, González M, Medina R and da Fontoura Klein AH (2025) Composite shoreline-retreat workflow (CoShReW): a case study on the Andalusian coast. Front. Mar. Sci. 12:1695289. doi: 10.3389/fmars.2025.1695289
Received: 29 August 2025; Accepted: 21 October 2025;
Published: 07 November 2025.
Edited by:
Min Wu, Nanyang Technological University, SingaporeReviewed by:
Beatrice M.S. Giambastiani, University of Bologna, ItalyAlexandre Paris, Mediterranean Institute for Advanced Studies, Slovenia
Copyright © 2025 Garcia Tort, Gomes da Silva, Pellón, Cánovas, González, Medina and da Fontoura Klein. This is an open-access article distributed under the terms of the Creative Commons Attribution License (CC BY). The use, distribution or reproduction in other forums is permitted, provided the original author(s) and the copyright owner(s) are credited and that the original publication in this journal is cited, in accordance with accepted academic practice. No use, distribution or reproduction is permitted which does not comply with these terms.
*Correspondence: Arnau Garcia Tort, YXJuYXUuZ2FyY2lhQHVuaWNhbi5lcw==
‡ORCID: Arnau Garcia Tort, orcid.org/0009-0002-1428-6233
Paula Gomes da Silva, orcid.org/0000-0003-4766-8449
Erica Pellón, orcid.org/0000-0002-5742-9225
Verónica Cánovas, orcid.org/0000-0001-8393-7111
Mauricio González, orcid.org/0000-0001-9021-451X
Raúl Medina, orcid.org/0000-0002-0126-2710
Antonio Henrique da Fontoura Klein, orcid.org/0000-0002-2565-8891