 Dexing Huang
 Bojun Gu*
 Yufang Fu
- School of Economics and Management, Zhejiang Ocean University, Zhoushan, China
Based on a deep-sea aquaculture system comprising the government, deep-sea aquaculture enterprise, and fry farmers, this paper constructs a two-stage game-theoretic model of land-sea relay aquaculture under three scenarios: no government subsidy, input subsidy, and purchase subsidy. A comparative analysis is conducted to examine the impact mechanisms of different government subsidy strategies on the decision-making behaviors, profits, and social welfare of the members in the land-sea relay aquaculture supply chain. Our findings are as follows: (1) under government subsidy mechanisms, the enterprise adopts differentiated pricing based on the scale of farmers, manifesting as price suppression for small-scale farmers and price elevation for large-scale farmers. Both input subsidy and purchase subsidy effectively incentivize farmers to improve fry quality and expand fry supply. (2) The comparative advantage of government subsidy strategies depends on the revenue-sharing proportion and farming scale constraints. The degree of risk aversion among farmers influences the threshold of the revenue-sharing proportion, which increases as risk aversion intensifies. (3) Based on the revenue-sharing proportion and farming scale constraints, input subsidy and purchase subsidy strategies each possess distinct advantageous intervals. Within these intervals, the government, deep-sea aquaculture enterprise, and fry farmers can achieve incentive compatibility and a multi-win situation. The findings of this study provide a theoretical framework for governments promoting deep-sea aquaculture to formulate effective subsidy policies and for stakeholders to optimize their decisions.
1 Introduction
Deep-sea aquaculture serves as both a critical initiative to implement the holistic approach to food security and expand the production space of the “blue granary,” and a key pathway to safeguard national food security and advance sustainable development (Liu et al., 2023; Almeida et al., 2025; Çamkaya et al., 2025). As President Xi Jinping emphasized, it is vital to seek food from both the land and the ocean, cultivating the seas and building “marine pastures” and “blue granaries”. Since the implementation of the 13th Five-Year Plan, a total of over 20,000 gravity-type cages, 53 truss-type cages, and 4 aquaculture workboats have been constructed nationwide. In 2023, the volume of water used for deep-sea aquaculture across the country reached approximately 46.2808 million cubic meters, with a production output of about 416,600 metric tons. These developments have gradually demonstrated the effectiveness of advancing the “Blue Granary” initiative (China Daily, 2024). However, due to the high one-time investment in aquaculture equipment, the large scale of aquaculture operations, and the distinctive characteristics of aquaculture sea areas marked by strong waves and rapid currents, deep-sea aquaculture—while mitigating ecological and environmental pressures in coastal waters and advancing green production—also amplifies aquaculture risks (Lin, 2024; Zheng and Zhang, 2024a). Therefore, improving the quality of fish fry to reduce fry mortality has emerged as a fundamental prerequisite for the effective operation of deep-sea aquaculture. Land-sea relay aquaculture has emerged as a specific operational mode under the unique context of deep-sea aquaculture, leveraging specialized division of labor between land-based and marine stages to systematically integrate the precision control of terrestrial systems with the ecological advantages of open-sea environments. However, this mode exhibits distinct characteristics seldom observed in traditional agricultural supply chains. First, fry quality serves as a critical intermediate variable whose level directly determines the output rate during the deep-sea grow-out phase. Studies confirm that high-quality fry demonstrate significantly superior stress resistance, growth performance, and survival rates, thereby fundamentally ensuring final production outcomes (Chen et al., 2018). Consequently, fry quality forms the essential technological link connecting upstream and downstream supply chain segments. Second, a pronounced power asymmetry exists between the predominantly small-scale fry farmers and the industrialized large-scale deep-sea enterprises, creating structural imbalances within the relay system.
The land-sea relay aquaculture mode is a practical application designed for this context, combining the advantages of both land-based/inshore and deep-sea aquaculture. In this mode, fry farmers first nurture fish fry to a standard suitable for deep-sea transfer (e.g., reaching a size of over 250 grams) using land-based recirculating aquaculture systems (RAS) or inshore net pens. Subsequently, a deep-sea aquaculture enterprise purchases and transfers the fry to offshore installations for grow-out to market size. For instance, in Nanhuangcheng Village, local fishermen use inshore nets for the initial cultivation of Sebastes schlegelii fry. Once the fry reach a target size, Shandong Yantai Jinghai Marine Fisheries Company purchases them for grow-out in its deep-sea intelligent cage platforms (Tianyan News, 2022). Similarly, Yantai CIMC Raffles signed a fry purchase agreement with the Rizhao Net-Pen Aquaculture Association, whereby association farmers hatch and rear Sebastes schlegelii fry in land-based facilities before the company transfers them to open-sea anti-storm net cages for finishing (Dazhong Daily, 2023).
During the process of land-sea relay aquaculture, high-quality fish fry serve as a critical medium linking the two preceding and subsequent aquaculture modes. However, on the one hand, the long cultivation cycle of high-quality fish fry and the low overall survival rate caused by cannibalism among fry of varying sizes during the rearing process significantly amplify the farming risks for fry farmers. On the other hand, fry farmers primarily operate under smallholder farming models, whereas deep-sea aquaculture enterprises have transitioned into large-scale industrialized entities. This significant market power disparity between the two ends of the land-sea relay chain leaves fry farmers occupying a disadvantaged position in the entire deep-sea aquaculture industrial chain, making it difficult for them to secure equitable profit distribution. While deep-sea aquaculture enterprises face a substantial demand for high-quality fry, fry farmers lack sufficient incentives to cultivate such fry. This mismatch ultimately exposes the deep-sea aquaculture industry under the land-sea relay model to operational risks of disruption due to shortages of high-quality fry. An example is Yantai Jinghai Marine Fisheries, which encountered a shortage of locally sourced high-quality fry that met the requirements for its deep-sea operations under Yantai’s “Hundred Cages Plan” (Shandong Provincial People’s Governmen, 2023). Government incentives are a common policy tool to correct such market failures in aquaculture, which shares characteristics with traditional agriculture (Yu et al., 2020; Huan et al., 2024; Zheng and Zhang, 2024b). In the crop sector, for example, China provides subsidies of 750–1500 RMB per hectare to farmers using organic fertilizers, while Japan offers 800 Yen per hectare for those cultivating green manure and organic crops. Alternatively, governments may subsidize downstream companies to indirectly encourage farmer effort (Li et al., 2020; Ye et al., 2021). However, for emerging models like land-sea relay aquaculture, a systematic government subsidy policy is absent. Direct policy support remains limited, and effective subsidy mechanisms are still in the exploratory phase.
To address this, our study tackles the structural supply-demand contradiction inherent in the relay model: a supply-side imbalance caused by high risk and unfair profit distribution for fry farmers, juxtaposed with robust demand from the large-scale deep-sea enterprise. We develop a two-stage game-theoretic model involving fry farmers and a deep-sea aquaculture enterprise. We then propose and analyze two government subsidy strategies: the input subsidy directly to farmers (based on the quality and quantity of fry delivered) and the purchase subsidy to the enterprise (based on the quality and quantity of fry purchased). By systematically comparing metrics such as farmers’ effort input, farmers’ profit, enterprise profit, and social welfare under different subsidy strategies, we aim to provide a theoretical basis and decision-making references for government selection of subsidy policies. Furthermore, we test the robustness of our core findings by modeling the adult fish output rate as a nonlinear function.
This study seeks to answer the following questions:
1. How to construct a two-stage game model encompassing land-based fry rearing and deep-sea adult fish aquaculture, and characterize the impact mechanism of fry quality on adult fish output rate?
2. Can either input subsidy or purchase subsidy effectively incentivize farmers to exert greater effort, thereby alleviating the shortage of high-quality fry?
3. From the perspective of stakeholder win-win outcomes, how should the government select the optimal subsidy strategy?
To address the above questions, this paper examines a scenario where an enterprise signs procurement contracts with homogeneous fry farmers, contingent on the quality of delivered fry. Under these contracts, the farmers are responsible for rearing fry in land-based facilities until they meet the standards required for deep-sea aquaculture. Subsequently, the enterprise transfers the purchased fry to deep-sea relay aquaculture systems to grow them into adult fish for market sale. First, we establish a benchmark model without government subsidy, where farmer incentives are driven solely by the procurement contract. Second, to correct the market failure caused by the undersupply of high-quality fry, we introduce two subsidy strategies, which incentivize farmers through direct cost compensation (input subsidy) and indirect revenue sharing (purchase subsidy), respectively. Third, based on the perspective of stakeholder win-win outcomes, this paper identifies Pareto improvement intervals under different subsidy strategies, thereby formulating specific guiding principles for the government to develop differentiated subsidy strategies. Finally, in an extension, we model the output rate as a nonlinear function and use numerical simulations to verify the robustness of our core conclusions.
The contributions of this study are threefold:
1. To our knowledge, this is the first study to provide a systematic model and quantitative analysis of the land-sea relay aquaculture mode, addressing a gap in the literature regarding micro-mechanism models for this system. By constructing a two-stage game model and treating fry quality as a key decision variable linking the stages, we delineate its impact on the final output rate and reveal the subsequent effect on overall system performance, providing a theoretical framework for understanding the quality-output linkage in relay aquaculture.
2. We design and compare two novel subsidy mechanisms tied to the quality and quantity of fry transacted: a direct input subsidy to farmers and an indirect purchase subsidy to the enterprise. This allows a systematic comparison of direct cost compensation versus indirect revenue sharing. We find both strategies effectively incentivize farmers to improve quality and increase supply. Their comparative advantage depends on the revenue-sharing proportion and farming scale constraints. The farmers’ risk aversion influences the threshold for this proportion, which increases as they become more risk-averse.
3. From a win-win perspective, we provide actionable policy guidance: the optimal subsidy choice depends on the revenue-sharing proportion. The input subsidy is preferable when this proportion is low, while the purchase subsidy becomes more advantageous when the proportion is high. The impact of farming scale constraints must also be carefully considered to ensure policy effectiveness and avoid unintended outcomes.
The remainder of this paper is organized as follows. Section 2 reviews the related literature. Section 3 details the problem description and model assumptions. Section 4 presents the model formulation and a comparative analysis of the subsidy strategies. Section 5 extends the study by considering a nonlinear output rate. Section 6 concludes. All proofs are contained in the Appendix.
2 Literature review
2.1 Research on contract farming
Land-sea relay aquaculture is an innovative mode integrating industrial production with green transformation principles. The most relevant literature pertains to contract farming, which has been extensively studied for its contract design, cooperation models, and impacts on farmer behavior and supply chain performance. Studies on contract design primarily focus on using contractual terms to incentivize quality improvement. For instance, Ayvaz-Çavdaroğlu et al. (2021) addressed underinvestment by Turkish olive oil farmers in open markets by designing a quality-based delivery system with new payment policies. Yang et al. (2024) explored how retailers can use contract design and farmer competition to enhance quality, finding that intense competition can sometimes reduce overall supply chain profits. Issues of information asymmetry and cooperative governance are also central to this discussion. Mu et al. (2016) found that high testing costs, competition among collection stations, and free-riding among farmers affect milk quality, suggesting improved testing and incentives. Yu et al. (2023) showed that increasing quality-based payments in contracts can mitigate free-riding within cooperatives under information asymmetry. Qian and Olsen (2022) studied quality standard coordination, recommending that cooperatives tailor payment schemes to farmers’ time preferences and farm sizes. Other scholars have explored organizational innovations to enhance smallholder participation. De Zegher et al. (2019) examined how contract design and procurement channels influence technology adoption, providing practical guidance for sustainable sourcing. Hsu et al. (2019) proposed a cooperative dairy farming model to resolve the dual challenges of limited farmer resources and high corporate costs, finding it most beneficial for firms in medium-sized markets, with farmer profits increasing with capacity. Xie et al. (2023) compared penalty, revenue-sharing, and cost-sharing contracts in seed company-led contract farming for coordinating quality improvement efforts. Some research analyzes the macro-level effects of contract farming on farmer income, market competition, and supply chain efficiency. An et al. (2015) focused on five operational benefits of cooperatives, analyzing each one’s impact via economic models. Chen and Chen (2021) examined its impact on income and inequality, finding that reducing production costs for high-value crops might sometimes harm farmers. Existing studies have established a relatively comprehensive theoretical foundation focusing on contractual mechanisms and organizational models in contract agriculture. However, in the specific context of land-sea relay aquaculture, no prior studies have yet conducted theoretical modeling or quantitative analysis of this new cooperative farming model. To address this gap, this paper constructs a two-stage game model encompassing land-based fry rearing and deep-sea adult fish aquaculture. It focuses on characterizing the impact mechanism of fry quality on adult fish output rate and further elucidates the pathways through which this mechanism influences the performance of the entire deep-sea aquaculture system.
2.2 Research on government subsidy
Another relevant stream of literature concerns the government agricultural subsidy, a key tool for supporting innovation, improving quality, ensuring stable supply, and increasing farmer income (Akkaya et al., 2020; Chintapalli and Tang, 2022). Some studies treat subsidies as risk mitigation tools, analyzing how they help farmers cope with uncertainty. Alizamir et al. (2019) compared U.S. price protection and income protection subsidies, finding the former always incentivizes production while the latter may discourage it. Peng and Pang (2019) showed subsidizing agricultural insurance can hedge yield volatility and encourage technical investment. Shi et al. (2023) optimized government premium subsidy rates for social welfare, focusing on yield insurance’s impact on production scale and green technology. Tang et al. (2024) found the input subsidy better reduce income inequality and benefit consumers, while the output subsidy better increase total farmer income under yield uncertainty. Other scholars focus on subsidies’ role in enabling the green transition, particularly their effect on guiding farmers toward environmentally friendly practices. Li et al. (2020) studied green subsidy choices, recommending innovation subsidy when costs and environmental benefits are high, and product subsidy when production costs are low. Guo et al. (2022) examined how subsidies promote green inputs and the effect of farmer heterogeneity. Gu et al. (2024) explored the impact of direct and indirect subsidies on agricultural technology extension under different industrial organization models. Existing research on government agricultural subsidies has predominantly focused on traditional crop sectors, while subsidy policies in the context of deep-sea aquaculture have largely centered on static equipment grants (Yu and Wang, 2023; Dong et al., 2024). However, a comprehensive subsidy system covering the entire “land-based fry rearing–deep-sea aquaculture” chain has yet to be established. In contrast to the existing literature, this study—situated within the land-sea relay aquaculture mode—addresses the risk of supply chain disruption in deep-sea aquaculture caused by high risks in high-quality fry cultivation and insufficient production incentives for farmers. It systematically designs government subsidy mechanisms from both the land-based fry rearing and deep-sea aquaculture procurement ends, aiming to resolve land-sea coordination challenges and ensure the resilience and stability of the “blue granary” supply chain.
In summary, existing contract farming literature focuses on upstream-downstream cooperation to incentivize farmers, while subsidy research typically examines support for a single production stage, lacking a systematic examination of cross-stage policy coordination. Although Hsu et al. (2019) investigated relay dairy farming and Xie et al. (2023) examined relay planting, their studies focused on upstream-downstream collaboration to improve product quality. In contrast, land-sea relay aquaculture, as a specific practice model for green transformation, has not yet been studied by scholars in terms of systematically designing government subsidy mechanisms from both the land-based fry rearing and the deep-sea aquaculture stage. Differing from the aforementioned research, this paper focuses on the inherent transmission mechanism through which fry quality affects adult fish output in the land-sea relay aquaculture mode, as well as the coordination and optimization issues under policy interventions. Given that the quality of fry reared by upstream farmers directly affects the survival rate of downstream deep-sea adult fish aquaculture, this paper constructs a two-stage game-theoretic model involving land-based fry rearing and deep-sea adult fish aquaculture. It specifically characterizes the mechanism through which fry quality influences the output rate of adult fish and reveals how this mechanism affects the overall performance of the deep-sea aquaculture system. On this basis, the study designs government subsidy mechanisms from both the land-based fry rearing and the deep-sea aquaculture stage. It then systematically analyzes the impact of government intervention on farmers’ production decisions, enterprises’ pricing behaviors, and the overall performance of the supply chain, aiming to establish specific guiding principles for the government in selecting subsidy strategies.
3 Problem description and model assumptions
3.1 Aquaculture process and sales
We consider a land-sea relay deep-sea aquaculture system consisting of homogeneous risk-averse fry farmers (hereafter “farmers”) and a single risk-neutral deep-sea aquaculture enterprise (hereafter “the enterprise”). First, farmers are responsible for rearing fish fry to a specified size. Subsequently, the enterprise takes over the relay process, utilizing deep-sea aquaculture equipment to further rear the fry into adult fish for final sale. Let denote the fry quality level, where represents the minimum quality standard required for deep-sea aquaculture and denotes the upper bound for suitable quality. Without loss of generality, we set and . The fry quality affects the adult fish output rate in the second stage of deep-sea aquaculture, denoted by . To facilitate model calculations, this paper first adopts a linear function (Cai et al., 2010) to characterize the relationship between fry quality level and adult fish output, i.e., let . Here, is the impact coefficient of fry quality on output. Additionally, a nonlinear function is employed in the extended section. Without loss of generality, we simplify by setting . To secure a stable supply of high-quality fry and improve the adult fish output rate, the enterprise commits to a quality-adjusted procurement contract, purchasing all fry produced by the farmers (Hsu et al., 2019; Cai et al., 2021). The contract is , where is the base price (decided by the enterprise) paid for fry meeting the minimum quality level .
Farmers are assumed to be risk-averse. The quantity of fry input is constrained by their farming scale , i.e., . Reflecting the diseconomies of scale common in agriculture (Zhong et al., 2023; Fan et al., 2024), we model the farming cost using an increasing marginal cost function: . Drawing on Hsu et al. (2019), we assume farmers can exert effort to improve fry quality (e.g., by enhancing the breeding environment, using finer feed, or extending the cultivation cycle). The cost per unit of quality improvement is . Farmers face production risks (e.g., from cannibalism or disease), modeled by a random output factor . Its probability density function and cumulative distribution function are and , respectively, with a mean and variance . The enterprise purchases all output fry based on the contract and grows them to adulthood in installations like truss-type net cages or aquaculture vessels before selling them at market price . As the market for adult fish is relatively mature and stable, we treat the price as an exogenous parameter (Hovelaque et al., 2009; Niu et al., 2016). Furthermore, unit farming and processing costs during the deep-sea stage are omitted for model simplification, as they do not significantly alter the fundamental supply chain decisions, a common approach in literature (Huang et al., 2018; Feng et al., 2022).
3.2 Government subsidy
To correct this market failure and mitigate the risk of supply chain disruption caused by insufficient upstream supply, this study examines two government subsidy strategies—input subsidy and purchase subsidy—to incentivize farmers to enhance their efforts in improving fry quality while expanding supply, thereby ensuring effective linkage between land-based fry rearing and deep-sea adult fish relay aquaculture. Under the input subsidy strategy, the government provides subsidy based on the quantity of fry inputs and the level of quality improvement, with government expenditure denoted as . Under the purchase subsidy strategy, the government subsidizes based on the quantity and quality of fry purchased by the enterprise, with government expenditure denoted as . Assuming the government’s unit subsidy coefficient is an exogenous parameter. Particularly, given the significant market power asymmetry between deep-sea aquaculture enterprise and land-based fry farmers, the farmers occupy a disadvantaged position within the industrial chain. To address this structural imbalance and incentivize the farmers, this study introduces a revenue-sharing contract under the purchase subsidy scenario, whereby the enterprise shares a portion of the revenue from marketable fish sales with the farmers. This mechanism has been widely demonstrated as an effective approach for coordinating supply chains and incentivizing upstream suppliers to enhance product quality (Ma et al., 2019; Yan et al., 2020).
Based on the above analysis, this paper constructs decision-making models for land-sea relay aquaculture under three scenarios: a benchmark case without government subsidy, input subsidy to farmers, and purchase subsidy to enterprise. The effort level of farmers and the corresponding benefits of the land-sea relay participants under these three scenarios are systematically analyzed.The decision-making sequence follows a Stackelberg game: First, the government determines the subsidy recipient and the subsidy coefficient . Second, based on the government’s action, the enterprise formulates the procurement contract by deciding the base price . Finally, depending on the government subsidy and the procurement contract set by the enterprise, the farmer decides the quantity of fry input and the fry quality level .
This decision process for the land-sea relay aquaculture system is illustrated in Figure 1.
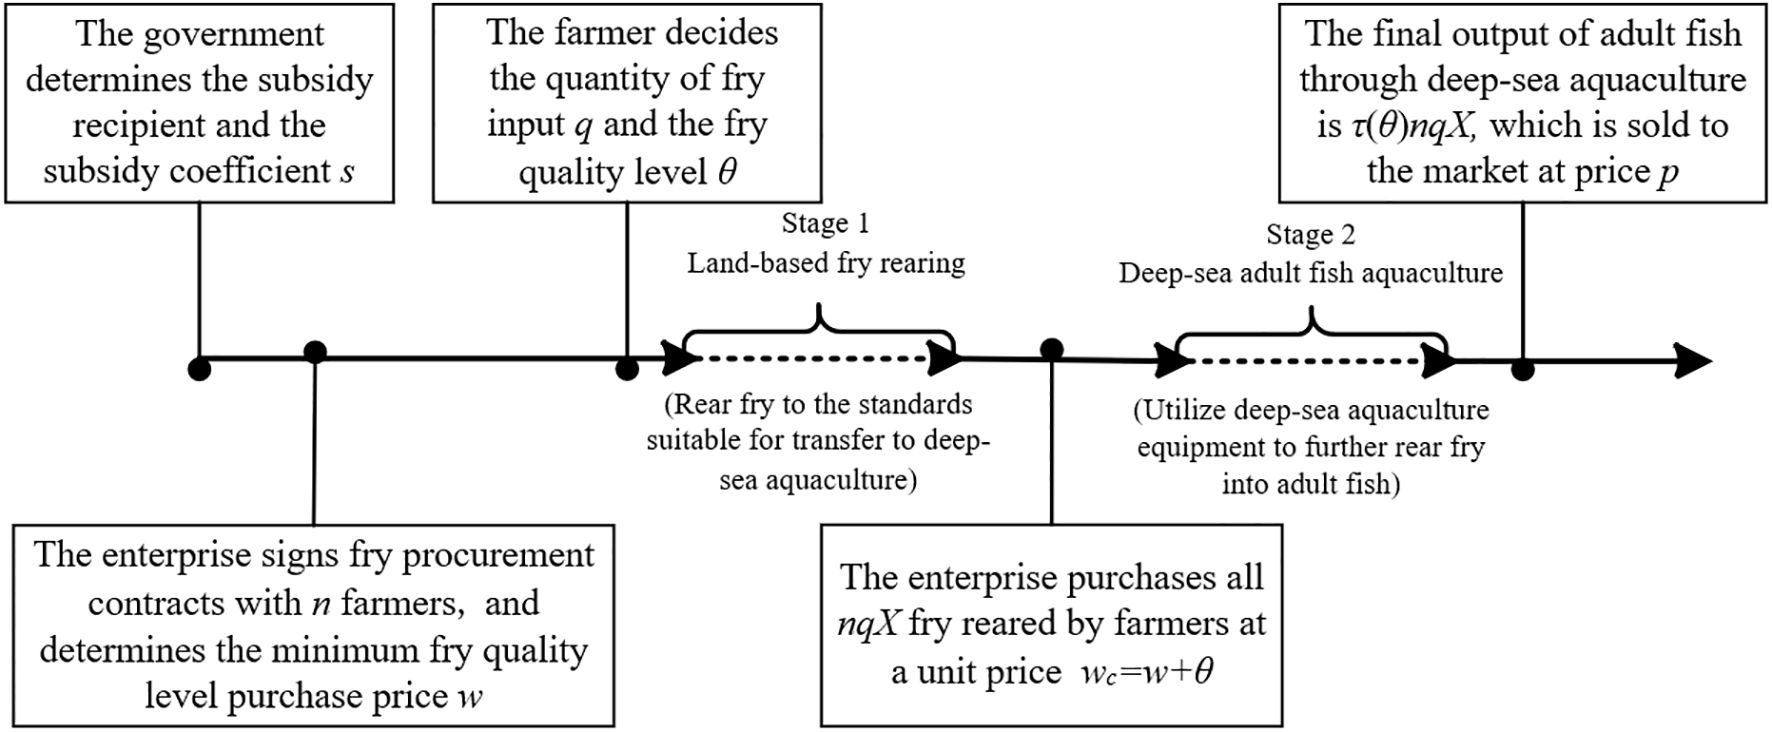
Figure 1. Decision-making process for land–sea relay aquaculture.
The mathematical notations and their definitions used in this paper are summarized in Table 1.
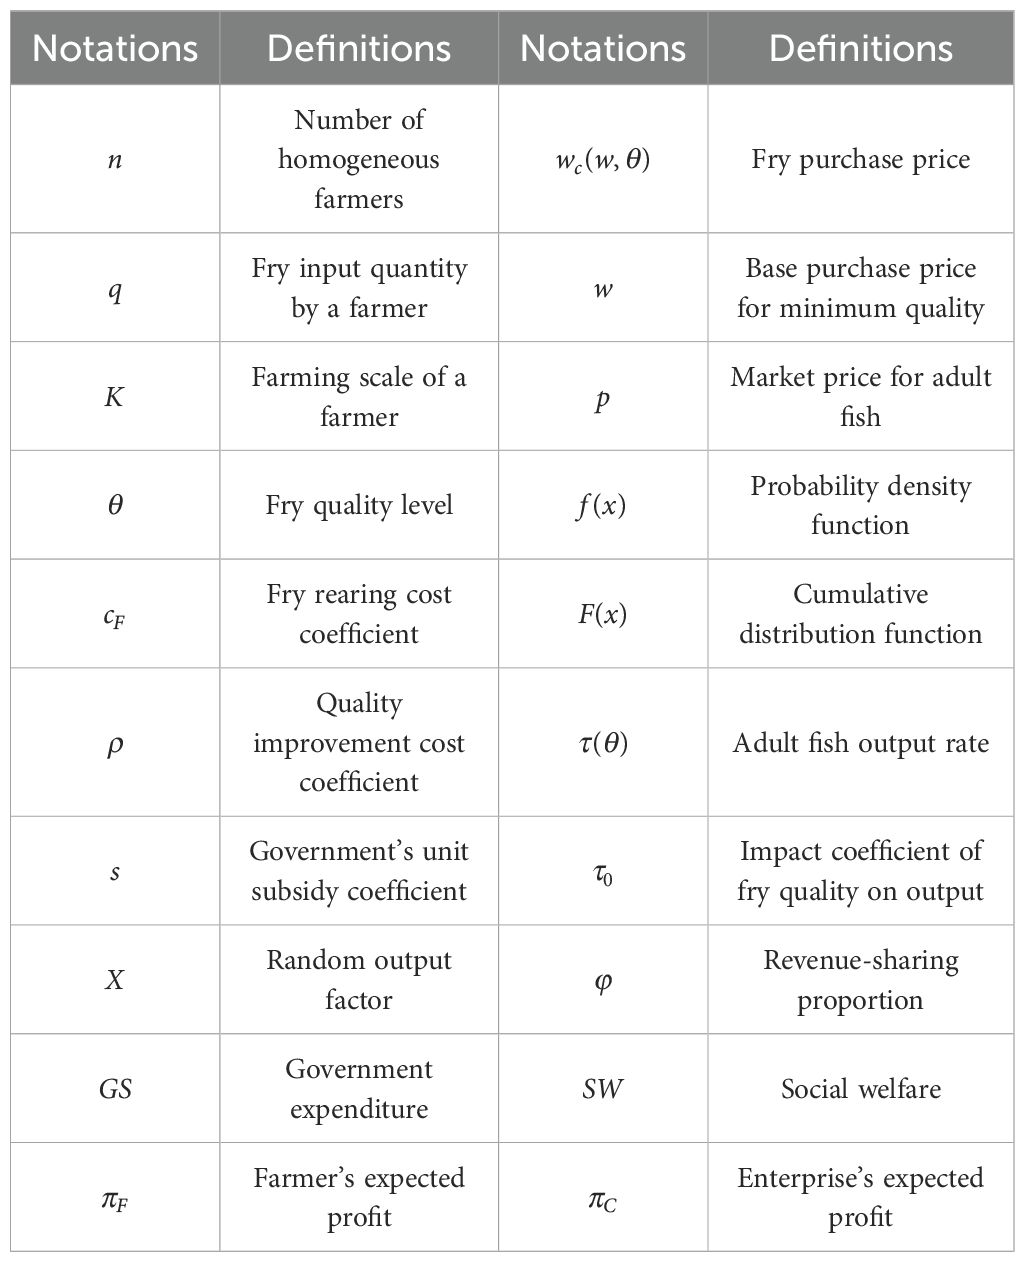
Table 1. Mathematical notations and definitions.
4 Model formulation and analysis
4.1 Benchmark scenario
In the benchmark scenario, a farmer’s income comes from selling fry to the enterprise, and the farmer’s costs are the sum of fry rearing and quality improvement costs. The farmer faces production risk; the actual quantity delivered to the enterprise is . Thus, the farmer’s stochastic profit function is given by Equation 1:
To characterize the farmer’s risk aversion, the Conditional Value-at-Risk (CVaR) criterion is adopted to measure and analyze their optimal decision. According to the general definition of CVaR (Kazaz and Webster, 2011; Ye et al., 2020), the objective function for a risk-averse farmer, as defined in Equation 1, is transformed into Equation 2:
where represents the quantile of , is the expectation operator, and denotes the farmer’s degree of risk aversion. A larger indicates greater risk aversion. The farmer is risk-neutral when .
The enterprise’s income comes from selling adult fish on the market, and its cost is the expense of purchasing fry. Influenced by fry quality, the final output of adult fish from deep-sea aquaculture is , the enterprise’s expected profit is given by Equation 3:
Theorem 1 The equilibrium strategies for the supply chain members in the benchmark scenario are as follows:
(1) When , , , , , ;
(2) When , , , , , .
Here, , .
To explore the impact of the risk aversion degree on supply chain decisions under different farming scales, we analyze Theorem 1 further, yielding Corollary 1.
Corollary 1 (1) When , , , ;
(2) When , , , , , .
Corollary 1 (1) indicates that when the farming scale is small ( ), the farmer cannot achieve the profit-maximizing equilibrium decision due to the scale constraint, and the fry input quantity remains at the maximum level allowed by their capacity. At this point, the farmer’s input quantity and profit are unaffected by their degree of risk aversion. As risk aversion increases, the farmer tends to maintain a lower fry quality level to ensure income stability and reduce production volatility. Intuitively, one might expect the enterprise to lower the purchase price in response to reduced farmer motivation. However, Corollary 1(1) reveals that the enterprise’s base purchase price is positively related to the small-scale farmer’s risk aversion. The reason is that lower fry quality leads to a risk of decreased adult fish output rate for the enterprise in the subsequent deep-sea stage. To secure higher quality fry and improve the output rate, the enterprise is motivated to offer a higher purchase price to counteract the conservative (low-quality) production strategy adopted by the risk-averse, small-scale farmer. Nevertheless, since the actual fry supply is capped by the scale constraint and cannot be expanded, the enterprise is forced to pay a higher unit price, leading to increased total expenditure. Consequently, the enterprise’s profit ultimately decreases due to insufficient fry supply, inferior quality, and rising costs.
Corollary 1 (2) indicates that when the farming scale is large ( ), the farmer’s fry input quantity and quality level decrease as their risk aversion increases. This is because risk-averse farmers prioritize the sustainability of their operation. Large-scale production inputs and investments in high quality involve higher cost and risk, which conflict with the goal of long-term stable operation. Therefore, the farmer adjusts their production decisions, reducing both input quantity and quality level to establish a more robust farming model. In this process, the farmer’s profit declines, both due to their voluntary reduction in production scale and the consequent lower remuneration from the quality-based procurement contract. Contrary to the conclusion in Corollary 1(1), Corollary 1(2) reveals that when a large-scale farmer’s risk aversion increases, the enterprise chooses to reduce the purchase price. The reason is that the enterprise, as the Stackelberg leader, anticipates that the farmer will reduce input and quality to mitigate risk and cost. Leveraging its first-mover advantage in pricing, the enterprise lowers the purchase price to adapt to the farmer’s revised production decisions and maintain its own profit balance. However, the reduction in the enterprise’s unit expenditure cannot fully offset the negative impact caused by the decreased fry input quantity and quality, so its profit level ultimately still shows a declining trend.
4.2 Input subsidy scenario
Under the input subsidy scenario, the government provides a subsidy to farmers based on fry input quantity and quality . Compared to the benchmark, the enterprise’s expected profit function remains unchanged (Equation 3). The farmer’s stochastic profit function includes an additional government subsidy term, which becomes Equation 4:
Applying the CVaR criterion, the farmer’s objective function becomes Equation 5:
Theorem 2 The equilibrium strategies under the input subsidy scenario are:
(1) When , , , , , ;
(2) When , , , , , .
Here, .
To investigate the impact mechanism of the input subsidy strategy on the land-sea relay system, we compare the decisions under this scenario with the benchmark (Theorem 1) across different farming scales, yielding Proposition 1.
Proposition 1 (1) . If , then , ; if , then , ; if , then , ;
(2) . If , then ; if , then .
Here, .
Proposition 1 (1) indicates that the government’s input subsidy effectively incentivizes farmers to improve fry quality. However, when the farming scale is small ( ), the fry input quantity under the input subsidy equals that of the no-subsidy case. In this case, the enterprise can acquire higher-quality fry at a lower base price. The subsidy motivates farmers to exert more effort, thus improving quality. Yet, physical constraints (facilities, sea area) limit scale expansion, preventing farmers from achieving the profit-maximizing input level. The small scale and limited overall output mean even a lower price effectively incentivizes production. As scale increases ( ), the input subsidy incentivizes farmers to increase input quantity. Notably, the enterprise lowers the base price for medium-scale farmers ( ) but raises it for large-scale farmers ( ). In the enterprise-farmer game, the enterprise, holding a stronger position, anticipates the subsidy will spur greater farmer effort. It slightly reduces the price to increase its own profit without dampening farmer enthusiasm. For large-scale farmers, their scale advantage and ability to supply concentrated, high-quality fry with subsidy support motivate the enterprise to offer a higher price.
Proposition 1 (2) shows that the input subsidy increases the enterprise’s profit. As analyzed, farmers exert more effort under the subsidy, leading to a supply of higher-quality fry. This significantly improves the output rate in the deep-sea aquaculture stage, ensures smooth operation of the enterprise’s production plan, and consequently yields higher expected profit for the enterprise. When the farming scale is small ( ), farmers cannot fully utilize the government funds due to scale constraints, so their profit remains unchanged. When the scale is large ( ), the input subsidy effectively reduces the farmers’ cost burden, incentivizes greater effort in the land-based fry rearing stage, and increases their expected profit, thereby achieving coordination between upstream and downstream segments of the supply chain.
4.3 Purchase subsidy scenario
Under the purchase subsidy scenario, the government provides a subsidy to the enterprise based on the quantity and quality of fry purchased. To align incentives, the enterprise shares a proportion of the actual sales revenue with the farmers. Compared to the benchmark, the farmer’s stochastic profit function includes an additional revenue sharing term, which becomes Equation 6:
Applying the CVaR criterion, the farmer’s objective function becomes Equation 7:
The enterprise’s expected profit function includes the government purchase subsidy, thus Equation 3 is rewritten as Equation 8:
Theorem 3 The equilibrium strategies under the purchase subsidy scenario are:
(1) When , , , , , ;
(2) When , , , , , .
Here, .
To investigate the impact mechanism of the purchase subsidy strategy, we compare the decisions under this scenario with the benchmark (Theorem 1) across different farming scales, yielding Proposition 2.
Proposition 2 (1) . If , then , ; if , then , ; if , then , ;
(2) . If , then ; if , then .
Here, .
Proposition 2(1) indicates that the purchase subsidy to the enterprise indirectly incentivizes farmers to improve fry quality. Similar to the input subsidy, when the scale is small ( ), the fry input quantity remains the same as the benchmark due to the constraint. The revenue-sharing contract transfers part of the enterprise’s income to farmers, so even a lower base price effectively incentivizes greater farming effort, allowing farmers to gain higher shares from adult fish sales. As scale increases ( ), farmers, anticipating increased demand from the subsidized enterprise, expand their input up to their capacity limit. For medium-scale farmers ( ), their input remains limited, so the enterprise has an incentive to moderately reduce the purchase price to prevent its profit margin from being excessively squeezed by the high revenue sharing. For large-scale farmers ( ), their stronger position and production capacity motivate the enterprise to offer a higher base price on top of revenue sharing, implementing stronger incentives to encourage increased farming effort.
Proposition 2(2) shows that the purchase subsidy increases the enterprise’s profit. The subsidy provides a stronger motive for the enterprise to acquire high-quality fry, while the revenue-sharing contract indirectly incentivizes farmers to increase effort, creating extra profit for the entire supply chain. When the farming scale is small ( ), farmers cannot achieve the profit-maximizing equilibrium due to the constraint, so the purchase subsidy does not effectively increase their profit. When the scale is large ( ), the government’s purchase subsidy to the enterprise, facilitated by the revenue-sharing mechanism, more effectively incentivizes farmers to increase effort, thereby significantly raising the farmers’ profit level.
4.4 Comparative analysis of the two government subsidy strategies
Based on the results from Theorems 2 and 3, we further analyze the relative incentive effects and underlying mechanisms of the two subsidy strategies under different revenue-sharing proportions and farming scales.
Proposition 3 (1) If , then ; otherwise, .
(2) If , when , ; when , . If , when , ; when , .
To visually illustrate Proposition 4, a schematic diagram (Figure 2) is presented as shown below. Let and . Relevant parameters and the proof process can be found in the Appendix.
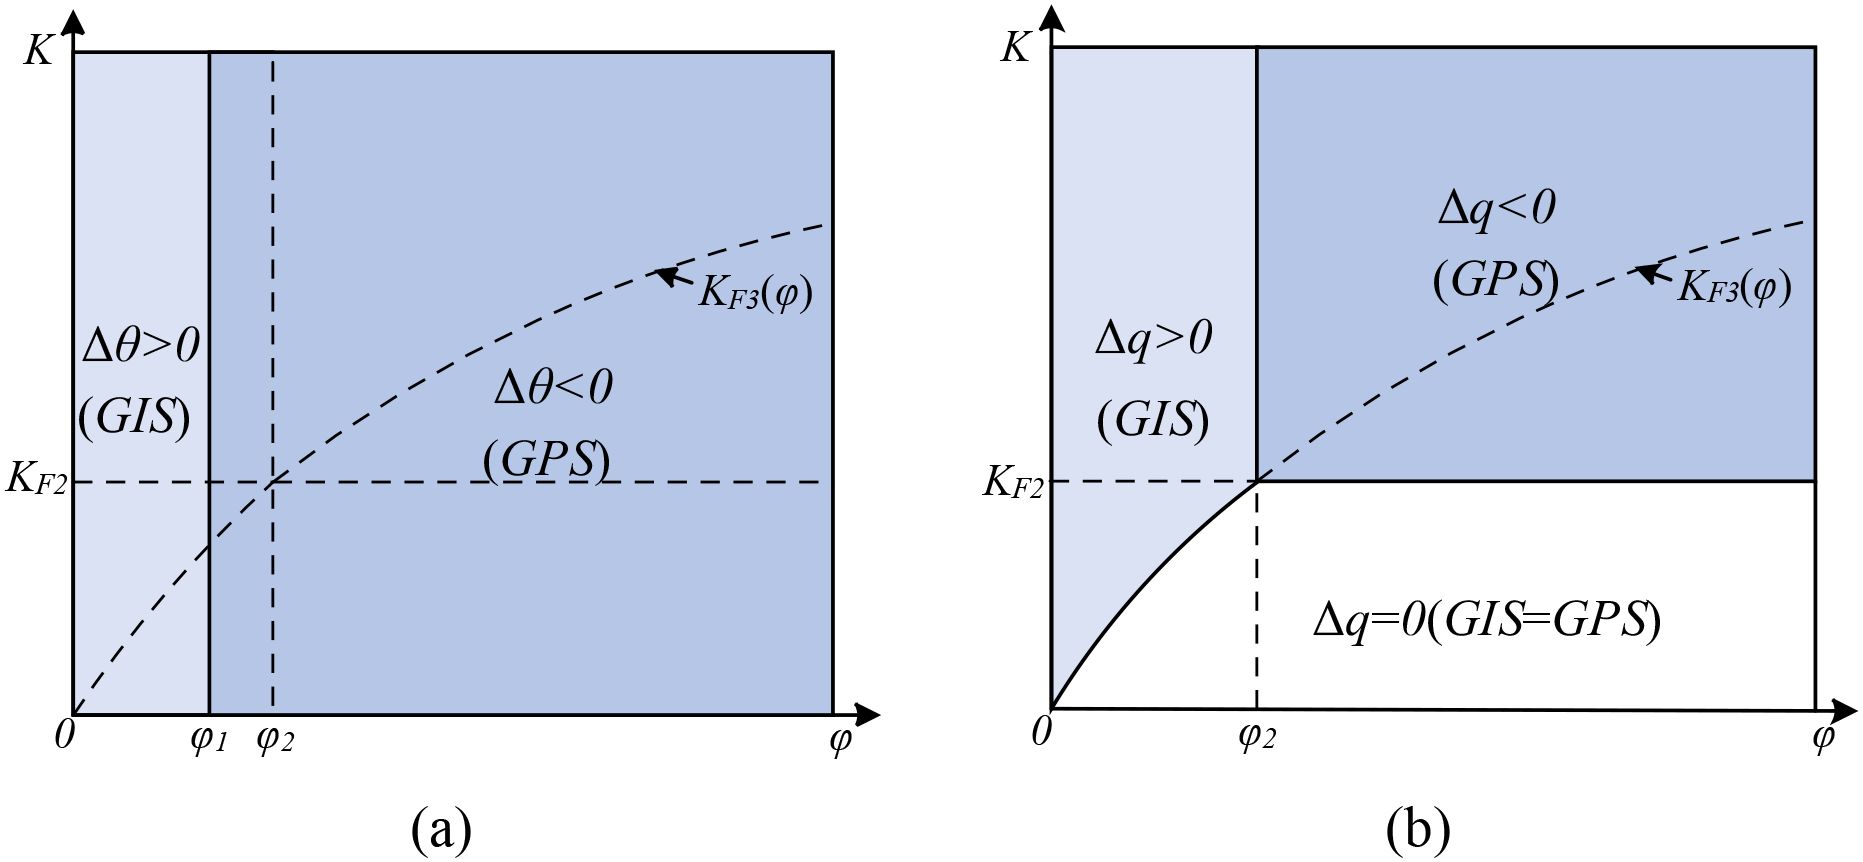
Figure 2. (a, b) Comparison of farmer production decisions under the two subsidy strategies (, , , , , , follows a uniform distribution on the interval ).
Proposition 3 (1) indicates that the incentive effect of the two subsidy strategies on fry quality improvement is unaffected by the farming scale constraint and depends solely on the revenue-sharing proportion. When the revenue-sharing proportion is low ( ), the input subsidy directly reduces the farmer’s costs, strongly motivating them to improve fry quality (Region in Figure 2a). When the revenue-sharing proportion is high ( ), the farmer receives a larger share of the final sales revenue, making the returns from quality improvement more substantial and thus making the purchase subsidy a more effective incentive mechanism (Region in Figure 2a).
Proposition 3 (2) shows that the incentive effect on fry input quantity is influenced by both the revenue-sharing proportion and the farming scale constraint. When the revenue-sharing proportion is low ( ), farmers gain limited income from adult fish sales, so the marginal benefit of increasing input is low. For large-scale farmers ( ), the input subsidy directly reduces fry and production costs, significantly incentivizing increased input (Region in Figure 2b). However, as the revenue-sharing proportion increases, the cost-saving effect of the input subsidy is diluted, and its advantage diminishes. When the revenue-sharing proportion is high ( ), farmers hold a more favorable position in profit distribution. Coupled with the enterprise’s incentive to offer a higher price under the purchase subsidy, the farmer’s expected profit increases, making the purchase subsidy more effective in encouraging large-scale farmers ( ) to increase input (Region in Figure 2b). Notably, when the scale is small ( ), the fry input has reached the capacity upper limit under both strategies, and neither can further stimulate input expansion; thus, their incentive effects are equivalent (Region in Figure 2b).
To examine whether the degree of risk aversion affects the incentive effectiveness of the government subsidies, we analyze Proposition 3 further, yielding Corollary 2.
Corollary 2 (1) ; (2) .
Corollary 2 indicates that as risk aversion increases, the purchase subsidy requires a higher revenue-sharing proportion (compared to the input subsidy) to effectively incentivize farmers to increase production input. Higher risk aversion makes farmers more conservative. Only when the revenue share is sufficiently large can the purchase subsidy, by raising expected income, serve as an effective indirect incentive. This acts as a risk compensation mechanism: the enterprise increases the revenue share, allowing the farmer to maintain lower-risk production inputs while receiving sufficient economic return, thus mitigating the lack of production motivation caused by excessive risk aversion.
Further exploring the impact of the two subsidy strategies on farmer profit, enterprise profit, and social welfare across different revenue-sharing proportion and Farming scale yields Proposition 4. With the adult fish price being exogenous, consumer surplus translates into centralized supply chain benefit, thus social welfare is .
Proposition 4 (1) If , ; when , , when , . If , ; when , , when , .
(2) If , ; if , when , , when , ; if , .
To visually illustrate Proposition 4, a schematic diagram (Figure 3) is presented as shown below. Let and . Relevant parameters and the proof process can be found in the Appendix.
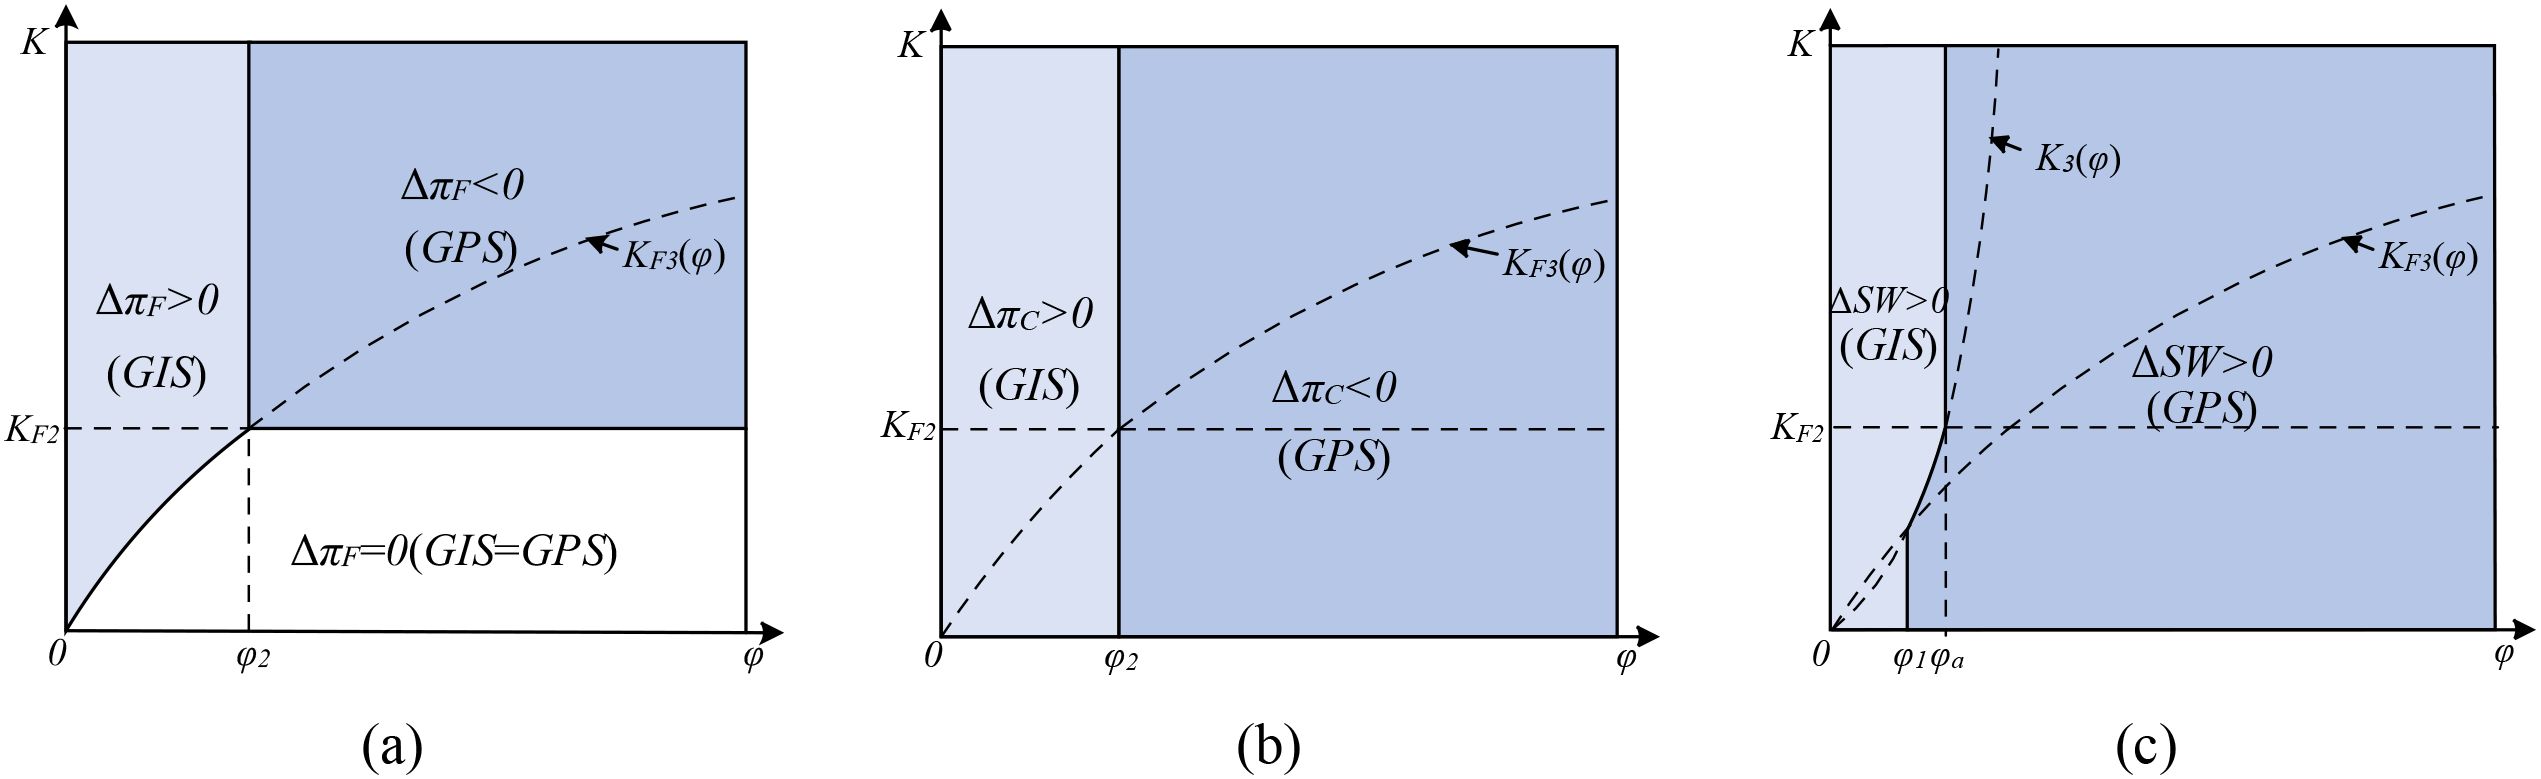
Figure 3. (a–c) Comparison of profit in the deep-sea aquaculture system under the two subsidy strategies (, , , , , , follows a uniform distribution on the interval ).
Proposition 4(1) shows that when the revenue-sharing proportion is low ( ), the input subsidy brings more profit to the enterprise (Region in Figure 3b). When the revenue-sharing proportion is high ( ), the purchase subsidy brings more profit to the enterprise (Region in Figure 3b). Intuitively, a low revenue-sharing proportion means the enterprise gives up less revenue from final sales. However, the finding that the enterprise prefers the input subsidy when the revenue-sharing proportion is low might stem from the purchase subsidy with low the revenue-sharing proportion reducing farmer enthusiasm, leading to a lack of high-quality fry and thus lower overall supply chain profit. Similarly, when the revenue-sharing proportion is low ( ), farmers profit more from the input subsidy (Region in Figure 3a), and when the revenue-sharing proportion is high ( ), they profit more from the purchase subsidy (Region in Figure 3a). This is because, under low revenue-sharing proportion, farmers gain little from the revenue-sharing contract; their profit comes mainly from selling fry. The purchase subsidy under low revenue-sharing proportion might lower farmers’ profit expectations and weaken their motivation, whereas the input subsidy directly reduces their burden and increases profit potential, incentivizing effort. Thus, farmers prefer the input subsidy when the revenue-sharing proportion is low and the purchase subsidy when the revenue-sharing proportion is high. Notably, when the farming scale is small ( ), farmer profit is equal under both strategies (Region in Figure 3a) because the scale constraint binds, preventing profit-maximizing decisions.
Proposition 4(2) indicates that when the revenue-sharing proportion is low ( ), the input subsidy generally improves social welfare more effectively (Region in Figure 3c). Based on Propositions 3 and 4(1), under low revenue-sharing proportion, the input subsidy leads to fry quality and input that are no worse than under the purchase subsidy, bringing higher profits to both farmers and the enterprise and creating extra profit for the entire supply chain. Particularly, when the revenue-sharing proportion is medium ( ) and the scale is small ( ), farmers struggle to utilize the cost compensation mechanism fully. The purchase subsidy, aided by revenue sharing, alleviates the lack of incentive under scale constraints, achieving a local Pareto improvement in welfare. When the revenue-sharing proportion is high ( ), the purchase subsidy improves social welfare more significantly (Region in Figure 3c). A high revenue-sharing proportion effectively indirectly incentivizes farmers to improve quality. Furthermore, supported by the purchase subsidy, the enterprise is motivated to offer a higher price, incentivizing large-scale farmers to supply high-quality fry. This synergy significantly increases the output rate in the deep-sea stage and the overall profit of the supply chain, leading to greater social welfare gains.
Based on this, we characterize the advantage intervals of the two subsidy strategies from the perspectives of revenue-sharing proportion and farming scale constraint, yielding Corollary 3.
Corollary 3 The set is the advantage interval for the input subsidy strategy. The set is the advantage interval for the purchase subsidy strategy. To visually illustrate Corollary 3, a schematic diagram (Figure 4) is presented as shown below.
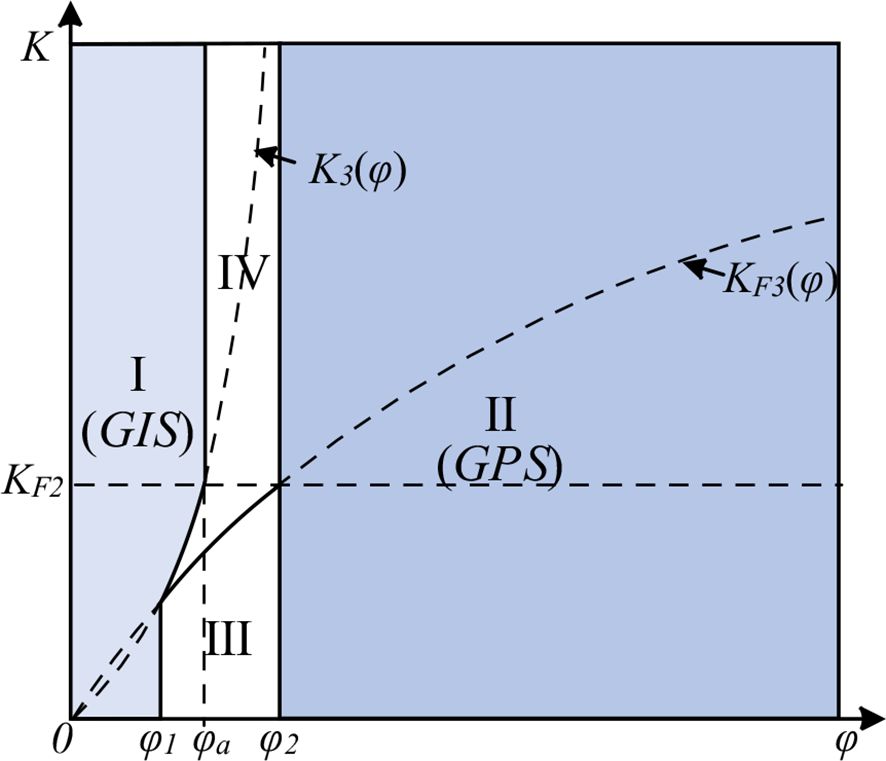
Figure 4. Advantage intervals of the government subsidy strategies (, , , , , , follows a uniform distribution on the interval ).
In Interval I, the input subsidy brings more profit to both farmers and the enterprise (is Pareto superior or equivalent) and also leads to better social welfare, indicating coordinated multi-party improvement. In Interval II, the purchase subsidy is the better choice for achieving Pareto improvement and multi-party wins. In Intervals III and IV, the input subsidy brings more profit to the enterprise and the farmer (is Pareto superior or equivalent), but the input subsidy strategy does not maximize social welfare. Therefore, the government should focus on the input subsidy strategy when the revenue-sharing proportion is low, and consider the purchase subsidy strategy more when the revenue-sharing proportion is high. The impact of the farming scale constraint must be fully considered to avoid deviations from the expected policy outcomes. Thus, Corollary 3 provides a concrete decision-making basis for the government to formulate differentiated subsidy strategies.
5 Extension: nonlinear adult fish output rate
This section extends the model by assuming a nonlinear adult fish output rate, , with and , meaning the marginal improvement in the output rate diminishes as fry quality increases, a common assumption in literature (Qian and Olsen, 2022; Li et al., 2024). Specifically, we define , where . The optimal equilibrium solutions under this nonlinear function become analytically complex. Therefore, we employ numerical simulations to illustrate the synergistic effects of the revenue-sharing proportion and farming scale on the government’s subsidy strategy and to verify that the core findings from the theoretical model (with linear output) remain valid.
5.1 Impact of revenue share and farming scale on fry input quantity
Let and . Based on the values of and under different government subsidy strategies, fitting is performed and Figure 5 is plotted.
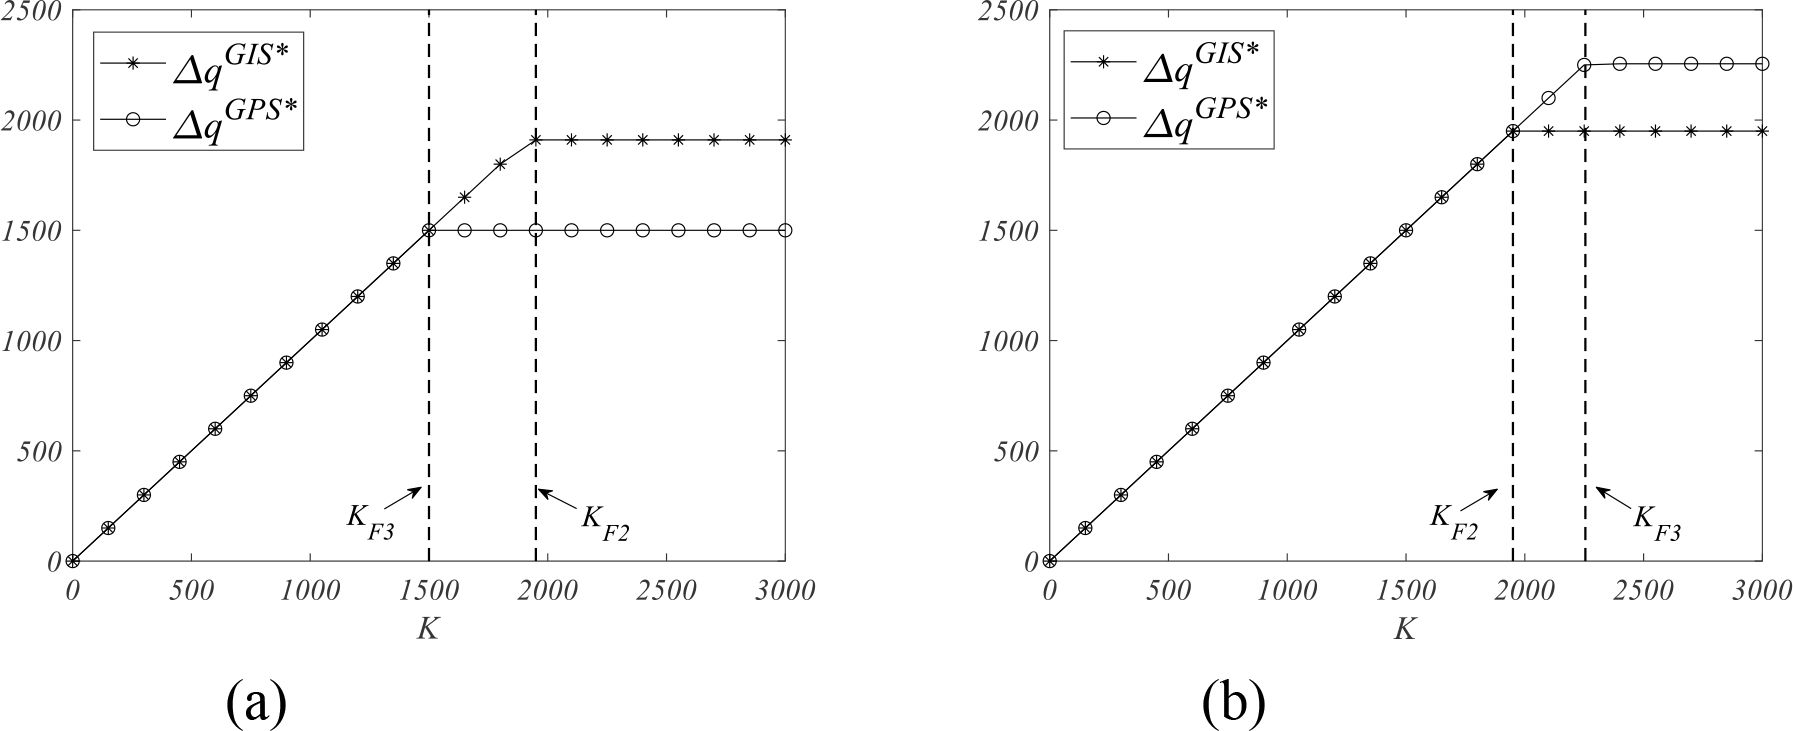
Figure 5. Impact of revenue-sharing proportion and farming scale on farmer’s fry input quantity (, , , , , , , , follows a uniform distribution on the interval ). (a) . (b) .
Figure 5 shows that the optimal input quantity first increases linearly with the farming scale and then stabilizes. When the scale is small ( ), the input quantity is constrained by capacity, preventing farmers from achieving their profit-maximizing equilibrium under either subsidy. The incentive effects of both strategies are equivalent here, because the low base output and limited potential for total revenue growth, which means subsidies have a limited impact on expanding the production scale. When the scale is large ( ) and the revenue-sharing proportion is low ( ), the input subsidy more effectively incentivizes farmers to increase their fry input. Conversely, when the revenue-sharing proportion is high ( ), the purchase subsidy is more effective at encouraging increased input.
Our findings reveal that the effectiveness of government subsidy strategies is highly dependent on the internal benefit distribution mechanism within the supply chain. When supply chain coordination is weak (i.e., the revenue-sharing proportion is low), direct production-side subsidy (input subsidy) serves as a more reliable incentive tool. Conversely, when enterprise is willing to establish a deep community of interests with farmers (i.e., the revenue-sharing proportion is high), subsidy tied to market outcomes (purchase subsidy) can achieve maximum effectiveness through a “leverage effect”.
5.2 Impact of revenue share and farming scale on farmer profit
Let and . Based on the values of and under different government subsidy strategies, fitting is performed and Figure 6 is plotted.
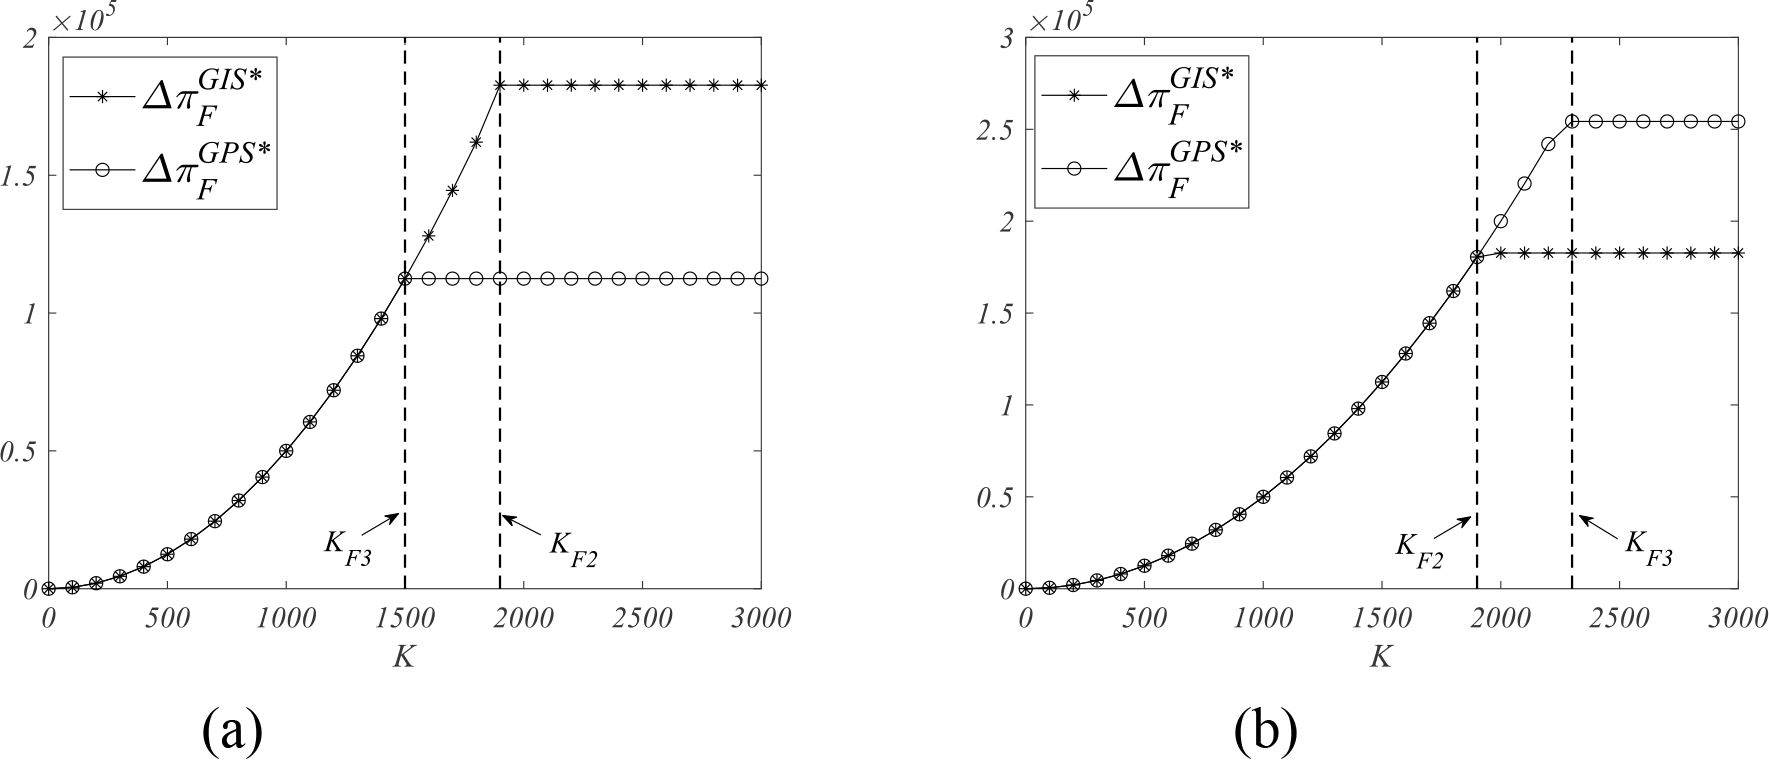
Figure 6. Impact of revenue-sharing proportion and farming scale on farmer’s profit (, , , , , , , , follows a uniform distribution on the interval ). (a) . (b) .
Figure 6 shows that under both subsidies, farmer profit increases with the farming scale, exhibiting increasing marginal returns before stabilizing. Figure 6a shows that when the revenue-sharing proportion is low ( ), the input subsidy yields higher profit for large-scale farmers ( ). This aligns with Proposition 4(1): under a low revenue-sharing proportion, farmers gain little indirect benefit from the purchase subsidy, while the input subsidy directly reduces production costs and increases profit. Figure 6b shows that when the revenue-sharing proportion is high ( ), the purchase subsidy yields higher profit for large-scale farmers ( ). Notably, when the scale is small ( ), farmer profit is equal under both strategies () as the binding constraint dominates.
This phenomenon highlights the divergent empowerment pathways of different subsidy strategies on farmers’ income. Input subsidy function as an “ex-ante safeguard,” directly reducing production costs to enhance profit margins for farmers. In contrast, the combination of purchase subsidy and revenue-sharing operates as an “ex-post incentive,” whose efficacy depends on whether farmers can secure a sufficient share of the final market value. As observed in the numerical results of Figure 6b, for farmers who have achieved a certain scale and can participate in value distribution, purchase subsidy offers a higher income ceiling.
5.3 Impact of revenue share and farming scale on enterprise profit
Let and . Based on the values of and under different government subsidy strategies, fitting is performed and Figure 7 is plotted.
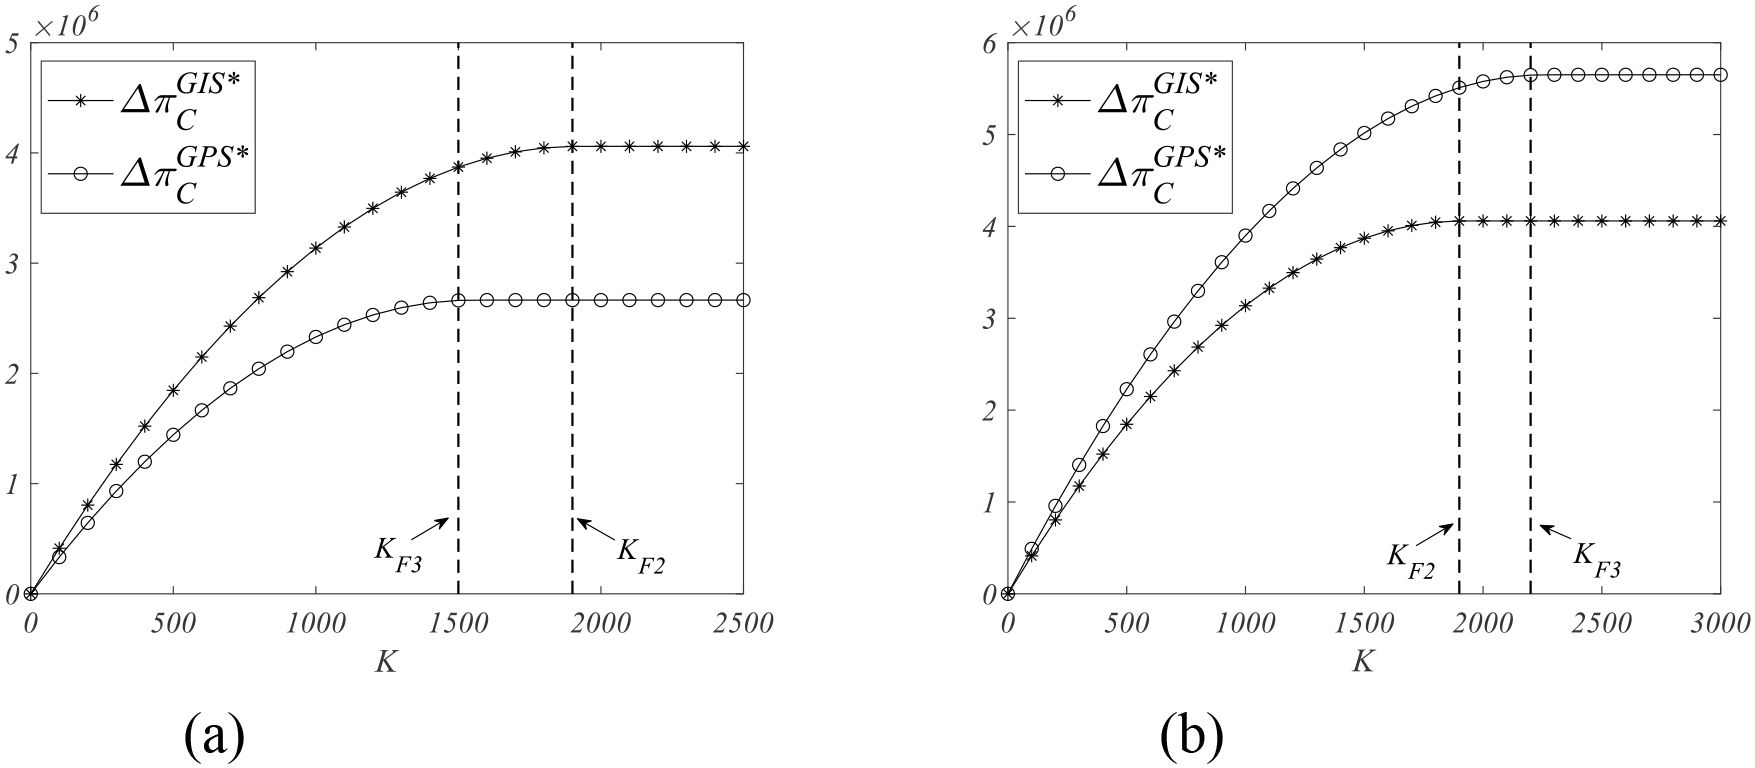
Figure 7. Impact of revenue-sharing proportion and farming scale on enterprise’s profit (, , , , , , , , follows a uniform distribution on the interval ). (a) (b) .
Figure 7 shows that the enterprise’s profit increases with the farming scale under both subsidies, with the growth rate gradually slowing. Comparing Figures 7a, b reveals that the revenue-sharing proportion is a key factor influencing the enterprise’s preference. Figure 7a shows that when the revenue-sharing proportion is low ( ), the enterprise prefers the input subsidy. This aligns with Proposition 4(1): the input subsidy lowers farmers’ costs, incentivizing greater input and ultimately increasing enterprise profit. Figure 7b shows that when the revenue-sharing proportion is high ( ), the enterprise prefers the purchase subsidy. In this case, the high revenue share effectively incentivizes farmers to increase their effort and input, creating a win-win situation that boosts enterprise profit.
Enterprise’s strategic preferences reflect its optimal choices under different contexts. Under low revenue-sharing conditions, enterprise essentially treats farmers as “suppliers,” where input subsidy most effectively helps reduce upstream procurement costs. Under high revenue-sharing conditions, the relationship between enterprise and farmers resembles a “partnership,” where purchase subsidy incentivizes partners to improve input quality. Even if enterprise needs to share a portion of its revenue, its total income can still achieve growth.
5.4 Impact of revenue share and farming scale on social welfare
Let and . Based on the values of and under different government subsidy strategies, fitting is performed and Figure 8 is plotted.
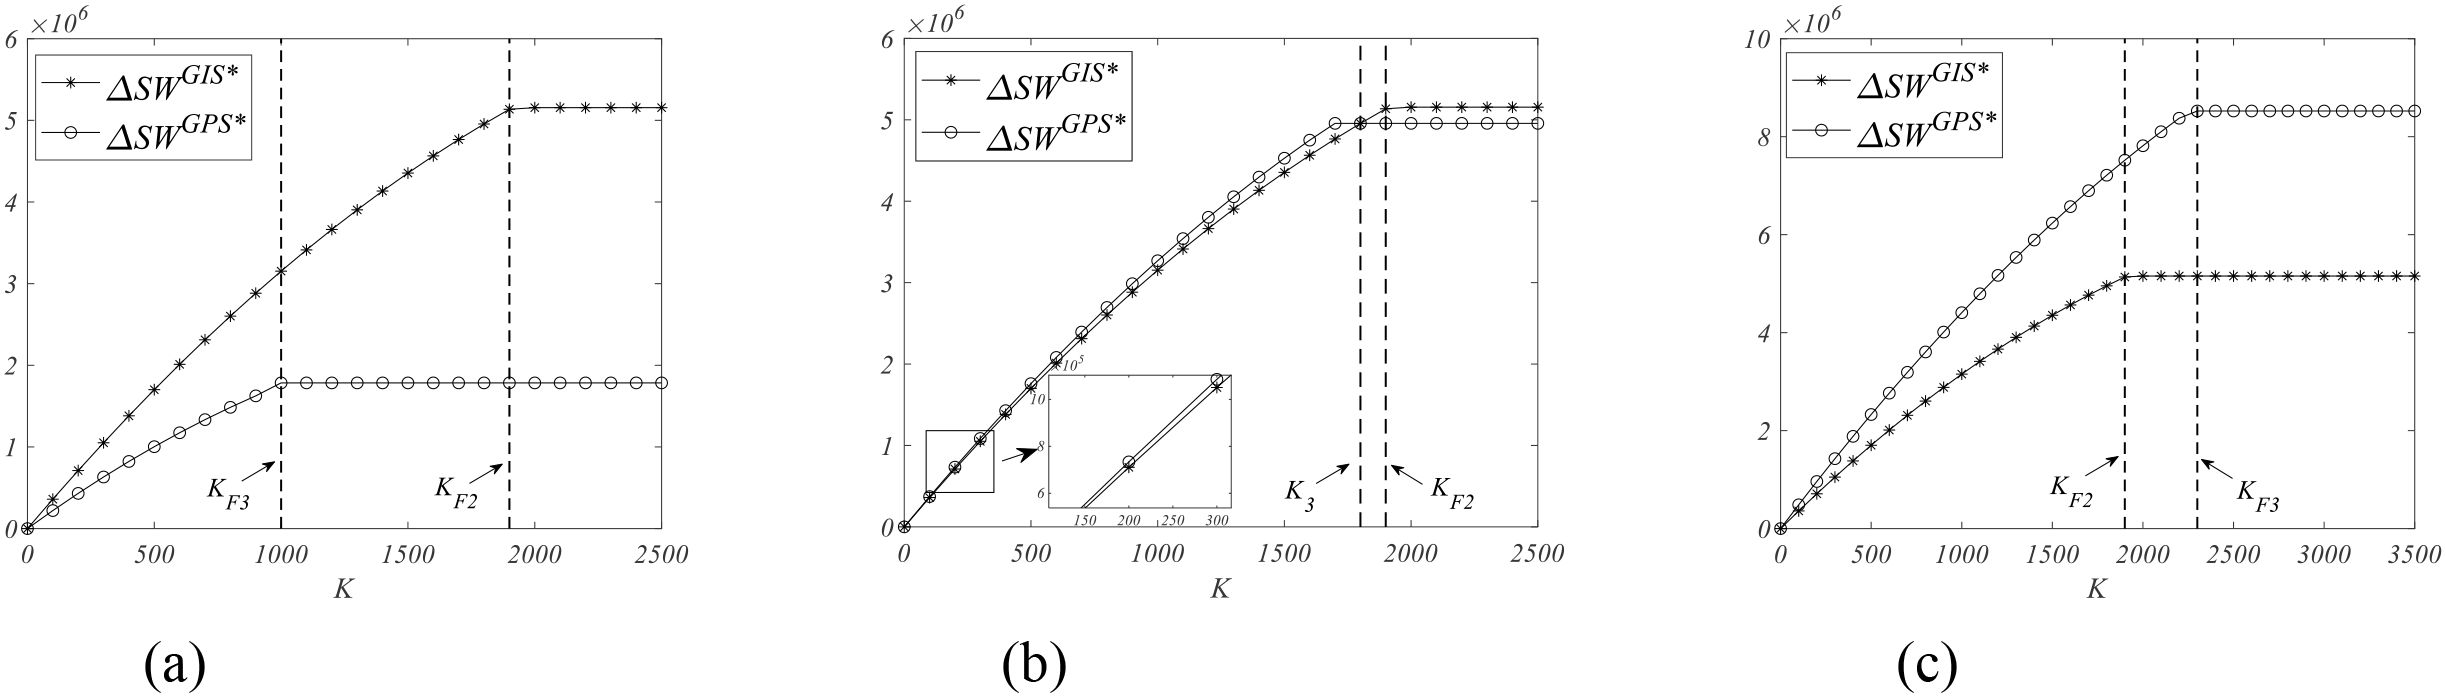
Figure 8. Impact of revenue-sharing proportion and farming scale on social welfare (, , , , , , , , follows a uniform distribution on the interval ). (a) . (b) . (c) .
Figure 8 shows that social welfare and follows a pattern similar to enterprise profit in Figure 7: it increases slowly with the farming scale under subsidy before stabilizing. This is because welfare and profit are highly sensitive to scale expansion when farming scale is small, but the growth rate diminishes due to resource constraints and market saturation as scale increases further. Figure 8a shows that when the revenue-sharing proportion is low ( ), the input subsidy leads to higher social welfare. Figure 8b shows that for a medium revenue-sharing proportion ( ) and a small farming scale ( ), the purchase subsidy results in higher social welfare. Figure 8c shows that when the revenue-sharing proportion is high ( ), the purchase subsidy improves social welfare more significantly.
Maximizing social welfare is the ultimate goal of government decision-making. Our numerical analysis reveals a dynamic pathway to achieve this objective. In the early stages of industrial development or under loose cooperation (small scale, low revenue-sharing), the government’s primary goal is to ensure supply stability and production foundations. At this stage, input subsidy is a more direct and effective tool, as it can quickly stimulate production and prevent supply chain disruptions. As the industry matures and collaborative mechanisms are established (large scale, high revenue-sharing), policy objectives should shift toward enhancing the efficiency and value of the entire industrial chain. At this point, purchase subsidy, through market-linked incentive mechanisms, can more precisely drive high-quality production, thereby achieving the maximization of social welfare.
6 Conclusion
In recent years, to implement the concept of diverse food sources and expand the production capacity of the blue food granary, coastal regions in China such as Shandong, Fujian, Guangdong, and Zhejiang have actively explored the land-sea relay aquaculture mode and vigorously developed deep-sea aquaculture. However, challenges such as the long cycle and high risk of land-based fry rearing, coupled with unfair profit distribution, dampen farmers’ enthusiasm for producing high-quality fry. This creates an operational risk of disruption in deep-sea aquaculture due to a shortage of quality fry. This study addresses the two-stage relay system comprising land-based fry rearing and deep-sea aquaculture. By modeling the impact mechanism of fry quality on the adult fish output rate, we construct a two-stage game-theoretic model for three scenarios: no subsidy, input subsidy, and purchase subsidy. We compare and analyze the effects of these government subsidy strategies on the decisions, profits, and social welfare of supply chain members. Our findings are:
(1) Under the government subsidy, the enterprise adopts differentiated pricing based on farmer scale, offering lower prices to small-scale farmers and higher prices to large-scale ones. Both input and purchase subsidies effectively incentivize farmers to improve fry quality and increase supply. Notably, when farmers operate at their scale constraint upper limit, their fry input quantity is unaffected by the subsidy strategy or the enterprise’s decision.
(2) The comparative advantage of a subsidy strategy depends on the revenue-sharing proportion and the farming scale constraint. The farmer’s risk aversion degree influences the threshold for the revenue-sharing proportion, which increases as risk aversion grows.
(3) We characterize the advantage intervals for both strategies based on the revenue-sharing proportion and farming scale constraint. Specifically, the government should prioritize the input subsidy when the revenue-sharing proportion is low and consider the purchase subsidy more when the revenue-sharing proportion is high. This provides concrete guiding principles for subsidy strategy selection.
Currently, as Chinese coastal regions vigorously develop deep-sea aquaculture. The research supports a phased policy roadmap: initial-stage input subsidy to secure production foundations, transitioning to mature-stage purchase subsidy with revenue-sharing to drive quality and value. This adaptive approach ensures optimal social welfare outcomes by aligning government intervention with industry evolution. This study has two main limitations due to necessary modeling simplifications. First, the assumption of homogeneous risk-averse farmers simplifies analysis but overlooks real-world heterogeneity in operation scale, risk tolerance, and technology adoption, potentially affecting revenue-sharing contract design and policy evaluation accuracy. Second, while focusing on production risks in land-based fry rearing, the model excludes production risks in deep-sea grow-out phases and market risks from concentrated harvests. Future research should examine how these risks propagate through the supply chain and affect operational decisions and policy design in land-sea relay aquaculture systems.
Data availability statement
The original contributions presented in the study are included in the article/Supplementary Material. Further inquiries can be directed to the corresponding authors.
Author contributions
DH: Writing – original draft. BG: Funding acquisition, Methodology, Writing – review & editing. YF: Conceptualization, Writing – review & editing.
Funding
The author(s) declare financial support was received for the research and/or publication of this article. This research was supported by the National Social Science Fund of China (Grant No. 24BGL222), the Major Program of the National Social Science Foundation of China (Grant No. 22&ZD152), Zhoushan Science and Technology Program Project (Grant No. 2022C41024).
Conflict of interest
The authors declare that the research was conducted in the absence of any commercial or financial relationships that could be construed as a potential conflict of interest.
Generative AI statement
The author(s) declare that no Generative AI was used in the creation of this manuscript.
Any alternative text (alt text) provided alongside figures in this article has been generated by Frontiers with the support of artificial intelligence and reasonable efforts have been made to ensure accuracy, including review by the authors wherever possible. If you identify any issues, please contact us.
Publisher’s note
All claims expressed in this article are solely those of the authors and do not necessarily represent those of their affiliated organizations, or those of the publisher, the editors and the reviewers. Any product that may be evaluated in this article, or claim that may be made by its manufacturer, is not guaranteed or endorsed by the publisher.
Supplementary material
The Supplementary Material for this article can be found online at: https://www.frontiersin.org/articles/10.3389/fmars.2025.1711293/full#supplementary-material
References
Akkaya D., Bimpikis K., and Lee H. (2020). Government interventions to promote agricultural innovation. Manuf. Serv. Oper. Manage., msom.2019.0834. doi: 10.1287/msom.2019.0834
Alizamir S., Iravani F., and Mamani H. (2019). An analysis of price vs. Revenue protection: government subsidies in the agriculture industry. Manage. Sci. 65, 32–49. doi: 10.1287/mnsc.2017.2927
Almeida M., Laranjeiro D., Costa R., Lillebø A. I., and Vieira H. (2025). Blue economy concepts are lagging behind in ocean literacy. Front. Mar. Sci. 12. doi: 10.3389/fmars.2025.1648508
An J., Cho S., and Tang C. S. (2015). Aggregating smallholder farmers in emerging economies. Prod. Oper. Manage. 24, 1414–1429. doi: 10.1111/poms.12372
Ayvaz-Çavdaroğlu N., Kazaz B., and Webster S. (2021). Incentivizing farmers to invest in quality through quality-based payment. Prod. Oper. Manage. 30, 3812–3830. doi: 10.1111/poms.13485
Cai X., Chen J., Xiao Y., and Xu X. (2010). Optimization and coordination of fresh product supply chains with freshness-keeping effort. Prod. Oper. Manage. 19, 261–278. doi: 10.1111/j.1937-5956.2009.01096.x
Cai Z., Ye F., Xie Z., Zhang L., and Cui T. (2021). The choice of cooperation mode in the bioenergy supply chain with random biomass feedstock yield. J. Clean. Prod. 311, 127587. doi: 10.1016/j.jclepro.2021.127587
Çamkaya S., Kaya E., Barut A., Ali K., Pilatin A., and Nassani A. A. (2025). Treasure lying beneath the waters: exploring the deep connections between biodiversity and the blue economy. Front. Mar. Sci. 12. doi: 10.3389/fmars.2025.1624071
Chen J. and Chen Y. (2021). The impact of contract farming on agricultural product supply in developing economies. Prod. Oper. Manage. 30, 2395–2419. doi: 10.1111/poms.13382
Chen S., Su Y., and Hong W. (2018). “Aquaculture of the large yellow croaker,” in Aquaculture in China. Eds. Gui J.-F., Tang Q., Li Z., Liu J., and De Silva S. S. (Wiley) (2018), 297–308. doi: 10.1002/9781119120759.ch3_10
China Daily (2024). “Blue Granary” Advances into the Deep Sea. Available online at: https://baijiahao.baidu.com/s?id=1733587918891920684&wfr=spider&for=pc (Accessed May 8, 2025).
Chintapalli P. and Tang C. S. (2022). Crop minimum support price versus cost subsidy: Farmer and consumer welfare. Prod. Oper. Manage. 31, 1753–1769. doi: 10.1111/poms.13642
Dazhong Daily (2023). A “100 Million Yuan Fish” Leaps Out of the Deep-sea Cage. Available online at: https://baijiahao.baidu.com/s?id=1783894964043125933&wfr=spider&for=pc (Accessed May 8, 2025).
De Zegher J. F., Iancu D. A., and Lee H. L. (2019). Designing contracts and sourcing channels to create shared value. Manuf. Serv. Oper. Manage. 21, 271–289. doi: 10.1287/msom.2017.0627
Dong S., Dong Y., Huang L., Zhou Y., Cao L., Tian X., et al. (2024). Advancements and hurdles of deeper-offshore aquaculture in China. Rev. Aquac. 16, 644–655. doi: 10.1111/raq.12858
Fan T., Feng Q., Li Y., Shanthikumar J. G., and Wu Y. (2024). Output-oriented agricultural subsidy design. Manage. Sci. 70, 1448–1464. doi: 10.1287/mnsc.2023.4749
Feng Y., Guo H., and Gao Y. (2022). Government tax subsidy mechanisms for a “company + farmer” contract-farming supply chain. Oper. Res. Manage. Sci. 31, 211–219. doi: 10.12005/orms.2022.0204
Gu B., Xu L., Fu Y., and Chen J. (2024). Green agricultural technology extension strategies considering industrial organization impacts: Direct subsidy VS indirect incentive. J. Clean. Prod. 479, 143991. doi: 10.1016/j.jclepro.2024.143991
Guo X., Cheng L., and Yu Y. (2022). Government subsidy policy for green and efficient raw materials considering farmer heterogeneity. Prod. Oper. Manage. 31, 4095–4112. doi: 10.1111/poms.13806
Hovelaque V., Duvaleix-Tréguer S., and Cordier J. (2009). Effects of constrained supply and price contracts on agricultural cooperatives. Eur. J. Oper. Res. 199, 769–780. doi: 10.1016/j.ejor.2008.08.005
Hsu V. N., Lai G., and Liang G. (2019). Agricultural partnership for dairy farming. Prod. Oper. Manage. 28, 3042–3059. doi: 10.1111/poms.12992
Huan X., Shan J., Han L., and Song H. (2024). Research on the efficacy and effect assessment of deep-sea aquaculture policies in China: Quantitative analysis of policy texts based on the period 2004–2022. Mar. Policy 160, 105963. doi: 10.1016/j.marpol.2023.105963
Huang J., Ye F., and Zhou G. (2018). Decisions and the value of government compensation in agricultural supply chain under trade credit and uncertainty of production yield. Chin. J. Manage. Sci. 26, 107–117. doi: 10.16381/j.cnki.issn1003-207x.2018.01.011
Kazaz B. and Webster S. (2011). The impact of yield-dependent trading costs on pricing and production planning under supply uncertainty. Manuf. Serv. Oper. Manage. 13, 404–417. doi: 10.1287/msom.1110.0335
Li J., Huang S., Fu H., and Dan B. (2024). Weather risk hedging mechanism for contract farming supply chain with weather-dependent yield. Comput. Ind. Eng. 191, 110157. doi: 10.1016/j.cie.2024.110157
Li Y., Tong Y., Ye F., and Song J. (2020). The choice of the government green subsidy scheme: innovation subsidy vs. product subsidy. Int. J. Prod. Res. 58, 4932–4946. doi: 10.1080/00207543.2020.1730466
Lin J. (2024). Development status and suggestions for equipped deep-sea aquaculture in Fujian province. Fish. Mod. 51, 18–29. doi: 10.3969/j.issn.1007-9580.2024.01.002
Liu G., Xu Y., Ge W., Yang X., Su X., Shen B., et al. (2023). How can marine fishery enable low carbon development in China? Based on system dynamics simulation analysis. Ocean. Coast. Manage. 231, 106382. doi: 10.1016/j.ocecoaman.2022.106382
Ma X., Wang S., Islam S. M. N., and Liu X. (2019). Coordinating a three-echelon fresh agricultural products supply chain considering freshness-keeping effort with asymmetric information. Appl. Math. Model. 67, 337–356. doi: 10.1016/j.apm.2018.10.028
Mu L., Dawande M., Geng X., and Mookerjee V. (2016). Milking the quality test: improving the milk supply chain under competing collection intermediaries. Manage. Sci. 62, 1259–1277. doi: 10.1287/mnsc.2015.2171
Niu B., Jin D., and Pu X. (2016). Coordination of channel members’ efforts and utilities in contract farming operations. Eur. J. Oper. Res. 255, 869–883. doi: 10.1016/j.ejor.2016.05.064
Peng H. and Pang T. (2019). Optimal strategies for a three-level contract-farming supply chain with subsidy. Int. J. Prod. Econ. 216, 274–286. doi: 10.1016/j.ijpe.2019.06.011
Qian X. and Olsen T. L. (2022). Contractual coordination of agricultural marketing cooperatives with quality provisions. Manuf. Serv. Oper. Manage. 24, 3269–3282. doi: 10.1287/msom.2022.1151
Shandong Provincial People’s Governmen (2023). Local Supply of Fish Seedlings for Deep-sea Culture Insufficient. Available online at: http://www.shandong.gov.cn/art/2023/3/17/art_97324_19856.html (Accessed May 8, 2025).
Shi L., Pang T., and Peng H. (2023). Production and green technology investment strategy for contract-farming supply chain under yield insurance. J. Oper. Res. Soc 74, 225–238. doi: 10.1080/01605682.2022.2033141
Tang C. S., Wang Y., and Zhao M. (2024). The impact of input and output farm subsidies on farmer welfare, income disparity, and consumer surplus. Manage. Sci. 70, 3144–3161. doi: 10.1287/mnsc.2023.4850
Tianyan News (2022). Shandong Yantai: Cultivating the “Blue Granary”. Available online at: https://baijiahao.baidu.com/s?id=1733587918891920684&wfr=spider&for=pc (Accessed May 8, 2025).
Xie Z., Yuan S., Zhu J., and Li W. (2023). Contract farming led by a seed enterprise and incentives to produce high quality: Which contract design performs best? Agribusiness 39, 1173–1198. doi: 10.1002/agr.21823
Yan B., Chen X., Cai C., and Guan S. (2020). Supply chain coordination of fresh agricultural products based on consumer behavior. Comput. Oper. Res. 123, 105038. doi: 10.1016/j.cor.2020.105038
Yang J., Xue D., and Zhou W. (2024). Quality improvement through contract design and competition in agricultural suppply chains. J. Syst. Sci. Syst. Eng. 33, 716–735. doi: 10.1007/s11518-024-5605-0
Ye F., Cai Z., Chen Y., Li Y., and Hou G. (2021). Subsidize farmers or bioenergy producer? The design of a government subsidy program for a bioenergy supply chain. Nav. Res. Logist. NRL. 68, 1082–1097. doi: 10.1002/nav.21909
Ye F., Lin Q., and Li Y. (2020). Coordination for contract farming supply chain with stochastic yield and demand under CVaR criterion. Oper. Res. 20, 369–397. doi: 10.1007/s12351-017-0328-3
Yu J., Bonroy O., and Bouamra-Mechemache Z. (2023). Quality and quantity incentives under downstream contracts: A role for agricultural cooperatives? Am. J. Agric. Econ. 105, 1176–1196. doi: 10.1111/ajae.12352
Yu J. and Wang Y. (2023). Evolution of deep-sea fisheries policies in China: Review, performance and prospects. Fish. Manage. Ecol. 30, 109–120. doi: 10.1111/fme.12608
Yu J., Yin W., and Liu D. (2020). Evolution of mariculture policies in China: Experience and challenge. Mar. Policy 119, 104062. doi: 10.1016/j.marpol.2020.104062
Zheng S. and Zhang Y. (2024a). Analyzing the evolutionary game of subsidies’ strategy in the digitization of marine ranch: a theoretical framework. Front. Mar. Sci. 11. doi: 10.3389/fmars.2024.1376256
Zheng S. and Zhang Y. (2024b). Can government subsidy promote the light-blue fishery upgrade to deep-blue fishery? Front. Mar. Sci. 11. doi: 10.3389/fmars.2024.1370896
Keywords: land-sea relay aquaculture, input subsidy, purchase subsidy, fry quality, risk aversion, revenue-sharing
Citation: Huang D, Gu B and Fu Y (2025) Subsidy for input or purchase? Research on government subsidy strategies in land-sea relay aquaculture mode. Front. Mar. Sci. 12:1711293. doi: 10.3389/fmars.2025.1711293
Received: 23 September 2025; Accepted: 21 October 2025;
Published: 12 November 2025.
Edited by:
Jinghui Fang, Chinese Academy of Fishery Sciences (CAFS), ChinaReviewed by:
Xueli Ma, Yantai University, ChinaLiu Zifei, Chinese Academy of Fishery Sciences (CAFS), China
Copyright © 2025 Huang, Gu and Fu. This is an open-access article distributed under the terms of the Creative Commons Attribution License (CC BY). The use, distribution or reproduction in other forums is permitted, provided the original author(s) and the copyright owner(s) are credited and that the original publication in this journal is cited, in accordance with accepted academic practice. No use, distribution or reproduction is permitted which does not comply with these terms.
*Correspondence: Bojun Gu, Z3Vib2p1bkB6am91LmVkdS5jbg==; Yufang Fu, ZnV5dWZhbmdAempvdS5lZHUuY24=