 Li Tang1,2,3,4
 Jing-Chun Feng
 Si Zhang
- 1Southern Marine Science and Engineering Guangdong Laboratory, Guangzhou, China
- 2Guangdong Provincial Key Laboratory of Water Quality Improvement and Ecological Restoration for Watersheds, School of Ecology, Environment and Resources, Guangdong University of Technology, Guangzhou, China
- 3Guangdong Basic Research Center of Excellence for Ecological Security and Green Development, Guangdong University of Technology, Guangzhou, China
- 4South China Sea Institute of Oceanology, Chinese Academy of Sciences, Guangzhou, China
Introduction: Tracing methane originating from deep-sea environments is essential for understanding the global methane budget. However, knowledge regarding the mechanisms governing methane transfer from deep-sea sediments to the water column in cold seep environments remains limited. This study aims to quantitatively investigate the distribution of methane and identify its controlling factors within the Haima cold seep areas.
Methods: A comprehensive analysis was conducted to investigate the distribution characteristics of methane and its potential drivers in both the water column and sediment porewaters within the Haima cold seep areas.
Results: The key findings are: (1) Haima cold seeps serve as a methane source to the atmosphere, with pronounced spatial heterogeneity in emission strength across the monitored regions. (2) The vertical distribution of methane is influenced by multiple environmental factors. Key factors in sediment porewaters include sediment depth, porosity, inorganic carbon (IC), chloride (Cl–), and sulfate (SO42–), whereas silicate (SiO32–) and dissolved oxygen (DO) are primary regulators in the water column. (3) Sediments represent a significant methane source for bottom seawater, with methane consumption being more pronounced in seepage areas than in non-seepage areas.
Discussion: This study demonstrates that methane dynamics in the Haima cold seep are complex and driven by a combination of physical, chemical, and biological processes across the sediment–water interface. The identified key drivers underscore the importance of porewater geochemistry and water column biogeochemistry in controlling methane release. These findings significantly advance our understanding of methane transport in deep-sea seep systems and provide crucial insights for refining global methane flux estimates.
Graphical Abstract.
1 Introduction
Methane (CH4) is the second most significant contributor to anthropogenic greenhouse gas radiative forcing. Its global warming potential is 20–40 times greater than that of carbon dioxide on average over a scale of 100 years (IPCC, 2013; Skeie et al., 2023), underscoring its substantial impact on global warming. Natural CH4 seepage from the seafloor is a widespread phenomenon occurring across diverse geological settings, with new seeps continually being discovered worldwide. Among these, cold seeps are key areas of submarine CH4 emission (Feng et al., 2018; Oppo et al., 2020; Razaz et al., 2020). CH4 can enter the atmosphere via both diffusive transport and ebullition across the sediment–water–air interface (Weber et al., 2019). Current estimates indicate that marine seepage releases approximately 20 Tg CH4 per year into the atmosphere, accounting for nearly half of the total geological emissions reaching the sediment–seawater interface (40–60 Tg CH4) (Judd, 2004; Etiope, 2009; Di et al., 2020). These findings underscore the critical role of seafloor CH4 seepage as a major source of CH4 in marine environments.
Extensive research has examined the CH4 distribution in cold seep environments through in-situ sampling surveys. However, most studies have focused primarily on surface seawater and shallow sediments, often treating seawater and sediment as separate systems (Smith and Coffin, 2014; Egger et al., 2018; Zhang et al., 2020; Miao et al., 2022; Xu et al., 2023; Zhang H. et al., 2023). In addition, the migration of CH4 from deep-sea seabeds to the atmosphere is a complex process influenced by multiple environmental factors. For example, biogeochemical processes such as sulfate-driven anaerobic oxidation of CH4 (SD-AOM, Equation 1) play a key role in cold seeps, significantly shaping the CH4 distribution in sediments (Conrad, 2009; Feng et al., 2019). Nearly 90% of CH4 in sediments is estimated to be consumed by AOM, with only a minor fraction escaping into the water column (Reeburgh, 2007). Furthermore, HS− and HCO3– produced during AOM often react with iron (Fe) and alkaline earth metals (e.g., Ca, Mg, and Sr) in porewaters, forming authigenic minerals like iron sulfides (e.g., pyrite) and carbonates. These mineral precipitates can reduce sediment porosity, thereby influencing CH4 transport within sediment porewaters (Miao et al., 2022; Zhang H. et al., 2023). Other environmental factors, including nutrient salts and total organic carbon (TOC), also play crucial roles in CH4 migration in both the water column and sediment porewaters (Wang et al., 2018; Dan et al., 2023; Huang et al., 2023; Li N. et al., 2023). The interplay of these factors creates substantial uncertainties in understanding CH4 distribution patterns and environmental controls in cold seeps—especially along the full pathway from sediment emission to seawater transport and eventual atmospheric release. Accurately quantifying the generation, dissolution, migration, and emission of CH4 from seafloor cold seeps is essential for assessing its contribution to the global CH4 budget and climate change.
The South China Sea, one of the world’s largest marginal seas, is a promising region for gas hydrate resources. Numerous geological indicators associated with CH4 seepage—such as pockmarks, mud volcanoes, carbonate crusts, and cold-seep ecosystems—have been documented here (Feng et al., 2018; Li Y-X. et al., 2023). Among its active seeps, the Haima cold seeps stand out as a large and representative site, covering about 350 km2 at water depths between 1350 and 1430 m (Liang et al., 2017; Feng et al., 2018). Investigating CH4 distribution and identifying its environmental controls in Haima cold seeps is therefore crucial for understanding global marine CH4 emissions.
In this study, seawater and porewater samples were collected from five stations within Haima cold seeps to investigate the distribution characteristics of CH4 and identify key environmental drivers. By comprehensively analyzing sea-to-air CH4 flux, diffusive flux, and relationships between dissolved CH4 concentrations and environmental factors in both the water column and sediment porewaters, we aimed to: (1) characterize the spatial heterogeneity of CH4 concentrations, sea–to–air fluxes, and diffusive fluxes across the sampling stations; (2) identify the key environmental factors influencing the distribution of dissolved CH4; and (3) elucidate the vertical CH4 distribution patterns from sediment to seawater to the atmosphere in Haima cold seeps. These results can enhance our understanding of CH4 cycling in deep-sea cold seep environments and provide valuable in-situ data for improving global CH4 budget estimates.
2 Materials and methods
2.1 Overview of the study area and sample collection
This multidisciplinary study was conducted in Haima cold seep areas in May 2021 aboard the scientific research vessel “Haiyang Dizhi Liuhao”. Seawater samples were collected from the water column using Niskin bottles attached to a conductivity-temperature-depth (CTD) sampler. The sampling depths were set at 25, 50, 85, 150, 200, 400, 600, 800, 1000, and 1350 meters. Sediment samples were acquired using large gravity piston corers at water depths of 1441, 1483, 1366, 1394, and 1372 m, yielding core lengths of 7.25, 6.75, 7.75, 8.25, and 6.75 m, respectively. Sediment sub-sampling was performed at vertical intervals of 10 cm; detailed procedures for porewater extraction are provided in Supplementary Text S1.
The submersible remotely operated vehicle (ROV) Haima was deployed to systematically map geological features and characterize benthic habitats. Based on habitat characteristics (described in Supplementary Text S2), the five sampling stations were categorized into two distinct types: (1) seepage areas (Seep1, Seep2, and Seep3), where cold seep development periods followed the order Seep2 > Seep1 > Seep3; and (2) non-seepage areas (Non-seep1 and Non-seep2). The locations of the sampling stations are illustrated in Figure 1.
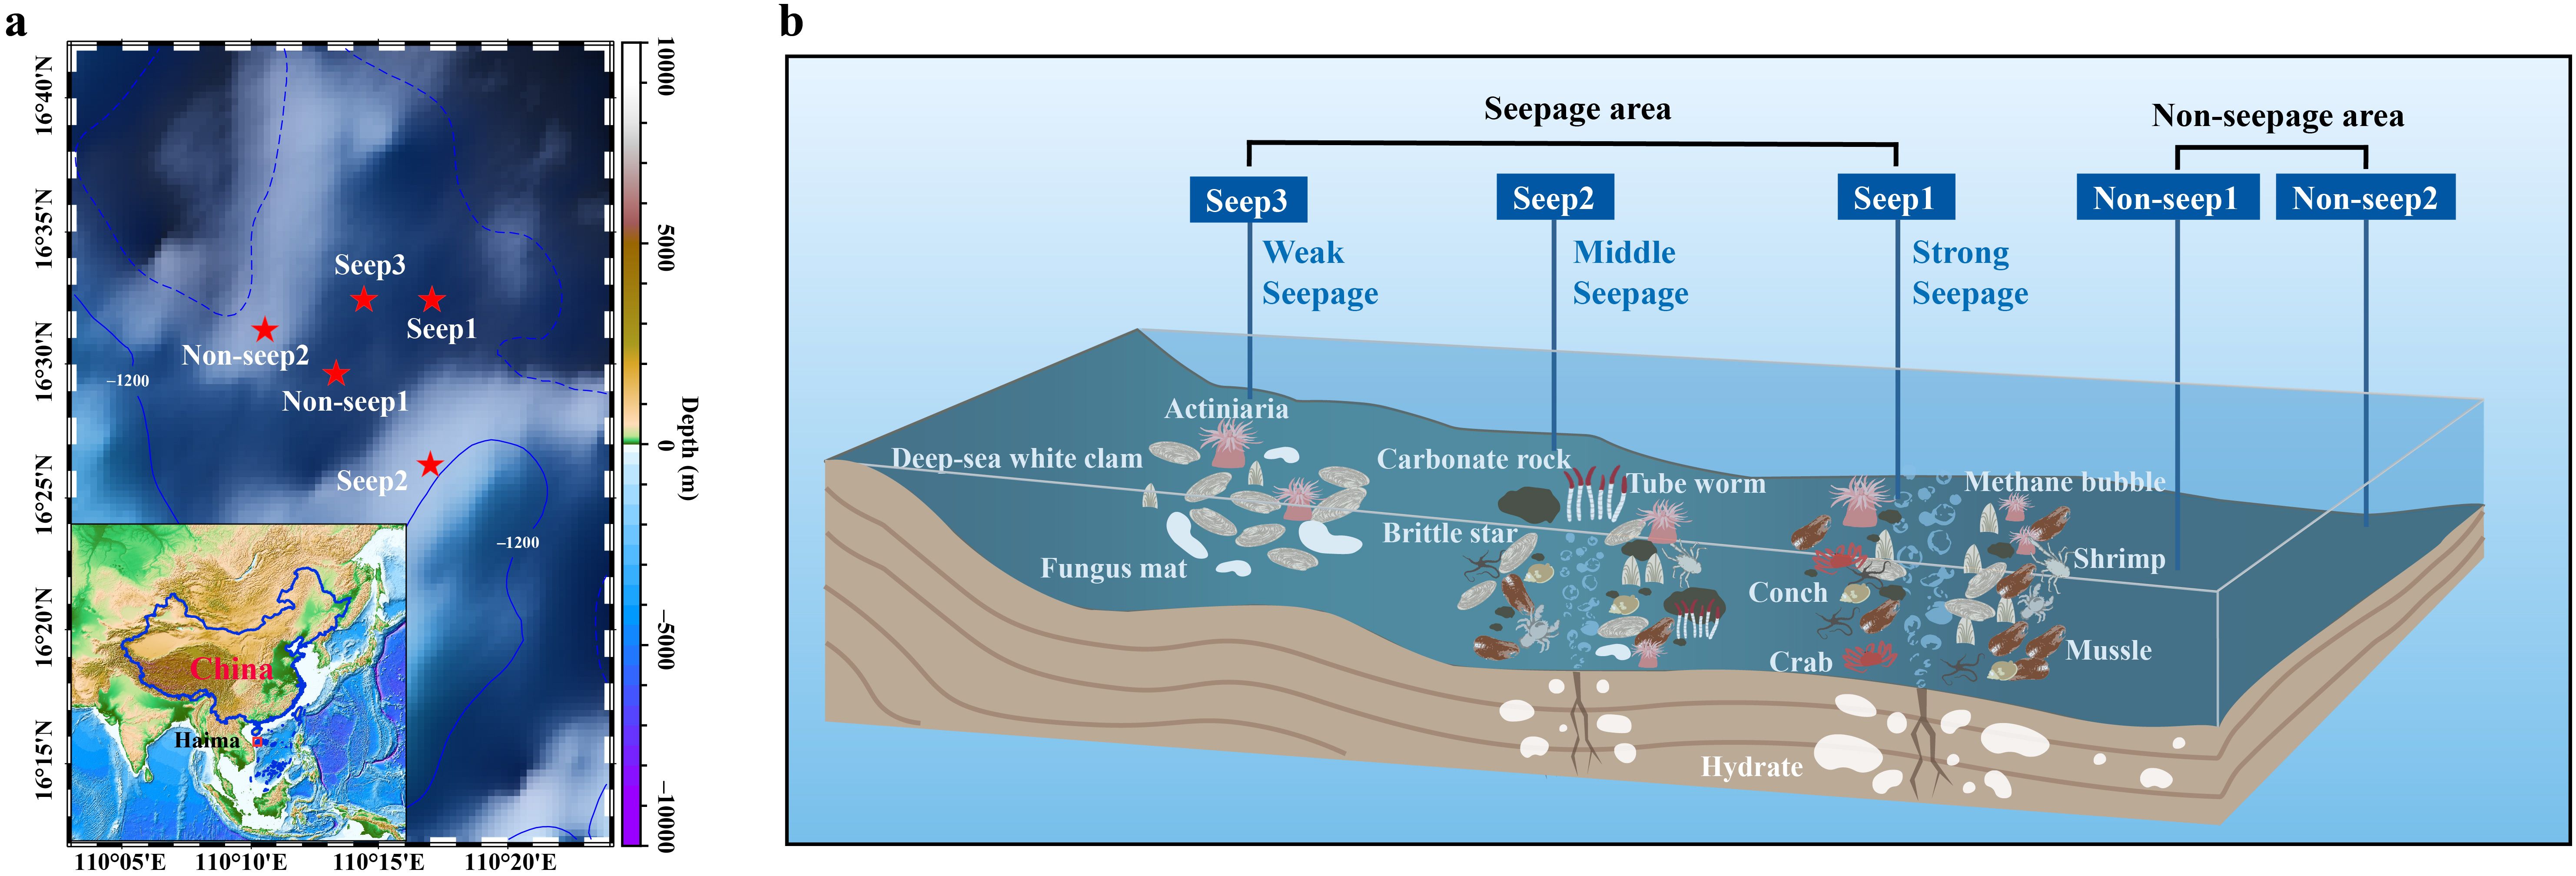
Figure 1. Information about the sampling stations: (A) locations of the sampling stations; and (B) the habitats at the sampling stations.
2.2 Analyses of methane and environmental factors
Dissolved CH4 concentrations in the water column were monitored in situ via a CH4 sensor (METS IR 2930, Franatech) integrated with the CTD system. The concentrations of the dissolved CH4 in the sediment porewater were measured via gas chromatography (Trace 1300, Thermo Fisher), with the detailed analytical procedures provided in Text S3. The temperature, dissolved oxygen (DO), salinity, and pH in the water column were recorded in real time with CTD sensors. Major elements (Na, K, Ca, and Mg) were quantified using inductively coupled plasma optical emission spectrometry (iCAP 7000 SERIES, Thermo Fisher). Trace elements (Mn, Fe, and Ba) were determined via inductively coupled plasma mass spectrometry (iCAP RQ, Thermo Fisher). Chloride (Cl−) and sulfate (SO42−) ions were analyzed by an ion chromatograph (AQ-1200, Thermo Fisher). Total organic carbon (TOC) and inorganic carbon (IC) were measured with a total organic carbon analyzer (TOC–L, Shimadzu). Nutrient concentrations, including silicate (SiO32–), phosphate (PO43–), nitrite (NO2−), nitrate (NO3−), and ammonium (NH4+), were analyzed following standardized procedures specified in the Chinese National Standards GB/T12763.4–2007 (Specifications for oceanographic survey—Part 4: Survey of chemical parameters in sea water, 2008).
2.3 Calculations of the methane fluxes
2.3.1 Saturation and sea-to-air flux calculations
CH4 saturation (R, %) and sea-to-air flux (F, μmol/(m2 d)) were estimated by Equations 2 and 3.
where Cobs represents the observed concentration of dissolved CH4. Ceq denotes the air-equilibrated seawater CH4 concentration, which is calculated on the basis of in situ temperatures and salinities using established solubility parameters from previous research (Wiesenburg and Guinasso, 1979). The atmospheric CH4 mixing ratio of 1.89 ppm for 2021 was obtained from the National Oceanic and Atmospheric Administration/Earth System Research Laboratory (NOAA/ESRL) of the global monitoring division in situ program. The gas transfer velocity (Kw (cm/h)) was determined as a function of the wind speed and the Schmidt number (Sc), employing the updated parameterization shown in Equation 4 (Wanninkhof, 2014). The average squared wind speed was 5.4 m/s according to the National Centers for Environmental Prediction (NCEP) reanalysis data from the NOAA ESRL.
2.3.2 Diffusive fluxes of methane and sulfate
The molecular diffusive fluxes of CH4 and SO42− in the sediment porewater were calculated using Fick’s first law (Egger et al., 2018; Zhu et al., 2020), and are expressed by Equations 5 and 6.
where J represents the diffusive flux of CH4 or SO42− (mmol/(m2·a)), JCH4 was calculated from the sediment bottom to the surface, and JSO42− was calculated from the sediment surface to the bottom. φ is the porosity of the sediment, which was estimated to be 65% (Zhang H. et al., 2023). Ds is the sediment diffusion coefficient (m2/s). C represents the concentration of CH4 or SO42− (mmol/L). x represents the depth of the sediment (m). D0 is the diffusion coefficient of CH4 or SO42− when the seawater temperature is 4°C. In addition, the diffusion coefficient was set to 0.87 × 10⁻⁵ cm2/s for CH4 and 0.56 × 10⁻⁵ cm2/s for SO42− (Iversen and Jørgensen, 1993).
2.4 Data analysis
Principal component analysis (PCA), multiple linear regression analysis, the Mann−Whitney U test, and the Kruskal-Wallis test were performed using the IBM SPSS Statistics 26 software. The ggplot2 package was used to perform the regression analysis in R 4.3.2. The other data visualizations were implemented using OriginLab 2022.
3 Results
3.1 Spatial distribution of methane in Haima cold seeps
3.1.1 Spatial distribution of methane in the shallow sediment porewater
The CH4 concentration in the shallow sediment porewater (0−5 cm) ranged from 0.06 to 0.12 mmol/L, with an average concentration of 0.07 ± 0.02 mmol/L (Table 1). The diffusive flux of CH4 in the sediment porewater varied across stations, exhibiting the following order: Seep1 > Seep3 > Non-seep1 > Non-seep2 > Seep2, with values ranging from 0.03 to 0.32 mmol/(m2 a) and an average of 0.13 ± 0.12 mmol/(m2 a). Notably, the strong seepage area of Seep1 exhibited a significantly greater maximum flux of 17.19 mmol/(m2 a), which was 573 times greater than the minimum flux.
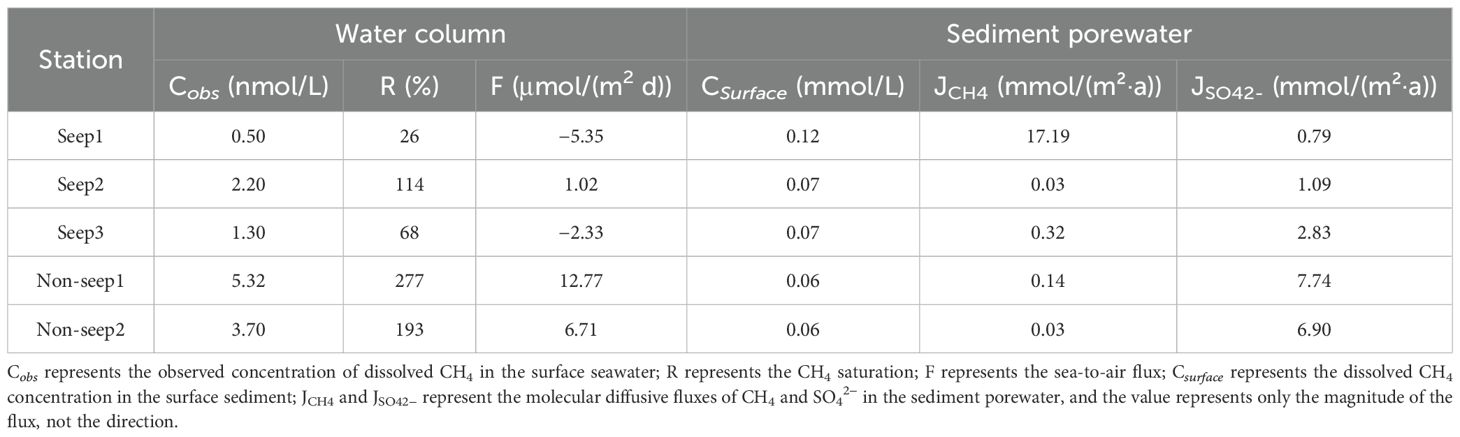
Table 1. Methane concentration, saturation, sea-to-air flux, and diffusive flux in the Haima cold seeps.
3.1.2 Spatial distribution of methane in the water column
The surface dissolved CH4 concentrations, saturation levels, and sea-to-air fluxes in the Haima cold seeps are also summarized in Table 1. The surface dissolved CH4 concentrations ranged from 0.50 to 5.32 nmol/L, with an average concentration of 2.60 ± 1.72 nmol/L. The CH4 saturation levels varied between 26% and 277%, averaging 136 ± 90%. The sea-to-air CH4 flux ranged from −5.35 to 12.77 μmol/(m2 d), with a mean flux of 2.56 ± 6.49 μmol/(m2 d). The fluxes across stations followed the order of Non-seep1 > Non-seep2 > Seep2 > Seep3 > Seep1.
3.2 Vertical distribution of methane in the Haima cold seeps
3.2.1 Vertical distribution of methane in the sediment porewater
The vertical profile of dissolved CH4 concentration in the sediment porewater exhibited significant variations with sediment depth, with two apparent inflection points identified at approximately 100 cm and 400 cm (Figure 2A). Based on these observable changes in the CH4 concentration gradient, the sediment core was divided into three depth intervals in this study to facilitate the analysis of vertical trends, including the upper layer (0−100 cm), the middle layer (100−400 cm), and the lower layer (> 400 cm). These inflections likely represent transitions between zones dominated by different processes.
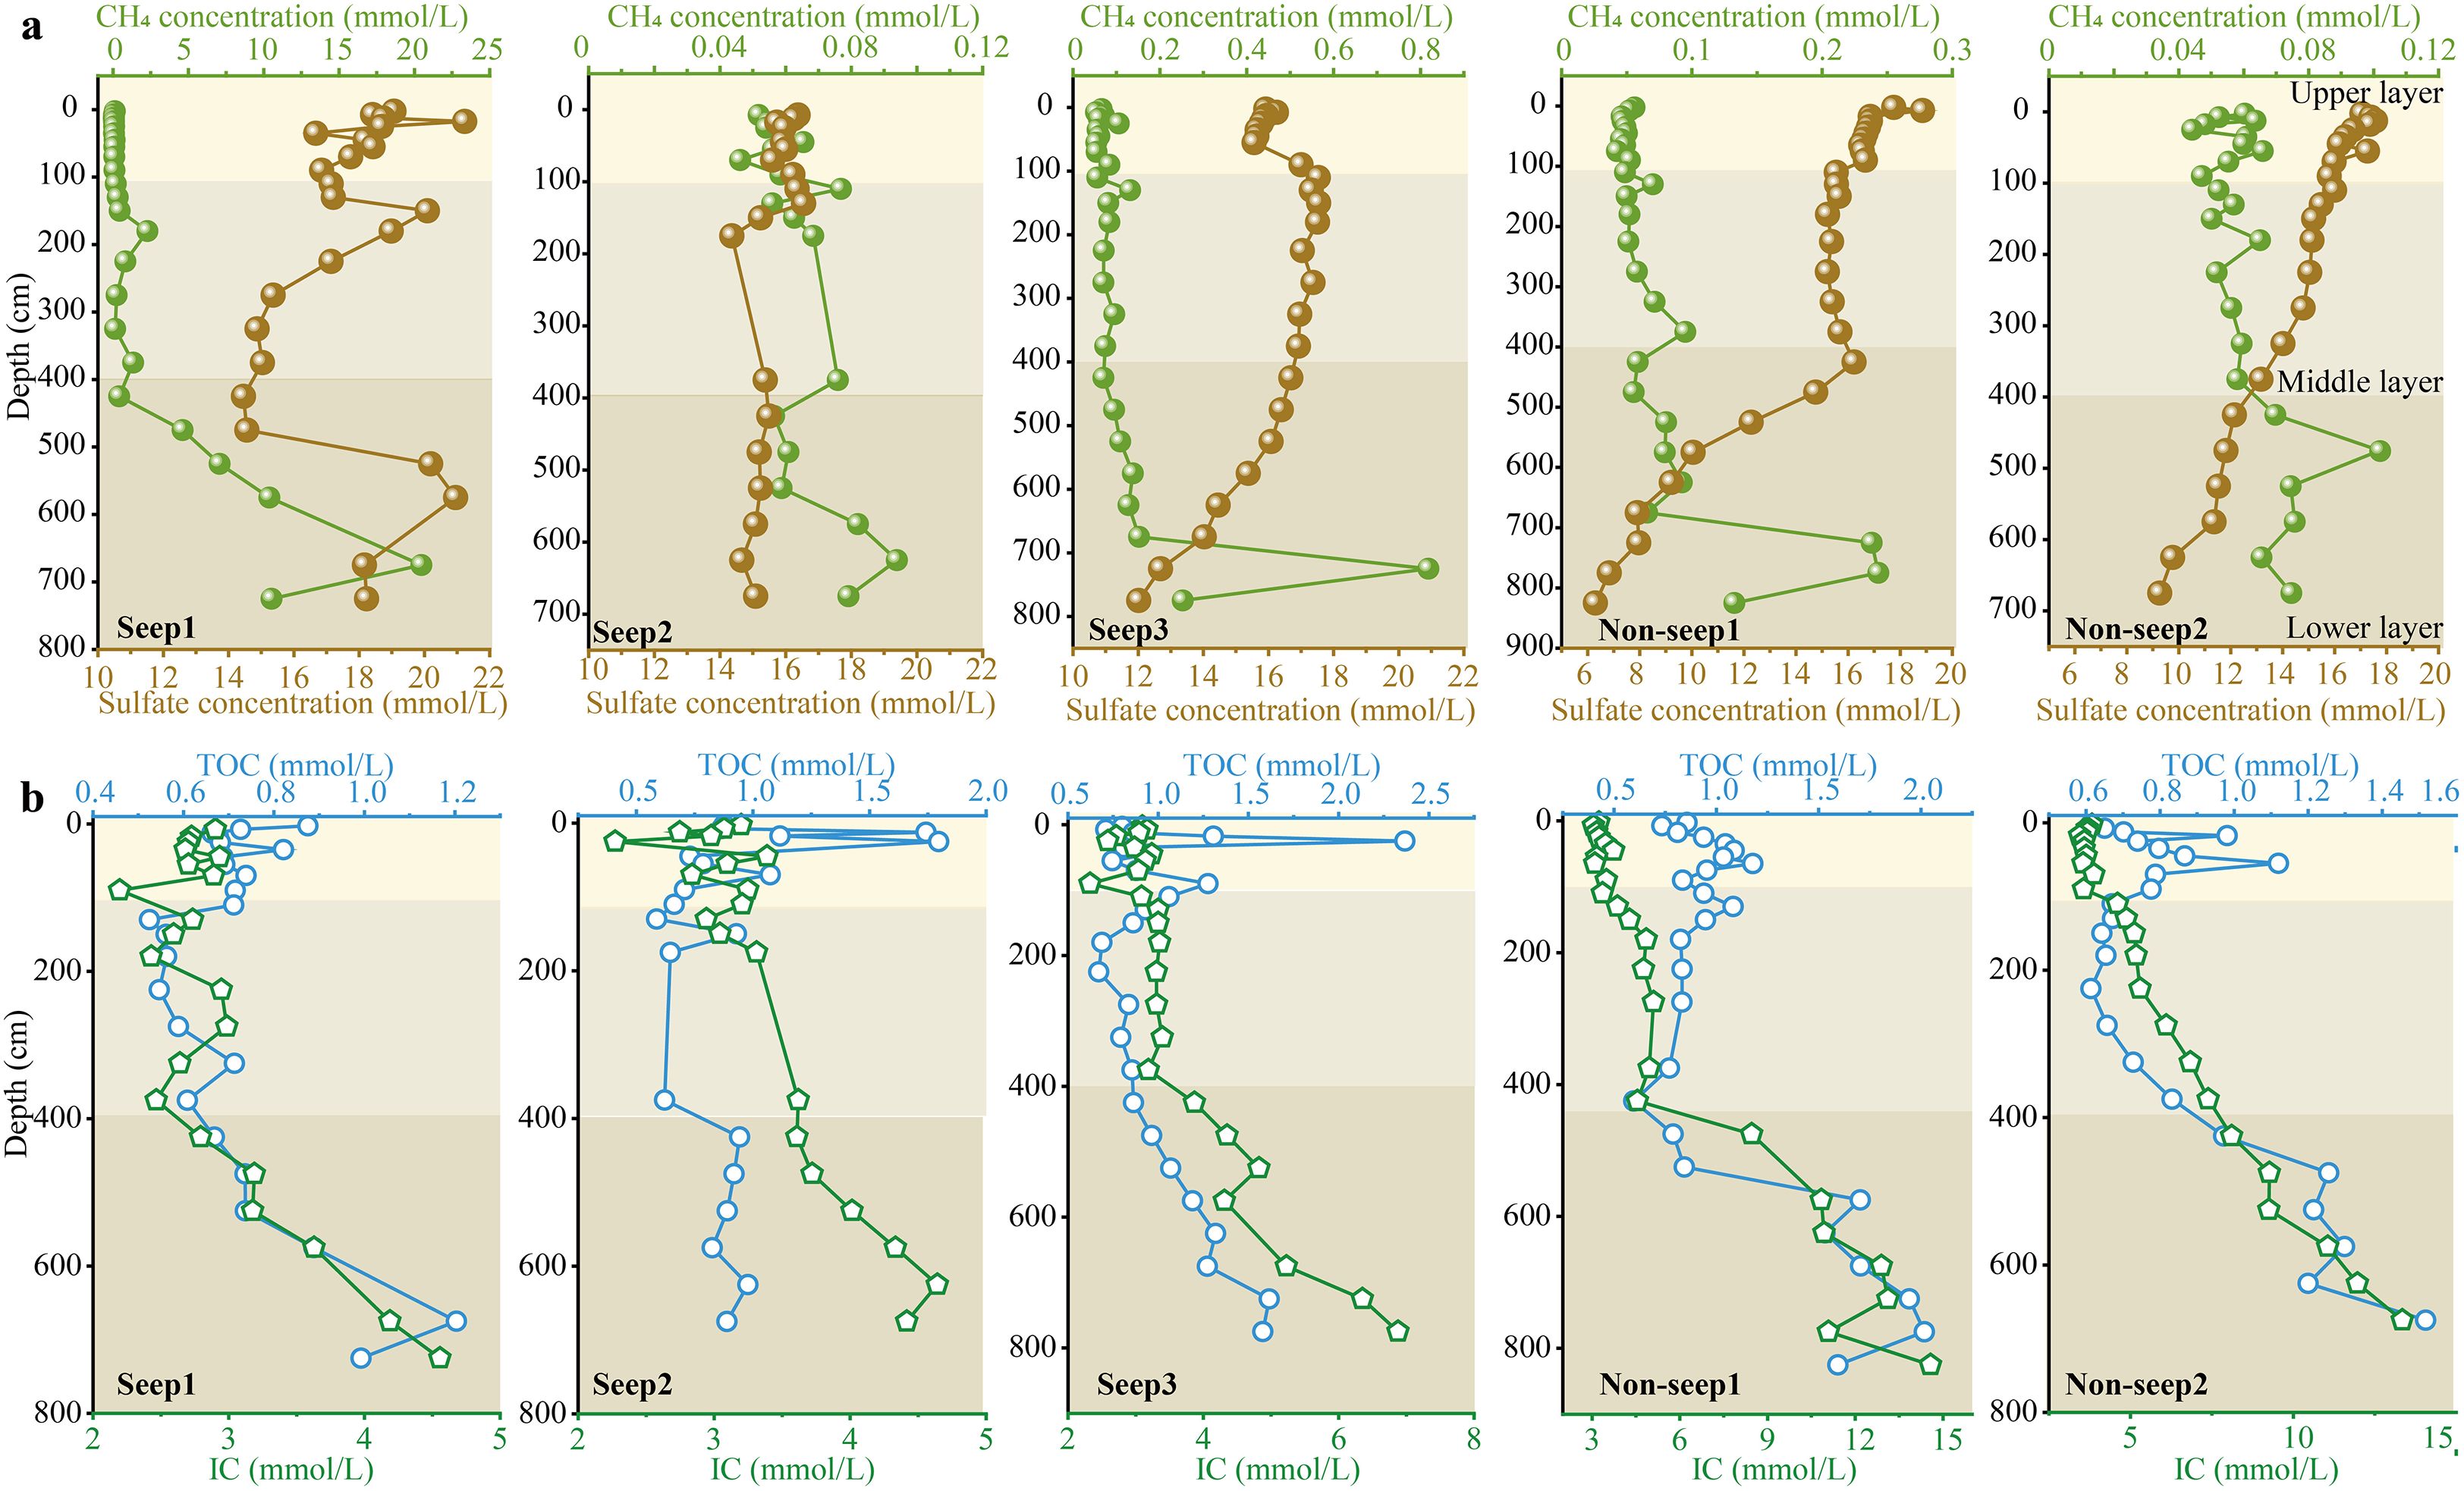
Figure 2. Vertical distributions of the methane concentration and the influencing environmental factors in the sediment porewater: (A) methane and sulfate concentrations; and (B) influencing environmental factors of TOC and IC.
In the lower layer, the CH4 concentration decreased sharply with decreasing sediment depth. This trend was especially pronounced at Seep1, where the difference between the maximum and minimum concentrations reached approximately 50-fold. The middle layer displayed a gradual, fluctuating decline in CH4 concentrations with decreasing depth, with a consistent decrease rate of 0.006 across all five stations (R2 = 0.34). In contrast, the upper layer maintained relatively stable CH4 concentrations at levels below mmol/L. Notably, despite the lower concentrations in the upper layer, the average CH4 concentration at the sediment surface reached 74,560 nmol/L, significantly exceeding the dissolved CH4 concentration in the overlying bottom seawater. This substantial concentration gradient indicates that sediment porewater acts as an important source of CH4 to the bottom seawater.
3.2.2 Vertical distribution of methane in the water column
The CH4 concentration displayed distinct vertical distribution patterns across the water column (Figure 3A). In the bathypelagic zone (> 1000 m), the dissolved CH4 concentration decreased with decreasing depth at all stations. Within the mesopelagic zone (200–1000 m), distribution patterns varied notably among the stations. At Seep1, CH4 concentrations decreased until approximately 700 m and then increased toward shallower depths. In contrast, Seep2 and Seep3 exhibited continuous decreasing trends with decreasing depth, with Seep2 showing a more pronounced decline than Seep3. However, Non-seep1 and Non-seep2 displayed increasing CH4 concentrations throughout this zone. In the epipelagic zone (0−200 m), all stations presented a consistent decrease in dissolved CH4 concentrations with decreasing depth. Furthermore, the equilibrium CH4 concentration (Ceq) gradually decreased throughout the water column, varying within a narrow range of 2 nmol/L (Figure 3A).
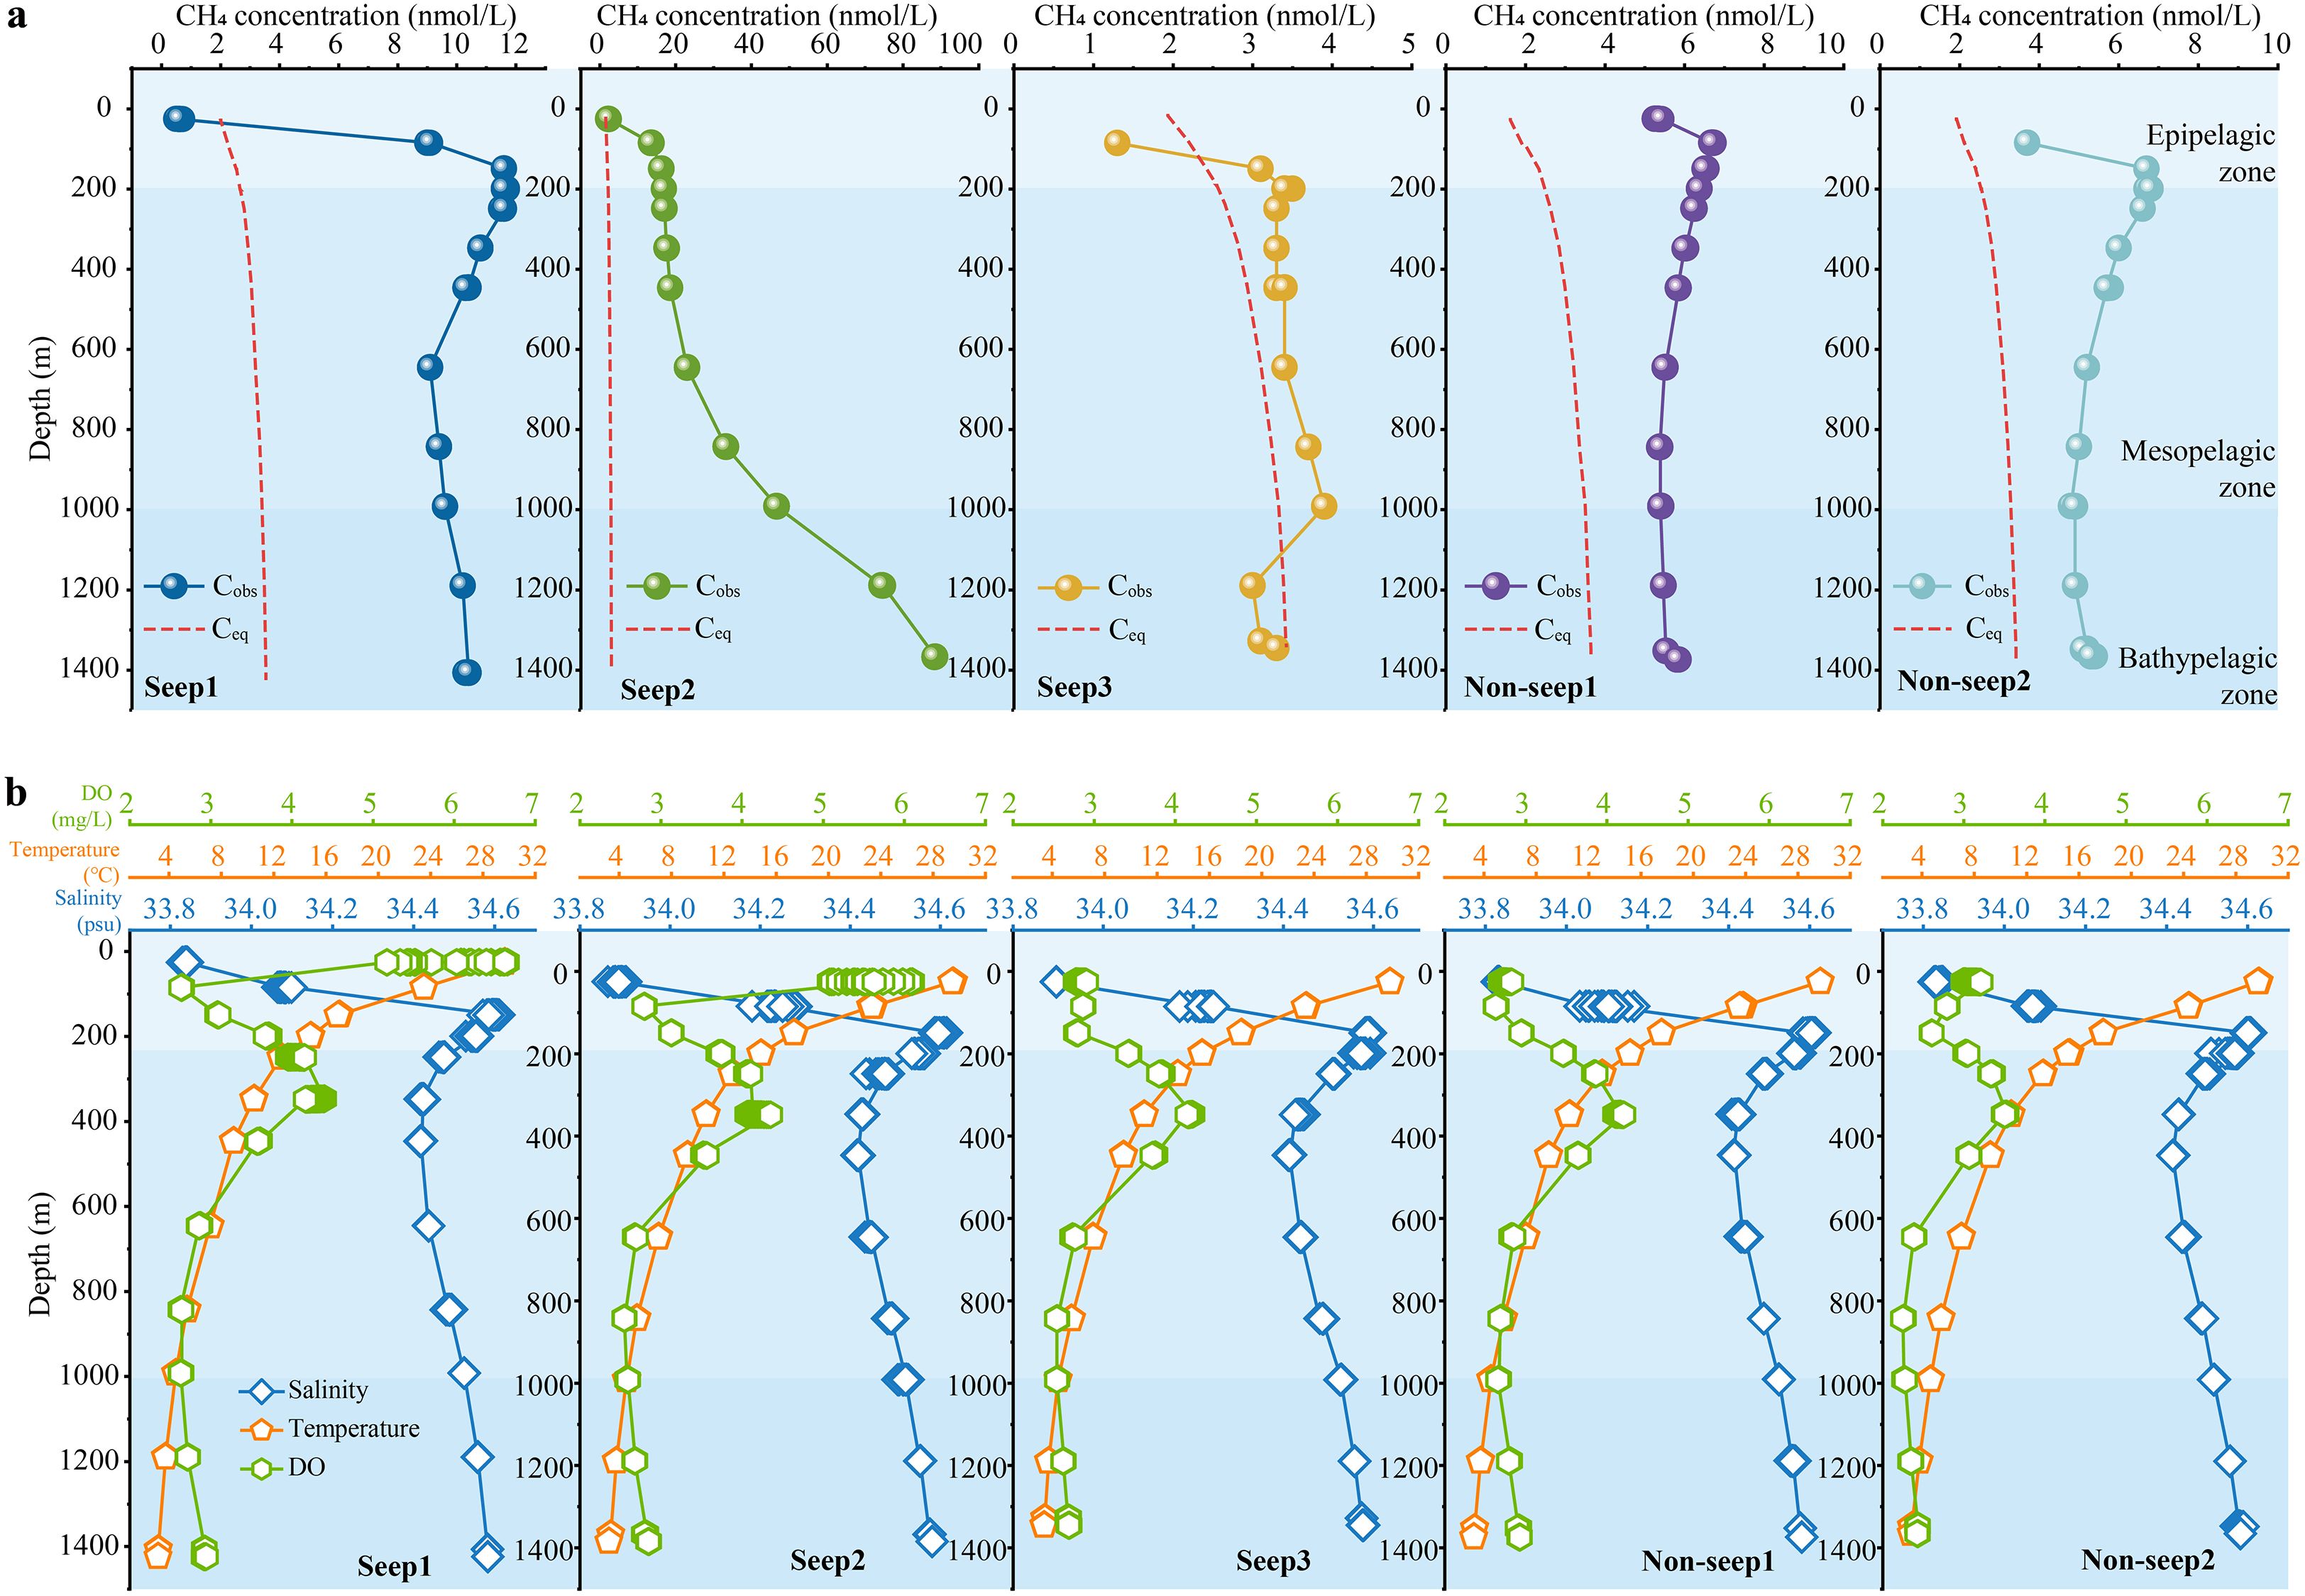
Figure 3. Vertical distributions of methane concentrations and the influencing environmental factors in the water column: (A) methane concentrations (the red dashed line represents the equilibrium methane concentration (Ceq), and the other line represents the observed dissolved methane concentration (Cobs); (B) influencing environmental factors of salinity, temperature, and DO.
3.3 Relationships between methane and influencing environmental factors
3.3.1 Relationships between methane and environmental factors in sediment porewaters
PCA analysis identified three principal components influencing the environmental variables: PC1 (22.9%), PC2 (16.1%), and PC3 (13.7%), collectively explaining 52.7% of the total variance (Figure 4A). Among these, PC2, characterized by high loadings of Mg (0.51), Na (0.47), K (0.46), and Mn (0.37), exhibited a significant correlation with the dissolved CH4 concentration in the sediment porewater (R2 = 0.128, P < 0.001; Figure 4C). Correlation analyses between the dissolved CH4 concentration and individual environmental factors (Figure 5A and Supplementary Figure S2) further revealed statistically significant but weak relationships with sediment depth (R2 = 0.08, P < 0.001), K (R2 = 0.06, P = 0.005), Na (R2 = 0.08, P < 0.001), Mg (R2 = 0.05, P = 0.009), Mn (R2 = 0.02, P = 0.007), Cl− (R2 = 0.02, P = 0.049), and SO42− (R2 = 0.10, P = 0.02). These weak correlations suggest that the CH4 concentration in sediment porewaters is not governed by a single dominant variable but emerges from complex, potentially nonlinear interactions among multiple physical, chemical, and biological processes. Factors not quantified in this study, such as the structure and activity of microbial communities, lateral fluid flow, and non-steady-state dynamics, likely account for a substantial portion of the unexplained variance. When stations were classified into seepage and non-seepage areas (Supplementary Figure S3), stronger correlations between CH4 concentrations and environmental factors were observed in non-seepage areas than in seepage areas. This difference is likely attributable to the pronounced disturbance caused by active CH4 seepage, which may obscure or modify inherent environmental relationships in seepage zones.
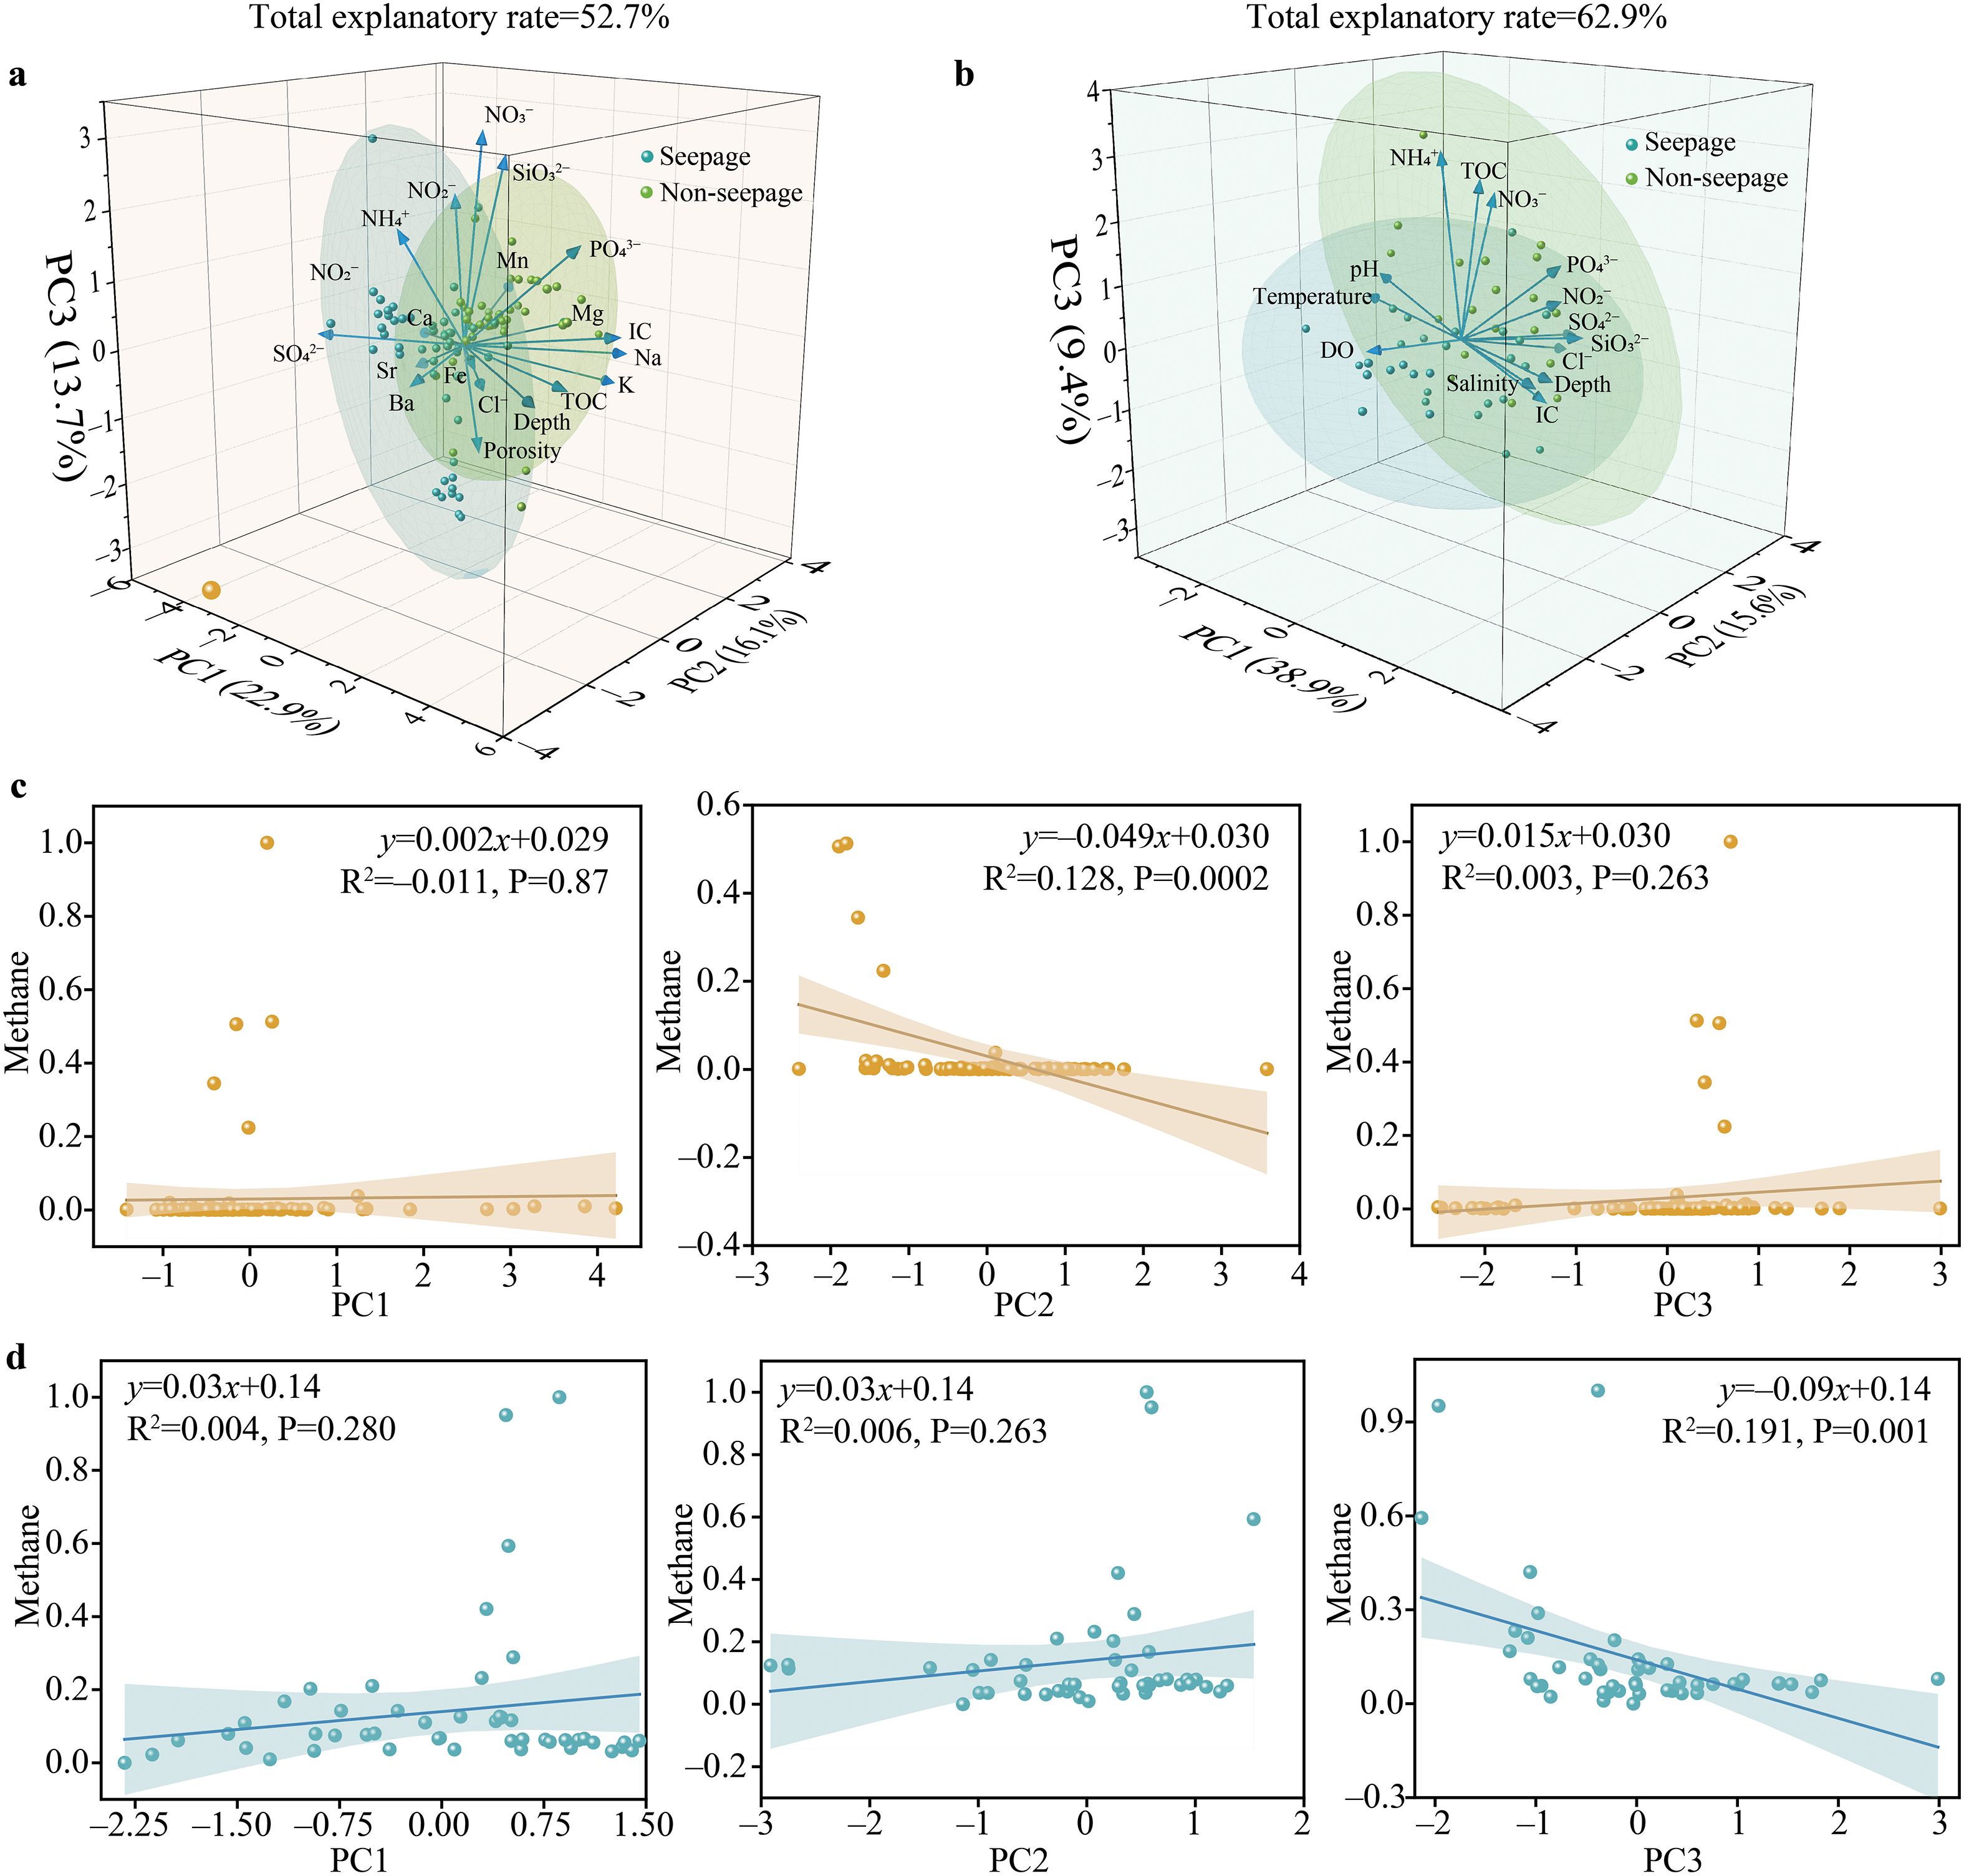
Figure 4. Results of PCA analysis of the influencing environmental factors and the correlation between the methane concentration and PCA results: (A) PCA analysis for the sediment porewater; (B) PCA analysis for the seawater; (C) correlation between the methane concentration and PCA results for the sediment porewater; and (D) correlation between the methane concentration and PCA results for the seawater.
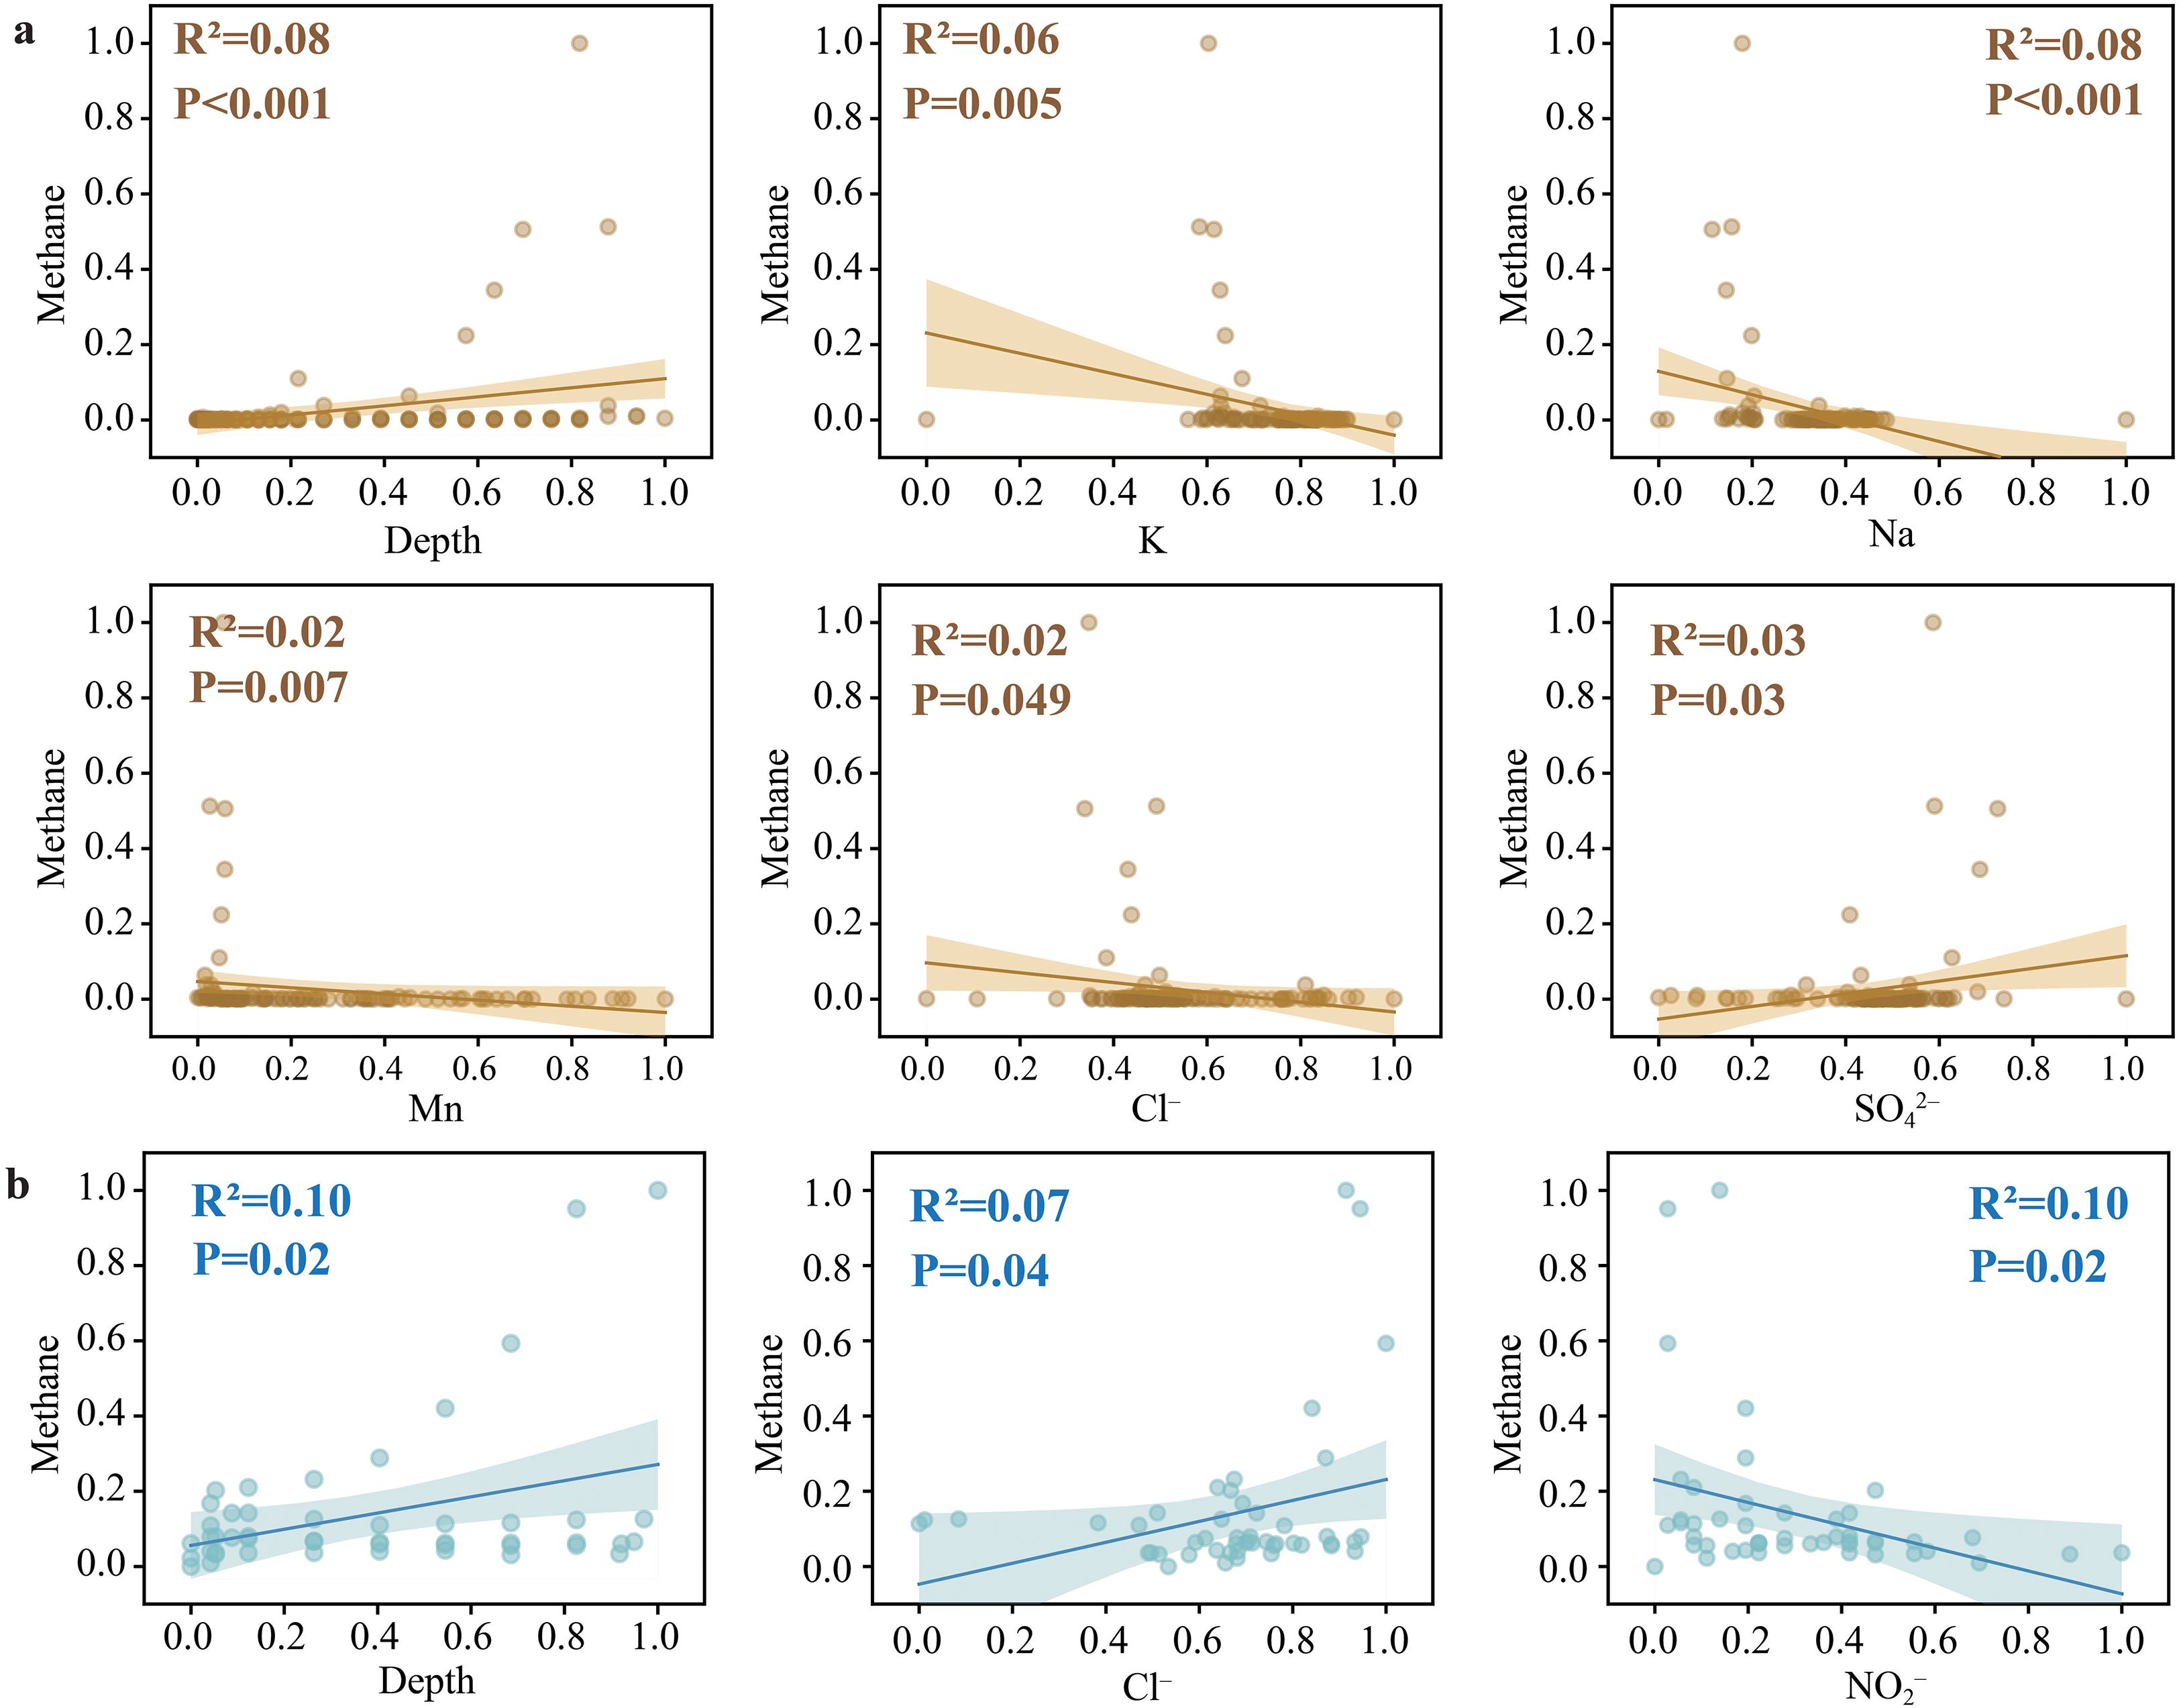
Figure 5. Regression analysis between the methane concentration and environmental influencing factors: (A) sediment porewater, and (B) seawater.
3.3.2 Relationships between methane and environmental factors in the water column
PCA analysis of the influencing environmental factors in the water column yielded a total variance explanation of 63.9%, with PC1, PC2, and PC3 accounting for 38.9%, 15.6%, and 9.4%, respectively (Figure 4B). Linear regression analysis (Figure 4D) revealed that the PC3, which was characterized by high loadings of NH4+ (0.58), TOC (0.48), NO3− (0.45), and PO43– (0.30), was significantly correlated with the dissolved CH4 concentration (R2 = 0.191, P = 0.001). Correlation analysis (Figure 5B and Supplementary Figure S4) further revealed weak but significant relationships between the dissolved CH4 concentration and several environmental factors, including seawater depth (R2 = 0.10, P = 0.02), Cl− (R2 = 0.07, P = 0.04), and NO3− (R2 = 0.10, P = 0.02). When the stations were categorized into seepage and non-seepage areas (Supplementary Figure S5), distinct correlation patterns emerged. In the seepage area, the dissolved CH4 concentration correlated significantly with seawater depth (R2 = 0.24, P = 0.007), Cl− (R2 = 0.25, P = 0.006), SO42− (R2 = 0.24, P = 0.008), and NO3− (R2 = 0.14, P = 0.048), suggesting that biological metabolic processes driven by NO3− and SO42− play important roles in regulating the CH4 cycling within seawater environments affected by seepage. In contrast, in the non-seepage area, only SiO32− was significantly correlated with CH4 concentrations (R2 = 0.23, P = 0.039), indicating its role as the primary environmental factor influencing CH4 distribution in the non-seepage area.
4 Discussion
4.1 High spatial heterogeneity of methane distribution in Haima cold seeps
The spatial distribution of CH4 in the Haima cold seeps exhibited pronounced heterogeneity, particularly between seepage and non-seepage areas (Mann–Whitney U test, P< 0.01). This heterogeneity is distinctly manifested in two key CH4 flux pathways: sediment–water diffusion and sea–air exchange. The average CH4 diffusive flux from the bottom sediment to the surface in the seepage areas (5.85 mmol/(m2 a)) was markedly higher than that in the non-seepage areas (0.09 mmol/(m2 a)), with extreme values spanning three orders of magnitude. Notably, the maximum flux at Seep1 reached 17.19 mmol/(m2·a), which is comparable to the global continental slope flux (18.62 ± 17.52 mmol/(m2·a)) and vastly exceeds the background level of the continental shelf, highlighting the significant contribution of seeps (Egger et al., 2018). In contrast, the average diffusive flux of SO42− in the non-seepage area (7.32 mmol/(m2 a) was greater than that in the seepage area (1.57 mmol/(m2 a)), reflecting the physical disturbance induced by vigorous CH4 seepage, which enhances porewater mixing and homogenizes the SO42− distribution.
The fate of CH4 in the water column, expressed as sea-to-air flux, revealed a more complex pattern. Our estimated sea-to-air CH4 fluxes in non-seepage areas (averaging 9.74 μmol/(m2 d)) are consistent with previous observations across the South China Sea, such as in the Dongsha area and the northern South China Sea (Zhou et al., 2009; Tseng et al., 2017; Xu et al., 2023). Moreover, a Kruskal–Wallis test revealed no significant differences in the dissolved CH4 concentrations among the South China Sea, Bohai Sea, and East China Sea (P > 0.05; Supplementary Table S1), suggesting a regionally uniform baseline against which the unique seep-related dynamics at Haima can be clearly discerned. Globally, the net atmospheric uptake in Haima’s most active seep areas contrasts with many previous seep-dominated margins. For example, sea-to-air CH4 fluxes in the northern Chukchi Sea are 0.1−3.3 μmol/(m2 d) (Lapham et al., 2017), and seep fields such as those in the Gulf of Mexico and Baltic Sea generally act as strong atmospheric sources (Ni et al., 2025). The sink behavior at Haima suggests exceptionally efficient CH4 removal in the water column, potentially due to a combination of physical dispersion and robust microbial oxidation processes specific to the South China Sea. This highlights that similar seabed emissions can lead to markedly different atmospheric impacts depending on regional oceanography. Despite this localized sink, the overall area-integrated sea-to-air CH4 flux (2.56 μmol/(m2 d)) confirms that the Haima cold seep region functions as a net source of atmospheric CH4. In addition, given that this study is based on a single survey, future multi-seasonal investigations are essential to account for temporal variability and to improve the accuracy of the CH4 budget assessment.
4.2 CH4 behavior and controls in sediment porewater
The distribution of dissolved CH4 in sediment porewater is governed by a complex interplay of biogeochemical processes and physical transport, which are strongly modulated by the local CH4 seepage intensity. Our results demonstrate a clear anti-correlation between SO42− and CH4 concentrations (Figure 2A), underscoring the fundamental role of SD-AOM in consuming CH4 and shaping its vertical profile. Based on the inflection points observed in the CH4 profile at approximately 100 cm and 400 cm, the sediment core was divided into three layers for analysis, revealing a distinct zonation of CH4 behavior.
Statistical analyses further support the multi-factorial nature of these controls. The weak correlation between dissolved CH4 and a single principal component (PC2, Figure 4C), coupled with distinctly different vertical distribution patterns and factor relationships in seepage versus non-seepage areas (Figure 2 and Supplementary Figure S3), indicates that CH4 dynamics are not dominated by any single variable but are strongly modulated by local CH4 seepage intensity. This modulation by seepage intensity is clearly reflected in the SO42− dynamics. In vigorous seepage areas (e.g., Seep1), fluid advection and bubble transport enhance the mixing and replenishment of SO42− within the porewater, counteracting its consumption by SD-AOM and resulting in relatively higher SO42− concentrations at depth than in non-seepage areas (Figure 2A). In contrast, the SO42− distribution in non-seepage areas is dominated by molecular diffusion from the overlying seawater, producing a steeper, consumption-dominated gradient. This physical forcing also explains the observed inverse relationship between the diffusive fluxes of SO42− and CH4 across seepage and non-seepage areas (Table 1).
Beyond the sulfate–methane coupling, the depth profiles of TOC and IC closely mirrored those of CH4 (Figure 2B), suggesting that organic matter degradation acts as a key source and that AOM-derived bicarbonate contributes to IC. The multi-factorial nature of CH4 control was further confirmed by principal component and multiple linear regression analyses. The regression model (overall R2 = 0.477; full equation provided in Supplementary Text S4) identified sediment depth, porosity, IC, Cl−, and SO42− as statistically significant predictors (P < 0.05). The prominence of factors such as porosity and IC highlights the importance of geochemical feedbacks, wherein AOM byproducts (e.g., HCO3−) can promote authigenic carbonate precipitation, altering the sediment fabric and transport pathways (Deng et al., 2021; Zhang G. et al., 2023; Zhang H. et al., 2023).
In summary, the CH4 distribution in Haima sediments is not governed by a single factor but by the synergistic effects of microbial metabolism (SD-AOM), the availability of organic substrate (TOC), and sediment physical properties, all of which are dynamically shaped by the intensity of CH4 seepage. This multi-factorial control underscores the necessity of integrated models that couple biogeochemical reactions with physical transport to accurately predict methane release from cold seeps.
4.3 CH4 distribution and processes in the water column
The distribution of dissolved CH4 in the water column of Haima cold seep areas results from the interplay of physical transport and in-situ biogeochemical processes. The water mass structure, comprising South China Sea tropical water (SCSTW), intermediate water (SCSIW), and deep water (SCSDW) (Supplementary Figure S1) (Xu et al., 2023), establishes a fundamental physical framework. The interconnected three-dimensional circulation of these water masses plays a pivotal role in dispersing and redistributing methane, largely explaining the observed concentration patterns in the mesopelagic and bathypelagic zones (Liu and Gan, 2017; Wu et al., 2021).
Statistical analysis underscores the multi-factorial nature of these controls. A significant correlation was found between dissolved CH4 and principal component PC3, which is heavily loaded with nutrients (NH4+, NO3−, and PO43–) and TOC (Figure 4D). A multiple linear regression model (overall R2 = 0.711; full equation in Supplementary Text S4) further quantified these relationships, identifying DO and SiO32− as the most significant predictors (P < 0.01). The strong influence of SiO32− points to an important indirect pathway. As a key nutrient regulating diatom growth and primary productivity, SiO32− availability influences the export of organic carbon (Al-Mur, 2020; Peng et al., 2024). The subsequent remineralization of this organic matter can consume oxygen, potentially creating suboxic microenvironments that favor aerobic CH4 production (the “methane paradox”) (Repeta et al., 2016; Ordóñez et al., 2023; Mao et al., 2024). Concurrently, DO exerts a direct control by governing the aerobic oxidation of CH4 (Zhang et al., 2005; Mao et al., 2022), with lower oxygen concentrations generally suppressing this sink and allowing CH4 to accumulate.
These processes are most active in the epipelagic zone, a biogeochemical hotspot. Here, the decomposition of organic matter from surface productivity can lead to a CH4 maximum (Ernst et al., 2022). The vertical profiles of temperature and DO further shape the CH4 distribution in this layer (Figure 3B), whereas additional minor sources may include photochemical degradation of colored dissolved organic matter (Li et al., 2020). Physical processes such as upwelling and vertical mixing intermittently modify this structure by transporting nutrient-rich, CH4-containing deep waters into the upper ocean, thereby linking deep seep inputs with surface biogeochemistry. In conclusion, the fate of CH4 in the water column is co-determined by physical circulation and a network of biologically mediated processes. The identification of SiO32− and DO as key drivers highlights crucial coupling between the silicon and carbon cycles, suggesting that changes in surface ocean productivity and deoxygenation may significantly influence the ultimate fate of seep-derived CH4.
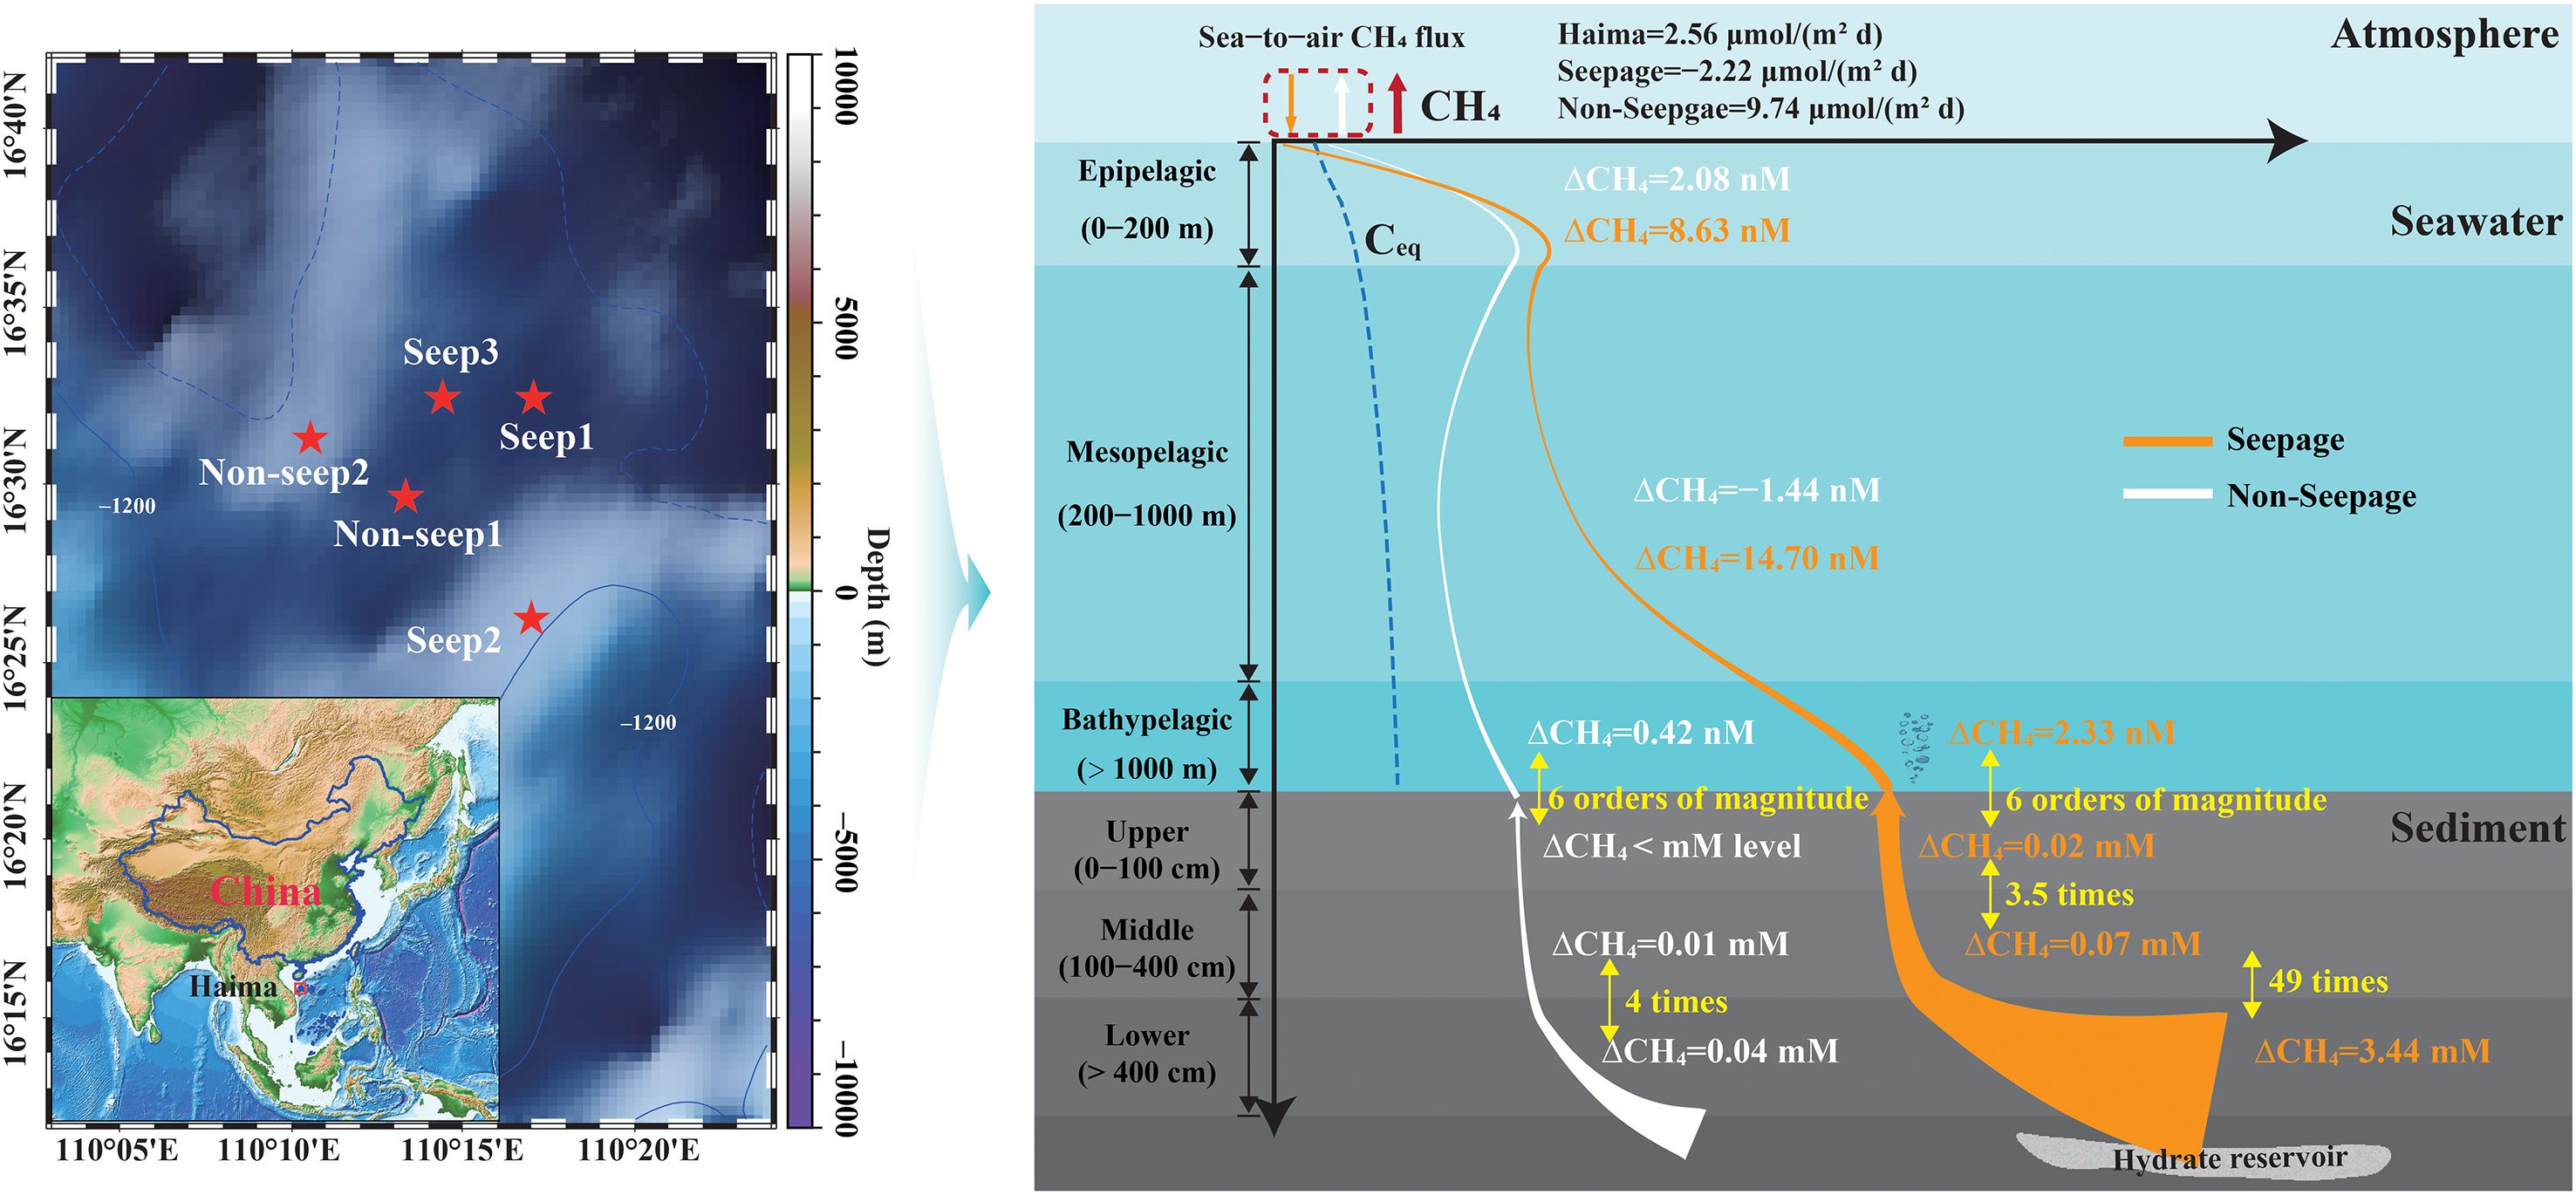
4.4 Vertical distribution patterns of methane from sediment to the water column to the atmosphere in Haima cold seeps
A conceptual diagram was developed to illustrate the vertical distribution patterns of CH4 from sediment porewater through the water column to the atmosphere in Haima cold seeps on the base of the findings of this study (Figure 6). CH4 in sediments originates from both thermogenic and biogenic processes (Stolper et al., 2014; Stolper et al., 2015; Ernst et al., 2022), and its concentration generally decreases with decreasing sediment depth in both seepage and non-seepage areas (Figures 6B, C). This decreasing trend gradually attenuates at shallower depths and is more pronounced in seepage areas than in non-seepage areas. Specifically, the change in CH4 concentration reached approximately 3.44 mM at sediment depths greater than 400 cm in seepage areas, compared to only 0.04 mM in non-seepage areas. As the depth decreased to 0–100 cm, this change diminished to 0.02 mM in seepage areas and fell below the mM level in non-seepage areas, indicating more intense CH4 consumption in seepage-area sediments.
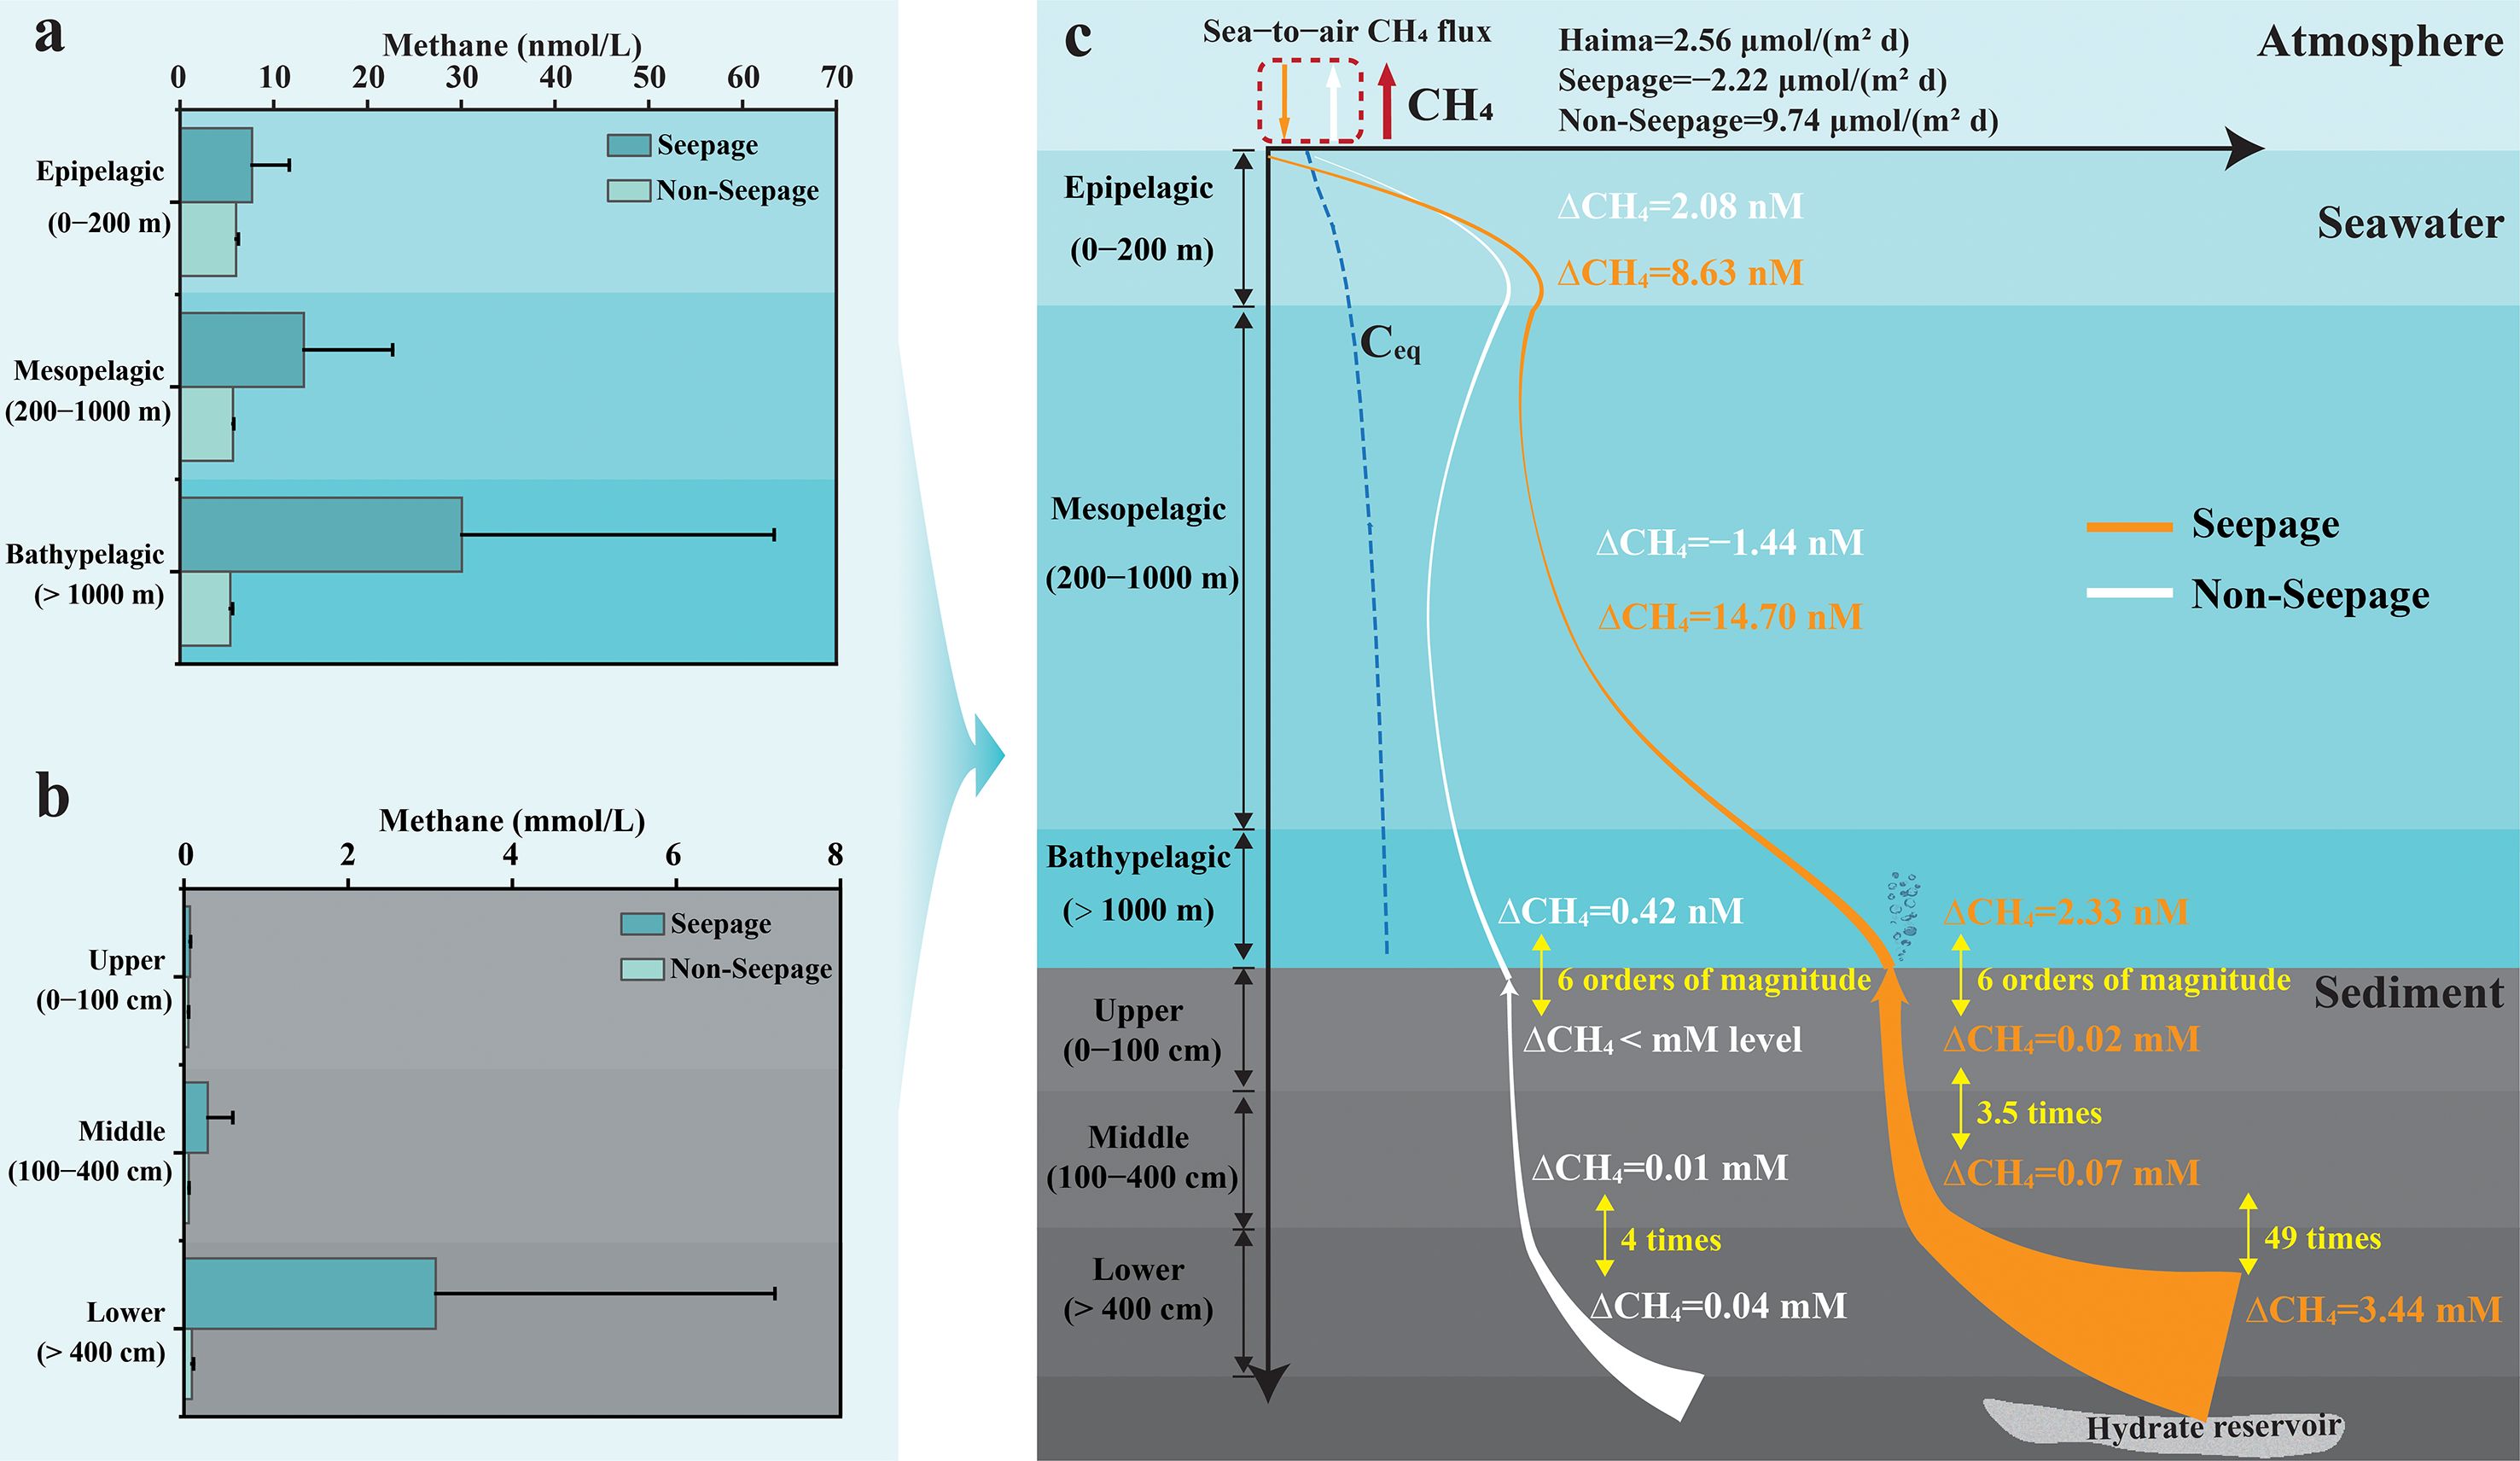
Figure 6. Sediment is an important methane source for bottom water: (A) seawater; (B) sediment porewater; and (C) vertical distribution patterns of methane from the sediment to the water column to the atmosphere.
The average CH4 concentration at the sediment surface was as high as 74,560 nmol/L, significantly exceeding that of the overlying bottom seawater. This, along with direct observations of substantial CH4 bubble emissions at the Seep1 station via the ROV, indicates that ebullition serves as a major CH4 source for bottom water. Moreover, the average CH4 concentration at the sediment surface was as high as 74,560 nmol/L, significantly exceeding that of the overlying bottom seawater. This, along with direct observations of substantial CH4 bubble emissions at the Seep1 station by the ROV, indicates that ebullition serves as a major CH4 source for bottom water.
As CH4 bubbles rise from sediments into the deep seawater, they gradually dissolve and disperse, forming dissolved CH4 in the water column. This process is accompanied by a progressive decline in concentration due to dilution and microbial oxidation. From the bathypelagic to the mesopelagic and epipelagic zones, the average CH4 concentration clearly decreased in the seepage areas, but slightly increased in the non-seepage areas (Figure 6A). In the bathypelagic zone, the change in CH4 concentration was 2.33 nM in seepage areas and 0.42 nM in non-seepage areas. Within the mesopelagic zone, the change increased to 14.70 nM in seepage areas, indicating substantial dilution of dissolved CH4, while non-seepage areas showed a decrease of –1.44 nM, suggesting that the epipelagic zone acts as a source of CH4 for the mesopelagic zone in these areas. In the epipelagic zone, the changes in the dissolved CH4 concentration were 8.63 nM in seepage areas and 2.08 nM in non-seepage areas, reflecting greater CH4 consumption in seepage areas. These results further indicate that CH4 produced within the epipelagic zone is an important source of dissolved CH4 in surface seawater. Notably, this study reveals that seawater in seepage areas acts as a sink for atmospheric CH4, absorbing CH4 from the atmosphere, while that in non-seepage areas serves as a source, releasing CH4 into the atmosphere. The phenomenon of seawater absorbing atmospheric CH4 has also been reported in previous studies (Tseng et al., 2016; Zhong et al., 2023). However, the average sea-to-air CH4 flux was 2.56 μmol/(m2 d), indicating that the Haima cold seep areas overall function as a net source of atmospheric CH4. These findings underscore the importance of cold seep environments as significant contributors to atmospheric CH4 emissions.
While this study provides a systematic snapshot of CH4 dynamics in Haima cold seeps, it also highlights critical avenues for future work. The inferences regarding thermogenic versus biogenic sources call for validation via isotopic analysis (e.g., δ13C-CH4). Moreover, the microbial drivers of CH4 consumption—such as the abundance of anaerobic methanotrophic archaea and methanotrophic bacteria—need quantification via molecular techniques (e.g., sequencing of 16S rRNA and functional genes such as mcrA and pmoA). Finally, given the strong monsoon forcing in the South China Sea, future multi-seasonal surveys are essential to resolve temporal variability and constrain the annual CH4 budget. Therefore, future studies incorporating isotopic tracing, microbiological assays, and multi-seasonal sampling are essential to precisely constrain CH4 sources, elucidate the underlying microbial mechanisms, and resolve the annual CH4 budget from this dynamic system.
5 Conclusions
This study systematically investigated the distribution characteristics and key environmental drivers of methane in the water column and sediment porewater of Haima cold seeps in the South China Sea, with a focus on sea-to-air fluxes and sedimentary diffusive fluxes. The main findings are as follows:
1. Haima cold seeps are characterized by strong spatial heterogeneity in CH4 emissions. The sea-to-air CH4 flux ranged from −5.35 to 12.77 μmol/(m2 d), with an average of 2.56 μmol/(m2 d), identifying the region as a net source of atmospheric CH4. The diffusive flux of CH4 from sediments exhibited even greater variability, ranging from 0.03 to 17.19 mmol/(m2 a).
2. CH4 distribution in the marine environment is influenced by multiple environmental factors. In sediment porewater, key factors include sediment depth, porosity, IC, Cl−, and SO42−. In the water column, SiO32− and DO were identified as the dominant factors controlling the CH4 distribution among the variables examined.
3. A clear vertical connectivity exists from the sediment to the water column. The significant concentration gradient at the sediment–water interface confirms that sediments are a major CH4 source for bottom water. Furthermore, CH4 consumption was markedly greater in active seepage areas than in non-seepage areas, highlighting the intense biogeochemical filtering effect within seep ecosystems.
Data availability statement
The original contributions presented in the study are included in the article/Supplementary Material. Further inquiries can be directed to the corresponding author.
Author contributions
LT: Visualization, Formal analysis, Methodology, Investigation, Writing – review & editing, Writing – original draft. JF: Writing – review & editing, Funding acquisition, Resources. CL: Methodology, Writing – review & editing. XC: Writing – review & editing, Visualization. HZ: Writing – review & editing, Visualization. SZ: Resources, Funding acquisition, Writing – review & editing.
Funding
The author(s) declare that financial support was received for the research and/or publication of this article. The authors would like to acknowledge the financial support from the National Science Fund for Distinguished Young Scholars (42325603), the National Key Research and Development Program (2021YFF0502300), the National Natural Science Foundation of China (42227803, 42449303), the Guangdong Natural Resources Foundation (GDNRC(2023)30), and the PI project of Southern Marine Science and Engineering Guangdong Laboratory (Guangzhou) (GML20190609, GML2022009, and GML20230921).
Conflict of interest
The authors declare that the research was conducted in the absence of any commercial or financial relationships that could be construed as a potential conflict of interest.
Generative AI statement
The author(s) declare that no Generative AI was used in the creation of this manuscript.
Any alternative text (alt text) provided alongside figures in this article has been generated by Frontiers with the support of artificial intelligence and reasonable efforts have been made to ensure accuracy, including review by the authors wherever possible. If you identify any issues, please contact us.
Publisher’s note
All claims expressed in this article are solely those of the authors and do not necessarily represent those of their affiliated organizations, or those of the publisher, the editors and the reviewers. Any product that may be evaluated in this article, or claim that may be made by its manufacturer, is not guaranteed or endorsed by the publisher.
Supplementary material
The Supplementary Material for this article can be found online at: https://www.frontiersin.org/articles/10.3389/fmars.2025.1714180/full#supplementary-material
References
Al-Mur B. A. (2020). Assessing nutrient salts and trace metals distributions in the coastal water of Jeddah, Red Sea. Saudi J. Biol. Sci. 27, 3087–3098. doi: 10.1016/j.sjbs.2020.07.012
Conrad R. (2009). The global methane cycle: recent advances in understanding the microbial processes involved. Environ. Microbiol. Rep. 1, 285–292. doi: 10.1111/j.1758-2229.2009.00038.x
Dan X., Liu S., Feng X., Lin L., Tang R., Yang C., et al. (2023). Geochemical record of methane seepage in carbon cycling and possible correlation with climate events in the Qiongdongnan basin, South China Sea. Mar. Petroleum Geol. 149, 106061. doi: 10.1016/j.marpetgeo.2022.106061
Deng Y., Chen F., Guo Q., Hu Y., Chen D., Yang S., et al. (2021). Possible links between methane seepages and glacial-interglacial transitions in the South China Sea. Geophys. Res. Lett. 48, e2020GL091429. doi: 10.1029/2020GL091429
Di P., Feng D., Tao J., and Chen D. (2020). Using time-series videos to quantify methane bubbles flux from natural cold seeps in the South China Sea. Minerals. 10, 216. doi: 10.3390/min10030216
Egger M., Riedinger N., Mogollón J. M., and Jørgensen B. B. (2018). Global diffusive fluxes of methane in marine sediments. Nat. Geosci. 11, 421–425. doi: 10.1038/s41561-018-0122-8
Ernst L., Steinfeld B., Barayeu U., Klintzsch T., Kurth M., Grimm D., et al. (2022). Methane formation driven by reactive oxygen species across all living organisms. Nature 603, 482–487. doi: 10.1038/s41586-022-04511-9
Etiope G. (2009). Natural emissions of methane from geological seepage in Europe. Atmos. Environ. 43, 1430–1443. doi: 10.1016/j.atmosenv.2008.03.014
Feng D., Qiu J.-W., Hu Y., Peckmann J., Guan H., Tong H., et al. (2018). Cold seep systems in the South China Sea: An overview. J. Asian Earth Sci. 168, 3–16. doi: 10.1016/j.jseaes.2018.09.021
Feng J., Yang S., Wang H., Liang J., Fang Y., and Luo M. (2019). Methane source and turnover in the shallow sediments to the west of Haima cold seeps on the Northwestern slope of the South China Sea. Geofluids 2019, 1010824. doi: 10.1155/2019/1010824
General Administration of Quality Supervision, Inspection and Quarantine of the People’s Republic of China, and Standardization Administration of the People’s Republic of China. (2008). Specifications for oceanographic survey—Part 4: Survey of chemical parameters in sea water. (China: Standard Press).
Huang Y., Feng J.-C., Kong J., Sun L., Zhang M., Huang Y., et al. (2023). Community assemblages and species coexistence of prokaryotes controlled by local environmental heterogeneity in a cold seep water column. Sci. Total Environ. 868, 161725. doi: 10.1016/j.scitotenv.2023.161725
IPCC (2013). Climate Change 2013 – The Physical Science Basis: Working Group I Contribution to the Fifth Assessment Report of the Intergovernmental Panel on Climate Change (Cambridge: Cambridge University Press).
Iversen N. and Jørgensen B. B. (1993). Diffusion coefficients of sulfate and methane in marine sediments: Influence of porosity. Geochim. Cosmochim. Acta 57, 571–578. doi: 10.1016/0016-7037(93)90368-7
Judd A. G. (2004). Natural seabed gas seeps as sources of atmospheric methane. Environ. Geol. 46, 988–996. doi: 10.1007/s00254-004-1083-3
Lapham L., Marshall K., Magen C., Lyubchich V., Cooper L. W., and Grebmeier J. M. (2017). Dissolved methane concentrations in the water column and surface sediments of Hanna Shoal and Barrow Canyon, Northern Chukchi Sea. Deep Sea Res. Part II: Topical Stud. Oceanogr. 144, 92–103. doi: 10.1016/j.dsr2.2017.01.004
Li Y., Fichot C. G., Geng L., Scarratt M. G., and Xie H. (2020). The contribution of methane photoproduction to the oceanic methane paradox. Geophys. Res. Lett. 47, e2020GL088362. doi: 10.1029/2020GL088362
Li N., Jin M., Peckmann J., Chen D., and Feng D. (2023). Quantification of the sources of sedimentary organic carbon at methane seeps: A case study from the South China Sea. Chem. Geol. 627, 121463. doi: 10.1016/j.chemgeo.2023.121463
Li Y.-X., Sun Y., Lin Y.-T., Xu T., Ip J. C. H., and Qiu J.-W. (2023). “Cold seep macrofauna,” in South China Sea Seeps. Eds. Chen D. and Feng D. (Springer Nature Singapore, Singapore), 69–88.
Liang Q., Hu Y., Feng D., Peckmann J., Chen L., Yang S., et al. (2017). Authigenic carbonates from newly discovered active cold seeps on the northwestern slope of the South China Sea: Constraints on fluid sources, formation environments, and seepage dynamics. Deep Sea Res. Part I: Oceanogr. Res. Papers 124, 31–41. doi: 10.1016/j.dsr.2017.04.015
Liu Z. and Gan J. (2017). Three-dimensional pathways of water masses in the South China Sea: A modeling study. J. Geophys. Res.: Oceans 122, 6039–6054. doi: 10.1002/2016JC012511
Mao S.-H., Wang J.-Y., Joye S., and Zhuang G.-C. (2024). Marine methane paradox: Enigmatic production of methane in oxygenated waters. Innovation Geosci. 2, 100071. doi: 10.59717/j.xinn-geo.2024.100071
Mao S.-H., Zhang H.-H., Zhuang G.-C., Li X.-J., Liu Q., Zhou Z., et al. (2022). Aerobic oxidation of methane significantly reduces global diffusive methane emissions from shallow marine waters. Nat. Commun. 13, 7309. doi: 10.1038/s41467-022-35082-y
Miao X., Liu X., Li Q., Li A., Cai F., Kong F., et al. (2022). Porewater geochemistry indicates methane seepage in the Okinawa Trough and its implications for the carbon cycle of the subtropical West Pacific. Palaeogeogr. Palaeoclimatol. Palaeoecol. 607, 111266. doi: 10.1016/j.palaeo.2022.111266
Ni X., Liu X., Pang S., Dong Y., Guo B., Zhang Y., et al. (2025). Global marine methane seepage: Spatiotemporal patterns and ocean current control. Mar. Geol. 487, 107589. doi: 10.1016/j.margeo.2025.107589
Oppo D., De Siena L., and Kemp D. B. (2020). A record of seafloor methane seepage across the last 150 million years. Sci. Rep. 10, 2562. doi: 10.1038/s41598-020-59431-3
Ordóñez C., DelSontro T., Langenegger T., Donis D., Suarez E. L., and McGinnis D. F. (2023). Evaluation of the methane paradox in four adjacent pre-alpine lakes across a trophic gradient. Nat. Commun. 14, 2165. doi: 10.1038/s41467-023-37861-7
Peng B., Li J., Zhang H., Overmans S., Wang Y., Xu L., et al. (2024). Interactions between ocean acidification and multiple environmental drivers on the biochemical traits of marine primary producers: A meta-analysis. Mar. Environ. Res. 201, 106707. doi: 10.1016/j.marenvres.2024.106707
Razaz M., Di Iorio D., Wang B., Daneshgar Asl S., and Thurnherr A. M. (2020). Variability of a natural hydrocarbon seep and its connection to the ocean surface. Sci. Rep. 10, 12654. doi: 10.1038/s41598-020-68807-4
Reeburgh W. S. (2007). Oceanic methane biogeochemistry. Chem. Rev. 107, 486–513. doi: 10.1021/cr050362v
Repeta D. J., Ferrón S., Sosa O. A., Johnson C. G., Repeta L. D., Acker M., et al. (2016). Marine methane paradox explained by bacterial degradation of dissolved organic matter. Nat. Geosci. 9, 884–887. doi: 10.1038/ngeo2837
Skeie R. B., Hodnebrog Ø., and Myhre G. (2023). Trends in atmospheric methane concentrations since 1990 were driven and modified by anthropogenic emissions. Commun. Earth Environ. 4, 317. doi: 10.1038/s43247-023-00969-1
Smith J. P. and Coffin R. B. (2014). Methane flux and authigenic carbonate in shallow sediments overlying methane hydrate bearing strata in Alaminos Canyon, Gulf of Mexico. Energies 7, 6118–6141. doi: 10.3390/en7096118
Stolper D. A., Lawson M., Davis C. L., Ferreira A. A., Neto E. V. S., Ellis G. S., et al. (2014). Formation temperatures of thermogenic and biogenic methane. Science 344, 1500–1503. doi: 10.1126/science.1254509
Stolper D. A., Martini A. M., Clog M., Douglas P. M., Shusta S. S., Valentine D. L., et al. (2015). Distinguishing and understanding thermogenic and biogenic sources of methane using multiply substituted isotopologues. Geochim. Cosmochim. Acta 161, 219–247. doi: 10.1016/j.gca.2015.04.015
Tseng H.-C., Chen C.-T. A., Borges A. V., DelValls T. A., and Chang Y.-C. (2017). Methane in the South China Sea and the Western Philippine Sea. Continent. Shelf Res. 135, 23–34. doi: 10.1016/j.csr.2017.01.005
Tseng H.-C., Chen C.-T. A., Borges A. V., DelValls T. A., Lai C.-M., and Chen T.-Y. (2016). Distributions and sea-to-air fluxes of nitrous oxide in the South China Sea and the West Philippines Sea. Deep Sea Res. Part I: Oceanogr. Res. Papers 115, 131–144. doi: 10.1016/j.dsr.2016.06.006
Wang X., Li N., Feng D., Hu Y., Bayon G., Liang Q., et al. (2018). Using chemical compositions of sediments to constrain methane seepage dynamics: A case study from Haima cold seeps of the South China Sea. J. Asian Earth Sci. 168, 137–144. doi: 10.1016/j.jseaes.2018.11.011
Wanninkhof R. (2014). Relationship between wind speed and gas exchange over the ocean revisited. Limnol. Oceanogr.: Methods 12, 351–362. doi: 10.4319/lom.2014.12.351
Weber T., Wiseman N. A., and Kock A. (2019). Global ocean methane emissions dominated by shallow coastal waters. Nat. Commun. 10, 4584. doi: 10.1038/s41467-019-12541-7
Wiesenburg D. A. and Guinasso N. L. Jr. (1979). Equilibrium solubilities of methane, carbon monoxide, and hydrogen in water and sea water. J. Chem. Eng. Data. 24, 356–360. doi: 10.1021/je60083a006
Wu J., Lao Q., Chen F., Huang C., Zhang S., Wang C., et al. (2021). Water mass processes between the South China Sea and the western pacific through the Luzon Strait: insights from hydrogen and oxygen isotopes. J. Geophys. Res.: Oceans 126, e2021JC017484. doi: 10.1029/2021JC017484
Xu C., Sun Z., Li Q., Zhang X., Zhang X., Zhai B., et al. (2023). Methane distribution and sea-to-air methane flux in the Dongsha area of the South China Sea. Continent. Shelf Res. 264, 105057. doi: 10.1016/j.csr.2023.105057
Zhang G., Cao J., Deng Y., Lai H., Jiang X., Fang Y., et al. (2023). A 209,000-year-old history of methane seepage activity controlled by multiple factors in the South China Sea. Mar. Petroleum Geol. 151, 106200. doi: 10.1016/j.marpetgeo.2023.106200
Zhang H., Feng J.-C., Shen Y., Zhang M., Huang Y., Li P., et al. (2023). An epifaunal community succession sequence driven by the biogeochemical footprint with different methane seepage intensity of the deep seafloor. Earth’s Future 11, e2022EF003373. doi: 10.1029/2022EF003373
Zhang X., Sun Z., Wang L., Zhang X., Zhai B., Xu C., et al. (2020). Distribution and discharge of dissolved methane in the middle Okinawa trough, East China Sea. Front. Earth Sci. 8. doi: 10.3389/feart.2020.00333
Zhang J., Zhang G. S., and Liu S. M. (2005). Dissolved silicate in coastal marine rainwaters: Comparison between the Yellow Sea and the East China Sea on the impact and potential link with primary production. J. Geophys. Res.: Atmospheres 110, D16304. doi: 10.1029/2004JD005411
Zhong C., Ja Lu., Kang D., and Liang Q. (2023). Application of the navigational air-sea methane exchange flux observation system in the Qiongdongnan Basin of the Northern South China Sea. Energies 16, 507. doi: 10.3390/en16010507
Zhou H., Yin X., Yang Q., Wang H., Wu Z., and Bao S. (2009). Distribution, source and flux of methane in the western Pearl River Estuary and northern South China Sea. Mar. Chem. 117, 21–31. doi: 10.1016/j.marchem.2009.07.011
Keywords: methane, distribution, environmental factors, migration, cold seep
Citation: Tang L, Feng J-C, Li C-R, Chen X, Zhang H and Zhang S (2025) Distribution and potential drivers of methane emissions from deep-sea environments in Haima cold seep areas. Front. Mar. Sci. 12:1714180. doi: 10.3389/fmars.2025.1714180
Received: 27 September 2025; Accepted: 24 November 2025; Revised: 20 November 2025;
Published: 05 December 2025.
Edited by:
Xiaoyong Duan, Qingdao Institute of Marine Geology (QIMG), ChinaReviewed by:
Zhilei Sun, Qingdao Institute of Marine Geology (QIMG), ChinaHaodong Chen, Chinese Academy of Sciences (CAS), China
Copyright © 2025 Tang, Feng, Li, Chen, Zhang and Zhang. This is an open-access article distributed under the terms of the Creative Commons Attribution License (CC BY). The use, distribution or reproduction in other forums is permitted, provided the original author(s) and the copyright owner(s) are credited and that the original publication in this journal is cited, in accordance with accepted academic practice. No use, distribution or reproduction is permitted which does not comply with these terms.
*Correspondence: Jing-Chun Feng, ZmVuZ2pjQGdkdXQuZWR1LmNu