 Sining Zheng
 Yanfen Yan1†
- 1School of Public Administration and Law, Fujian Agriculture and Forestry University, Fuzhou, China
- 2Faculty of Health and Life Sciences, INTI International University, Nilai, Malaysia
Introduction: Green Total Factor Productivity (GTFP) serves as a key indicator for assessing an industry's green development performance.
Methods: Based on panel data from nine coastal provinces in China from 2013 to 2023, this study constructs an evaluation indicator system for the Green Total Factor Productivity of China’s mariculture industry, conducts measurements, analyzes its temporal evolution characteristics, reveals its regional disparities, and assesses its dynamic evolutionary trends.
Results: (1) From 2013 to 2023, the average GTFP of China’s coastal mariculture industry was 0.93, indicating room for further improvement in the level of green development. After 2020, the GTFP began to show a sustained increase, suggesting initial signs of effectiveness in the green transition of the mariculture sector. The growth of GTFP was jointly driven by both green technical change and green technical efficiency change; however, the contribution of technical change exceeded that of efficiency change gains. (2) There are significant provincial disparities in the GTFP of the mariculture industry. The average GTFP values of Liaoning, Hainan, Guangxi, Guangdong, and Shandong exceeded 1. The averages for Fujian, Zhejiang, and Jiangsu ranged between 0.8 and 1.0, while Hebei recorded the lowest average of 0.6. Inter-regional differences were identified as the primary source of the overall disparity. (3) In the short term, provinces with low GTFP levels face challenges in overcoming their backward status, while provinces with high levels can easily maintain their leading positions, indicating a phenomenon of polarization. In the long run, the probability of provinces with low and medium GTFP levels transitioning to higher levels increases significantly. The likelihood of a province moving upward is positively correlated with the GTFP levels of its neighboring provinces. The driving effect from adjacent medium-level provinces is the strongest. Proximity to high-level provinces may produce a “double-edged sword” effect.
Discussion: Based on these findings, this paper proposes recommendations to increase investment in core technology research and development, promote regional coordinated development, and implement differentiated performance evaluations.
1 Introduction
According to data released by the Food and Agriculture Organization of the United Nations (FAO), the total global production of capture fisheries and aquaculture reached 223.2 million tons in 2022. Aquaculture production accounted for 130.9 million tons. Within aquaculture, the production of aquatic animal products was 94.4 million tons, surpassing for the first time the production of aquatic animal products from capture fisheries (91 million tons), representing 51% of the world’s total aquatic animal production. The data indicate that the global trend of aquaculture growth is irreversible. China maintained its position as the leading producer, with a combined capture fisheries and aquaculture production of 68.7 million tons in 2022, accounting for 36% of the global total. China’s aquaculture production reached 55.7 million tons, representing approximately 60% of the world’s production of aquatic animal products from aquaculture, solidifying its status as a true aquaculture powerhouse (FAO, 2024). According to the China Fisheries Economic Statistical Bulletin 2024 released by the Ministry of Agriculture and Rural Affairs of the People’s Republic of China (MARA), China’s aquaculture output reached 606 million tons, accounting for 82% of the country’s total aquatic product production (Ministry of Agriculture and Rural Affairs of the People’s Republic of China (MARA), 2025). This remarkable achievement is attributed to China’s long-term implementation of an aquaculture development strategy. Aquaculture is the primary approach for China’s future fishery production and ensuring the supply of aquatic products. In China’s aquatic product market supply system, mariculture plays a crucial role. In 2024, China’s mariculture output amounted to 25.3 million tons, representing 41% of the country’s total aquaculture production. Mariculture contributes significantly to improving residents’dietary structure, ensuring national food security, and promoting regional economic growth.
However, with the rapid expansion of mariculture, issues such as the degradation of aquatic ecosystems and low efficiency of resource input have become increasingly prominent (Wang et al., 2023). Unreasonable farming practices by aquaculture operators, including high-density cultivation, excessive use of feed and fish medication, and the discharge of untreated aquaculture wastewater, have led to water eutrophication and algal blooms (Shen et al., 2023). These practices result in the deterioration of the aquatic environment, which in turn affects the yield and quality of marine products and threatens the sustainable development of fisheries. To address these challenges, the Chinese government has continuously strengthened policy guidance. In 2022, the Ministry of Ecology and Environment (MEE) and the Ministry of Agriculture and Rural Affairs of the People’s Republic of China jointly issued the Opinions on Strengthening the Ecological Environment Supervision of Mariculture. This policy highlighted that the irregular development of mariculture in some regions has adversely affected the local marine ecosystems (Ministry of Ecology and Environment (MEE) and the Ministry of Agriculture and Rural Affairs (MARA) of the People’s Republic of China, 2022). Therefore, the government must enhance supervision and promote the green development of the mariculture industry. Additionally, the growing demand for high-quality and safe aquatic products among urban and rural residents objectively imposes green requirements on the development of mariculture. Against this backdrop, how to achieve the green transformation of the mariculture industry and correctly balance the relationship between resources, the environment, and economic growth has become an important topic of concern for academia and relevant departments.
The core of economic growth lies in the expansion of total factor productivity (TFP). Conventional TFP measurements rely on factor inputs and intended outputs, often overlooking undesired outputs. Green total factor productivity (GTFP) integrates resource and environmental factors into the traditional TFP framework, capturing the drivers of economic growth beyond labor, capital, and land (Kumar, 2006; Elsadig, 2012). The proposal of this concept is consistent with the core tenets of endogenous growth theory, collectively providing a solid theoretical foundation for understanding the green transition of the mariculture industry. The scale expansion of traditional mariculture heavily relies on factor inputs, a growth path constrained by the law of diminishing marginal returns and often achieved at the expense of the environment, rendering it unsustainable in the long run. This extensive growth model of “pollute first, treat later” aligns with the ascending left-hand side of the inverted U-shape described by the Environmental Kuznets Curve, where the initial stage of industrial development is accompanied by increasing environmental pressure. However, passively waiting for the inflection point to arrive carries significant ecological and economic risks. According to endogenous growth theory, the key to breaking this dilemma lies in shifting the driving force of growth from external factor inputs to efficiency improvements driven by internal elements such as knowledge and technology. The Environmental Kuznets Curve theory further clarifies that the core of achieving the inflection point is to internalize environmental costs through strong policy guidance and technological innovation, thereby actively “flattening” or even “leapfrogging” the curve’s peak. Therefore, the transformation of the growth dynamic in China’s mariculture industry is, in essence, a profound shift in the growth model: moving from a traditional pattern reliant on high factor input and diminishing returns, to a green endogenous growth pattern driven by green technological innovation and efficiency gains, characterized by increasing returns. This process is precisely the critical pathway to propel the industry’s development trajectory along the Environmental Kuznets Curve, past the inflection point, and towards the descending right-hand side where both economic and environmental benefits are achieved.
The contributions of this paper are mainly reflected in the following five aspects: First, it constructs an evaluation indicator system for the GTFP of China’s mariculture industry and employs the Super Slack-Based Measure (Super-SBM) model to measure the GTFP of the mariculture industry in nine coastal provinces. Second, it utilizes the Global Malmquist Luenberger (GML) index to analyze the temporal evolution characteristics of the GTFP in China’s coastal mariculture industry from 2013 to 2023. Third, it applies Dagum’s Gini coefficient decomposition method to reveal the sources of regional disparities in the GTFP of the mariculture industry among China’s three major sea areas (the Yellow Sea and Bohai Sea area, the East China Sea area, and the South China Sea area) and the nine provinces. Fourth, it uses Markov chains to predict the future evolutionary trend of the GTFP in China’s coastal mariculture industry. Fifth, based on the above research findings, it proposes targeted countermeasures and recommendations. An in-depth exploration of these questions holds significant theoretical and practical importance for refining the theory and policy of green development in China’s mariculture industry.
2 Literature review
Current academic research has explored the measurement of total factor productivity (TFP) in the marine aquaculture industry and its influencing factors. The first aspect involves the indicators and methods for measuring TFP in this sector. Existing studies typically consider land, labor, and resource elements as inputs, while using output or production value as desired outputs to estimate TFP (Asche et al., 2013; Guo et al., 2022; Zhang et al., 2023). Building on this approach, some scholars have incorporated pollutant discharges—such as total nitrogen, total phosphorus, and chemical oxygen demand—as undesirable outputs to evaluate green TFP in marine aquaculture (Ji and Zeng, 2017; Zhang and Ji, 2022). Only a limited number of researchers have addressed the ecological externalities associated with carbon sinks and carbon emissions (Fu et al., 2023; Yang et al., 2024). The primary methods for measuring total factor productivity (TFP) in the mariculture industry include stochastic frontier analysis (SFA) and data envelopment analysis (DEA) (Liu and Yang, 2017; Jiang et al., 2021). Most scholars integrate the DEA model with the Global Malmquist–Luenberger (GML) index to estimate TFP (Hu and He, 2024). Second, the influencing factors of total factor productivity in mariculture. Existing studies have examined the effects of various factors on TFP, such as environmental regulation (Qiu et al., 2022), technological innovation (Cao and Zhang, 2021), technical training for fishermen (Shen et al., 2023), the number of fishery practitioners (Wang et al., 2023), and the area of tidal flat aquaculture (Xu et al., 2022).
Existing research provides a solid foundation for this paper, yet several limitations remain. Firstly, few studies focus specifically on the green total factor productivity (GTFP) of the mariculture industry. Moreover, a systematic framework for measuring GTFP in mariculture has not yet been established. Secondly, there is insufficient research on the dynamic evolution and regional disparities of GTFP within the mariculture sector. Thirdly, most existing studies analyze the factors influencing mariculture GTFP from a single perspective, rather than conducting a comprehensive multi-dimensional analysis. Based on this, this study first constructs an evaluation system that includes inputs of land, labor, resources, and technology; desirable outputs such as yield, output value, and carbon sink; and undesirable outputs including pollutant discharge, economic losses from disasters, and carbon emissions. This system is used to systematically measure the GTFP of the mariculture industry in China’s coastal areas, aiming to accurately reflect its comprehensive efficiency. Second, it analyzes the temporal evolution characteristics of the mariculture industry’s GTFP. Third, it reveals the sources of regional disparities in the mariculture industry’s GTFP. Fourth, it examines the dynamic evolutionary trends of the mariculture industry’s GTFP. Finally, based on the research findings, it proposes policy recommendations to provide a theoretical basis and decision-making references for relevant departments in formulating policies aimed at enhancing the GTFP of the mariculture industry.
3 Research design and variable description
3.1 Model selection
3.1.1 Super slack-based measure
Tone (2001) proposed the Super Slack-Based Measure (SBM), which can comprehensively consider the mixed distance function of radial and non–radial, improving the measurement accuracy. This paper uses the Super-SBM model to measure the green total factor productivity of the mariculture industry. The formula is as follows (Equations 1, 2):
represents the efficiency value; x, y, and b represent inputs, desirable outputs, and undesirable outputs respectively; i, r, and k represent the number of input, desirable output, and undesirable output variables respectively; , , and are the slack variables of inputs, desirable outputs, and undesirable outputs respectively; t represents the year; is the weight variable.
3.1.2 Global Malmquist-Luenberger index
Oh (2010) proposed the Global Malmquist-Luenberger (GML) index. The GML index can reflect the relative position change between GTFP and the production frontier within a certain period, which is a dynamic analysis. This paper uses the SBM-GML to measure the change index of the green total factor productivity of the mariculture industry. The formula is as follows (Equation 3):
is obtained according to the global benchmark production possibility set PG. and represent the production reference sets based on the global directional distance function in period t and period t+1 respectively; x represents input factors; y represents output factors; b represents undesirable output factors. represents the change of the change index of the GTFP in mariculture in period t+1 relative to period t. If > 1, it indicates that the change index of the GTFP in mariculture increases from period t to period t+1; if < 1, it means that the change index of the GTFP in mariculture decreases from period t to period t+1.
The green total factor productivity change (GTFPC) index can be decomposed into the green technical change (GTC) index and the green technical efficiency change (GTEC) index. When measuring the global GML index, the same global frontier is referred to, but when measuring the green technical efficiency and technological progress change, their respective frontiers are referred to. The formula is as follows (Equation 4):
GTCt,t+1 represents the change in green technology progress in period t+1 relative to period t. If GTCt,t+1 > 1, it indicates that there is progress in green technology from period t to period t+1; if GTECt,t+1<1, it indicates that the green technology efficiency has improved from period t to period t+1; if GTECt,t+1 < 1, it means that the green technology efficiency has decreased.
3.1.3 Dagum Gini coefficient
This paper uses the Gini coefficient proposed by Dagum and its decomposition method to analyze the degree and sources of regional differences in the green total factor productivity of mariculture in China’s coastal areas. The higher the Gini coefficient value, the greater the regional gap in the green total factor productivity of mariculture, and vice versa. The formula is as follows (Equation 5):
Among them, n represents the number of provinces, k is the total number of regions, i (r) represents the sub–script of provinces within the region, j (h) represents the sub–script of regions, nj (nh) represents the number of provinces in the j (h) region, yji (yhr) represents the green total factor productivity of the marine aquaculture industry of province i (r) in the j (h) region, is the average value of the green total factor productivity of the marine aquaculture industry of each province. This paper further decomposes the Dagum Gini coefficient into intra –regional differences (GW), inter–regional differences (Gnb), and hyper–variable density (Gt) to accurately identify the sources of regional differences. The formula is as follows (Equation 6):
3.1.4 Markov chain
This paper uses the Markov chain to analyze the direction of the transfer of the green total factor productivity of mariculture level of China’s coastal provinces to different states and the magnitude of the transfer probability. This paper uses the tercile method to divide GTFP into a low–level group (less than or equal to 30%), a medium–level group (between 30% and 60%), and a high–level group (greater than or equal to 60%). This paper uses the traditional Markov chain to study the probability of the transfer of the GTFP of different provinces to different states. At the same time, this paper also uses the spatial Markov chain to study whether the GTFP level of neighboring regions has an impact on the GTFP level of the local region, so as to reveal the dynamic development trend of the green total factor productivity of mariculture.
3.2 Measurement indicators of green total factor productivity in mariculture
First, this paper selects labor (the number of professional practitioners in mariculture), land (the area of mariculture), fixed assets (the total power of marine motorized aquaculture fishing boats), resources (the quantity of marine fish seedings), and technology (the total funds for the promotion of mariculture technology) as production input indicators (Table 1). The total funds for the promotion of mariculture technology are equal to the total funds for the promotion of fishery technology multiplied by the proportion of the output value of mariculture in the total output value of the fishery industry.
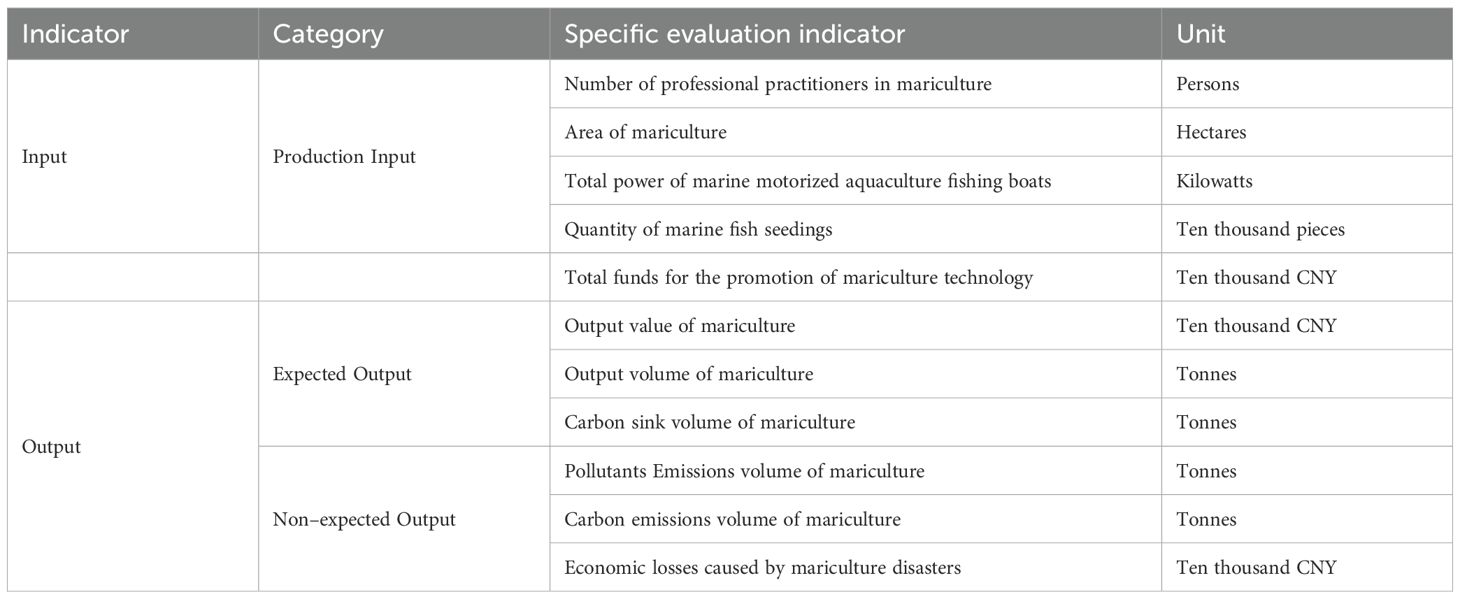
Table 1. Indicator system for measuring the green total factor productivity of China’s mariculture industry.
Second, this paper selects the output value, output volume, and carbon sink volume of mariculture as the expected output indicators. The main sources of carbon sinks in mariculture are shellfish and algae. The main source of carbon sinks in mariculture are shellfish and algae. Through their growth activities, they absorb and utilize carbon elements in the water to form carbon sinks. The sequestered carbon is then removed from the water body through the harvest of aquatic products, a process known as the “removable carbon sink” (Li et al., 2022). This paper draws on the physical quantity assessment methods of Shao et al. (2019a) and Zhang et al. (2022), as well as the dry–weight ratios, mass proportions, and carbon sink coefficients of shellfish and algae varieties proposed by Xu et al. (2020) and Xiang et al. (2022) to measure the total carbon sink volume of mariculture. The calculation formula for carbon sinks is as follows (Equations 7–9):
denote the total carbon sink in mariculture, the total carbon sink from mariculture shellfish, and the total carbon sink from mariculture algae. Qi represents the yield of the i-th organism, α represents the dry-weight coefficient of the mariculture organism, and ω represents its carbon sink coefficient. i and k denote the species of shellfish and algae, respectively, while j represents the shell or soft tissue of shellfish.
Finally, this paper selects the pollutant emissions, carbon emissions, and economic losses caused by disasters in mariculture as the non–expected output indicators. The pollutant emissions in mariculture are characterized by the emissions of total nitrogen, total phosphorus, and chemical oxygen demand generated by mariculture organisms. This paper calculates according to the method of calculating the production and discharge of pollutants in the aquaculture industry (pollutant emissions are equal to the pollution discharge coefficient multiplied by the aquaculture output) in the Manual of Accounting Methods and Coefficients for Agricultural Pollution Sources (Ministry of Ecology and Environment of the People’s Republic of China (MEE), 2021). The pollutant emissions of mariculture in each province are equal to the sum of the emissions of total nitrogen, total phosphorus, and chemical oxygen demand. The carbon emissions of mariculture are equal to the sum of the direct carbon emissions generated by the combustion of diesel oil consumed by aquaculture fishing boats and the indirect carbon emissions generated by electricity consumption in the process of pond aquaculture and industrial aquaculture (Shao et al., 2019b; Xu and Wang, 2015). The economic losses caused by mariculture disasters are calculated by multiplying the economic losses caused by fishery disasters by the proportion of mariculture output value in the total fishery output value. The calculation formula is as follows (Equation 10):
C represents the carbon emissions from the mariculture industry. P represents the power of mariculture fishing vessels. α represents the fuel consumption coefficient of fishing vessels. With reference to the Chinese Motorized Fishing Vessel Oil Price Subsidy Fuel Consumption Calculation Reference Standard, this coefficient is set at 0.225 tons/kW. Q and S represent the production output of marine pond aquaculture and marine industrial aquaculture, respectively. β and η represent the electricity consumption coefficients per unit output for pond aquaculture and industrial aquaculture, respectively. These are set at 0.37 kWh/kg and 8.66 kWh/kg. θ1 and θ2 represent the energy conversion coefficients for diesel and electricity, respectively. Based on the China Energy Statistical Yearbook, these coefficients are set at 1.4571 kgce/kg and 0.1229 kgce/kWh.γ represents the carbon emission coefficient, set at 2.493 k.
3.3 Data sources
The data are sourced from the China Fishery Statistical Yearbook and China Statistical Yearbook from 2013 to 2024, as well as the Statistical Yearbooks of 9 provinces: Hebei Province, Liaoning Province, Shandong Province, Jiangsu Province, Zhejiang Province, Fujian Province, Guangdong Province, Hainan Province, and Guangxi Zhuang Autonomous Region. The three variables of the total funds for mariculture technology promotion, mariculture output value, and economic losses caused by mariculture disasters are adjusted to the comparable prices of 2013 according to the GDP index of agriculture, forestry, animal husbandry, and fishery to eliminate the impact of price fluctuations.
4 Measurement the green total factor productivity of the mariculture industry
4.1 The measurement results of green total factor productivity in mariculture
(1) From 2013 to 2023, the average GTFP of China’s coastal mariculture industry was 0.93, indicating that growth over the past decade primarily relied on resource inputs and environmental costs. After 2020, GTFP began to show sustained improvement, suggesting initial signs of green transformation in the mariculture sector, with the industry gradually shifting from scale expansion to quality enhancement and ecological sustainability(Table 2). (2) The average GTFP of Liaoning, Hainan, Guangxi, Guangdong, and Shandong is greater than 1. This indicates that these provinces actively promote the green development of the mariculture industry while achieving the economic growth of mariculture. The average GTFP of Fujian, Zhejiang, and Jiangsu is between 0.8 and 1.0. These three provinces have good economic conditions, relatively complete infrastructure, and relatively strong demand for seafood from residents, with great potential for market development. However, there is still room for improvement in terms of resource and environmental protection. The average GTFP of Hebei is 0.6, indicating that it urgently needs to accelerate the adjustment of mariculture varieties and methods, reduce the pollution caused by aquaculture to the water ecological environment, and promote the transformed and upgraded development of the mariculture industry towards green development. To ensure the reliability of the research findings, this paper employs the Super Epsilon-Based Measure (EBM) for robustness checks. The results indicate that the development trend of the green total factor productivity in China’s coastal mariculture industry from 2013 to 2023 is generally consistent with the baseline model, confirming the robustness of the findings. In conclusion, there are relatively obvious differences in the GTFP among the nine coastal provinces in China, and it is particularly important to promote the green and coordinated development of the mariculture industry.
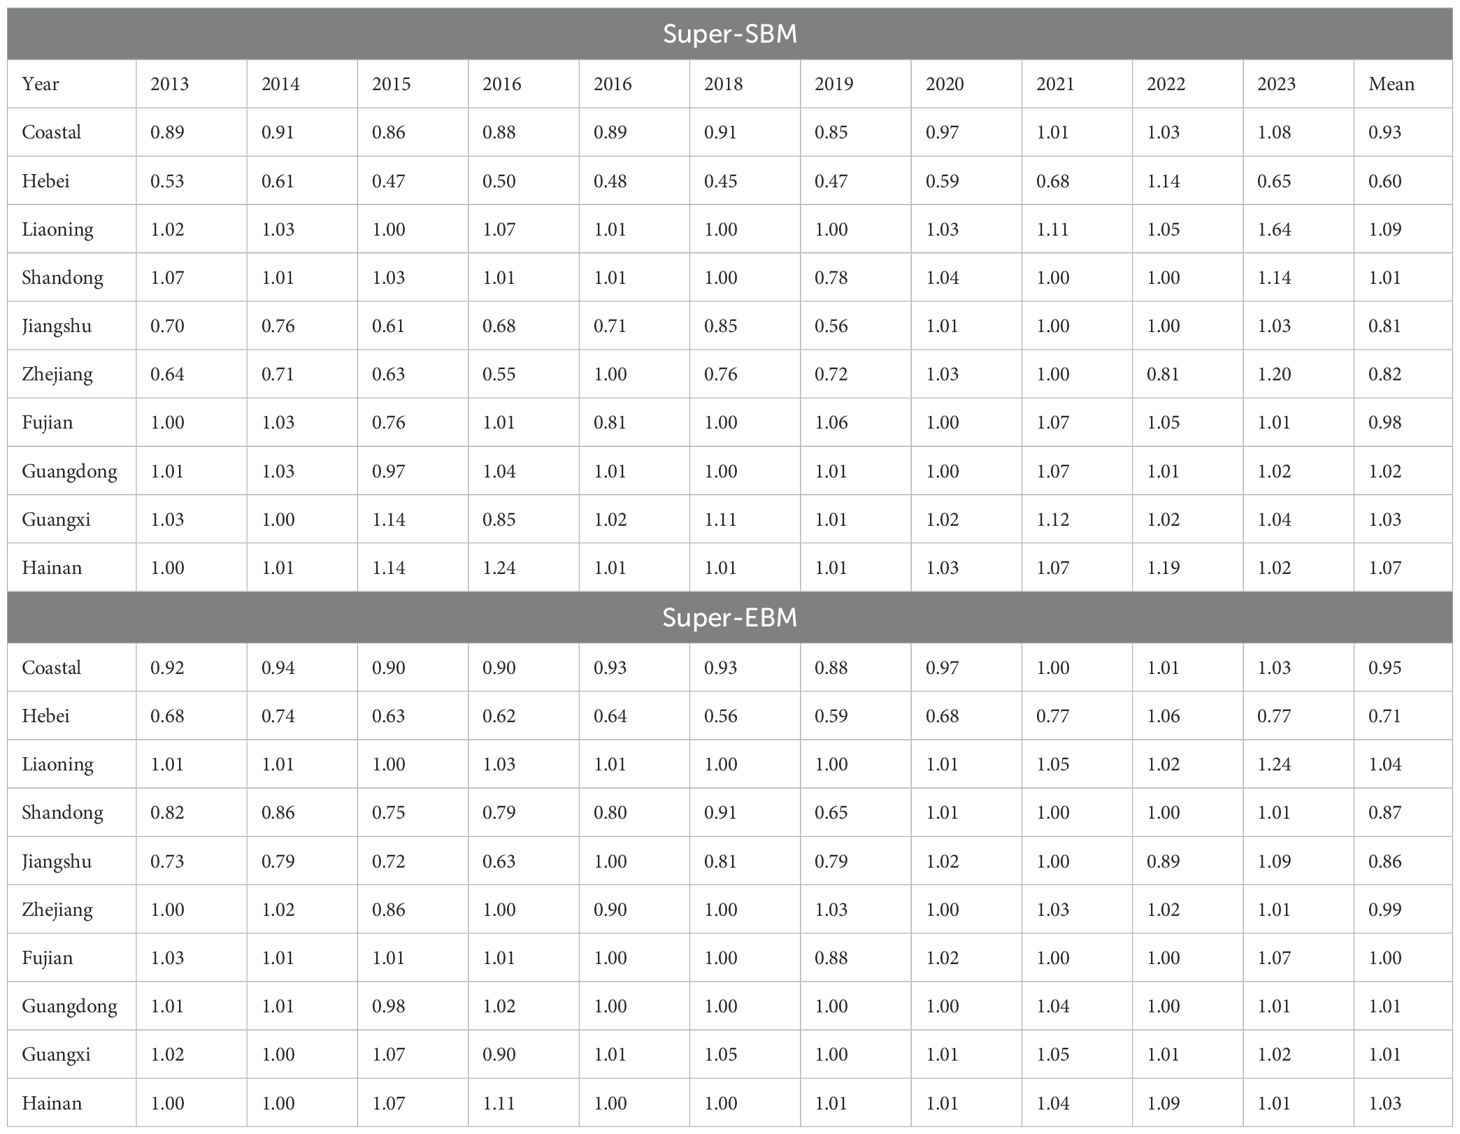
Table 2. The results of the green total factor productivity of the mariculture industry in the coastal areas of China.
4.2 Measurement results of the green total factor productivity change index in mariculture
(1) From 2013 to 2023, the average value of the change index of China’s green total factor productivity in the mariculture industry was 1.04, showing an overall upward trend (Table 3). (2) The growth of the change index of the GTFP in mariculture mainly stems from green technological progress, while the contribution of green technical efficiency is relatively low. The robustness checks using the Super-EBM model show that the growth trend of the green total factor productivity in China’s coastal mariculture industry from 2013 to 2023 is largely consistent with the baseline model, indicating the robustness of the findings. (3) The change index of the GTFP in mariculture in the nine coastal provinces all achieved positive growth.
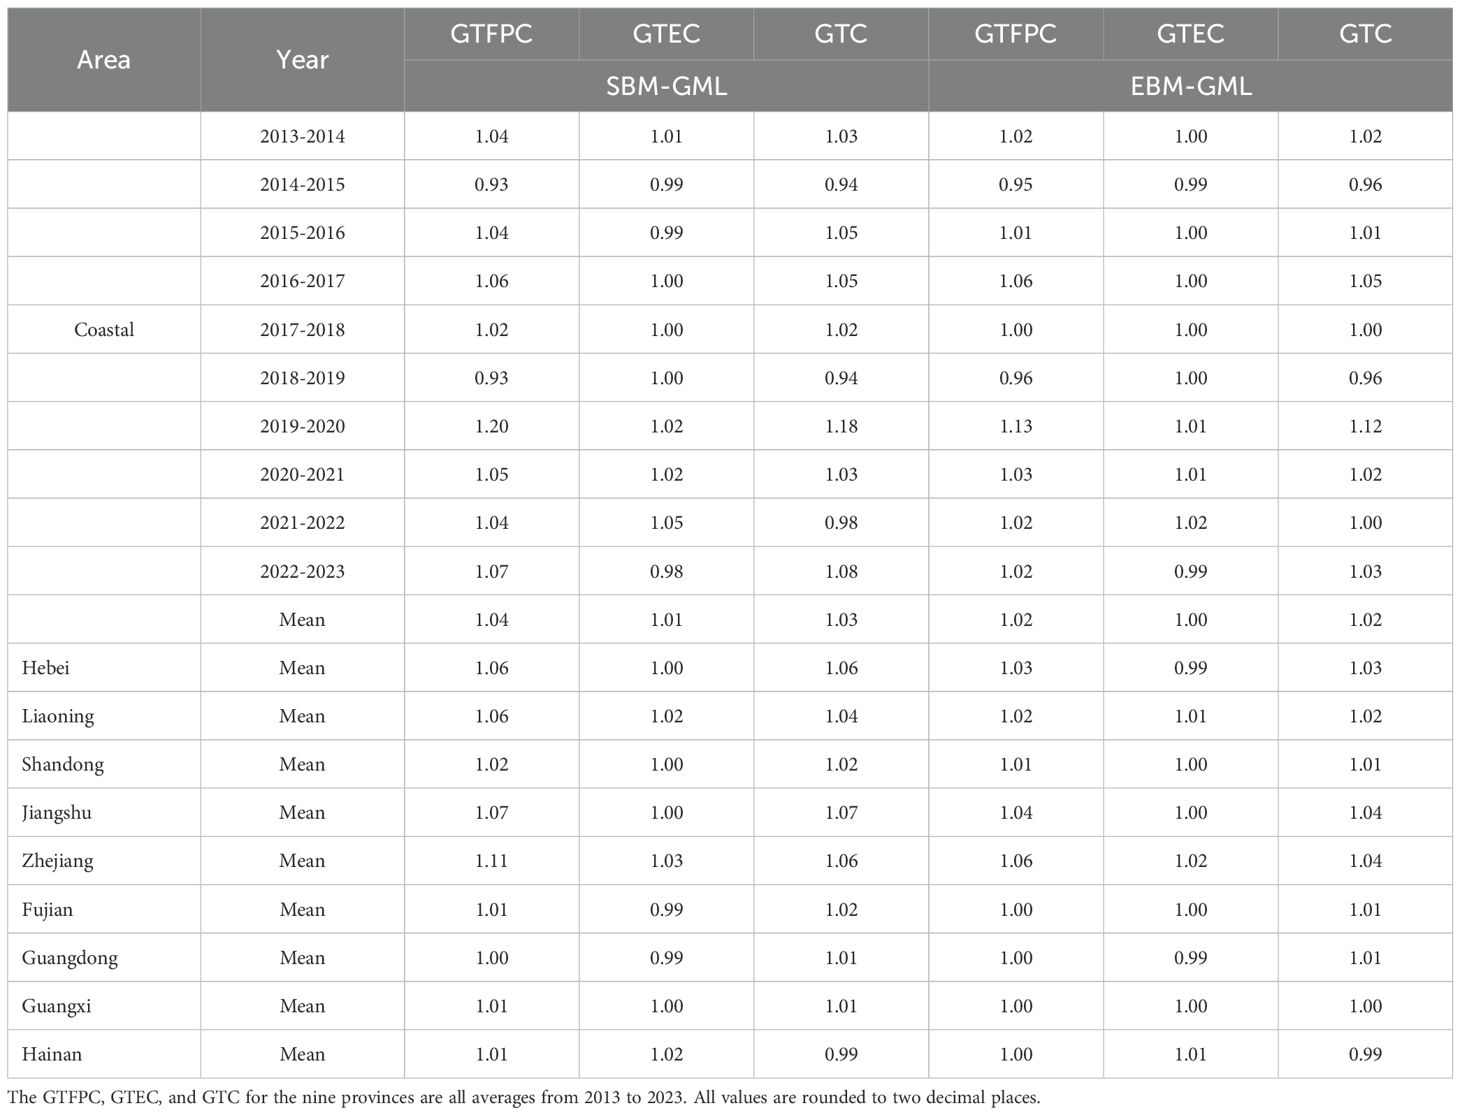
Table 3. Annual average month–on–month growth rate of green total factor productivity in the mariculture industry in China’s coastal areas.
5 Analysis of the spatiotemporal evolution of the green total factor productivity in the marine aquaculture industry
5.1 Analysis of overall differences
(1) From 2013 to 2023, the average value of the overall Gini coefficient of the green total factor productivity of China’s mariculture industry was 0.1 (Table 4), indicating that the problem of unbalanced regional development still exists. (2) The overall Gini coefficient of China’s GTFP shows an inverted “U”–shaped change trend. It rose to a peak of 0.152 in 2015 and dropped to a minimum of 0.049 in 2022. (3) The overall Gini coefficient from 2013 to 2019 was greater than 0.08, primarily attributable to the uneven development of green breeding technologies and asynchronous industrial restructuring. First, some provinces focused on the expansion of mariculture scale and had insufficient R&D investment in green aquaculture technology, still using the traditional extensive aquaculture mode. While other provinces actively introduced green aquaculture technologies and models such as recirculating aquaculture and ecological aquaculture, significantly improving the green total factor productivity of the mariculture industry. The differences in technology input and application led to the widening of the gap in the green total factor productivity of the mariculture industry among provinces, which in turn promoted the increase of the overall Gini coefficient. Second, some provinces adjusted and optimized the structure of the mariculture industry, shifting to the development of high–value–added and low–pollution aquaculture varieties. While other provinces still mainly engaged in the traditional aquaculture of fish, shrimp and shellfish. The asynchronous structural adjustment of industries intensified the regional differences in the green total factor productivity of the mariculture industry, leading to the increase of the overall Gini coefficient.
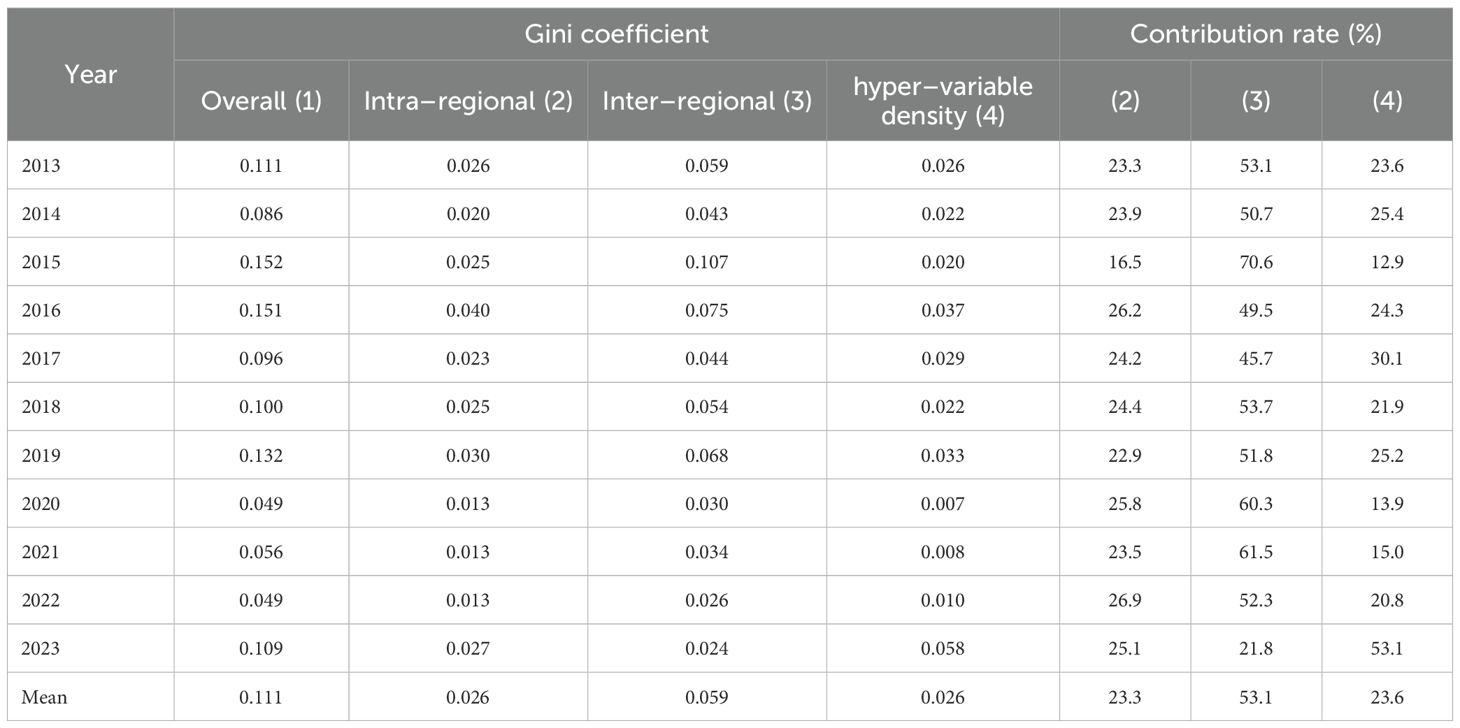
Table 4. Gini coefficient and contribution rate of green total factor productivity in China’s mariculture industry.
(4) The overall Gini coefficient from 2020 to 2022 remained below 0.06, benefiting from policy-driven collaborative governance and technology diffusion. First, the government strengthened marine environmental protection and introduced a series of environmental protection policies. All coastal provinces increased their efforts to control mariculture pollution and promoted green aquaculture technologies, driving the improvement of the overall green total factor productivity of the industry and causing the Gini coefficient to decline. Second, the advanced technologies and management experience of provinces with developed mariculture industries have been widely disseminated. Other provinces have gradually mastered new green aquaculture technologies and models through exchanges and learning, thereby improving their own green total factor productivity in the mariculture industry. The spillover effect of technology has effectively narrowed the technological gap between provinces, promoted the overall development of the industry towards equilibrium, and led to a decline in the overall Gini coefficient.
5.2 Analysis of intra–regional differences
(1) From 2013 to 2023, the differences in the average values of the internal Gini coefficients of GTFP among the three major sea areas were relatively obvious, showing the characteristic of “the Yellow Sea and Bohai Sea area having the highest value, followed by the East China Sea area, and the South China Sea area having the lowest value” (Table 5). (2) The reason for the largest gap in GTFP among Hebei, Liaoning, and Shandong provinces in the Yellow Sea and Bohai Sea area is the difference in resource endowments. Shandong and Liaoning provinces have long coastlines and excellent harbors, with a large–scale mariculture industry. Moreover, Shandong has relatively advanced facility aquaculture technology, which significantly improves GTFP. In contrast, Hebei has the smallest sea area, with limited mariculture space, making it difficult to expand the industrial scale. At the same time, Hebei mainly adopts traditional aquaculture models, resulting in slow technological upgrading and green transformation. (3) The reason for the large gap in GTFP among Fujian, Jiangsu, and Zhejiang provinces in the East China Sea area is the difference in industrial structures. (4) The reason for the smallest gap in GTFP among Guangdong, Guangxi, and Hainan provinces in the South China Sea area is the similar aquaculture methods, all mainly relying on cage and pond aquaculture. The mariculture industries in the three provinces are mainly composed of small and medium–sized enterprises, and there is no significant difference in the level of technology application. (5) The degrees of internal differences in GTFP in the three major sea areas are all fluctuating, and no obvious evolution pattern has been found. This is mainly affected by the degree of sea area pollution and natural climate conditions, which cause fluctuations in GTFP.
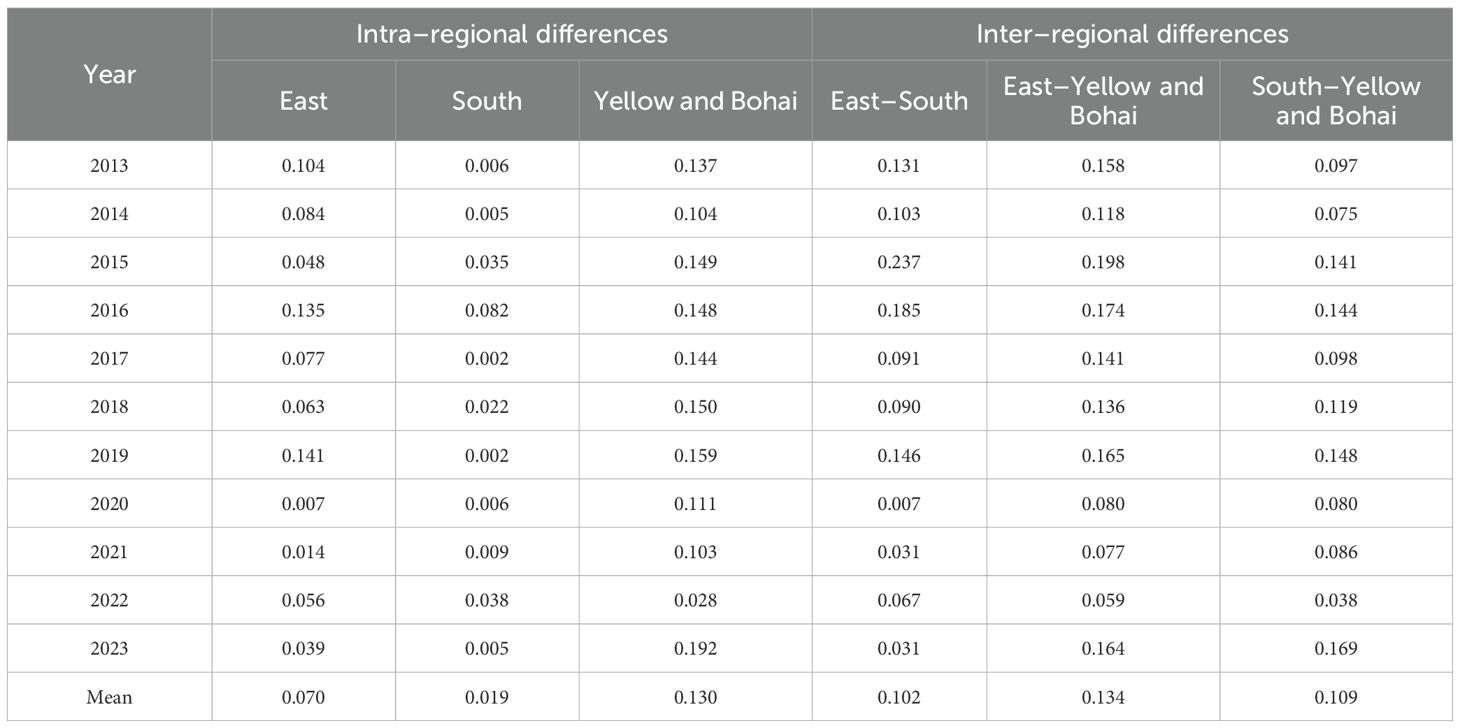
Table 5. Intra–regional and inter–regional Gini coefficients of the green total factor productivity of China’s seawater aquaculture industry.
5.3 Analysis of inter–regional differences
(1) From 2013 to 2023, there were differences in the average values of the inter–regional Gini coefficients of GTFP in the three major sea areas, showing the characteristics of “the largest difference between the East China Sea area and the Yellow Sea and Bohai Sea area, followed by the difference between the South China Sea area and the Yellow Sea and Bohai Sea area, and the smallest difference between the East China Sea area and the South China Sea area”. (2) The degree of inter–regional differences in GTFP in the three major sea areas did not show a narrowing trend, and the imbalance still existed. This may be caused by the differences in aquaculture varieties and sea area temperatures. In the Bohai Sea and Yellow Sea areas, the water temperature is relatively low, the degree of biodiversity is relatively low, and the self –purification ability of seawater is relatively poor. While in the South China Sea area, the degree of marine biodiversity is relatively high, and the self–purification ability of seawater is relatively strong. This is also the main reason for the high–level “stable” trend of the green total factor productivity of the seawater aquaculture industry in the South China Sea area mentioned above. (3) From 2013 to 2023, among the sources of regional differences in China’s GTFP, the inter–regional differences contributed the most.
6 Dynamic evolution analysis
6.1 Analysis of the state transition probability of GTFP using the traditional Markov chain
(1) For provinces with a low level of GTFP, the probability of remaining at a low level after one year is 62%, the probability of rising to a medium level is 13.8%, and the probability of rising to a high level is 24.1%. This indicates that the “self –locking” effect in the low–level group is significant, and it is difficult to break through the backward state (Table 6). (2) For provinces in the medium–level group of GTFP, the probability of remaining at a medium level after one year is 32.1%, the probability of dropping to a low level is 14.3%, and the probability of rising to a high level is 53.6%. This shows that the medium–level group has strong upward mobility and can easily break through to a high level. (3) For provinces in the high–level group of GTFP, the probability of remaining at a high level after one year is 45.5%, the probability of dropping to a low level is 15.2%, and the probability of dropping to a medium level is 39.4%. This indicates that the high–level group has a relatively high probability of maintaining its leading position, but the risk of transitioning to the medium–level group cannot be ignored. (4) Based on the above analysis, there exists strong “path dependence” within both the high-level and low-level clusters. Provinces in the low-level cluster struggle to escape their backward status, while those in the high-level cluster can easily maintain their leading positions, albeit with the risk of decline, indicating a trend of polarization. This may be because provinces with a low level have a weak economic foundation and insufficient awareness of ecological environment protection, leading to the dependence of mariculture production on resource consumption, which restricts the growth of GTFP. Provinces in the medium–level group have the potential to leap to a high level, thanks to policy adjustments and technological upgrades.
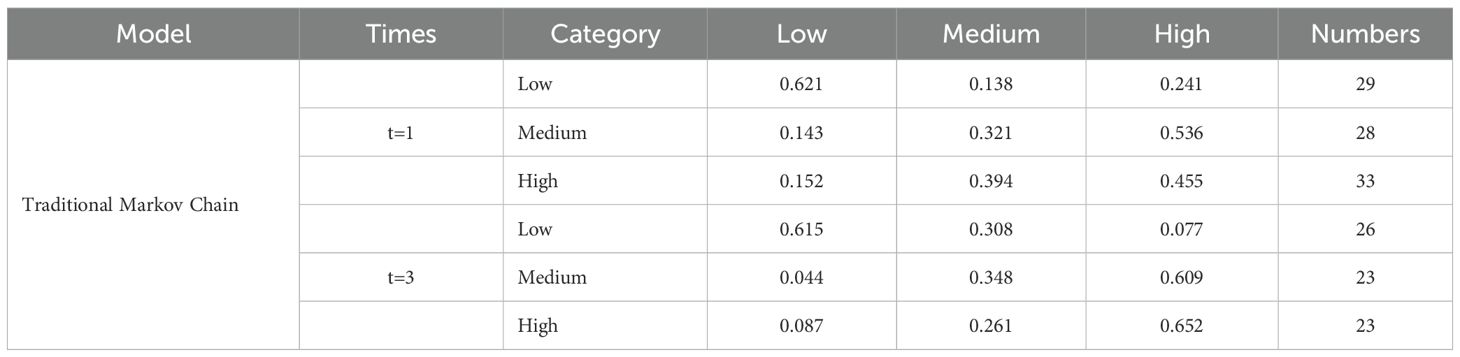
Table 6. Traditional Markov chain transition probability matrix.
(1) Compared with a one–year time span, when the time span is three years, the probability of the low–level group transitioning to the medium–level groups increases. This shows that although the low–level group has difficulty breaking through the backward state of GTFP in the short term, there is a possibility of breakthrough in the long run. The reason is the lag effect of policies. The implementation of ecological protection policies or the promotion of green aquaculture technologies takes a longer time to take effect. (2) The probability of the medium–level group transitioning to the high–level group after three years increases. This indicates that over a longer period, the medium–level group further consolidates its advantage in transitioning to the high–level through continuous policies and technological upgrades. (3) The probability of the high–level group remaining in its original category also increases. This shows that as the time span extends, high–level provinces consolidate their leading positions through technological barriers and economies of scale. (4) There is a strong path dependence in the GTFP state transition in the short term, and it is difficult for provinces of each type to achieve breakthroughs. However, in the long–term trend, the probability of each province’s GTFP rising to a high level significantly increases.
6.2 Analysis of the state transition probability of GTFP using the spatial Markov chain
After considering spatial factors, the probability of GTFP state transition has changed (Table 7). (1) When neighboring provinces are at a low level, the probabilities of upward transition for provinces in the low–level group and the low–middle–level group are 33.3% and 42.9% respectively. When neighboring provinces are at a medium level, the probabilities of upward transition for provinces in the low–level group and the medium–level group are 50% and 60% respectively. When neighboring provinces are at a high level, the probabilities of upward transition for provinces in the low–level group and the medium–level group are 37.5% and 66.7% respectively. This indicates that the probability of a province shifting to a higher level is positively correlated with the green total factor productivity of its neighboring provinces, demonstrating a significant spatial spillover effect. (2) When neighboring provinces are at a low level, the probability of high–level group provinces maintaining their original type is 35.7%. When neighboring provinces are at a medium level, the probability of high–level group provinces maintaining their original type is 66.7%. When neighboring provinces are at a high level, the probability of high–level group provinces maintaining their original type is 40%. A possible reason is that provinces with a high GTFP level may face competition in terms of policies or resources, leading to type transitions in some provinces.
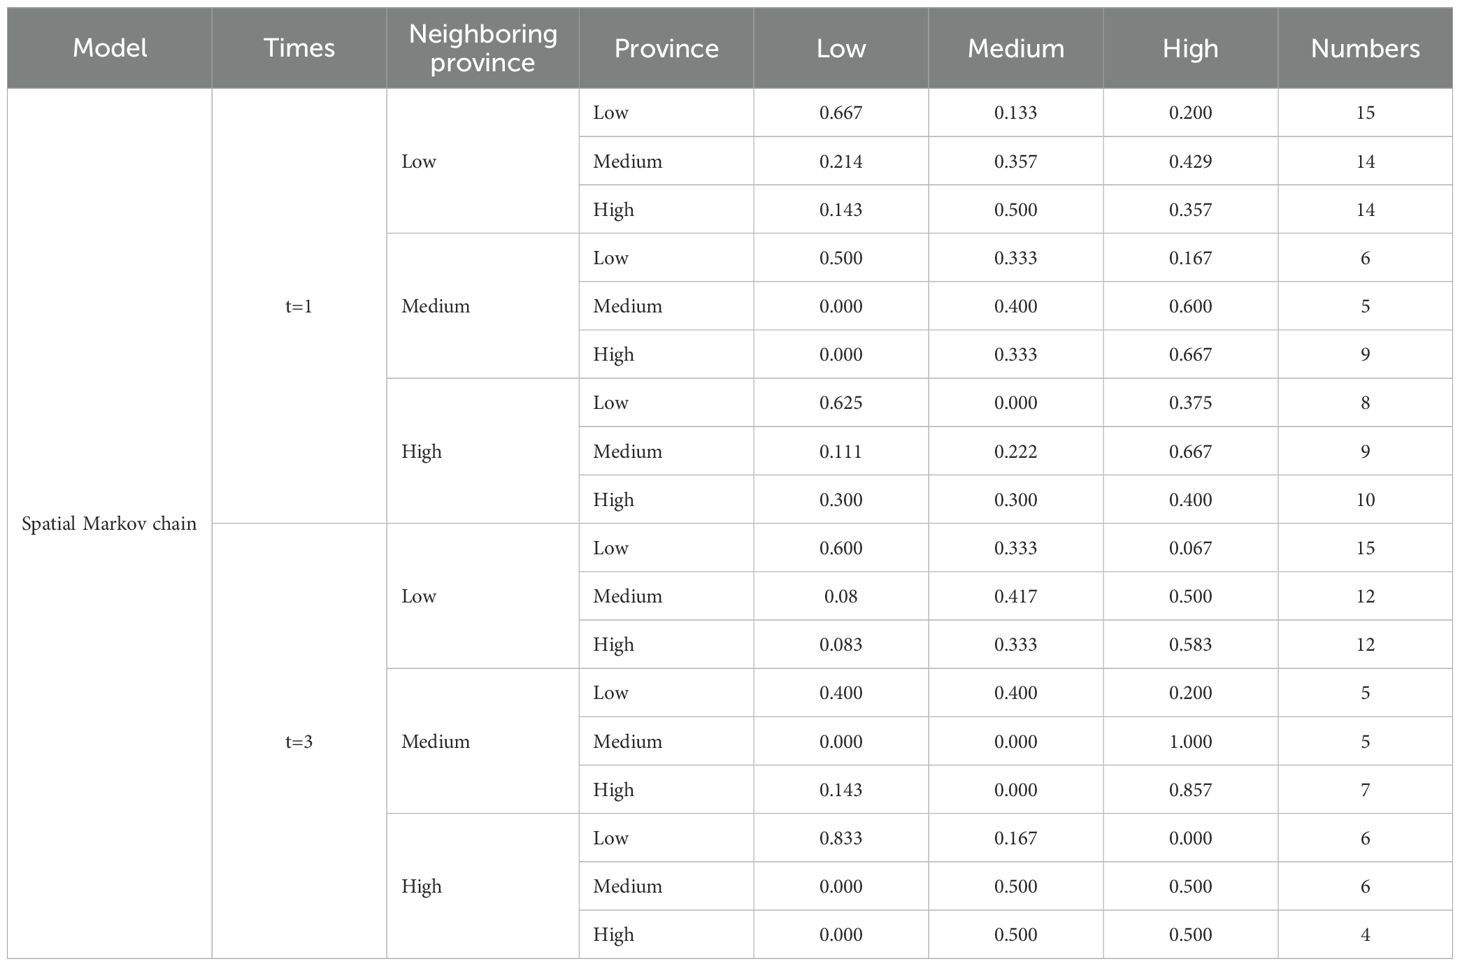
Table 7. Probability of the state transition matrix of the spatial Markov chain.
(1) Compared with a one–year time span, when the time span is three years, when neighboring provinces are at a low level, the probabilities of upward transition for provinces in the low–level group and the low–middle– level group are 40% and 50% respectively. When neighboring provinces are at a medium level, the probabilities of upward transition for provinces in the low–level group and the medium–level group after three years are 60% and 100% respectively. When neighboring provinces are at a high level, the probabilities of upward transition for provinces in the low–level group and the medium–level group after three years are 16.7% and 50% respectively. This indicates that, in the long run, the driving effect from neighboring provinces with a medium levelof development is the strongest. Conversely, proximity to high-level provinces may produce a double-edged sword effect: while it can bring advanced technology and management experience, it may also lead to the outflow of local resources (such as talent and capital), thereby constraining the province’s own development. (2) When the neighboring provinces are at a low level, the probability of high–level group provinces maintaining their original type is 58.3%; when the neighboring provinces are at a medium level, the probability is 85.7%; when the neighboring provinces are at a high level, the probability is 50%. The stability of high–level group provinces shows an inverted “U–shaped” relationship with the GTFP level of neighboring provinces. In summary, the neighboring relationship with a moderate gradient difference in GTFP levels is more sustainable, and the key lies in balancing the spillover effect and the competition effect.
7 Conclusions and suggestions
7.1 Conclusions
1. From 2013 to 2023, the average GTFP of China’s coastal mariculture industry was 0.93, indicating that growth over the past decade primarily relied on resource inputs and environmental costs. After 2020, GTFP began to show sustained improvement, suggesting initial signs of green transformation in the mariculture sector, with the industry gradually shifting from scale expansion to quality enhancement and ecological sustainability. The growth of GTFP was jointly driven by both green technical change and green technical efficiency change; however, the contribution of technical change exceeded that of efficiency change gains.
2. There are significant provincial disparities in the GTFP of the mariculture industry. The average GTFP values of Liaoning, Hainan, Guangxi, Guangdong, and Shandong exceed 1; the averages for Fujian, Zhejiang, and Jiangsu range between 0.8 and 1.0; while Hebei has the lowest average of 0.6. Among the three major sea areas, the intra-regional disparity in GTFP is highest in the Yellow Sea and Bohai Sea area. In terms of inter-regional comparisons, the disparity between the East China Sea area and the Yellow Sea and Bohai Sea area is the greatest. Inter-regional differences are identified as the primary source of the overall disparity.
3. In the short term, low-GTFP provinces face challenges in overcoming their backward status, while high-level provinces, though more likely to maintain their lead, still face risks of decline, indicating a trend of polarization. In the long run, the probability of low-level and medium-level provinces transitioning to higher levels increases significantly. The likelihood of a province moving upward is positively correlated with the GTFP levels of neighboring provinces. The catalytic effect from adjacent medium-level provinces is the strongest, while proximity to high-level provinces may produce a “double-edged sword” effect. Maintaining a moderate gradient difference between adjacent provinces proves to be the most sustainable development pattern.
7.2 Suggestions
1. The government should establish a special fund for green mariculture technology R&D, focusing on key technologies such as Recirculating Aquaculture Systems, improved breed cultivation, ecological disease prevention and control, and waste resource utilization. Concurrently, efforts should be accelerated to popularize digital technologies, including the Internet of Things, big data, and artificial intelligence, throughout the entire breeding process to enhance production efficiency and management levels. Furthermore, technical training should be provided to farmers on using modern breeding facilities, such as intelligent feeding systems and water quality monitors, to lower the usage threshold and risks.
2. Policy should encourage the diffusion of green breeding technologies and management experience from high-GTFP provinces. Mid-level GTFP provinces should play a pivotal “bridge” role, receiving advanced technologies and facilitating their diffusion to low-level provinces. For provinces with relatively low GTFP, targeted assistance is crucial. This includes helping them adjust breeding species structures, organizing expert technical guidance, and providing financial support such as credit discount interests, tax reductions, and insurance premium subsidies.
3. The government should formulate and improve a long-term plan for the green development of the mariculture industry, clarifying the transition goals and pathways for different sea areas and provinces. Supervision of traditional breeding modes characterized by high pollution and high energy consumption must be strengthened. Additionally, a differentiated performance evaluation system should be implemented, shifting the focus from solely measuring mariculture output to a comprehensive assessment that includes resource consumption, environmental pollution, and the performance of GTFP.
Data availability statement
The raw data supporting the conclusions of this article will be made available by the authors, without undue reservation.
Ethics statement
Ethical review and approval were not required for the study on human participants in accordance with the local legislation and institutional requirements. Written informed consent from the [patients/participants OR patients/participants legal guardian/next of kin] was not required to participate in this study in accordance with the national legislation and the institutional requirements.
Author contributions
SZ: Writing – original draft, Funding acquisition, Conceptualization. YY: Data curation, Writing – review & editing, Writing – original draft. SL: Resources, Writing – original draft, Supervision.
Funding
The author(s) declare financial support was received for the research and/or publication of this article. This study was supported by the National Social Science Fund of China (No. 22BGL184).
Acknowledgments
We would like to express our gratitude to the Fujian Province Marine Economy Green Development Innovation Team (Fujian Provincial Department of Education, Science and Technology and Informationization Division [2023] No. 15) for supporting our research.
Conflict of interest
The authors declare that the research was conducted in the absence of any commercial or financial relationships that could be construed as a potential conflict of interest.
Generative AI statement
The author(s) declare that no Generative AI was used in the creation of this manuscript.
Any alternative text (alt text) provided alongside figures in this article has been generated by Frontiers with the support of artificial intelligence and reasonable efforts have been made to ensure accuracy, including review by the authors wherever possible. If you identify any issues, please contact us.
Publisher’s note
All claims expressed in this article are solely those of the authors and do not necessarily represent those of their affiliated organizations, or those of the publisher, the editors and the reviewers. Any product that may be evaluated in this article, or claim that may be made by its manufacturer, is not guaranteed or endorsed by the publisher.
Supplementary material
The Supplementary Material for this article can be found online at: https://www.frontiersin.org/articles/10.3389/fmars.2025.1714186/full#supplementary-material
References
Asche F., Guttormsen G. A., and Nielsen R. (2013). Future challenges for the maturing Norwegian salmon aquaculture industry: An analysis of total factor productivity change from 1996 to 2008. Aquaculture 396-399, 43–50. doi: 10.1016/j.aquaculture.2013.02.015
Cao L. and Zhang C. (2021). Evaluation and convergence analysis of total factor productivity of marine fisheries under carbon emission constraints—A case study of coastal areas. Mar. Economy 11, 27–35. doi: 10.19426/j.cnki.cn12-1424/p.2021.04.002
Elsadig M. A. (2012). Green TFP intensity impact on sustainable East Asian productivity growth. Economic Anal. Policy 42, 67–78. doi: 10.1016/S0313-5926(12)50005-6
FAO (2024). “The state of world fisheries and aquaculture 2024,” in Blue Transformation In Action (FAO, Rome, Italy).
Fu Y. F., Wang A. Y., Chen F., and Gu B. J. (2023). Measurement and convergence analysis of green total factor productivity in China’s marine fisheries. Chin. Fisheries Econ 41, 34–42. doi: 10.3969/j.issn.1009-590X.2023.04.005
Guo W., Dong S. S., Qian J. R., and Lyu K. Y. (2022). Measuring the green total factor productivity in chinese aquaculture: A zofio index decomposition. Fishes 7, 269–269. doi: 10.3390/FISHES7050269
Hu X. R. and He Z. C. (2024). Research on fishery efficiency in guangdong province based on DEA and malmquist index. Guangdong Agric. Sci. 51, 163–172. doi: 10.16768/j.issn.1004-874X.2024.02.015
Ji J. Y. and Zeng Q. A. (2017). Study on the total factor productivity of China’s mariculture considered undesirable outputs based on global malmquist-luenberger index. J. Ocean Univ. China (Social Sci. Edition) 01), 43–48. doi: 10.3969/j.issn.1672-335X.2017.01.008
Jiang Q. J., Liu C. X., and Qiu K. C. (2021). Analysis of factor input, returns to scale and technical efficiency of China’s fisheries. J. Fisheries China 45, 785–797. doi: 10.11964/jfc.20200712331
Kumar S. (2006). Environmentally sensitive productivity growth: A global analysis using Malmquist-Luenberger index. Ecol. Econ 56, 280–293. doi: 10.1016/j.ecolecon.2005.02.004
Li X., Liu Z. F., Zhao M. J., Xu L. J., and Sun H. W. (2022). Carbon peak and carbon neutralization goals and realization paths of the aquaculture and fishing industry in China. J. Agric. Sci. Technol. 24, 13–26. doi: 10.13304/j.nykjdb.2022.0087
Liu P. C. and Yang Z. Y. (2017). Research on China’s fishery transformation and development from the perspective of total factor productivity——An empirical analysis based on SFA. Mar. Dev. Manage. 34, 98–106. doi: 10.20016/j.cnki.hykfygl.2017.07.017
Ministry of Agriculture and Rural Affairs of the People’s Republic of China (MARA) (2025). China Fisheries Economic Statistical Bulletin 2024. Available online at: https://yyj.moa.gov.cn/gzdt/202507/t20250707_6475475.htm (Accessed October 24, 2025).
Ministry of Ecology and Environment and the Ministry of Agriculture and Rural Affairs ofthe People’s Republic of China (2022). Opinions on Strengthening the Ecological Environment Supervision of Mariculture. Available online at: https://www.mee.gov.cn/xxgk2018/xxgk/xxgk03/202201/t20220112_966759.html (Accessed October 24, 2025).
Ministry of Ecology and Environment of the People’s Republic of China (MEE) (2021). Manual of Accounting Methods and Coefficients for Agricultural Pollution Sources. Available online at: https://www.mee.gov.cn/xxgk2018/xxgk/xxgk01/202106/t20210618_839512.html (Accessed October 24, 2025).
Oh D. H. (2010). A global Malmquist-Luenberger productivity index. J. Productivity Anal. 34, 183–197. doi: 10.1007/s11123-010-0178-y
Qiu R. S., Han L. M., Xu J., and Yin W. (2022). Impact of environmental regulations on the green transition of China’s mariculture industry:Empirical test based on a dynamic panel model. Resour. Sci. 44, 1615–1629. doi: 10.18402/resci.2022.08.07
Shao G. L., Kong H. Z., and Li C. (2019a). Net amount of mariculture carbon sink and its coupling relationship with economics growth of China. Resour. Sci. 41, 277–288. doi: 10.18402/resci.2019.02.07
Shao G. L., Liu B., and Li C. (2019b). Evaluation of carbon dioxide capacity and the effects of decomposition and spatio-temporal differentiation of seawater in China’s main sea area based on panel data from 9 coastal provinces in China. Acta Ecologica Sin. 39, 2614–2625. doi: 10.5846/stxb201801080049
Shen W. T., Ge H. R., and Bao J. Y. (2023). Green total factor productivity growth and its driving forces in China’s fisheries sector. Front. Sustain. Food Syst. 7. doi: 10.3389/FSUFS.2023.1281366
Tone K. A. (2001). slacks-based measure of efficiency in data envelopment analysis. Eur. J. Operational Res. 130, 498–509. doi: 10.1016/S0377-2217(99)00407-5
Wang W., Mao W., Zhu J. Z., Wu R. H., and Yang Z. B. (2023). Research on efficiency of marine green aquaculture in China: regional disparity, driving factors, and dynamic evolution. Fishes 9(1), 1–25. doi: 10.3390/FISHES9010011
Xiang A., Chuai X. W., and Li J. S. (2022). Assessment of the status and capacity of blue carbon in China’s coastal provinces. Resour. Sci. 44, 1138–1154. doi: 10.18402/resci.2022.06.04
Xu Y., Ji J. Y., and Zhou J. L. (2022). Study on the impact of intertidal mudflat culture on the growth of green total factor productivity of mariculture. Sci. Technol. Manage. Res. 42, 193–198. doi: 10.3969/j.issn.1000-7695.2022.1.026
Xu D. L. and Wang Y. J. (2015). Regional differences and influencing factors of China’s coastal fishery carbon productivity. J. China Agric. Univ. 20, 284–290. doi: 10.11841/j.issn.1007-4333.2015.02.36
Xu J. J., Zhang J., and She C. H. (2020). Evaluation of spatial spillover effect of green development of marine carbon-sink fisheries. China Population,Resources Environ. 30, 99–110. doi: 10.12062/cpre.20191016
Yang Z. Y., Liu Y. Q., and Peng L. W. (2024). Impact of aquatic product trade on green total factor productivity of fisheries in ASEAN. J. Shanghai Ocean Univ. 33, 275–284. doi: 10.12024/jsou.20230104066
Zhang Y. and Ji J. Y. (2022). Decomposition and influencing factors of green total factor productivity of mariculture industry in China. Res. Sci. Technol. Manage. 42, 206–213. doi: 10.3969/j.issn.1000-7695.2022.3.025
Zhang Y., Li F. M., and Fang H. X. (2023). Efficiency analysis of China deep-sea cage aquaculture based on the SBM–malmquist model. Fishes 8, 529. doi: 10.3390/FISHES8100529
Keywords: mariculture, green total factor productivity, super slack-based measure, global Malmquist–Luenberger, China
Citation: Zheng S, Yan Y and Lee SY (2025) Measurement and spatiotemporal evolution analysis of green total factor productivity in China’s mariculture industry. Front. Mar. Sci. 12:1714186. doi: 10.3389/fmars.2025.1714186
Received: 27 September 2025; Accepted: 03 November 2025;
Published: 20 November 2025.
Edited by:
Yang Liu, Ocean University of China, ChinaReviewed by:
Shen Weiteng, Zhejiang Wanli University, ChinaWei Guo, Chinese Academy of Agricultural Sciences, China
Copyright © 2025 Zheng, Yan and Lee. This is an open-access article distributed under the terms of the Creative Commons Attribution License (CC BY). The use, distribution or reproduction in other forums is permitted, provided the original author(s) and the copyright owner(s) are credited and that the original publication in this journal is cited, in accordance with accepted academic practice. No use, distribution or reproduction is permitted which does not comply with these terms.
*Correspondence: Sining Zheng, c2VyZW5lbWFuQDEyNi5jb20=; c2luaW5nemhlbmdAMTYzLmNvbQ==
†These authors have contributed equally to this work and share first authorship