 Jiajia Cui†
 Huaixia Hu
- Department of Rheumatology and Immunology, East Hospital of the Second People's Hospital of Lianyungang City, Lianyungang, China
Objective: To identify novel immune-related genes expressed in primary Sjögren's syndrome (pSS).
Methods: Gene expression profiles were obtained from the Gene Expression Omnibus (GEO) database, and differentially expressed genes (DEGs) were screened. The differences in immune cell proportion between normal and diseased tissues were compared, weighted gene co-expression network analysis was conducted to identify key modules, followed by a protein–protein interaction (PPI) network generation and enrichment analysis. The feature genes were screened and verified using the GEO datasets and quantitative real-time PCR (RT-qPCR).
Results: A total of 345 DEGs were identified, and the proportions of gamma delta T cells, memory B cells, regulatory T cells (Tregs), and activated dendritic cells differed significantly between the control and pSS groups. The turquoise module indicated the highest correlation with pSS, and 252 key genes were identified. The PPI network of key genes showed that RPL9, RBX1, and RPL31 had a relatively higher degree. In addition, the key genes were mainly enriched in coronavirus disease-COVID-2019, hepatitis C, and influenza A. Fourteen feature genes were obtained using the support vector machine model, and two subtypes were identified. The genes in the two subtypes were mainly enriched in the JAK-STAT, p53, and toll-like receptor signaling pathways. The majority of the feature genes were upregulated in the pSS group, verified using the GEO datasets and RT-qPCR analysis.
Conclusions: Memory B cells, gamma delta T cells, Tregs, activated dendritic cells, RPL9, RBX1, RPL31, and the feature genes possible play vital roles in the development of pSS.
Highlights
- The proportions of four immune cells were significantly different between the control and pSS groups.
- RPL9, RBX1, and RPL31 had relatively higher degrees in the PPI network of key genes.
- Fourteen feature genes were obtained that were verified using GEO datasets and RT-qPCR.
Introduction
Primary Sjögren's syndrome (pSS) is an autoimmune disease characterized by focal lymphocytic infiltration of the exocrine glands causing dry eyes and dry mouth (1). Although dryness is the main symptom, some pSS patients also experience systemic manifestations (2, 3). pSS can affect 0.1–0.6% of the general adult population, with a female-to-male predominance of 9:1, and the average age at diagnosis being approximately 50 years (4–6). The underlying causes and pathogenesis of pSS are not clear, making its effective treatment an enduring clinical challenge.
Several factors are expected to determine the occurrence of pSS: genetic predisposition, infection, and endocrine factors can work together to abnormally activate innate or adaptive immunity, resulting in the production of cytokines and antibodies, and lymphocyte infiltration (7, 8). Several studies have elucidated the genetics of pSS. Lin et al. found that the expression of several pSS-associated candidate genes, including CXCL9, CXCL13, and PTPRC, was upregulated (9). Inamo et al. identified differential expression levels of SOX4 between patients with pSS and healthy controls (10). Zhang et al. indicated that the expression of some pSS-associated genes, for example TAP2, IFI16, and HLA-DRA, was upregulated (11). Vitali et al. found that IFNG, TRIM26, and EDN1 were overexpressed in pSS patients (12). Although studies have linked pSS to the immune system response in vivo (13, 14), there is a lack of novel immune-related genes to study the underlying causes and inform treatment.
Using weighted gene co-expression network analysis (WGCNA), Yao et al. identified key genes and pathways in SS (15). Lei and Zhang identified key genes and pathways involved in B cells in patients with pSS (16). However, these studies used fewer datasets with a small sample-size and conducted no experimental validation. Therefore, in the present study, we aimed to identify novel immune-related genes in pSS using several bioinformatic approaches to ultimately inform the research and development of pSS therapies. The workflow of this study is illustrated in Figure 1. First, differentially expressed genes (DEGs) were screened based on the gene expression profiles obtained from the Gene Expression Omnibus (GEO) database. The differences in immune cell proportions were compared between normal and diseased tissues, and WGCNA was conducted to identify the key modules. The key genes were identified, followed by a protein–protein interaction (PPI) network generation and enrichment analysis. Finally, the feature genes were screened by a recursive feature elimination algorithm and verified using the GEO datasets and quantitative real-time PCR (RT-qPCR).
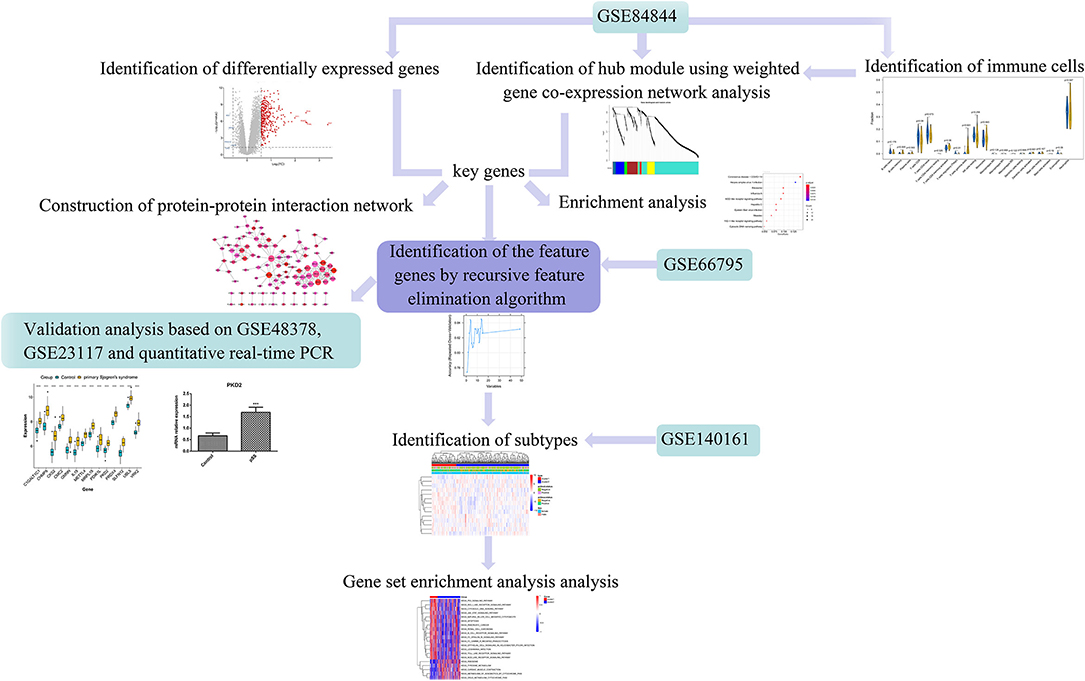
Figure 1. Workflow of this study. Differentially expressed genes (DEGs) were screened based on the gene expression profiles obtained from the Gene Expression Omnibus (GEO) database. The differences in respective immune cell proportions between control and diseased tissues were compared. Weighted gene co-expression network analysis (WGCNA) was performed to identify the key modules, followed by a protein-protein interaction (PPI) network generation and enrichment analysis. The feature genes were screened using the recursive feature elimination algorithm and verified using the GEO datasets and quantitative real-time PCR (RT-qPCR).
Materials and Methods
Microarray Data
The gene expression profiles of the datasets GSE84844, GSE66795, GSE140161, GSE48378, and GSE23117 were acquired from the GEO database. GSE84844 included data for whole blood samples from 30 patients with pSS and 30 healthy volunteers and was analyzed using the GPL570 [HG-U133_Plus_2] Affymetrix Human Genome U133 Plus 2.0 Array. GSE66795 contained data for 131 whole blood samples from patients with fully phenotyped pSS and 29 healthy controls and was analyzed using the GPL10558 Illumina HumanHT-12 v4.0 expression beadchip. GSE140161 contained data for 351 whole blood samples from 30 patients with pSS and was analyzed using the GPL23159 platform [Clariom_S_Human] Affymetrix Clariom S Assay, human (includes Pico Assay). GSE48378 contained data for peripheral blood mononuclear cells from 11 patients with pSS and 16 healthy controls and was analyzed using the GPL5175 [HuEx-1_0-st] Affymetrix Human Exon 1.0 ST Array [transcript (gene) version] platform. GSE23117 contained data for minor salivary gland samples from 10 patients with SS and 5 controls and was analyzed using the GPL570 [HG-U133_Plus_2] Affymetrix Human Genome U133 Plus 2.0 Array.
Data Preprocessing and Identification of DEGs
The preprocessed and standardized probe expression value matrices of the four datasets were downloaded from the GEO database. The probes were annotated based on the annotation files. The probes that did not match any gene symbols were removed. When multiple probes matched one gene symbol, the mean value was selected as the expression value. Based on the GSE84844 dataset, the DEGs between the pSS patients and healthy controls were screened using the classical Bayesian method of the R “limma” package (17) (https://cran.r-project.org). The Benjamini–Hochberg method was used to correct the P-value. The threshold values of the DEGs were set as adjusted P-value < 0.05 and |logFC| > 0.585.
Immune Infiltration Estimation
Based on the expression profile of the GSE84844 dataset, we used the CIBERSORT algorithm (18) with the parameters perm = 100 and QN = F to estimate the relative proportions of 22 immune cells. The proportions of the respective immune cells were then compared between the normal and diseased samples. The EPIC online tool (https://gfellerlab.shinyapps.io/EPIC_1-1/) was also utilized to evaluate the proportions of immune cells.
WGCNA
We identified the modules related to pSS using the WGCNA package (19) in R. The procedures for network construction and module identification consisted of estimating the gene co-expression correlation matrix, defining the adjacent function, determining the phase difference between nodes, and identifying correlation among network module, disease, and relative abundance of different immune cells. Then, the phenotype–immune cell related modules were obtained.
Construction of the PPI Network
The key genes were identified as those overlapping when intersecting the DEGs with the genes in the phenotype–immune cell-related modules. The PPIs of the key genes were screened using the STRING database (20), with the species as “human” and a PPI score of 0.9. Using Cytoscape (21), the PPI network was constructed, and the nodes with high degrees were considered as hub genes. Moreover, to elucidate the functional role of the key genes in pSS, enrichment analysis was performed using a clusterProfiler tool (22) with a threshold P-value < 0.05 and number of enriched genes ≥2.
Identification of Feature Genes
A random forest model was established based on the key genes, and the top 50 genes were obtained. Based on the GSE66795 dataset, the recursive feature elimination algorithm of the caret package (23) in R and the repeated CV sampling method were used to identify the feature genes. Based on the feature genes, a support vector machine (SVM) (23) model was constructed using the GSE66795 dataset with the default parameters. A receiver operating characteristic (ROC) curve was used to evaluate the accuracy of the model by the area under the curve (AUC) estimate.
Identification of Subtypes Based on the GSE140161 Dataset
Based on the centered Pearson correlation algorithm, the pheatmap package in R was used to perform bidirectional hierarchical clustering, and an unsupervised cluster analysis was conducted on the obtained feature genes based on the GSE140161 dataset to identify the subtypes. A heatmap of the clinical characteristics of the subtypes was computed. The gene set file c2.cp.kegg.v7.2.symbols.gmt from the Molecular Signatures Database v7.2 was used as an enrichment background, the GSVA algorithm (24) in R was employed to perform the enrichment analysis, with the threshold set according to the adjusted P-value < 0.05, and the Benjamini-Hochberg method was used to correct the P-value.
Validation Analysis
To verify the identified feature genes, their expression levels in the GSE48378, GSE23117, and GSE140161 datasets were used as feature values, and the SVM model was constructed with the default parameters. To evaluate the accuracy of the model, the ROC curve was constructed. The expression level of the 14 feature genes was evaluated in the GSE48378 dataset. Additionally, we performed RT-qPCR to verify the expression levels of these feature genes. A total of 20 whole blood samples from 10 pSS patients and 10 healthy controls were obtained from the Lianyungang Second People's Hospital. The study group was determined by the following criteria: (a) patients who met the diagnostic criteria for the 2002 international classification of SS were included; (b) patients receiving moderate to high doses of corticosteroids, immunosuppressants, or biologics were excluded. The control group consisted of healthy individuals showing no symptoms for SS or other autoimmune-related diseases, with no family history of the disease, and were not currently receiving any medication. This study was approved by the ethics committee of the Lianyungang Second People's Hospital (approval number: 2021K005). Written consent was provided by all of the participants in this study. RT-qPCR was performed as described previously (25). All experiments were performed in triplicate. GAPDH was used as an internal control. A t-test was used for comparisons of means between the groups. The primers used in this study are listed in Table 1.
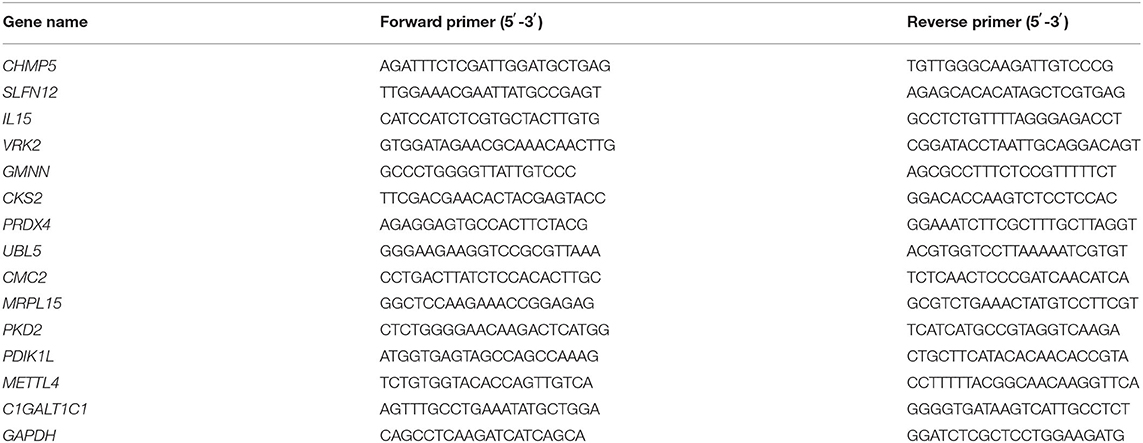
Table 1. Primers used in this study.
Results
Identification of DEGs and Immune Infiltration Estimation
A total of 345 DEGs were obtained between the samples from patients with pSS and the healthy controls (Figures 2A,B; Supplementary File 1). Because follicular helper T cells and activated NK cells were not observed, the relative abundance of 20 immune cells was obtained for each sample. According to the CIBERSORT algorithm, the abundance distribution of memory B cells, regulatory T cells (Tregs), gamma delta T cells, and activated dendritic cells differed significantly between the control and pSS groups (P < 0.05; Figure 2C). According to the EPIC tool analysis results (Figure 2D), the abundance distributions for B cells, cancer associated fibroblasts, T cells, and endothelial cells differed significantly between the control and pSS groups (P < 0.05).
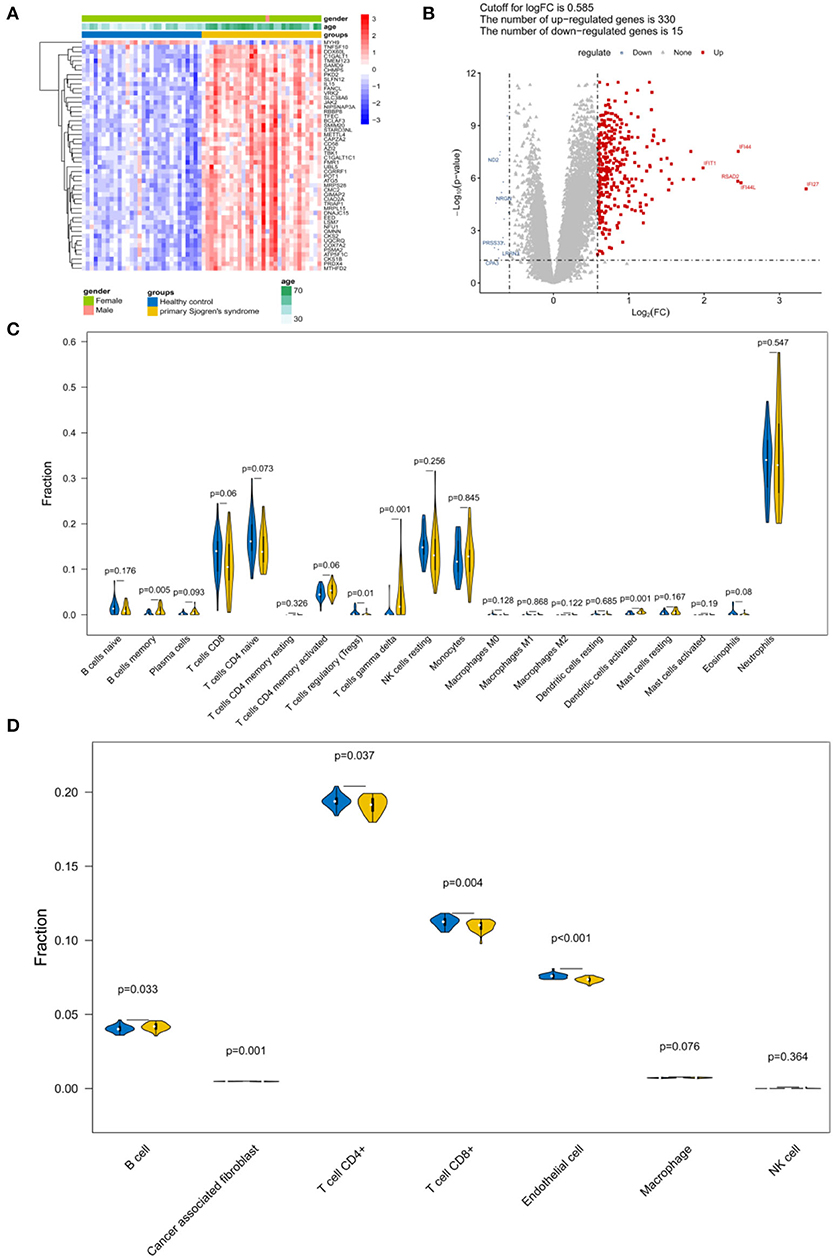
Figure 2. Identification of differentially expressed genes (DEGs) and immune infiltration estimation. (A) Heatmap and (B) volcano plot of the DEGs. (C) Violin plot depicting the abundance distribution of 20 immune infiltrating cell types identified using the CIBERSORT algorithm. (D) Violin plot of the abundance distribution of seven types of immune cells identified using the EPIC tool. The blue strip represents the normal control group and the yellow strip represents the primary Sjögren's syndrome (pSS) group.
WGCNA and Module Identification of pSS
The adjacency matrix weighting parameter power was analyzed to meet the prerequisite of a scale-free network distribution. The power of β = 6, where the square of the correlation coefficient between log2k and log2p(k) = 0.9, was selected as the soft thresholding parameter (Figure 3A). To obtain a system clustering tree of the DEGs, combined with the dissimilarity matrix, hierarchical clustering was conducted. A total of six modules were screened, with the least number of genes set as 30 and the pruning height set as cutHeight = 0.3 (Figure 3B). Among the six modules, the turquoise and yellow modules had the highest association with pSS (Figure 3C). The gene significance was calculated to identify the modules that were highly correlated with pSS, and the results showed that the turquoise module had the highest correlation with pSS (Figure 3D). Thus, the turquoise module was selected for further analysis.
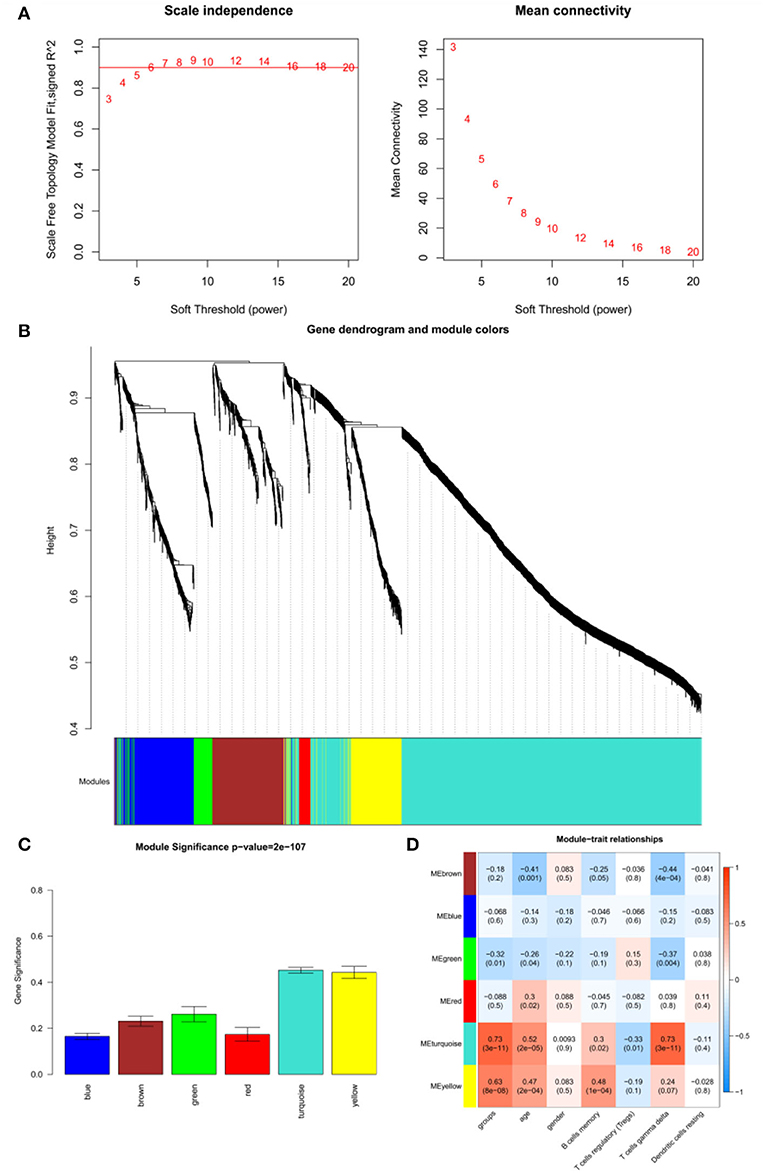
Figure 3. Results of weighted gene co-expression network analysis (WGCNA). (A) Determination of the soft threshold for adjacency matrix. The horizontal axis represents the soft threshold power, and the vertical axis represents the square of the correlation coefficient of log2k and log2p(k). The red line indicates the location when the correlation coefficient is 0.9, and the corresponding soft threshold power is 6. (B) Gene dendrogram derived from hierarchical clustering. The different modules are indicated by colors underneath the dendrogram. (C) Correlations between modules and diseases. The horizontal axis represents modules, and the vertical axis represents the overall correlation coefficient between genes and disease states in the module. (D) Correlations between modules and traits. The upper figure in each row represents the correlation whereas the lower figure represents the P-value. Blue represents a negative correlation, and red represents a positive correlation.
Construction of the PPI Network
A total of 252 key genes were screened (Figure 4A; Supplementary File 2); the PPI network of the key genes (Figure 4B) included 102 nodes and 210 interactions. RPL9, RBX1, and RPL31 showed a relatively higher degree in the PPI network (Table 2), and were identified as hub genes. The enrichment analysis showed that the key genes were involved in 104 Gene Ontology (GO)-biological processes (BP) (Figure 4C), such as cellular response to interleukin-1 (involving RBX1) and response to interleukin-1 (involving RBX1), and 23 Kyoto Encyclopedia of Genes and Genomes (KEGG) pathways, including coronavirus disease (COVID-19) (involving RPL9 and RPL31), hepatitis C, influenza A, and ribosome (involving RPL9 and RPL31) (Figure 4D; Supplementary Files 3, 4).
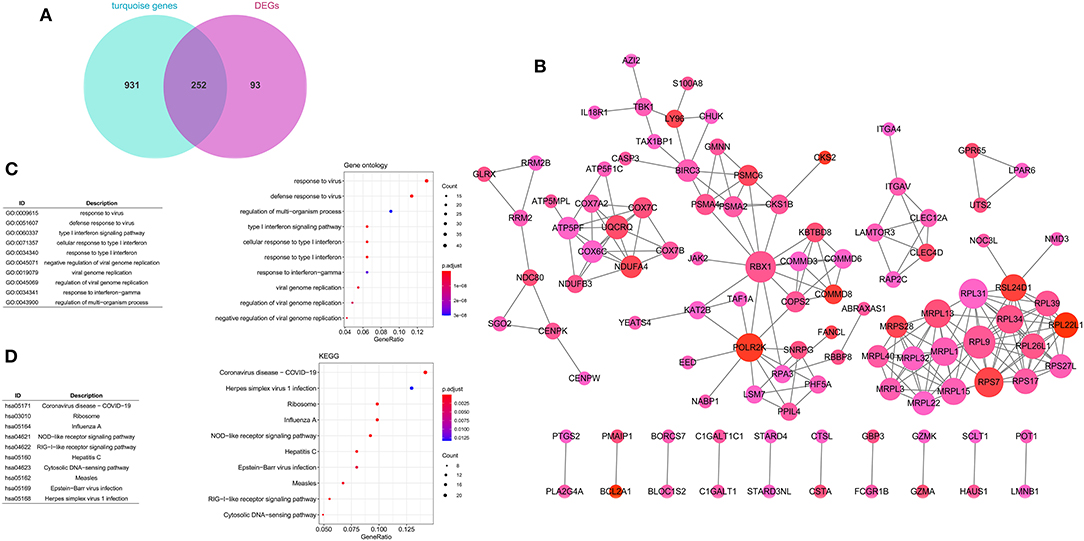
Figure 4. Construction of protein–protein interaction (PPI) network. (A) Venn diagram of key genes. (B) PPI network of key genes. The large nodes have a higher degree, and red nodes have a large log FC. The Gene Ontology (GO) (C) and Kyoto Encyclopedia of Genes and Genomes (KEGG) (D) pathway enrichment analyses of key genes. Circle colors represent P-values as indicated. The circle size represents the GeneRatio, which is the ratio of the number of genes enriched in a certain pathway to the number of genes in the group.
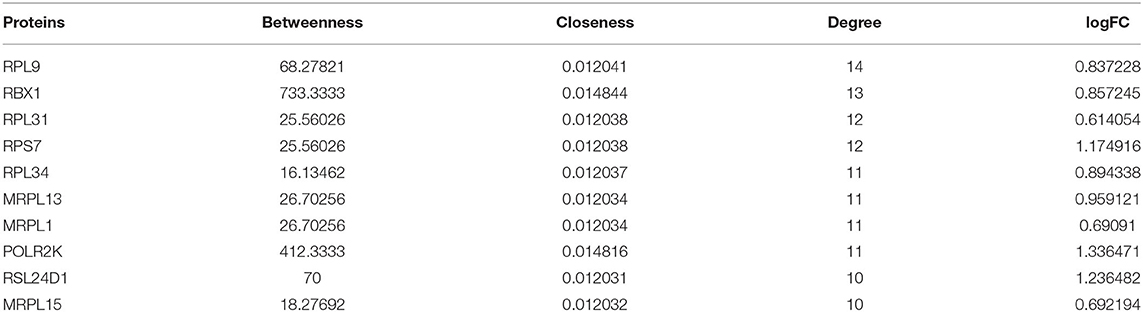
Table 2. Degree of proteins (top 10) in the protein–protein interaction (PPI) network.
Identification of the Feature Genes
The SVM model was constructed using the samples in the GSE66795 dataset with default parameters based on the top 50 genes obtained using the recursive feature elimination algorithm. There were 14 feature genes in the SVM model: CHMP5, SLFN12, IL15, VRK2, GMNN, CKS2, PRDX4, UBL5, CMC2, MRPL15, PKD2, PDIK1L, METTL4, and C1GALT1C1 (Figure 5A). The AUC was 0.882 (Figure 5B).
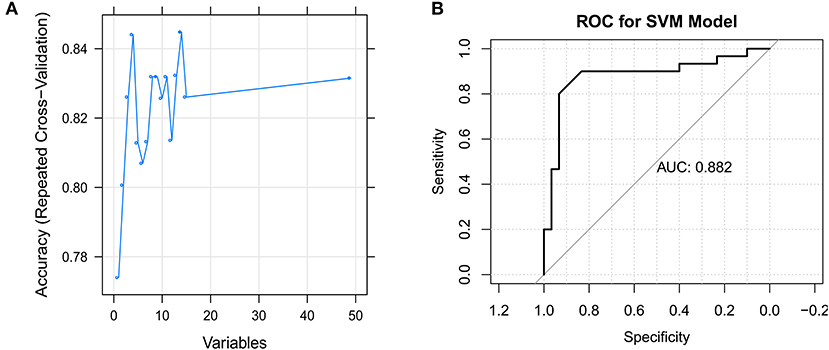
Figure 5. Identification of the feature genes. (A) The support vector machine (SVM) mode screens 14 feature genes using the RFE algorithm. (B) Receiver operating characteristic (ROC) curve for the SVM model.
Identification of Subtypes Based on the GSE140161 Dataset
According to the unsupervised cluster analysis, two subtypes were screened: Cluster 1 and Cluster 2. Bidirectional hierarchical clustering was performed to generate a heatmap of the clinical characteristics of the subtypes (Figure 6A). Gene set enrichment analysis (GSEA) showed that the genes related to the subtypes were enriched in 50 KEGG pathways, including the p53, JAK-STAT, and toll-like receptor signaling pathways (Figure 6B).
Figure 6. Identification of subtypes based on the GSE140161 dataset. (A) Heatmap of subtypes and clinical information. (B) Gene set enrichment analysis of genes in the two subtypes.
Validation Analysis
ROC curve analyses estimated an AUC of 0.852 in the GSE48378 dataset (Figure 7A), 0.780 in the GSE23117 dataset (Figure 7B), and 0.878 in the GSE48378 + GSE23117 + GSE140161 datasets (Figure 7C). The majority of the 14 feature genes were upregulated in the pSS group of the GSE48378 dataset (Figure 7D). According to RT-qPCR analyses, all the genes were upregulated in the pSS group, and significantly higher expression levels were observed for SLFN12, IL15, VRK2, GMNN, CKS2, PKD2, PDIK1L, METTL4, and C1GALT1C1 in the pSS group compared to the control group (P < 0.05, Figure 8).
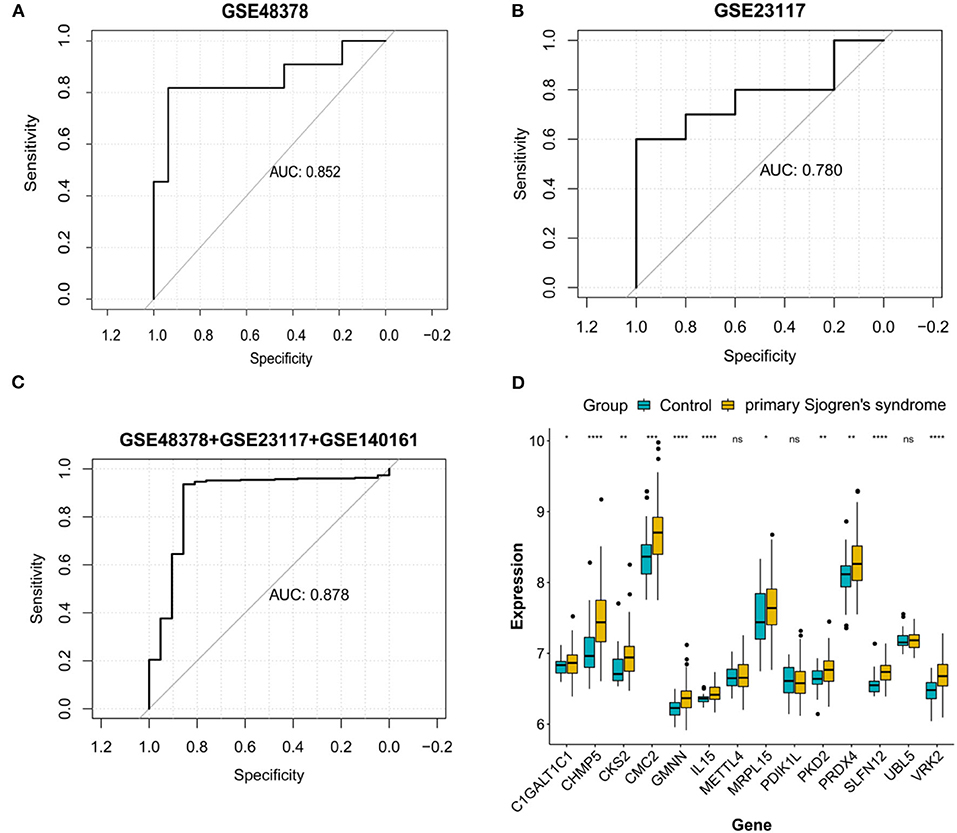
Figure 7. Validation analysis in the Gene Expression Omnibus (GEO) datasets. Receiver operating characteristic curve for the feature genes in the GSE48378 dataset (A), GSE23117 dataset (B), and GSE48378 + GSE23117 + GSE140161 datasets (C). (D) The expression level of the 14 feature genes in the GSE48378 dataset. The blue strip represents the normal control group and the yellow strip represents the primary Sjögren's syndrome (pSS) group. *P < 0.05; **P < 0.01; ***P < 0.001; ns indicates with no statistical significance.
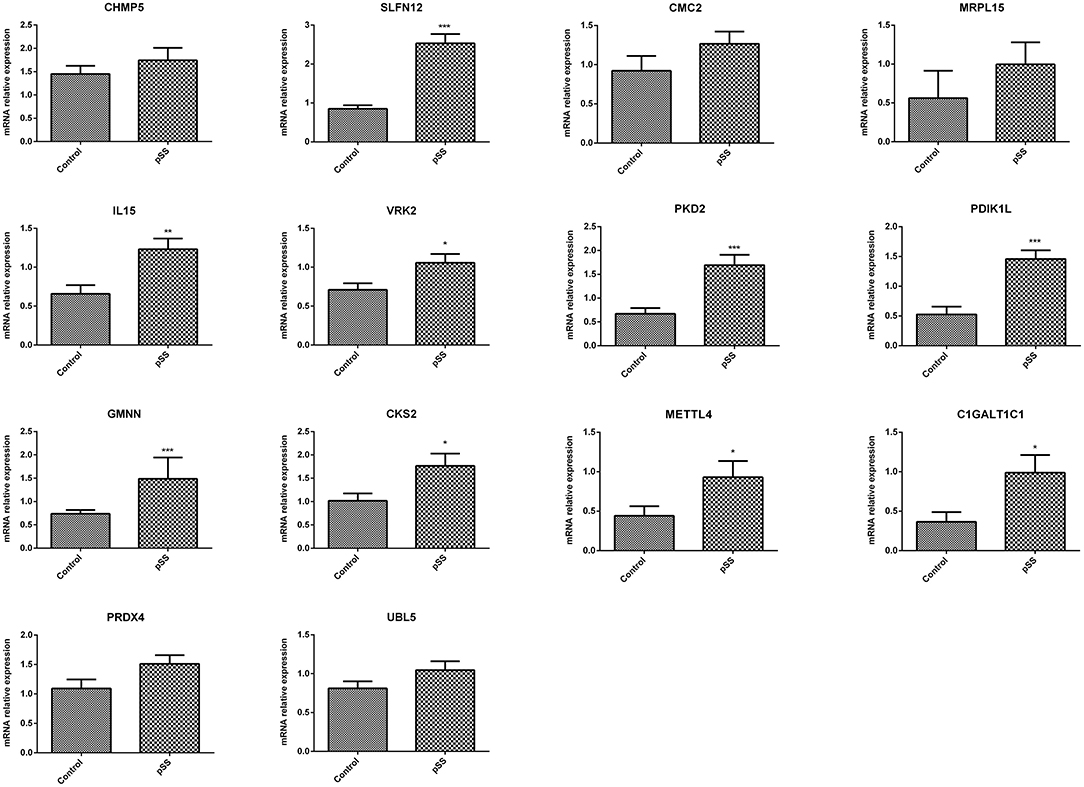
Figure 8. Quantitative real-time PCR (RT-qPCR) analysis to verify the feature genes. *P < 0.05; **P < 0.01; ***P < 0.001.
Discussion
SS is an autoimmune exocrine disease characterized by chronic inflammation and destruction of the salivary and lacrimal glands (3). Therefore, based on a large-scale SS cohort, combined with the identification of immune-related genes, effective immune markers were screened in this study. A total of 345 DEGs were identified, and the proportions of memory B cells, Tregs, gamma delta T cells, and activated dendritic cells differed significantly between the control and pSS samples. The turquoise module had the highest correlation with pSS, and 252 key genes were identified. The PPI network of the key genes showed that RPL9, RBX1, and RPL31 had a relatively higher degree. In addition, the key genes were involved in 104 GO-BPs and 23 KEGG pathways, including COVID-19, hepatitis C, influenza A, and ribosome. A total of 14 feature genes were identified in the SVM model: CHMP5, SLFN12, IL15, VRK2, GMNN, CKS2, PRDX4, UBL5, CMC2, MRPL15, PKD2, PDIK1L, METTL4, and C1GALT1C1. Two subtypes were screened, and the feature genes in the two subtypes were enriched in 50 KEGG pathways. The 14 feature genes were finally verified using GEO datasets and RT-qPCR.
The importance of immune cells in the pathogenesis of pSS has been studied extensively. Hansen et al. reported that B cells are an indication of selection disorder and differentiation in ectopic lymphoid tissue in SS (26). The infiltration of B and T cells in the salivary gland and the formation of germinal center-like structures are characteristic of pSS (27). Dendritic cells are key candidates for activating T cells and B cells in pSS (28). Moreover, the abnormality of memory B cells seems to be closely related to the pathogenesis of pSS and its malignant complication, B-cell lymphoma (29). Although Tregs prevent autoimmunity and maintain immunological homeostasis, Bernard et al. found that Tregs were related to systemic autoimmune diseases, including pSS (30). Lamour et al. found that the proportions of both CD16+ and HLA-DR+ gamma delta T cells were significantly higher in patients with pSS than in controls (31). In this study, the proportions of 20 immune cells were evaluated using the CIBERSORT algorithm, Among them, the proportions of gamma delta T cells, memory B cells, Tregs, and activated dendritic cells differed significantly between the control and pSS groups. According to analyses with the EPIC tool, the proportions of B cells, cancer associated fibroblasts, T cells, and endothelial cells differed significantly between the control and pSS groups. Both analyses indicated significant differences between the control and pSS groups, with respect to immune cell composition. Taken together, our results suggest that these immune cells play vital roles in the pathogenesis of pSS.
A total of 252 key genes were identified in this study, and RPL9, RBX1, and RPL31 were identified as hub genes according to the PPI network. The key genes were involved in 23 KEGG pathways, including COVID-19 (involving RPL9 and RPL31), hepatitis C, influenza A, and ribosome (involving RPL9 and RPL31). Bosaeed and Kumar revealed that, compared with the general population, the risk of influenza infection in patients with autoimmune diseases, such as pSS, is significantly increased (32). Ferri et al. reported that patients with systemic autoimmune diseases were more susceptible to COVID-19 owing to a weakened immune system (33). Ramos-Casals et al. suggested that hepatitis C virus infections are related to the development of SS in specific subgroups of patients (34). Multiple defects in the process of ribosome production have been reported to cause a spectrum of human diseases (35). The strong association of pSS with infectious diseases has led to an enthusiastic scientific debate regarding the cause and pathogenesis, though understanding the underlying mechanisms will require innovative and intensive research. Although our study provides a promising baseline evaluation of pSS associated genes, the results need to be verified using appropriate wet-lab experiments. The GO functional analysis revealed that the key genes were also enriched in the cellular response to interleukin-1 (involving RBX1) and response to interleukin-1 (involving RBX1) terms. Yamada et al. revealed that interleukin-1 plays vital roles in the onset and development of SS by controlling systemic or local immune responses and maintaining the survival and mucosal defense of target epithelial cells (36). To date, there are no reports on RPL9, RBX1, and RPL31 in pSS, and the potential correlations should be further evaluated.
In this study, 14 feature genes were identified—CHMP5, SLFN12, IL15, VRK2, GMNN, CKS2, PRDX4, UBL5, CMC2, MRPL15, PKD2, PDIK1L, METTL4, and C1GALT1C1—which were verified using several GEO datasets and RT-qPCR. The RT-qPCR results showed that the expression of all these genes was upregulated in the pSS group, and significantly higher expression levels of SLFN12, IL15, VRK2, GMNN, CKS2, PKD2, PDIK1L, METTL4, and C1GALT1C1 were observed in the pSS group compared with the control group. IL15, also known as IL-15, is a multifunctional molecule with therapeutic potential and is a member of the immune regulatory cytokine family (37). Sisto et al. reported that IL-15 is overexpressed at both mRNA and protein levels in pSS patients (38), which is consistent with the results of the present study. However, few studies have reported on the other feature genes identified in this study. According to the GSEA results, the feature genes in the two subtypes were enriched in 50 KEGG pathways, including the p53, JAK-STAT, and toll-like receptor signaling pathways. p53 is important in DNA repair, cell cycle arrest, hypoxia, and inflammation in various cells and tissues (39). Takatori et al. reported that p53 is supposedly involved in the pathogenesis of systemic autoimmune diseases in humans and mice (40). Aota et al. suggested that by regulating JAK/STAT signaling, baricitinib inhibited IFN-γ-induced CXCL10 expression and weakened immune cell chemotaxis, indicating its potential as a therapeutic strategy for pSS (41). Shimizu et al. indicated that toll-like receptor 7-dominant innate immunity is related to the development of sialadenitis in pSS (42). The present study has identified 14 feature genes that could play vital roles in the development of pSS via the p53, JAK-STAT, and toll-like receptor signaling pathways.
However, this study has some limitations. First, RPL9, RBX1, and RPL31, identified as hub genes in the PPI network, should be further verified in different datasets and using other relevant experiments. Second, as the immune cell composition of the samples was estimated using CIBERSORT algorithm and EPIC tool, further relevant experiments are required to verify their accuracy. Further experiments, using larger datasets, are needed to provide in-depth evaluations of the etiopathogenic basis of these genes in pSS.
Conclusions
Several cells and genes (memory B cells, Tregs, gamma delta T cells, activated dendritic cells, RPL9, RBX1, RPL31, and feature genes) could play potential roles in the development of pSS. These findings add to our understanding of the pathogenesis of pSS and may inspire the development of new therapeutic approaches.
Data Availability Statement
The original contributions presented in the study are included in the article/Supplementary Material, further inquiries that support the findings of this study are available in GEO database at (https://www.ncbi.nlm.nih.gov/geo/).
Author Contributions
JC and HH conceptualized and designed the research and conceived of the study, participated in its design and coordination, and contributed to the writing and revision of the manuscript for important intellectual content. HL and XY contributed to data acquisition. TW participated in data analysis and interpretation. QS and YY designed the study and performed the statistical analysis. All authors read and approved the final manuscript.
Conflict of Interest
The authors declare that the research was conducted in the absence of any commercial or financial relationships that could be construed as a potential conflict of interest.
Publisher's Note
All claims expressed in this article are solely those of the authors and do not necessarily represent those of their affiliated organizations, or those of the publisher, the editors and the reviewers. Any product that may be evaluated in this article, or claim that may be made by its manufacturer, is not guaranteed or endorsed by the publisher.
Supplementary Material
The Supplementary Material for this article can be found online at: https://www.frontiersin.org/articles/10.3389/fmed.2021.719958/full#supplementary-material
Abbreviations
AUC, Area under the curve; BP, Biological processes; GEO, Gene Expression Omnibus; GO, Gene Ontology; GSEA, Gene set enrichment analysis; KEGG, Kyoto Encyclopedia of Genes and Genomes; ROC, Receiver operating characteristic; SVM, Support vector machine; WGCNA, Weighted gene co-expression network analysis.
References
2. Gøransson LG, Herigstad A, Tjensvoll AB, Harboe E, Mellgren SI, Omdal R. Peripheral neuropathy in primary sjogren syndrome: a population-based study. Arch Neurol. (2006) 63:1612–5. doi: 10.1001/archneur.63.11.1612
4. Qin B, Wang J, Yang Z, Yang M, Ma N, Huang F, et al. Epidemiology of primary Sjögren's syndrome: a systematic review and meta-analysis. Ann Rheum Dis. (2015) 74:1983–9. doi: 10.1136/annrheumdis-2014-205375
5. Odani T, Chiorini JA. Targeting primary Sjögren's syndrome. Mod Rheumatol. (2019) 29:70–86. doi: 10.1080/14397595.2018.1546268
6. Seror R, Bowman S. Outcome measures in primary Sjögren's syndrome. Arthritis Care Res.(2020) 72:134–49. doi: 10.1002/acr.24331
7. Björk A, Mofors J, Wahren-Herlenius M. Environmental factors in the pathogenesis of primary Sjögren's syndrome. J Intern Med. (2020) 287:475–92. doi: 10.1111/joim.13032
8. Bombardieri M, Argyropoulou OD, Ferro F, Coleby R, Pontarini E, Governato G, et al. One year in review 2020: pathogenesis of primary Sjögren's syndrome. Clin Exp Rheumatol. (2020) 126:3–9.
9. Lin Y, Yao X, Yan M, Zhou L, Huang W, Xiao Y, et al. Integrated analysis of transcriptomics to identify hub genes in primary Sjögren's syndrome. Oral Dis. (2021)doi: 10.1111/odi.13943
10. Inamo J, Suzuki K, Takeshita M, Kassai Y, Takiguchi M, Kurisu R, et al. Identification of novel genes associated with dysregulation of B cells in patients with primary Sjögren's syndrome. Arthritis Res Ther. (2020) 22:153. doi: 10.1186/s13075-020-02248-2
11. Zhang L, Xu P, Wang X, Zhang Z, Zhao W, Li Z, et al. Identification of differentially expressed genes in primary Sjögren's syndrome. J Cell Biochem. (2019) 120:17368–77. doi: 10.1002/jcb.29001
12. Vitali C, Dolcino M, Del Papa N, Minniti A, Pignataro F, Maglione W, et al. Gene expression profiles in primary Sjögren's syndrome with and without systemic manifestations. ACR Open Rheumatol. (2019) 1:603–13. doi: 10.1002/acr2.11082
13. Lucchesi D, Coleby R, Pontarini E, Prediletto E, Rivellese F, Hill DG, et al. Impaired interleukin-27-mediated control of CD4+ T cell function impact on ectopic lymphoid structure formation in patients with Sjögren's syndrome. Arthritis Rheumatol. (2020) 72:1559–70. doi: 10.1002/art.41289
14. Fessler J, Fasching P, Raicht A, Hammerl S, Weber J, Lackner A, et al. Lymphopenia in primary Sjögren's syndrome is associated with premature aging of naïve CD4+ T cells. Rheumatology. (2021) 60:588–97. doi: 10.1093/rheumatology/keaa105
15. Yao Q, Song Z, Wang B, Qin Q, Zhang JA. Identifying key genes and functionally enriched pathways in Sjögren's syndrome by weighted gene co-expression network analysis. Front Genet. (2019) 10:1142. doi: 10.3389/fgene.2019.01142
16. Lei S, Zhang Y. Identification of the key genes and pathways involved in B cells in primary Sjögren' s syndrome. Bioengineered. (2021) 12:2055–73. doi: 10.1080/21655979.2021.1930753
17. Smyth GK. Limma: linear models for microarray data. In: Bioinformatics and Computational Biology Solutions Using R and Bioconductor. New York, NY: Springer (2013). p. 397–420.
18. Newman AM, Liu CL, Green MR, Gentles AJ, Feng W, Xu Y, et al. Robust enumeration of cell subsets from tissue expression profiles. Nat Methods. (2015) 12:453–7. doi: 10.1038/nmeth.3337
19. Langfelder P, Horvath S. WGCNA: an R package for weighted correlation network analysis. BMC Bioinformat. (2008) 9:559. doi: 10.1186/1471-2105-9-559
20. Keshava Prasad TS, Goel R, Kandasamy K, Keerthikumar S, Kumar S, Mathivanan S, et al. Human protein reference database-−2009 update. Nucleic Acids Res. (2009) 37:D767–772. doi: 10.1093/nar/gkn892
21. Shannon P, Markiel A, Ozier O, Baliga NS, Wang JT, Ramage D, et al. Cytoscape: a software environment for integrated models of biomolecular interaction networks. Genome Res. (2003) 13:2498–504. doi: 10.1101/gr.1239303
22. Yu G, Wang LG, Han Y, He QY. clusterProfiler: an R package for comparing biological themes among gene clusters. Omics. (2012) 16:284–7. doi: 10.1089/omi.2011.0118
23. Wang Q, Liu X. Screening of feature genes in distinguishing different types of breast cancer using support vector machine. Onco Targets Ther. (2015) 8:2311–7. doi: 10.2147/OTT.S85271
24. Hänzelmann S, Castelo R, Guinney J. GSVA: gene set variation analysis for microarray and RNA-seq data. BMC Bioinformatics. (2013) 14:7. doi: 10.1186/1471-2105-14-7
25. Rosseto SM, Alarcon TA, Rocha DMC, Ribeiro FM, Ferguson SSG, Martins-Silva C, et al. DYNLT1 gene expression is downregulated in whole blood of patients at different Huntington's disease stages. Neurol Sci. (2021) 42:1963–7. doi: 10.1007/s10072-020-04772-0
26. Hansen A, Lipsky PE, Dörner T. B cells in Sjögren's syndrome: indications for disturbed selection and differentiation in ectopic lymphoid tissue. Arthritis Res Ther. (2007) 9:218. doi: 10.1186/ar2210
27. Abdulahad WH, Kroese FG, Vissink A, Bootsma H. Immune regulation and B-cell depletion therapy in patients with primary Sjögren's syndrome. J Autoimmun. (2012) 39:103–11. doi: 10.1016/j.jaut.2012.01.009
28. Hillen MR, Ververs FA, Kruize AA, Van Roon JA. Dendritic cells, T-cells and epithelial cells: a crucial interplay in immunopathology of primary Sjögren's syndrome. Expert Rev Clin Immunol. (2014) 10:521–31. doi: 10.1586/1744666X.2014.878650
29. Hansen A, Daridon C, Dörner T. What do we know about memory B cells in primary Sjögren's syndrome? Autoimmun Rev. (2010) 9:600–3. doi: 10.1016/j.autrev.2010.05.005
30. Bernard F, Romano A, Granel B. Regulatory T cells and systemic autoimmune diseases: systemic lupus erythematosus, rheumatoid arthritis, primary Sjögren's syndrome. Rev Med Interne. (2010) 31:116–27. doi: 10.1016/j.revmed.2009.03.364
31. Lamour A, Smith MD, Lydyard PM, Youinou PY. The majority of Fc gamma RIII-positive gamma delta T cells do not express HLA-DR in patients with primary Sjögren's syndrome. Immunol Lett. (1995) 45:153–5. doi: 10.1016/0165-2478(94)00252-M
32. Bosaeed M, Kumar D. Seasonal influenza vaccine in immunocompromised persons. Hum Vaccin Immunother. (2018) 14:1311–22. doi: 10.1080/21645515.2018.1445446
33. Ferri C, Giuggioli D, Raimondo V, L'Andolina M, Tavoni A, Cecchetti R, et al. COVID-19 and rheumatic autoimmune systemic diseases: report of a large Italian patients series. Clin Rheumatol. (2020) 39:3195–204. doi: 10.1007/s10067-020-05334-7
34. Ramos-Casals M, Muñoz S, Zerón PB. Hepatitis C virus and Sjögren's syndrome: trigger or mimic? Rheum Dis Clin North Am. 34:869–84, vii. (2008). doi: 10.1016/j.rdc.2008.08.007
35. Venturi G, Montanaro L. How altered ribosome production can cause or contribute to human disease: the spectrum of ribosomopathies. Cells. (2020) 9:2300. doi: 10.3390/cells9102300
36. Yamada A, Arakaki R, Kudo Y, Ishimaru N. Targeting IL-1 in Sjögren's syndrome. Expert Opin Ther Targets. (2013) 17:393–401. doi: 10.1517/14728222.2013.754427
37. Patidar M, Yadav N, Dalai SK. Interleukin 15: a key cytokine for immunotherapy. Cytokine Growth Factor Rev. (2016) 31:49–59. doi: 10.1016/j.cytogfr.2016.06.001
38. Sisto M, Lorusso L, Lisi S. Interleukin-15 as a potential new target in Sjögren's syndrome-associated inflammation. Pathology. (2016) 48:602–7. doi: 10.1016/j.pathol.2016.06.001
39. Green DR, Kroemer G. Cytoplasmic functions of the tumour suppressor p53. Nature. (2009) 458:1127–30. doi: 10.1038/nature07986
40. Takatori H, Kawashima H, Suzuki K, Nakajima H. Role of p53 in systemic autoimmune diseases. Crit Rev Immunol. (2014) 34:509–16. doi: 10.1615/CritRevImmunol.2014012193
41. Aota K, Yamanoi T, Kani K, Ono S, Momota Y, Azuma M. Inhibition of JAK-STAT signaling by baricitinib reduces interferon-γ-induced CXCL10 production in human salivary gland ductal cells. Inflammation. (2021) 44:206–16. doi: 10.1007/s10753-020-01322-w
Keywords: primary Sjögren's syndrome, weighted gene co-expression network analysis, immune cell, protein–protein interaction network, support vector machine model
Citation: Cui J, Li H, Wang T, Shen Q, Yang Y, Yu X and Hu H (2022) Novel Immune-Related Genetic Expression for Primary Sjögren's Syndrome. Front. Med. 8:719958. doi: 10.3389/fmed.2021.719958
Received: 20 June 2021; Accepted: 19 November 2021;
Published: 03 January 2022.
Edited by:
Alessia Alunno, University of L'Aquila, ItalyReviewed by:
Ângelo Calado, Universidade de Lisboa, PortugalSoledad Retamozo, Parc Taulí Hospital Universitari, Spain
Copyright © 2022 Cui, Li, Wang, Shen, Yang, Yu and Hu. This is an open-access article distributed under the terms of the Creative Commons Attribution License (CC BY). The use, distribution or reproduction in other forums is permitted, provided the original author(s) and the copyright owner(s) are credited and that the original publication in this journal is cited, in accordance with accepted academic practice. No use, distribution or reproduction is permitted which does not comply with these terms.
*Correspondence: Huaixia Hu, bHlnZXlmc2s3NjEzMUAxNjMuY29t
†These authors share first authorship