 Junyin Gao1†
 Hongjun Liu1†
 Xiaolin Wang2†
 Liping Wang3
 Jianjun Gu4Yuxiu Wang1
 Zhiguang Yang5Yunpeng Liu5Jingjing Yang1Zhibin Cai1
 Yusheng Shu2*
 Lingfeng Min1*
- 1Department of Pulmonary and Critical Care Medicine, Northern Jiangsu People's Hospital, Clinical Medical College, Yangzhou University, Yangzhou, China
- 2Department of Thoracic Surgery, Northern Jiangsu People's Hospital, Clinical Medical College, Yangzhou University, Yangzhou, China
- 3Clinical Medical College, Yangzhou University, Yangzhou, China
- 4Department of Cardiology, Institute of Translational Medicine, Clinical Medical College, Yangzhou University, Yangzhou, China
- 5Department of Thoracic Surgery, The First Hospital of Jilin University, Changchun, China
We aimed to study the molecular mechanisms of chronic obstructive pulmonary disease (COPD) caused by cigarette smoke more comprehensively and systematically through different perspectives and aspects and to explore the role of protein acetylation modification in COPD. We established the COPD model by exposing C57BL/6J mice to cigarette smoke for 24 weeks, then analyzed the transcriptomics, proteomics, and acetylomics data of mouse lung tissue by RNA sequencing (RNA-seq) and liquid chromatography-tandem mass spectrometry (LC-MS/MS), and associated these omics data through unique algorithms. This study demonstrated that the differentially expressed proteins and acetylation modification in the lung tissue of COPD mice were co-enriched in pathways such as oxidative phosphorylation (OXPHOS) and fatty acid degradation. A total of 19 genes, namely, ENO3, PFKM, ALDOA, ACTN2, FGG, MYH1, MYH3, MYH8, MYL1, MYLPF, TTN, ACTA1, ATP2A1, CKM, CORO1A, EEF1A2, AKR1B8, MB, and STAT1, were significantly and differentially expressed at all the three levels of transcription, protein, and acetylation modification simultaneously. Then, we assessed the distribution and expression in different cell subpopulations of these 19 genes in the lung tissues of patients with COPD by analyzing data from single-cell RNA sequencing (scRNA-seq). Finally, we carried out the in vivo experimental verification using mouse lung tissue through quantitative real-time PCR (qRT-PCR), Western blotting (WB), immunofluorescence (IF), and immunoprecipitation (IP). The results showed that the differential acetylation modifications of mouse lung tissue are widely involved in cigarette smoke-induced COPD. ALDOA is significantly downregulated and hyperacetylated in the lung tissues of humans and mice with COPD, which might be a potential biomarker for the diagnosis and/or treatment of COPD.
1. Introduction
The 2022 Global Initiative for Chronic Obstructive Lung Disease (COPD) report considered that cigarette smoking is the leading environmental risk factor for COPD (1). The smoke produced by cigarette combustion contains a large number of harmful components (2) that can induce oxidative stress in lung cells (3), cause damage to mitochondria (4, 5), aggravate protease–anti-protease imbalance (6, 7), cause autoimmune response (8, 9), and also cause autophagy dysfunction of lung cells and mitochondria (10–12). These comprehensive factors lead to DNA and protein damage, inflammatory infiltration, cell aging and apoptosis, destruction and remodeling of airway structure, and participate in the progression of COPD.
Liquid chromatography-tandem mass spectrometry (LC-MS/MS) has greatly promoted the determination of post-translational modifications (PTMs) on the protein, such as acetylation (13). Histone acetylation modification leads to chromatin remodeling, regulates the transcriptional activity and gene expression, and is largely independent of the regulation of transcription by DNA methylation (14). Non-histone acetylation modification can regulate RNA transcription, DNA damage repair, and autophagy; alter the structure of the protein, enzyme activity, and signal transduction; effectuate crosstalk on the other types of PTMs, such as phosphorylation; and finally affect the expression and function of proteins (15). Initially, attention was focused on histone proteins with differentially expressed acetylation modifications in COPD (16, 17), and the role of differential acetylation modifications of non-histone proteins induced by cigarette smoke has also attracted attention in recent years (18, 19).
Single-cell RNA sequencing (scRNA-seq) is another emerging technology that has attracted many researchers' attention in recent years and is predicted to have a broader application prospect, including the integration of scRNA-seq data with other omics (scMultiomics) (20). Various advanced high-throughput sequencing technologies have generated several types of omics data. Although single-omics data, such as genomics (21), epigenomics (22), transcriptomics (23, 24), proteomics (25, 26), metabolomics (27, 28), and scRNA-seq (29, 30), have contributed to clarifying the mechanisms of COPD, the disease is still one of the three leading causes of deaths worldwide, and the burden of COPD is expected to increase in the next few decades (1). There is no simple correspondence between transcription and protein abundance; complex regulatory mechanisms affect transcription, translation, PTMs, and metabolic processes, and ultimately affect protein expression (31, 32). Although scRNA-seq can decipher the regulatory correlations among genes from various cell subpopulations and record the trajectories of distinct cell lineages during development, it cannot reveal their spatial distribution or functional characteristics (33). These reasons indicate that a single-omics data set may not be able to fully explain COPD. This finding indicated that there is an urgent need for novel research ideas, such as combining multiple omics data sets. Some studies on COPD have used this strategy (34, 35), indicating that multi-omics data analysis is conducive to identifying biomarkers and understanding the heterogeneity of COPD. Li et al. showed that integrating multiple omics data improves the accuracy of diagnosis and molecular subtype prediction of COPD compared with single-omics data (36). In addition, Lai et al. (37) and Pei et al. (38) correlated scRNA-seq with other omics data to study the genetic characteristics and pathogenesis of COPD.
In this study, we aimed to elucidate the molecular mechanisms underlying lung injury in COPD mice at the levels of gene transcription, protein translation, and PTMs through multi-omics data associative analysis; reveal the role of protein acetylation modification in COPD; and discover new potential prevention and treatment targets of COPD. Also, we analyzed the distribution of these genes in cell subpopulations of lung tissue by scRNA-seq in order to select the appropriate genes for subsequent experimental verification and lay a foundation for further studies on the pathway mechanisms of COPD in the future.
2. Materials and methods
2.1. Animals
In this study, six male specific pathogen-free (SPF) grade C57BL/6J mice, 6 weeks old, were purchased from Charles River (CRL) experimental Animal Center (Beijing, China; License key: SCXK, Beijing, 2016-0006). After 2 weeks of adaptive feeding, the animals were randomly and equally divided into the control group (control) and the cigarette smoke treatment group (CS). Mice in the CS group were exposed to the smoke of 3R4F research cigarettes (Tobacco Research Institute, University of Kentucky, Lexington, KY; 11 mg TPM, 9.4 mg tar, and 0.73 mg nicotine per cigarette), 5 cigarettes and 30 min one time, twice a day, at an interval of 4 h, 5 days/week for 24 weeks, while the mice in the control group were free to breathe fresh air. During the experiment, mice ate and drank freely in a controlled environment: 12:12 h of light:dark cycle, a humidity of 50–60%, and a temperature of 21–23°C. During the whole experiment, the animals were given humanitarian care in accordance with the 3R principle. The study was approved by the ethics committee of the Clinical Medical College of Yangzhou University (Yangzhou, Jiangsu Province, China).
2.2. Lung function measurement
The lung function of the two groups of mice was measured by a forced oscillatory small-animal ventilator (flexiVent, SCIREQ) in the Function Experiment Center of the Clinical Medical College of Yangzhou University. To ensure the accuracy of data, the measurement process was operated by the same person. That is, the mice were anesthetized before tracheostomy, and the endotracheal intubation was connected with the small-animal ventilator. The parameters were as follows: performed quasi sinusoidal ventilation, tidal volume: 10 ml/kg, respiratory rate: 150 times/min, I:E ratio: 2:3, and PEEP: 3 cmH2O. Then, the airway resistance (RN), tissue damping (G), tissue elasticity (H), peak expiratory flow (PEF), forced expiratory volume in 100 ms (FEV0.1), forced vital capacity (FVC), and FEV0.1/FVC ratio were measured and recorded. Each mouse was tested repeatedly six times, and the average value of each item was considered.
2.3. Histopathological analysis and morphometry
The left lower lung tissue of mice was fixed with 4% formaldehyde for 24 h, embedded in paraffin after dehydration, sectioned (5-μm thick, hematoxylin and eosin [H&E]), and stained with H&E after dewaxing and rehydration. The stained sections were observed, evaluated, and photographed by experienced pathological researchers at 100× and 400× magnification under the optical microscope (OLYMPUS BX53, with the image analysis software Stream). The Image-Pro Plus (Media Cybernetics, Rockville, MD, USA) was used to analyze the images, and the mean linear intercept (MLI) was measured: six images from different shooting fields of each sample (did not contain airways and/or blood vessels) were overlaid with an 11-horizontal line template. The intercepts of the alveolar walls with lines were enumerated, and then the total length of the 11 lines was divided by the average number of intercepts (39).
2.4. Transcriptomics
According to the manufacturer's instructions, total RNA was extracted and purified from the left upper lung tissue of each mouse and amplified by polymerase chain reaction (PCR). The constructed library was examined on an Agilent 2100 Bioanalyzer and ABI StepOneplus Real-Time PCR System and sequenced on the Illumina HiSeq platform. The clean reads were obtained by removing low-quality reads, adapters, and poly-N sequences from the raw reads. The clean reads were matched to the reference genome sequence (GRCm38) using HISAT2-software, new transcripts were predicted, and single-nucleotide polymorphism (SNP), insertion-deletion (InDel), and differential splicing genes (DSG) were identified. The new transcript with protein coding potential was added to the reference gene sequence to form a complete reference sequence and then the gene expression was calculated. Finally, the quality of data from each sample and the differentially expressed genes between different samples were analyzed (40). Due to a large amount of transcriptome differential analysis data, Benjamini–Hochberg adjustment was performed on p-value to further reduce the false-positive rate. Subsequently, we defined genes with more than a 2-fold difference and p < 0.001 after correction as significantly differentially expressed genes.
2.5. Proteomics
An appropriate amount of the right lower lung tissue of each mouse was ground and homogenized, and the supernatant was collected by centrifugation to determine the protein concentration using the BCA method. After trypsin digestion, the peptide was desalted on the Strata X C18 SPE column (Phenomenex) and vacuum dried. The peptide was reconstituted in 0.5 M TEAB and processed using the TMT kit, according to the manufacturer's protocol. The tryptic peptides were fractionated by high pH reverse-phase HPLC and separated on a gradient of 8–32% acetonitrile (pH 9.0) over 60 min into 60 fractions; these were pooled into 18 fractions and dried by vacuum centrifugation.
For LC-MS/MS analysis, the tryptic peptides were solubilized in solvent A (aqueous solution containing 0.1% formic acid and 2% acetonitrile). The gradient comprised an increase from 9 to 23% of solvent B (aqueous solution containing 0.1% formic acid and 90% acetonitrile) in 0–26 min, from 23 to 35% in 26–34 min, and 23 to 80% in 34–37 min, then held at 80% for the last 3 min; a constant flow rate of 300 nl/min was maintained on the EASY-nLC 1000 UPLC system throughout these processes. The peptides were subjected to an NSI source, followed by Orbitrap Fusion mass spectrometry. The electrospray voltage was set at 2.0 kV. The scanning range of primary mass spectrometry was set to 350–1,550 m/z, and the scanning resolution was set to 60,000. The scanning range of the secondary mass spectrometry was fixed at 100 m/z, and the secondary scanning resolution was set at 30,000. The DDA program was selected as the data acquisition mode. The automatic gain control (AGC) was set at 5E4 to improve the effective utilization of mass spectrometry. The signal threshold was set to 5,000 ions/s, and the maximum injection time was set to 100 ms. To avoid repeated scanning, a data-dependent procedure was alternated between the scans with dynamic exclusion of 30 s.
Maxquant search engine (version 1.5.2.8) was used to process the resulting data searched against the mouse SwissPort database concatenated with the reverse decoy database to calculate the false discovery rate (FDR) caused by random matching, and common contamination databases were added to eliminate the influence of contaminated proteins. Trypsin/P was specified as the cleavage enzyme allowing up to two missing cleavages. The minimum length of the peptide was set to seven amino acid residues. The mass tolerance for precursor ions was set at 20 ppm in the first search and 5 ppm in the main search and was set for fragment ions at 0.02 Da. The quantitative method was set to TMT-10plex, and FDR was adjusted to <1%. It was defined as a significantly differentially expressed protein if the ratio of change was > 1.3 or <1/1.3 and p < 0.05.
2.6. Acetylomics
The processes of protein extraction, trypsin digestion, and TMT labeling were consistent with proteomics. HPLC fractionation was also similar to proteomics, except that peptides were combined into 4, but not 18, fractions before being dried by vacuum centrifugation. In addition, there was an additional process of affinity enrichment between HPLC fractionation and LC-MS/MS analysis. To enrich the acetylated peptides, tryptic peptides dissolved in NETN buffer (100 mM NaCl, 1 mM EDTA, 50 mM Tris–HCl, 0.5% NP-40, pH 8.0) were incubated with pre-washed antibody beads at 4°C overnight, with gentle shaking. Then, the beads were washed four times with NETN buffer and twice with deionized water. The bound peptides were eluted from the beads with 0.1% trifluoroacetic acid. Finally, the eluted fractions were combined and vacuum-dried. The resulting peptides were desalted with C18 ZipTips (Millipore) before LC-MS/MS analysis, according to the manufacturer's instructions. The processes of LC-MS/MS analysis and database search were similar to those described in proteomics, except that there were only a very few different parameter settings. Similarly, we defined significantly differentially expressed protein acetylation modification according to the standard of the ratio of change > 1.3 or <1/1.3 and p < 0.05.
2.7. Multi-omics associative analysis
2.7.1. Transcriptomics and proteomics associative analysis
2.7.1.1. Protein annotation
First, we screened the proteins quantified at both transcriptome and proteome levels. The protein ID was converted to UniProt ID, and the GO ID was matched with UniProt ID in order to obtain the corresponding information from the UniProt-GOA database (http://www.ebi.ac.uk/GOA/) for Gene Ontology (GO) annotation, according to GO ID. If no protein information was queried in the database, an algorithm software based on protein sequence—InterProScan (version 5.14-53.0, http://www.ebi.ac.uk/interpro/)—would be used to predict the GO function of the protein. Next, the Kyoto Encyclopedia of Genes and Genomes (KEGG) online service tool KAAS (version 2.0, http://www.genome.jp/kaas-bin/kaas_main) was used to annotate the screened proteins and matched into the corresponding pathways in the database by KEGG mapper (version 2.5, http://www.kegg.jp/kegg/mapper.html).
2.7.1.2. Protein functional enrichment
All the differential expressions on at least one level of transcriptome and proteome were screened and divided into groups according to different expression trend types in the transcriptome and proteome (up-up, up-down, up-unchanged, down-unchanged, down-down, down-up, unchanged-up, and unchanged-down) to study the potential correlation between different regulatory relationships and specific functions. Briefly, GO functional enrichment was performed separately with the differentially expressed genes and proteins in various groups and classified into three categories: cellular compartment (C-C), biological process (B-P), and molecular function (M-F). Similarly, the KEGG database was used to identify the enriched pathways for different groups. The two-tailed Fisher's exact test (Perl module, version 1.31, https://metacpan.org/pod/Text::NSP::Measures::2D::Fisher) was used in the enrichment test; p < 0.05 was considered significant.
2.7.1.3. Enrichment-based clustering
All the functional enrichments and pathways that were significant (p < 0.05) in at least one regulatory relationship group were screened. The filtered p-value data matrix was first transformed by a logarithm of -log10; then, the transformed data matrix was converted by z-transformation. These z scores were clustered by one-way hierarchical clustering (Euclidean distance, average linkage clustering) in Genesis. The cluster membership was visualized by heat maps using the heatmap (R package, https://cran.r-project.org/web/packages/cluster/).
2.7.2. Proteomics and acetylomics associative analysis
2.7.2.1. Acetylomics analysis
All the proteins corresponding to the differentially expressed acetylation modification sites were annotated and functionally enriched with GO and KEGG; InterPro domain database (http://www.ebi.ac.uk/interpro/) was used to annotate the protein domains, then enrichment-based clustering was performed using the methods described earlier. The subcellular localization was annotated by the Wolfpsort software (version 0.2, http://www.genscript.com/psort/wolf_psort.html). Soft MoMo (motif-x algorithm, version 5.0.2, http://meme-suite.org/tools/momo) was used for motif analysis to analyze the motif characteristics of the modification sites.
2.7.2.2. Proteomics and acetylomics associative analysis
All the identifiers of differentially expressed proteins and proteins corresponding to the differentially expressed acetylation sites (defined as proteome and modification, respectively) were collected. These proteins were searched against the STRING database version 11.0 for protein–protein interactions. Only interactions between the proteins belonging to the searched data set were selected, and the external candidates were excluded. STRING defines a metric termed “confidence score” to define the interaction confidence. Next, we fetched all interactions with a confidence score of ≥ 0.7 (high confidence) and defined the number of proteins interacting with other differentially expressed proteins as “degree.” The interaction network forming STRING was visualized in the Cytoscape software, and a graph theoretical clustering algorithm—molecular complex detection (MCODE, plugin of Cytoscape)—was utilized to analyze the densely connected regions (proteins with the highest “degree”). Finally, we carried out functional enrichment on most proteins in these densely connected regions (marked by dotted circles).
2.8. Single-cell RNA sequencing (scRNA-seq) data analysis
The scRNA-seq data (GSE136831) of whole lungs dissociated from Homo sapiens were downloaded from the National Center of Biotechnology Information (NCBI) Gene Expression Omnibus (GEO; https://www.ncbi.nlm.nih.gov/geo/). To analyze accurately, we selected eight samples of patients with COPD as the COPD group and eight samples of healthy humans as the control group from GSE136831 (41). These samples were age and sex matched, and at least 1,500 cells were detected in each sample. The quality control standard was that the cells expressed at least 500 and at most 8,000 genes, the proportion of mitochondria was <20%, and the total RNA detected was <80,000, following which the doublets generated due to the excessive number of genes and RNA detection were removed. The data were standardized and scaled using the Seurat R package. The top 2,000 highly variable genes and the top 10 significant PCs were used to perform the dimension reduction cluster analysis downstream. The cell subpopulations in lung tissue were identified based on the expression of classical correlative biomarkers. The genes from various cell subpopulations with the absolute value of the differential expression (log2) between the two groups > 0.25 were defined as significantly differentially expressed genes (p < 0.05).
2.9. Quantitative real-time PCR (qRT-PCR)
RNAsimple total RNA kit (DP419; Tiangen Biotech Co., Ltd., Beijing, China) was used to extract the RNA from a part of the right upper lung tissue of mice. The cDNA was generated from 0.4 μg of RNA using the HiScript III RT SuperMix for qPCR (+gDNA wiper; R323-01; Vazyme Biotech Co., Ltd., Nanjing, Jiangsu, China). Next, we used AceQ® Universal SYBR® qPCR Master Mix (Q511-02; Vazyme Biotech Co., Ltd.) and ABI Step One Plus real-time fluorescence quantitative PCR instrument (Applied Biosystems, Foster City, CA, USA) for qRT-PCR. GAPDH was used as the internal normalization control, and the difference between the two groups was analyzed using the 2−ΔΔCt method. The primer sequences were as follows: ALDOA-mouse, forward: 5′-GGAACCAATGGCGAGACAACTACC-3′, reverse: 5′-GGCAAAGTCGGCTCCATCCTTC-3′; and GAPDH-mouse: forward: 5′-GGCAAATTCAACGGCACAGTCAAG-3′, reverse: 5′-TCGCTCCTGGAAGATGGTGATGG-3′.
2.10. Western blotting (WB) analysis
RIPA lysis buffer (P0013B; Beyotime Biotechnology, Shanghai, China) containing phenylmethanesulfonylfluoride (P0100; Solarbio Science & Technology Co., Ltd., Beijing, China) was used to extract the total protein from the remaining right upper lung tissue of mice. The supernatant was collected after centrifugation at 4°C at 12,000 rpm for 15 min, and the protein concentrations were determined by a BCA protein quantification kit (E112-02; Vazyme Biotech Co., Ltd.). The protein was denatured by loading buffer (FD002; Fude Biological Technology Co., Ltd., Hangzhou, Zhejiang, China) and separated by electrophoresis on 10% SDS-PAGE (E303-01; Vazyme Biotech Co., Ltd.) and transferred to 0.2-μm polyvinylidene fluoride membranes (ISEQ00010; Merck Millipore, Billerica, MA, USA). The membranes were blocked in Quick Block Liquid (P0252; Beyotime Biotechnology) at room temperature for 15 min. The block liquid was eluted with Tris-buffered saline containing 0.1% Tween 20 (v/v; TBST). Subsequently, the membranes were probed with primary antibodies (ALDOA rabbit polyclonal antibody, AF6189, 1:10,000 dilution; beta-tubulin rabbit monoclonal antibody, AF1216, 1:2,000 dilution; Beyotime Biotechnology) at 4°C overnight and incubated with the corresponding secondary antibody [horseradish peroxidase-labeled goat anti-rabbit IgG (H+L), A0208, 1:5,000 dilution; Beyotime Biotechnology] at room temperature for 2 h after elution with TBST. The immunoreactive bands were visualized using the hypersensitive ECL chemiluminescence kit (P0018S; Beyotime Biotechnology) and quantified on a Bio-Rad ChemiDoc XRS+ chemiluminescence gel imaging system with the Image Lab software (Bio-Rad Laboratories, Hercules, CA, USA).
2.11. Immunofluorescence (IF) staining
The paraffin blocks were sectioned and dewaxed. After antigen retrieval, the sections were incubated by primary antibody (ALDOA polyclonal antibody, 11217-1-AP, 1:200 dilution; Proteintech, Wuhan, Hubei, China) at 4°C overnight, washed three times with phosphate-buffered saline (PBS), and incubated with the secondary antibody [Goat anti-rabbit IgG (H+L) Fluor594-conjugated, S0006, 1:500 dilution; Affinity Biosciences] at room temperature, in the dark, for 1 h. Washed 3 times with PBS, the nuclei were stained using a DAPI staining kit (KGA215; KeyGEN BioTECH Co., Ltd., Nanjing, Jiangsu, China) at room temperature, in the dark, for 5 min. Next, the coverslips were mounted with an antifade mounting solution (Invitrogen, Carlsbad, CA, USA). Finally, sections were scanned with a digital pathological section scanner (Olympus VS200, Japan). The OlyVIA software was used to analyze the observed sections and randomly capture six images of non-overlapping visual fields at 200 × magnification from each sample. The fluorescence intensity of the positively stained cells was evaluated with the Image J software (National Institutes of Health).
2.12. Immunoprecipitation (IP)
IP kit (P2197M; Beyotime Biotechnology) was used to carry out the IP experiments according to the manufacturer's instructions. The protein was extracted from the lung tissue of mice with a lysis buffer containing protease inhibitor and deacetylase inhibitor (P1112; Beyotime Biotechnology). An appropriate amount of protein A+G agarose gel beads was incubated with the indicated antibody (11217-1-AP; Proteintech) at 50 μg/ml at room temperature for 1 h. Subsequently, the protein samples were added to the mixture and incubated at 4°C overnight. The supernatant was discarded, and the agarose beads were washed on ice with RIPA lysis buffer. The resulting immunoprecipitated complexes were denatured by loading buffer and analyzed by immunoblotting (primary antibody: pan acetyl-lysine rabbit polyclonal antibody, AF5632, 1:1,000 dilution; Beyotime Biotechnology; secondary antibody: A0208, 1:5,000 dilution; Beyotime Biotechnology). Next, the expression of ALDOA was visualized, and the immunoreactive bands were analyzed as described earlier.
2.13. Statistical analysis
qRT-PCR, WB, and IP were repeated at least three times. All data were processed using the SPSS software, version 23.0 (Chicago, IL, USA), and the results are presented as mean ± standard error of the mean (mean ± SEM). Two-group comparisons were analyzed using the Student's t-test. Wilcoxon rank-sum test was used to compare the results between the two groups and the Kruskal-Wallis test to determine the difference among groups. A p-value <0.05 indicated a statistically significant difference.
3. Results
3.1. The lung function of mice treated with cigarette smoke was impaired
The results of the pulmonary function test showed that FEV0.1 (1.611 ± 0.0447 ml, 0.9469 ± 0.0097 ml, p = 0.0001), FVC (1.757 ± 0.0514 ml, 1.349 ± 0.005 ml, p = 0.0014), and FEV0.1/FVC ratio (0.9174 ± 0.0016, 0.7023 ± 0.0056, p < 0.0001) decreased significantly in the CS group, while the differences in PEF (40.86 ± 1.815 ml/s, 38.1 ± 1.428 ml/s, p = 0.2969) and airway resistance (Rn; 0.2153 ± 0.0043 cmH2O.s/ml, 0.2589 ± 0.0228 cmH2O.s/ml, p = 0.1337) were not significant, the tissue damping (G; 3.804 ± 0.0927 cmH2O.s/ml, 3.227 ± 0.1582 cmH2O.s/ml, p = 0.0345), and tissue elastance (19.65 ± 0.6328 cmH2O.s/ml, 15.97 ± 0.3311 cmH2O.s/ml, p = 0.0068) of the CS group decreased significantly, indicating airflow restriction and impairment of lung tissue elasticity in the CS group (Figure 1, Supplementary Table 1).
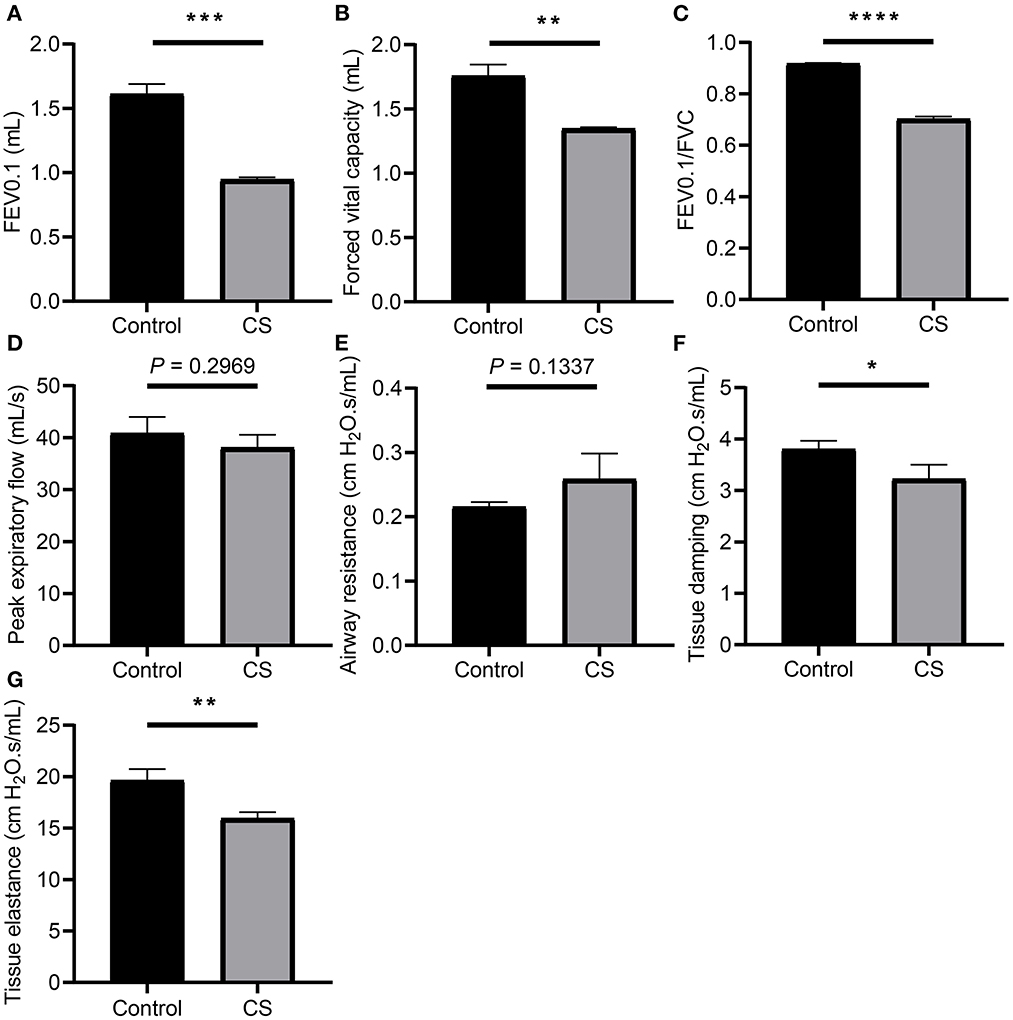
Figure 1. Lung function measurement of mice from cigarette smoke treatment group and control group. (A) Forced expiratory volume in 100 ms (FEV0.1). (B) Forced vital capacity (FVC). (C) Ratio of FEV10.1 to FVC. (D) Peak expiratory flow (PEF). (E) Airway resistance (Rn). (F) Tissue damping (G). (G) Tissue elastance (H). *p < 0.05, **p < 0.01, ***p < 0.001, and ****p < 0.0001.
3.2. Histopathological changes of lung tissue in mice treated with cigarette smoke
H&E staining showed that the alveolar cavities were larger, part of the alveolar septa were broken, alveolar cavities were fused, emphysema was formed (Figure 2A), and the MLI was significantly larger in the lung tissue of mice treated with cigarette smoke than in the control group (32.12 ± 0.8859 μm, 46.3 ± 0.7706 μm, p = 0.0003; Figure 2B).
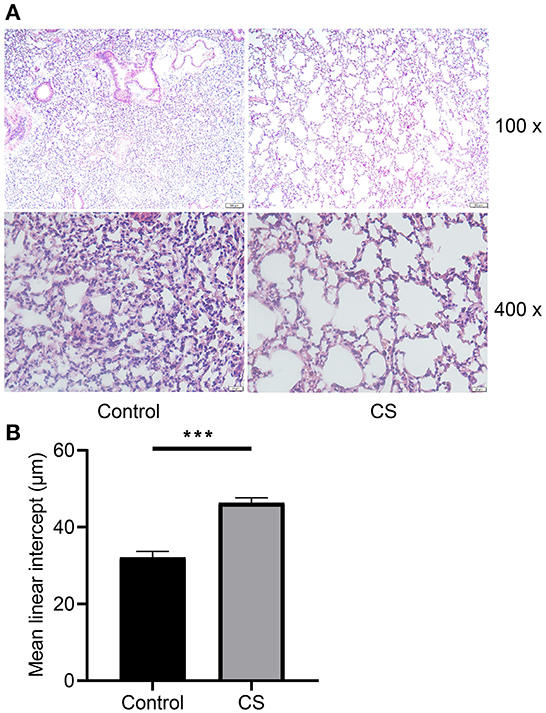
Figure 2. Histopathological analysis and morphometry of mouse lung tissues from cigarette smoke treatment group and control group. (A) Hematoxylin–eosin staining of mouse lung tissues from two groups. (B) Mean linear intercept of mice from two groups. ***p < 0.001.
3.3. Multi-omics associative analysis
3.3.1. Transcriptomics and proteomics associative analysis
A total of 23,024 transcripts and 6,153 proteins were quantified in the transcriptome and proteome, respectively. Out of these, 5,822 genes were quantified at both the transcriptome and proteome levels. Compared with the control group, 2,479 differentially expressed genes were defined in the transcriptome of the cigarette smoke treatment group, of which 553 were upregulated and 1,926 were downregulated. A total of 564 differentially expressed proteins were defined in proteomics, of which 188 were upregulated and 376 were downregulated (Figure 3A). As mentioned previously, genes and proteins differentially expressed in at least one omics were subdivided into eight groups according to the different trends (Supplementary Table 2). Among these, only 162 genes were differentially expressed with consistent trends at both the transcriptome and proteome levels (135 down-down, 27 up-up) and listed in Table 1 together with the number of genes in each group. The expression of genes quantified in both transcriptome and proteome was combined, drawn into a scatter diagram, and the correlation between the two omics data was calculated (R = 0.53; Figure 3B).
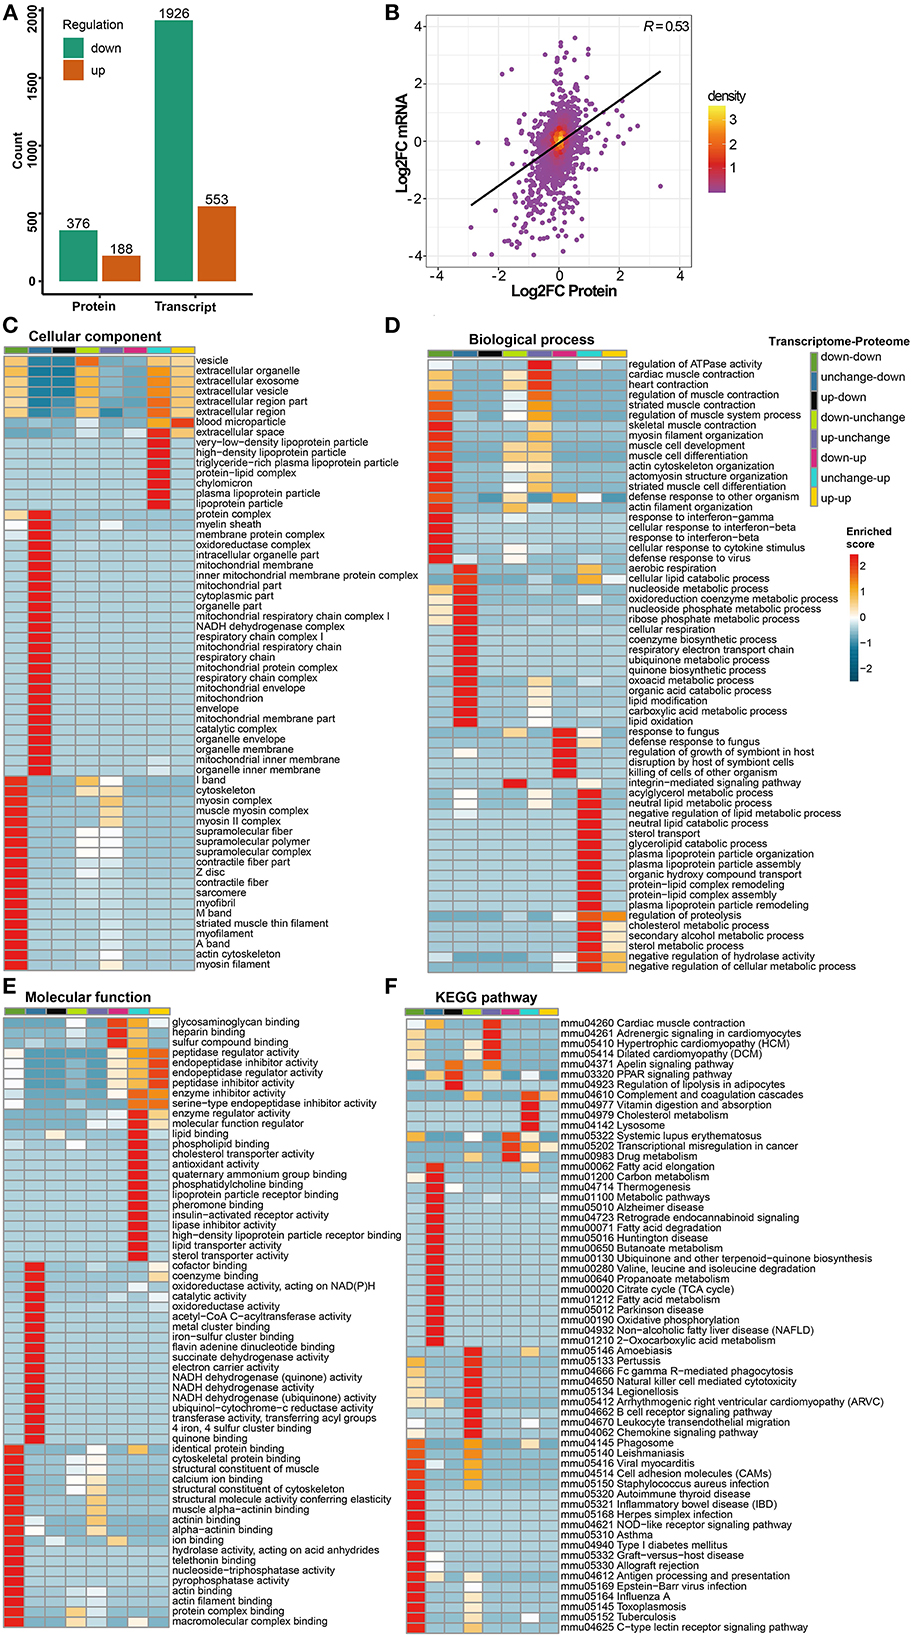
Figure 3. Transcriptomics and proteomics associative analysis. (A) Number of differentially expressed genes and proteins in transcriptome and proteome. Green means significantly downregulated genes and proteins, orange means significantly upregulated genes and proteins. (B) Scatterplot of transcript and its corresponding protein expression. The horizontal axis shows the protein expression and the vertical axis shows the transcript expression (convert to log2 ratio format), the color of the point indicates the density of the point, “R” means the correlation degree between transcriptome and proteome. (C–E) Transcriptomics and proteomics associative analysis based on GO functional enrichment. The color of the heat map indicates the p-value transformed by log10 and Z score, the redder color indicates that the enrichment is more significant. (F) Transcriptomics and proteomics associative analysis based on KEGG pathway enrichment. Similarly, the color of the heat map indicates the p-value transformed by log10 and z score, and the redder color indicates the more significant enrichment.
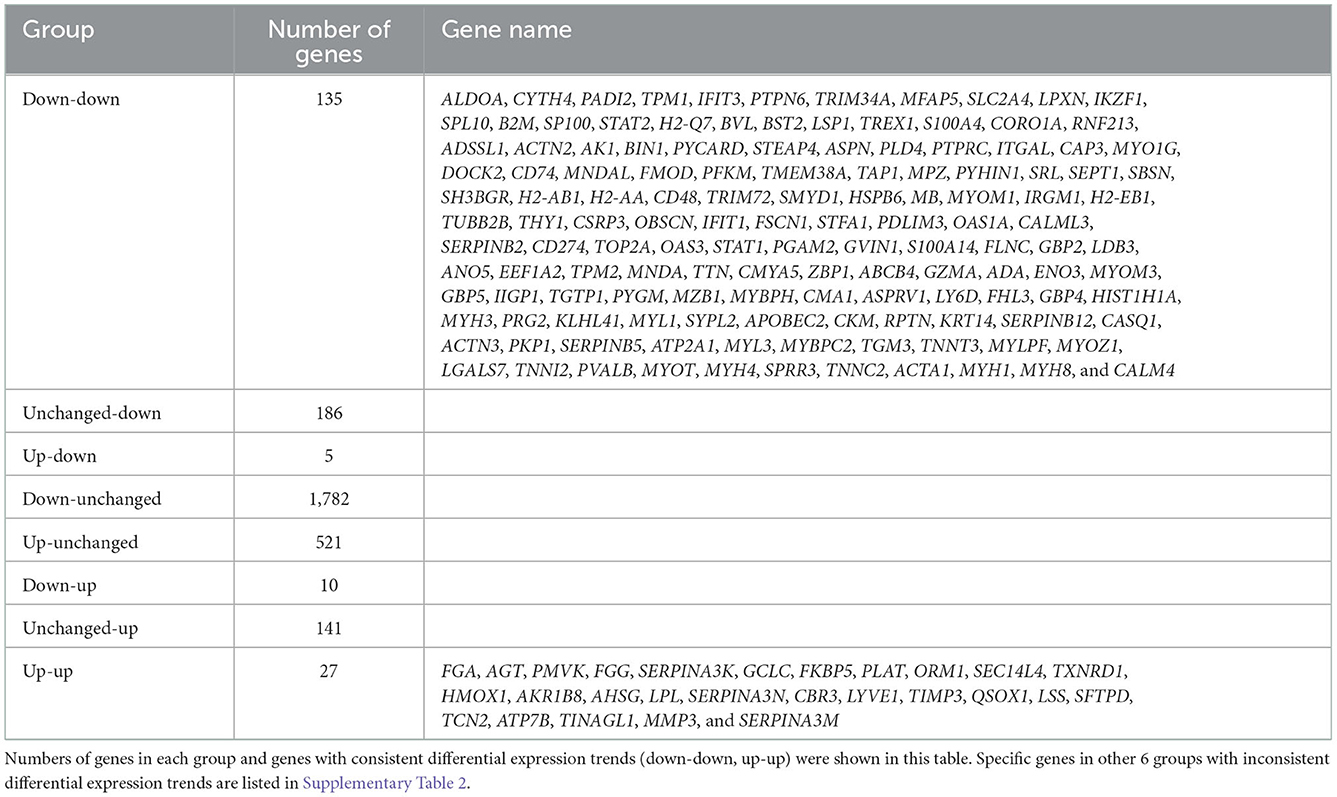
Table 1. Grouping according to types of difference trends between transcriptomics and proteomics.
In GO functional enrichment, the differential expression of transcriptomics and proteomics was mainly concentrated in groups of unchanged-down, down-down, and unchanged-up (Figures 3C–E). In the C-C dimension, differentially expressed genes and proteins were enriched in organelle components, such as mitochondria, especially the respiratory chain, in the unchanged-down group; the down-down group was mainly enriched in the components of skeletal muscle; the unchanged-up group was mainly enriched in lipoprotein particles and extracellular space (Figure 3C). In the B-P dimension, differentially expressed genes and proteins in the unchanged-down group were mainly enriched in the BPs related to the respiratory electron transport chain (ETC) and lipid metabolism; in response to infection, development, and differentiation of skeletal muscle in the down-down group; and in the biological processes related to lipid metabolism in the unchanged-up group (Figure 3D). In the M-F dimension, the differential expression was mainly enriched in the activity of respiratory chain-related enzymes and binding of related factors in the unchanged-down group; the binding of skeletal muscle-related factors in the down-down group; and in the activity of lipid metabolism-related enzymes and binding of related factors in the unchanged-up group. Interestingly, we enriched the pathways related to the activity and binding of peptidase and endopeptidase in the down-up group, which were related to proteolysis (Figure 3E).
In KEGG pathway enrichment, the differential expression of transcriptomics and proteomics were mainly concentrated in the down-down, unchanged-down, and down-unchanged groups (Figure 3F). In the down-down and down-unchanged groups, the pathways related to inflammation and immunity were mainly enriched, and in the unchanged-down group, the pathways related to fatty acid and amino acid metabolism, mitochondrial respiratory electron chain, and nervous system diseases were enriched. Additionally, we enriched the PPAR signaling pathway in the up-down group, the hypertrophic cardiomyopathy (HCM) in the up-unchanged group, the transcriptional dysregulation in cancer in the down-up group, and the complement and coagulation cascade in the unchanged-up group.
3.3.2. Acetylomics analysis
Among all the quantified proteins and acetylation modification sites, acetylomics identified 444 upregulated sites of 255 proteins and 89 downregulated sites of 62 proteins in the cigarette smoke treatment group compared with the control group (Figure 4A, Supplementary Table 3). The subcellular structure localization of proteins corresponding to differentially expressed acetylation modification sites was mainly the cytoplasm, mitochondria, nucleus, and extracellular (Figure 4B).
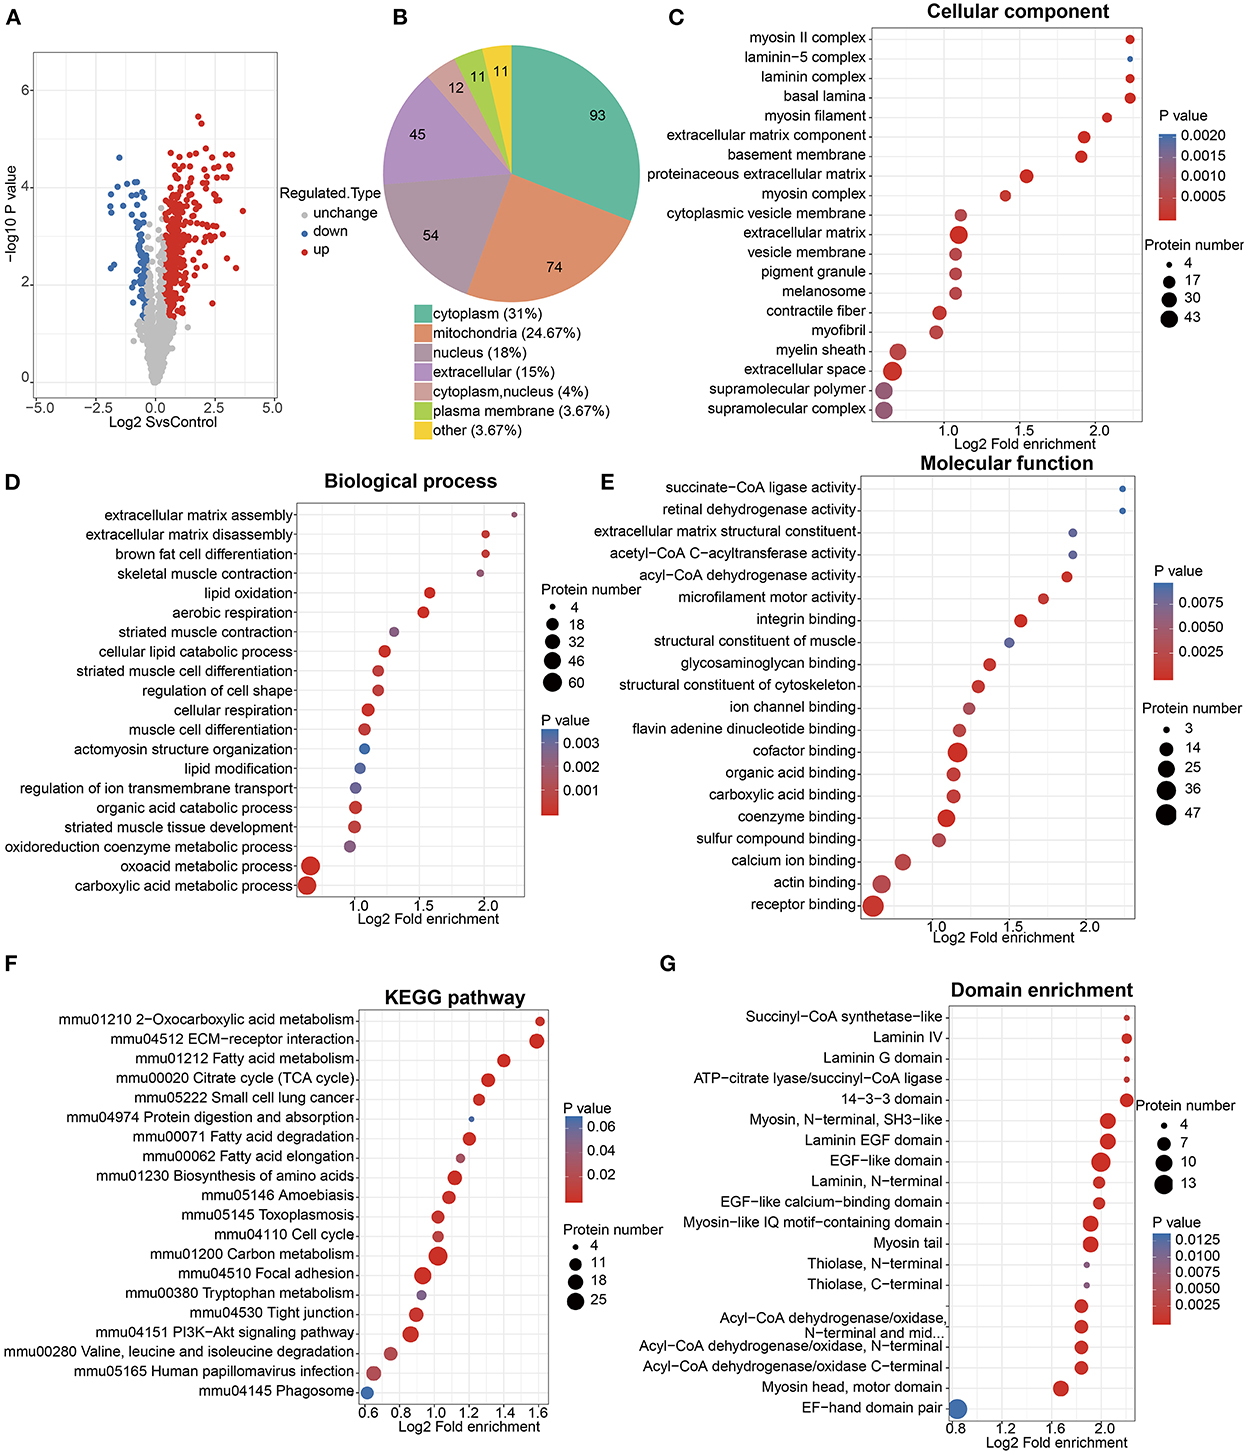
Figure 4. Acetylomics analysis. (A) Volcano map of acetylation modification sites differentially expressed between cigarette smoke treatment group and control group. The horizontal axis represents the differential expression between two groups (log2 format), and the vertical axis represents the significance of differential expression (p-value, log10 format), red dots represent significantly upregulated modification sites, while blue dots represent significantly downregulated modification sites. (B) Subcellular structural localization of proteins corresponding to differential acetylation modification sites. (C–E) GO functional enrichment of proteins corresponding to differential acetylation modification sites. The size of the circle represents the number of enriched proteins, and the color of the circle represents the significance of enrichment (p-value). (F) KEGG pathway enrichment of proteins corresponding to differential acetylation modification sites. The size of the circle represents the number of enriched proteins in each pathway, and the color of the circle represents the significance of enrichment (p-value). (G) Protein domain enrichment of proteins corresponding to differential acetylation modification sites. Similarly, the size of the circle represents the number of enriched proteins in each domain, and the color of the circle represents the significance of enrichment (p-value).
The GO functional enrichment showed that proteins corresponding to differential acetylation sites were mainly enriched in the cellular components such as extracellular space, extracellular matrix (ECM), basement membrane, contractile fiber, and myofibril; the biological processes related to fatty acid metabolism, cell respiration, and skeletal muscle; and the molecular functions of the bindings related to fatty acid metabolism and the enzymatic activity of acyl-CoA dehydrogenase (Figures 4C–E).
The KEGG pathway enrichment (Figure 4F) was mainly enriched in the citrate cycle (TCA cycle), fatty acid metabolism, amino acid metabolism, ECM-receptor interaction, focal adhesion, tight junction, and the Pl3k-Akt signaling pathway.
In addition, the protein domain enrichment of proteins corresponding to differential acetylation sites was mainly focused on laminin, epidermal growth factor (EGF), myosin, and acyl-CoA (Figure 4G).
3.3.3. Proteomics and acetylomics associative analysis
As described earlier, we collected 508 proteins and annotated them, proteins with high interaction confidence and “degree” were mainly enriched in pathways, such as oxidative phosphorylation (OXPHOS), fatty acid degradation, complement and coagulation cascade, and HCM (Figure 5, Supplementary Table 4). Interestingly, these four pathways were also significantly enriched in the associative analysis of transcriptomics and proteomics. Then, we intersected the 508 proteins with transcriptomics and proteomics data, and 19 genes were differentially expressed in transcriptomics, proteomics, and acetylomics simultaneously. In all, nine genes, namely, ENO3, PFKM, ALDOA, ACTN2, FGG, MYH3, MYH8, MYL1, and TTN, were involved in these four pathways, while the other 10 genes, namely, ACTA1, ATP2A1, CKM, CORO1A, EEF1A2, AKR1B8, MB, MYH1, MYLPF, and STAT1, were not involved in either of the pathways. Moreover, the associative analysis identified 35 genes differentially expressed in proteomics and acetylomics, but not in transcriptomics; of these, NDUFS1, NDUFA5, SDHA, and UQCRB were enriched in the OXPHOS pathway, while ACADV1, ETFA, HADHB, SUCLA2, ACADM, HADHA, ACADS, ACAT1, and ACAA2 were enriched in the fatty acid degradation pathway.
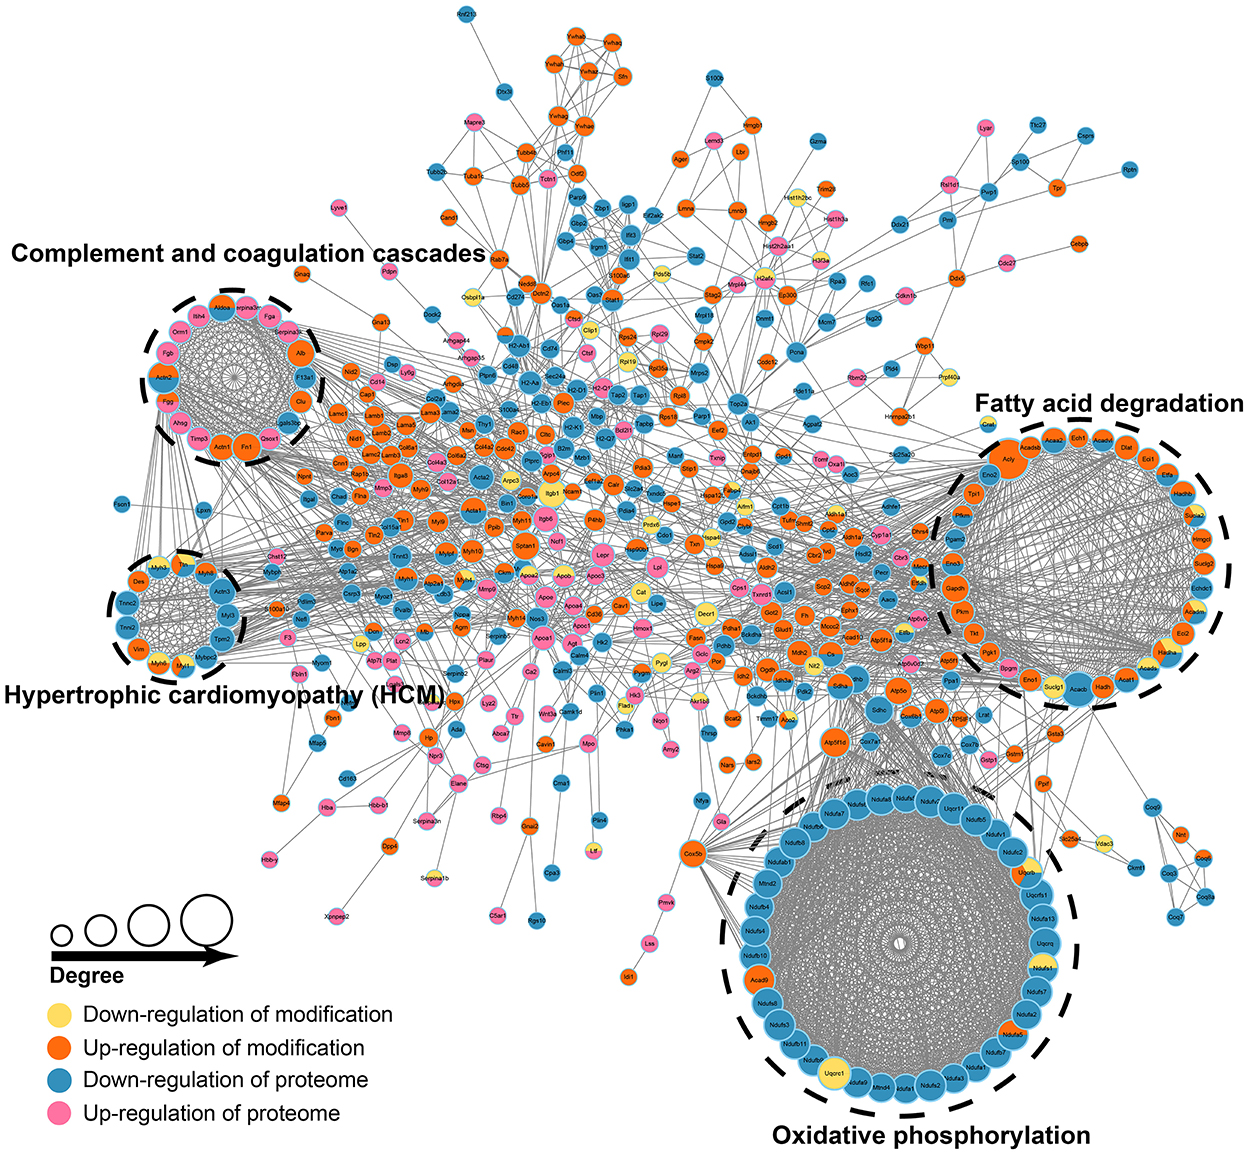
Figure 5. Proteomics and acetylomics associative analysis. The size of the circle represents the value of degree (number of proteins interacting with differentially expressed proteins), the larger the circle, the higher the degree. The colors of the circle represent up/downregulation in proteome and modification.
3.4. Single-cell RNA sequencing (scRNA-seq) analysis
According to the expression of representative biomarkers, we identified 14 cell subpopulations from scRNA-seq data (GSE136831; Figures 6A, B) and analyzed the distribution of the 19 genes mentioned in this data set (Supplementary Table 5). Among these genes, AKR1B8 is not expressed in Homo sapiens. The results showed that only ALDOA and CORO1A were differentially expressed in the lungs of COPD patients, which was consistent with the trend of the difference (downregulated) of our transcriptome data. In addition, both genes were downregulated in proteomics and upregulated in acetylomics. ALDOA was widely expressed in various cell subpopulations and downregulated in alveolar type 2 cells (AT2), goblet cells, B lymphocytes (B cell), natural killer cells (NK cells), and fibroblasts (Fibs; Figure 6C).
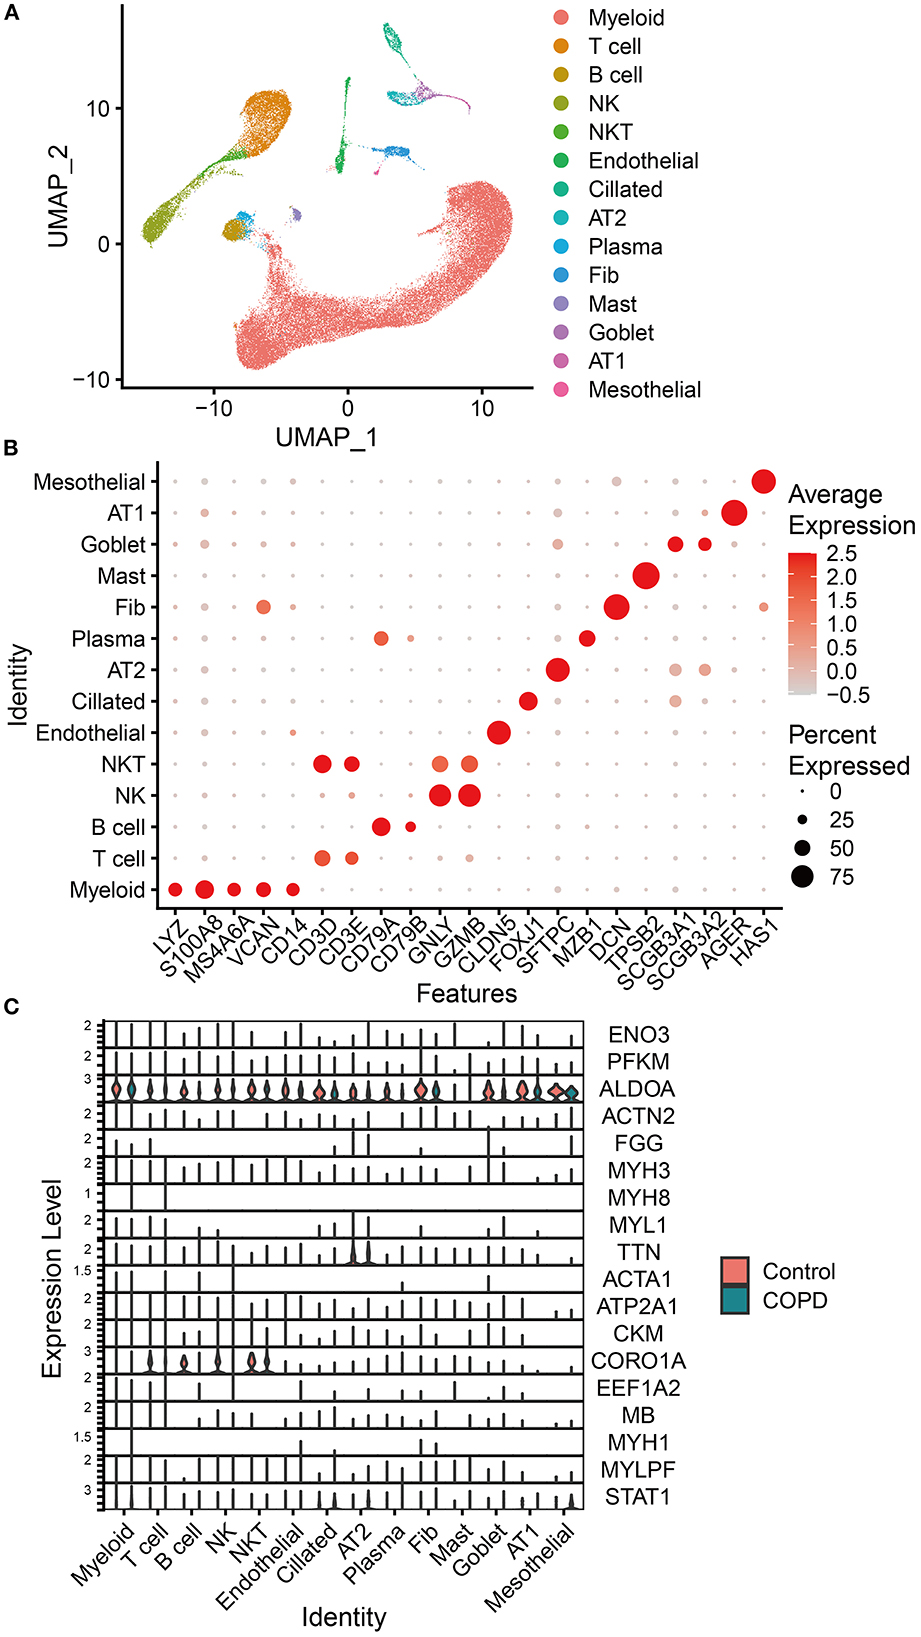
Figure 6. Analysis of scRNA-seq analysis data. (A) Uniform manifold approximation and projection (UMAP) of the distribution of different cell subpopulations. (B) Expression of classical biomarkers related to 14 cell subpopulations. (C) Distribution and expression of the 19 genes identified by associative analysis of multi-omics data in 14 cell subpopulations identified by analyzing scRNA-seq data of lung tissue from COPD patients and healthy humans. The orange violin plots represent the control group of healthy humans, and the green ones represent the group of patients with COPD. The height of violin plots represents the expression of genes, while the width represents the proportion of cells expressing these genes in cell subpopulations.
3.5. ALDOA was downregulated and hyperacetylated in the lung tissue of COPD mice
The results of qRT-PCR showed that ALODA mRNA expression in the lung tissue of mice from the COPD group was significantly downregulated (Figure 7A). Moreover, WB showed that the protein expression level of ALODA was reduced in the COPD group (Figure 7B). Consistently, IF showed that fluorescence staining of ALDOA in the COPD group was lower than that in the control group (Figure 7C). These results indicated that ALDOA was downregulated in the lung tissue of COPD mice. In addition, the calculation of the ratio of gray values of acetylated ALDOA and ALDOA by IP showed that the overall acetylation level of ALDOA in the lung tissue of COPD mice was increased, but not significant (p = 0.186; Figure 7D).
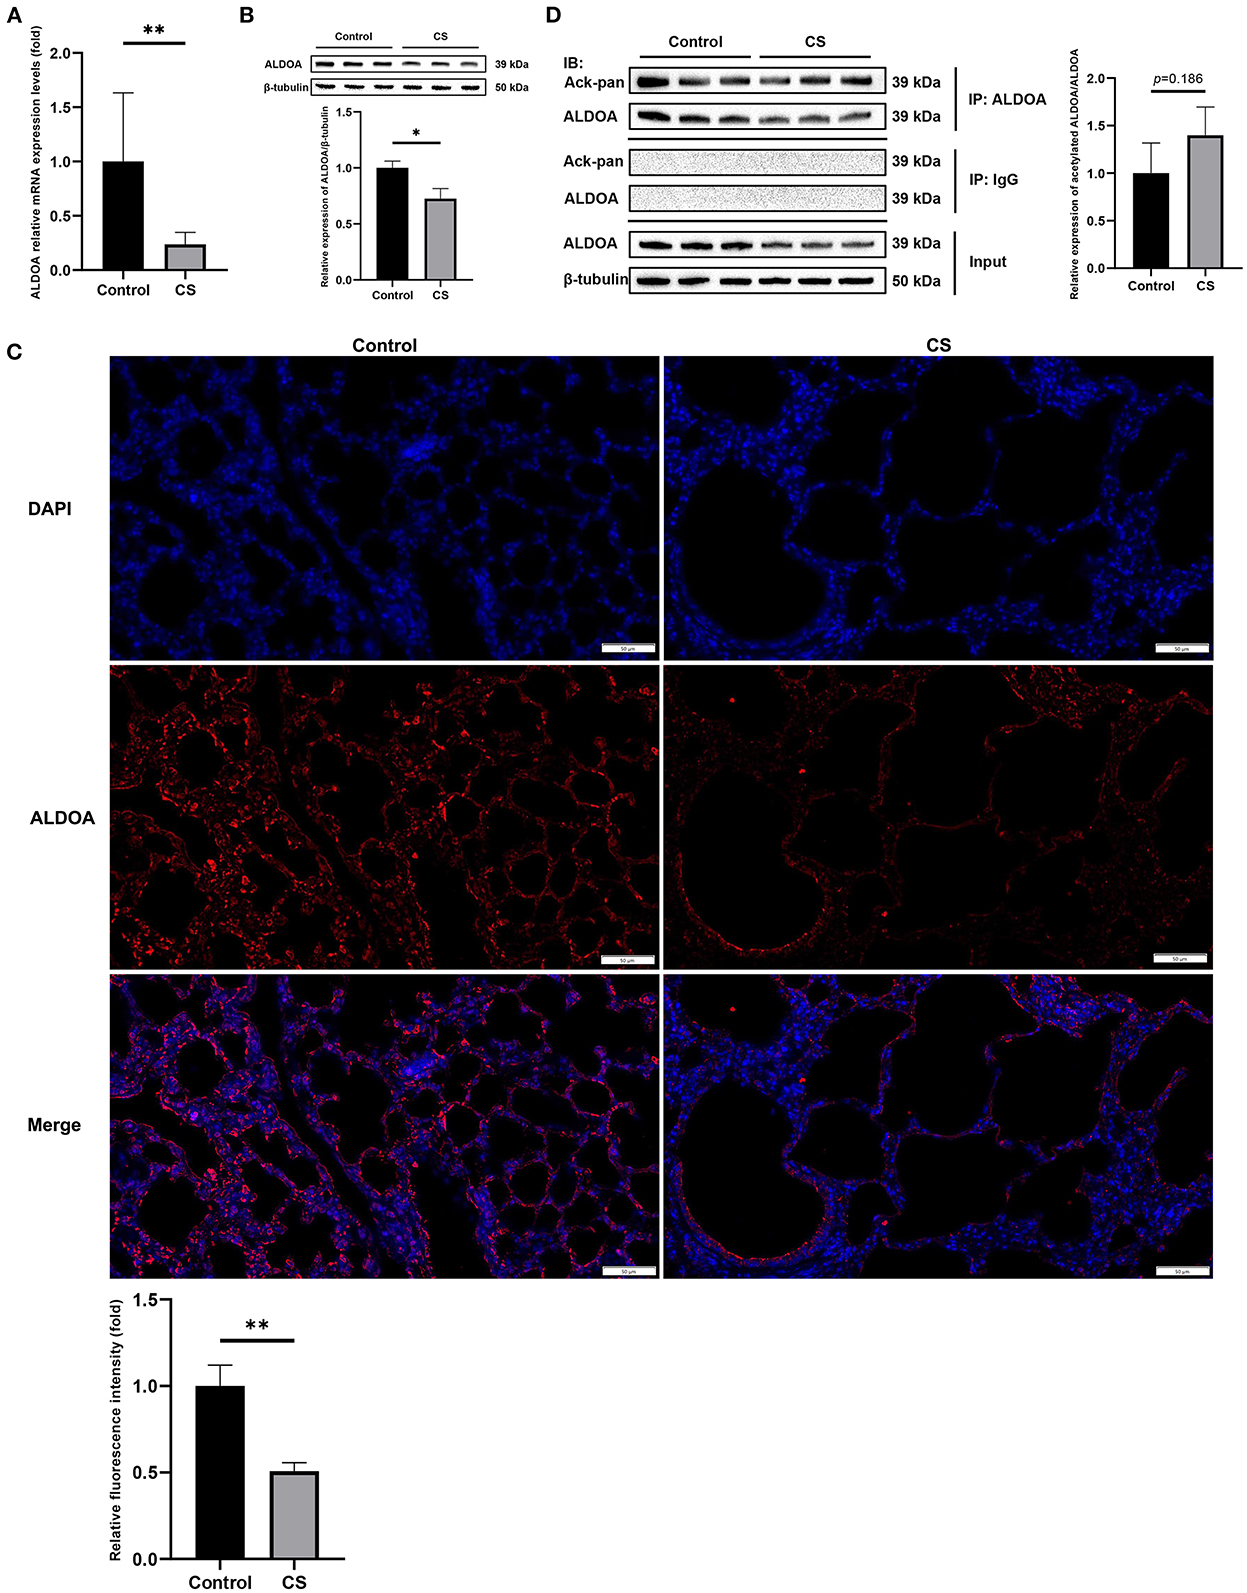
Figure 7. In vivo experimental verification of ALDOA. (A) The mRNA level of ALDOA in COPD mice lung tissue determined by qRT-PCR. (B) The protein expression level of ALDOA in lung tissue of mice with COPD determined and quantified by Western blot analysis. (C) IF staining of lung of COPD mice at 200× magnification, and the density quantified with Image J. (D) The acetylation level of ALDOA in lung tissue of mice with COPD determined and quantified by IP. *P < 0.05, **P < 0.01.
4. Discussion
The results of lung function measurement, H&E staining, and MLI showed that the model was reliable and credible. Although 2,479 differential genes and 564 differential proteins were defined, only 161 of these were differentially expressed at both the transcriptional and protein levels with a consistent trend, and the transcriptome and proteome were moderately correlated (R = 0.53). This phenomenon indicated that there were some potential regulatory mechanisms that led to an incomplete correspondence between transcription and protein expression, while the associative analysis was meaningful.
Transcriptomics and proteomics associative analysis showed that the differential expression of COPD mice induced by cigarette smoke was enriched in pathways related to the mitochondrion, energy metabolism, inflammation, immune regulation, and skeletal muscle. These pathways were closely related to COPD and extrapulmonary injury (42–46).
Our acetylomics data showed that the proteins in the lung tissue of COPD mice were mainly hyperacetylated and enriched in the pathways related to energy metabolism, mitochondrial function, ECM, and cell proliferation, and the differential acetylation sites were mainly distributed in the protein domains, such as laminin, EGF, and acyl-CoA. Laminin is a kind of non-collagenous glycoprotein, and polymerization of laminin is a key step in the basement membrane assembly (47). Basement membranes are ECMs for cell adhesion and can regulate the differentiation of cells and the maintenance of tissue structure (48). ECM is closely related to COPD, and ECM disorder can lead to lung tissue remodeling and aggravate and advance disease progression (49). The main components of the basement membrane include laminins, proteoglycans, and collagens (especially collagen IV), and EGF can stimulate the synthesis and secretion of collagen and regulate fibrin. Interestingly, we also found significant upregulation of acetylation modification of collagens, such as COL4A2, COL6A1, and COL6A2, in our acetylomics data and also enriched Pl3k-Akt signaling pathway through KEGG pathway enrichment. One study showed that the degradation and formation of collagen increased during the exacerbation of COPD (50). Another study revealed that collagen and laminin promote the proliferation, migration, and adhesion of airway smooth muscle cells in rats with COPD by upregulating the Pl3k-Akt signaling pathway (51). In addition, our data also identified the high acetylation modification of FGG (fibrinogen), which has the potential to predict the risk of COPD (52). These studies showed that ECMs were involved in the process of COPD, but whether it was related to their acetylation difference needs to be investigated further. Acyl-CoA dehydrogenase short chain (ACADS) may be a risk factor for COPD (53). Short chain acyl-CoA dehydrogenase (SCAD) is encoded by ACADS, and ACADS gene variants cause the mutation of SCAD, leading to mitochondrial damage and excessive production of reactive oxygen species (ROS) (54, 55). Our acetylomics data showed significant differences in acetylation modification in ACADS and ACADSB, but not in acetyl-CoA oxidase (ACOX); similarly, no study has yet assessed the correlation between ACOX and COPD, indicating that the differential acetylation of ACADS rather than ACOX may be involved in COPD.
The two most significant pathways enriched by proteomics and acetylomics associative analysis were oxidative phosphorylation (OXPHOS) and fatty acid degradation, both closely related to the function of the mitochondria. Several studies have proved that smoking-induced mitochondrial damage is one of the major mechanisms of COPD. The main features of mitochondrial damage are a decrease in the membrane potential and ATP production, excessive production of ROS, and decreased superoxide dismutase 2 (SOD2) in the mitochondria, which can cause inflammatory infiltration, damage to mitophagy, cell aging, and apoptosis (56–58). The mitochondrial dysfunction also reduced epithelial repair and corticosteroid responsiveness in the lung epithelium (44). Inflammatory mediators and ROS can also affect the structure and function of mitochondria sequentially in a vicious circle (59). Some studies showed that mitochondria DNA (mtDNA) in plasma and urine is associated with the severity and clinical phenotype of COPD (60, 61).
OXPHOS is composed of complexes I–V (CI–CV), which can form supercomplexes (SCs), such as the SC I+III2+IV, respirasome (62). Complex I (NADH-ubiquinone oxidoreductase) is essential for OXPHOS, participates in electron transfer and membrane potential generation, and provides electrons for respiration and ATP synthesis (63). Complex II consists of four subunits of SDHA-D, and studies have shown that complex II can directly and indirectly (during the reverse electron transfer [RET] through CI) participate in the generation of ROS (64–66); however, some other studies have shown that the loss of CII function increases the ROS (67, 68). Complex III (ubiquinol-cytochrome c oxidoreductase) also produces ROS (69). Most forms of SCs contain CIII, which, in turn, reduces the ROS formation at CI (62, 70), while the functional defect of CIII can reduce the stability of CI, CIV, and SCs and is related to the increase in ROS (71). The regulatory relationship between CIII and ROS is inconsistent, similar to CII. A previous study showed that nicotine inhibits myofibroblast through CIII with increased MitoROS, resulting in dysregulated repair during injurious responses (72). Complex IV (cytochrome c oxidase, COX) is the regulatory center of OXPHOS that can transfer reducing equivalents derived from CI or CII to free energy of oxidation through CIII and release electrochemical potential. This energy is used by the ATP synthase (CV) to synthesize ATP, and in turn, OXPHOS will be inhibited at a high ATP/ADP ratio (73). Moreover, COX is regulated by hypoxia (74) and isoforms of supernumerary subunits (75). Cloonan et al. showed that sustained expression of IRP2 increased the activity and expression of COX in the lung of mice, which led to mitochondrial dysfunction and the formation of COPD; thus, COX may be decisive for the regulation of mitochondrial iron in response to CS (76). In addition, complexes of the ETC also have different regulatory effects in immunity (77). Our proteomics and acetylomics associative analysis revealed the extensive differential expression of OXPHOS (mainly downregulation) and the differentially expressed acetylation modification in CI (NDUFS1, NDUFA5, and ACAD9), CII (SDHA), CIII (UQCRB and UQCRC1), CIV (COX5B and COX6B1), CV (ATP5F1, ATP5F1A, and ATP5F1D), and ATP synthase inhibitor, such as ATP5IF1. This finding suggested that the differential acetylation modification might play a critical role in the lung injury of COPD induced by cigarette smoke, although most of the OXPHOS-related proteins were not differentially expressed in our transcriptome data.
Fatty acid degradation is also closely related to mitochondria, and activated fatty acids can only be oxidized inside mitochondria and generate acetyl-coenzyme A. COPD can be accompanied by an imbalance of fatty acid metabolism in the lung, and metabolic reprogramming can also provide a feedback loop and regulate the progress of COPD; for example, by promoting inflammation and airway smooth muscle cell (ASMC) hyperplasia (43, 45, 78). Our proteomics and acetylomics associative analysis found extensive differential acetylation modification in the fatty acid degradation pathway, indicating that protein acetylation modification contributes to the interaction between fatty acid degradation and COPD. Among these, ENO3 and PFKM were differentially expressed in the three levels of transcription, protein, and acetylation. Nonetheless, we did not find any relevant study on the correlation between these two genes and COPD, although one study showed that ENO3 might be involved in lung injury caused by zinc chloride smoke (79).
Briefly, cigarette smoke can cause differential acetylation modification of proteins related to OXPHOS and fatty acid degradation, damage the electron transmission of the respiratory chain, and synthesize ATP, leading to the dysfunction of mitochondria of lung cells and promoting the formation and progress of COPD through a series of mechanisms as described earlier. Moreover, Zhang et al. and Guan et al. showed that SIRT3 and SIRT1 regulate the function of mitochondria of lung cells and inhibit oxidative stress, cell aging, apoptosis, and airway remodeling to reduce the lung injury of COPD induced by cigarette smoke (80, 81). Thus, regulating the acetylation modification sites of OXPHOS and fatty acid degradation-related proteins in this study may become a potential method of treating COPD.
Aldolase A (ALDOA) is a key enzyme of glycolysis, which can regulate metabolism and proliferation and is associated with the progression, immune infiltration, and prognosis of a variety of cancers, including lung cancer (82–84). ALDOA may be a biomarker to distinguish between lung cancer and COPD (85). Bai et al. revealed that ALDOA could limit mitochondrial autophagy and maintain NLRP3 inflammasome activity by controlling AMPK activation, leading to mitochondrial damage and inflammatory infiltration (86). This study showed that ALDOA was downregulated in the lung tissue of COPD; this might be a feedback regulation mechanism for mitochondrial damage and inflammation caused by cigarette smoke. Concurrently, both the omics data and the experimental verification results showed that the downregulation of ALDOA protein was not as obvious as at the transcriptional level, which might be insufficient to offset the inflammation and mitochondrial damage in the lung of COPD. Our acetylomics data showed that four lysine sites of ALDOA in the lung tissue of COPD mice were significantly hyperacetylated (147 K, log2 = 0.7338; 230 K, log2 = 0.5499; 14 K, log2 = 0.4957; 42 K, log2 = 0.4478). Consistently, IP showed that the proportion of acetylated ALDOA in the lung tissue of COPD mice was increased, although the results were not statistically significant. The phenomenon is not contradictory, and IP reflects the overall acetylation level of protein but cannot accurately measure the acetylation modification of each lysine site as LC-MS/MS. Nonetheless, hyperacetylation may affect the expression, structure, and function of ALDOA, which needs further exploration. Zhou et al. study showed that SIRT2 inhibition promoted the protein degradation of ALDOA (87), which supported our hypothesis, although whether this regulation was caused by the hyperacetylation of ALDOA directly caused by SIRT2 inhibition is yet to be clarified.
Nevertheless, the present study has some limitations. Multi-omics associative analyses of data of transcriptomics, proteomics, acetylomics, and scRNA-seq verified the differential expression of ALDOA in the lung tissue of COPD mice via in vivo qRT-PCR, WB, IF, and IP; however, the in vitro experiments are yet lacking. Therefore, an in-depth insight into the molecular and pathway mechanisms of COPD is required in the near future.
5. Conclusion
We carried out the multi-omics associative analysis of transcriptomics, proteomics, and acetylomics. The results proved that protein acetylation modification plays a critical role in the lungs of COPD mice and is mainly related to mitochondrial function and energy metabolism. We also identified some acetylated differentially expressed proteins related to COPD, such as ALDOA. Next, we preliminarily verified these genes by scRNA-seq analysis and understood their differential expression in the lung tissues of patients with COPD. Finally, we conducted an in vivo verification of the ALDOA expression in the lung tissue of COPD mice. These results suggested that the downregulation and hyperacetylation of ALDOA may be breakthrough points in the study of COPD. Moreover, our study showed that gene transcription and protein are not simple correspondences. Although there were some limitations, this study verified some previous findings and obtained new results. This finding indicated that multi-omics associative analysis has a unique efficacy in generating a new understanding of the classical mechanisms of diseases and identifying novel potential diagnostic and therapeutic targets through different data integration methods from traditional bioinformatics.
Data availability statement
The datasets presented in this study can be found in online repositories. The names of the repository/repositories and accession number(s) can be found in the article/ Supplementary material.
Ethics statement
The animal study was reviewed and approved by the Ethics Committee of the Clinical Medical College of Yangzhou University.
Author contributions
JGa, HL, and XW designed the research and edited and revised the manuscript. JGa, LW, and JGu performed the experiments. ZY and YL analyzed the scRNA-seq data. JGa interpreted results of experiments and scRNA-seq analysis. JGa and YW prepared the figures and supplementary tables. JGa drafted the manuscript. JY and ZC participated in discussions. LM and YS approved the final version of the manuscript. All authors contributed to the article and approved the submitted version.
Funding
This study was supported by the National Natural Science Foundation of China (No. 81870033) and the Technology Development Planning Projects of Jilin, China (No. 20200201372JC).
Conflict of interest
The authors declare that the research was conducted in the absence of any commercial or financial relationships that could be construed as a potential conflict of interest.
Publisher's note
All claims expressed in this article are solely those of the authors and do not necessarily represent those of their affiliated organizations, or those of the publisher, the editors and the reviewers. Any product that may be evaluated in this article, or claim that may be made by its manufacturer, is not guaranteed or endorsed by the publisher.
Supplementary material
The Supplementary Material for this article can be found online at: https://www.frontiersin.org/articles/10.3389/fmed.2022.1030644/full#supplementary-material
References
1. Global Initiative for Chronic Obstructive Lung Disease,. Global Strategy for the Diagnosis, Management Prevention of Chronic Obstructive Pulmonary Disease 2022 Report. (2022). Available online at: https://goldcopd.org/2022-gold-reports-2/ (accessed Januray 13, 2022).
2. Margham J, McAdam K, Cunningham A, Porter A, Fiebelkorn S, Mariner D, et al. The chemical complexity of e-cigarette aerosols compared with the smoke from a tobacco burning cigarette. Front Chem. (2021) 9:743060. doi: 10.3389/fchem.2021.743060
3. Wang M, Zhang Y, Xu M, Zhang H, Chen Y, Chung KF, et al. Roles of TRPA1 and TRPV1 in cigarette smoke -induced airway epithelial cell injury model. Free Radic Biol Med. (2019) 134:229–38. doi: 10.1016/j.freeradbiomed.2019.01.004
4. Zhang M, Tang J, Shan H, Zhang Q, Yang X, Zhang J, et al. p66Shc mediates mitochondrial dysfunction dependent on PKC activation in airway epithelial cells induced by cigarette smoke. Oxid Med Cell Longev. (2018) 2018:5837123. doi: 10.1155/2018/5837123
5. Hoffmann RF, Zarrintan S, Brandenburg SM, Kol A, de Bruin HG, Jafari S, et al. Prolonged cigarette smoke exposure alters mitochondrial structure and function in airway epithelial cells. Respir Res. (2013) 14:97. doi: 10.1186/1465-9921-14-97
6. Bodas M, Tran I, Vij N. Therapeutic strategies to correct proteostasis-imbalance in chronic obstructive lung diseases. Curr Mol Med. (2012) 12:807–14. doi: 10.2174/156652412801318809
7. Doherty DF, Nath S, Poon J, Foronjy RF, Ohlmeyer M, Dabo AJ, et al. Protein phosphatase 2A reduces cigarette smoke-induced cathepsin S and loss of lung function. Am J Respir Crit Care Med. (2019) 200:51–62. doi: 10.1164/rccm.201808-1518OC
8. Zhou JS, Li ZY, Xu XC, Zhao Y, Wang Y, Chen HP, et al. Cigarette smoke-initiated autoimmunity facilitates sensitisation to elastin-induced COPD-like pathologies in mice. Eur Respirat J. (2020) 56:404. doi: 10.1183/13993003.00404-2020
9. Yuan X, Chang CY, You R, Shan M, Gu BH, Madison MC, et al. Cigarette smoke-induced reduction of C1q promotes emphysema. JCI Insight. (2019) 5:124317. doi: 10.1172/jci.insight.124317
10. Vij N, Chandramani-Shivalingappa P, Van Westphal C, Hole R, Bodas M. Cigarette smoke-induced autophagy impairment accelerates lung aging, COPD-emphysema exacerbations and pathogenesis. Am J Physiol Cell Physiol. (2018) 314:C73–87. doi: 10.1152/ajpcell.00110.2016
11. Bagam P, Kaur G, Singh DP, Batra S. In vitro study of the role of FOXO transcription factors in regulating cigarette smoke extract-induced autophagy. Cell Biol Toxicol. (2021) 37:531–53. doi: 10.1007/s10565-020-09556-y
12. Zhang M, Fang L, Zhou L, Molino A, Valentino MR, Yang S, et al. MAPK15-ULK1 signaling regulates mitophagy of airway epithelial cell in chronic obstructive pulmonary disease. Free Radic Biol Med. (2021) 172:541–9. doi: 10.1016/j.freeradbiomed.2021.07.004
13. Amoresano A, Carpentieri A, Giangrande C, Palmese A, Chiappetta G, Marino G, et al. Technical advances in proteomics mass spectrometry: Identification of post-translational modifications. Clin Chem Lab Med. (2009) 47:647–65. doi: 10.1515/CCLM.2009.154
14. Cusack M, King HW, Spingardi P, Kessler BM, Klose RJ, Kriaucionis S. Distinct contributions of DNA methylation and histone acetylation to the genomic occupancy of transcription factors. Genome Res. (2020) 30:1393–406. doi: 10.1101/gr.257576.119
15. Narita T, Weinert BT, Choudhary C. Functions and mechanisms of non-histone protein acetylation. Nat Rev Mol Cell Biol. (2019) 20:156–74. doi: 10.1038/s41580-018-0081-3
16. Ito K, Ito M, Elliott WM, Cosio B, Caramori G, Kon OM, et al. Decreased histone deacetylase activity in chronic obstructive pulmonary disease. N Engl J Med. (2005) 352:1967–76. doi: 10.1056/NEJMoa041892
17. Barnes PJ, Adcock IM, Ito K. Histone acetylation and deacetylation: Importance in inflammatory lung diseases. Eur Respir J. (2005) 25:552–63. doi: 10.1183/09031936.05.00117504
18. Ahmad T, Sundar IK, Tormos AM, Lerner CA, Gerloff J, Yao H, et al. Shelterin telomere protection protein 1 reduction causes telomere attrition and cellular senescence via sirtuin 1 deacetylase in chronic obstructive pulmonary disease. Am J Respir Cell Mol Biol. (2017) 56:38–49. doi: 10.1165/rcmb.2016-0198OC
19. Shin NR, Ko JW, Kim JC, Park G, Kim SH, Kim MS, et al. Role of melatonin as an SIRT1 enhancer in chronic obstructive pulmonary disease induced by cigarette smoke. J Cell Mol Med. (2020) 24:1151–6. doi: 10.1111/jcmm.14816
20. Hedlund E, Deng Q. Single-cell RNA sequencing: Technical advancements and biological applications. Mol Aspects Med. (2018) 59:36–46. doi: 10.1016/j.mam.2017.07.003
21. Kim W, Prokopenko D, Sakornsakolpat P, Hobbs BD, Lutz SM, Hokanson JE, et al. Genome-wide gene-by-smoking interaction study of chronic obstructive pulmonary disease. Am J Epidemiol. (2021) 190:875–85. doi: 10.1093/aje/kwaa227
22. Casas-Recasens S, Noell G, Mendoza N, Lopez-Giraldo A, Garcia T, Guirao A, et al. Lung DNA methylation in chronic obstructive pulmonary disease: Relationship with smoking status and airflow limitation severity. Am J Respir Crit Care Med. (2021) 203:129–34. doi: 10.1164/rccm.201912-2420LE
23. Moll M, Boueiz A, Ghosh AJ, Saferali A, Lee S, Xu Z, et al. Development of a blood-based transcriptional risk score for chronic obstructive pulmonary disease. Am J Respir Crit Care Med. (2022) 205:161–70. doi: 10.1164/rccm.202107-1584OC
24. Han L, Wang J, Ji XB, Wang ZY, Wang Y, Zhang LY, et al. Transcriptomics analysis identifies the presence of upregulated ribosomal housekeeping genes in the alveolar macrophages of patients with smoking-induced chronic obstructive pulmonary disease. Int J Chron Obstruct Pulmon Dis. (2021) 16:2653–64. doi: 10.2147/COPD.S313252
25. Skerrett-Byrne DA, Bromfield EG, Murray HC, Jamaluddin MFB, Jarnicki AG, Fricker M, et al. Time-resolved proteomic profiling of cigarette smoke-induced experimental chronic obstructive pulmonary disease. Respirology. (2021) 26:960–73. doi: 10.1111/resp.14111
26. Zhang YH, Hoopmann MR, Castaldi PJ, Simonsen KA, Midha MK, Cho MH, et al. Lung proteomic biomarkers associated with chronic obstructive pulmonary disease. Am J Physiol Lung Cell Mol Physiol. (2021) 321:L1119–l30. doi: 10.1152/ajplung.00198.2021
27. Fuschillo S, Paris D, Tramice A, Ambrosino P, Palomba L, Maniscalco M, et al. Metabolomic profiling of exhaled breath condensate and plasma/serum in chronic obstructive pulmonary disease. Curr Med Chem. (2021) 2021:929867328666210810122350. doi: 10.2174/0929867328666210810122350
28. Kim DJ, Oh JY, Rhee CK, Park SJ, Shim JJ, Cho JY. Metabolic fingerprinting uncovers the distinction between the phenotypes of tuberculosis associated COPD and smoking-induced COPD. Front Med. (2021) 8:619077. doi: 10.3389/fmed.2021.619077
29. Li X, Noell G, Tabib T, Gregory AD, Trejo Bittar HE, Vats R, et al. Single cell RNA sequencing identifies IGFBP5 and QKI as ciliated epithelial cell genes associated with severe COPD. Respir Res. (2021) 22:100. doi: 10.1186/s12931-021-01675-2
30. Sauler M, McDonough JE, Adams TS, Kothapalli N, Barnthaler T, Werder RB, et al. Characterization of the COPD alveolar niche using single-cell RNA sequencing. Nat Commun. (2022) 13:494. doi: 10.1038/s41467-022-28062-9
31. Liu Y, Beyer A, Aebersold R. On the dependency of cellular protein levels on mRNA abundance. Cell. (2016) 165:535–50. doi: 10.1016/j.cell.2016.03.014
32. Buccitelli C, Selbach M. mRNAs, proteins and the emerging principles of gene expression control. Nat Rev Genet. (2020) 21:630–44. doi: 10.1038/s41576-020-0258-4
33. Longo SK, Guo MG Ji AL, Khavari PA. Integrating single-cell and spatial transcriptomics to elucidate intercellular tissue dynamics. Nat Rev Genet. (2021) 22:627–44. doi: 10.1038/s41576-021-00370-8
34. Liu Z, Li W, Lv J, Xie R, Huang H, Li Y, et al. Identification of potential COPD genes based on multi-omics data at the functional level. Mol Biosyst. (2016) 12:191–204. doi: 10.1039/C5MB00577A
35. Gillenwater LA, Helmi S, Stene E, Pratte KA, Zhuang Y, Schuyler RP, et al. Multi-omics subtyping pipeline for chronic obstructive pulmonary disease. PLoS ONE. (2021) 16:e0255337. doi: 10.1371/journal.pone.0255337
36. Li CX, Wheelock CE, Sköld CM, Wheelock ÅM. Integration of multi-omics datasets enables molecular classification of COPD. Eur Respirat J. (2018) 51:1930. doi: 10.1183/13993003.01930-2017
37. Lai HC, Lin TL, Chen TW, Kuo YL, Chang CJ, Wu TR, et al. Gut microbiota modulates COPD pathogenesis: role of anti-inflammatory Parabacteroides goldsteinii lipopolysaccharide. Gut. (2022) 71:309–21. doi: 10.1136/gutjnl-2020-322599
38. Pei Y, Wei Y, Peng B, Wang M, Xu W, Chen Z, et al. Combining single-cell RNA sequencing of peripheral blood mononuclear cells and exosomal transcriptome to reveal the cellular and genetic profiles in COPD. Respir Res. (2022) 23:260. doi: 10.1186/s12931-022-02182-8
39. Horvat JC, Starkey MR, Kim RY, Phipps S, Gibson PG, Beagley KW, et al. Early-life chlamydial lung infection enhances allergic airways disease through age-dependent differences in immunopathology. J Allergy Clin Immunol. (2010) 125:617–25. doi: 10.1016/j.jaci.2009.10.018
40. Wang L, Feng Z, Wang X, Wang X, Zhang X. DEGseq: An R package for identifying differentially expressed genes from RNA-seq data. Bioinformatics. (2010) 26:136–8. doi: 10.1093/bioinformatics/btp612
41. Adams TS, Schupp JC, Poli S, Ayaub EA, Neumark N, Ahangari F, et al. Single-cell RNA-seq reveals ectopic and aberrant lung-resident cell populations in idiopathic pulmonary fibrosis. Sci Adv. (2020) 6:eaba1983. doi: 10.1126/sciadv.aba1983
42. Kosmider B, Lin CR, Karim L, Tomar D, Vlasenko L, Marchetti N, et al. Mitochondrial dysfunction in human primary alveolar type II cells in emphysema. EBioMedicine. (2019) 46:305–16. doi: 10.1016/j.ebiom.2019.07.063
43. Michaeloudes C, Kuo CH, Haji G, Finch DK, Halayko AJ, Kirkham P, et al. Metabolic re-patterning in COPD airway smooth muscle cells. Eur Respirat J. (2017) 50:202. doi: 10.1183/13993003.00202-2017
44. Hoffmann RF, Jonker MR, Brandenburg SM, de Bruin HG, Ten Hacken NHT, van Oosterhout AJM, et al. Mitochondrial dysfunction increases pro-inflammatory cytokine production and impairs repair and corticosteroid responsiveness in lung epithelium. Sci Rep. (2019) 9:15047. doi: 10.1038/s41598-019-51517-x
45. Agarwal AR, Kadam S, Brahme A, Agrawal M, Apte K, Narke G, et al. Systemic immuno-metabolic alterations in chronic obstructive pulmonary disease (COPD). Respir Res. (2019) 20:171. doi: 10.1186/s12931-019-1139-2
46. Adami A, Corvino RB, Calmelat RA, Porszasz J, Casaburi R, Rossiter HB. Muscle oxidative capacity is reduced in both upper and lower limbs in COPD. Med Sci Sports Exerc. (2020) 52:2061–8. doi: 10.1249/MSS.0000000000002364
47. McKee KK, Hohenester E, Aleksandrova M, Yurchenco PD. Organization of the laminin polymer node. Matrix Biol. (2021) 98:49–63. doi: 10.1016/j.matbio.2021.05.004
48. Karamanos NK, Theocharis AD, Piperigkou Z, Manou D, Passi A, Skandalis SS, et al. A guide to the composition and functions of the extracellular matrix. FEBS J. (2021) 288:6850–912. doi: 10.1111/febs.15776
49. Hussell T, Lui S, Jagger C, Morgan D, Brand O. The consequence of matrix dysfunction on lung immunity and the microbiome in COPD. Eur Respirat Rev. (2018) 27:32. doi: 10.1183/16000617.0032-2018
50. Schumann DM, Leeming D, Papakonstantinou E, Blasi F, Kostikas K, Boersma W, et al. Collagen degradation and formation are elevated in exacerbated COPD compared with stable disease. Chest. (2018) 154:798–807. doi: 10.1016/j.chest.2018.06.028
51. Wang Z, Li R, Zhong R. Extracellular matrix promotes proliferation, migration and adhesion of airway smooth muscle cells in a rat model of chronic obstructive pulmonary disease via upregulation of the PI3K/AKT signaling pathway. Mol Med Rep. (2018) 18:3143–52. doi: 10.3892/mmr.2018.9320
52. Yu H, Guo W, Liu Y, Wang Y. Immune characteristics analysis and transcriptional regulation prediction based on gene signatures of chronic obstructive pulmonary disease. Int J Chron Obstruct Pulmon Dis. (2021) 16:3027–39. doi: 10.2147/COPD.S325328
53. Yuan Y, Yang S, Deng D, Chen Y, Zhang C, Zhou R, et al. Effects of genetic variations in Acads gene on the risk of chronic obstructive pulmonary disease. IUBMB Life. (2020) 72:1986–96. doi: 10.1002/iub.2336
54. Tonin R, Caciotti A, Funghini S, Pasquini E, Mooney SD, Cai B, et al. Clinical relevance of short-chain acyl-CoA dehydrogenase (SCAD) deficiency: Exploring the role of new variants including the first SCAD-disease-causing allele carrying a synonymous mutation. BBA Clin. (2016) 5:114–9. doi: 10.1016/j.bbacli.2016.03.004
55. Schmidt SP, Corydon TJ, Pedersen CB, Bross P, Gregersen N. Misfolding of short-chain acyl-CoA dehydrogenase leads to mitochondrial fission and oxidative stress. Mol Genet Metab. (2010) 100:155–62. doi: 10.1016/j.ymgme.2010.03.009
56. Mahalanobish S, Dutta S, Saha S, Sil PC. Melatonin induced suppression of ER stress and mitochondrial dysfunction inhibited NLRP3 inflammasome activation in COPD mice. Food Chem Toxicol. (2020) 144:111588. doi: 10.1016/j.fct.2020.111588
57. Araya J, Tsubouchi K, Sato N, Ito S, Minagawa S, Hara H, et al. PRKN-regulated mitophagy and cellular senescence during COPD pathogenesis. Autophagy. (2019) 15:510–26. doi: 10.1080/15548627.2018.1532259
58. Haji G, Wiegman CH, Michaeloudes C, Patel MS, Curtis K, Bhavsar P, et al. Mitochondrial dysfunction in airways and quadriceps muscle of patients with chronic obstructive pulmonary disease. Respir Res. (2020) 21:262. doi: 10.1186/s12931-020-01527-5
59. Prakash YS, Pabelick CM, Sieck GC. Mitochondrial dysfunction in airway disease. Chest. (2017) 152:618–26. doi: 10.1016/j.chest.2017.03.020
60. Zhang WZ, Hoffman KL, Schiffer KT, Oromendia C, Rice MC, Barjaktarevic I, et al. Association of plasma mitochondrial DNA with COPD severity and progression in the SPIROMICS cohort. Respir Res. (2021) 22:126. doi: 10.1186/s12931-021-01707-x
61. Zhang WZ, Rice MC, Hoffman KL, Oromendia C, Barjaktarevic IZ, Wells JM, et al. Association of urine mitochondrial DNA with clinical measures of COPD in the SPIROMICS cohort. JCI Insight. (2020) 5:133984. doi: 10.1172/jci.insight.133984
62. Letts JA, Sazanov LA. Clarifying the supercomplex: The higher-order organization of the mitochondrial electron transport chain. Nat Struct Mol Biol. (2017) 24:800–8. doi: 10.1038/nsmb.3460
63. Vinothkumar KR, Zhu J, Hirst J. Architecture of mammalian respiratory complex I. Nature. (2014) 515:80–4. doi: 10.1038/nature13686
64. Quinlan CL, Orr AL, Perevoshchikova IV, Treberg JR, Ackrell BA, Brand MD. Mitochondrial complex II can generate reactive oxygen species at high rates in both the forward and reverse reactions. J Biol Chem. (2012) 287:27255–64. doi: 10.1074/jbc.M112.374629
65. Liu Y, Fiskum G, Schubert D. Generation of reactive oxygen species by the mitochondrial electron transport chain. J Neurochem. (2002) 80:780–7. doi: 10.1046/j.0022-3042.2002.00744.x
66. Muller FL, Liu Y, Abdul-Ghani MA, Lustgarten MS, Bhattacharya A, Jang YC, et al. High rates of superoxide production in skeletal-muscle mitochondria respiring on both complex I- and complex II-linked substrates. Biochem J. (2008) 409:491–9. doi: 10.1042/BJ20071162
67. Ishii T, Miyazawa M, Onodera A, Yasuda K, Kawabe N, Kirinashizawa M, et al. Mitochondrial reactive oxygen species generation by the SDHC V69E mutation causes low birth weight and neonatal growth retardation. Mitochondrion. (2011) 11:155–65. doi: 10.1016/j.mito.2010.09.006
68. Guzy RD, Sharma B, Bell E, Chandel NS, Schumacker PT. Loss of the SdhB, but Not the SdhA, subunit of complex II triggers reactive oxygen species -dependent hypoxia-inducible factor activation and tumorigenesis. Mol Cell Biol. (2008) 28:718–31. doi: 10.1128/MCB.01338-07
69. Muller FL, Liu Y, Van Remmen H. Complex III releases superoxide to both sides of the inner mitochondrial membrane. J Biol Chem. (2004) 279:49064–73. doi: 10.1074/jbc.M407715200
70. Maranzana E, Barbero G, Falasca AI, Lenaz G, Genova ML. Mitochondrial respiratory supercomplex association limits production of reactive oxygen species from complex I. Antioxid Redox Signal. (2013) 19:1469–80. doi: 10.1089/ars.2012.4845
71. Diaz F, Enríquez JA, Moraes CT. Cells lacking Rieske iron-sulfur protein have a reactive oxygen species-associated decrease in respiratory complexes I and IV. Mol Cell Biol. (2012) 32:415–29. doi: 10.1128/MCB.06051-11
72. Lei W, Lerner C, Sundar IK, Rahman I. Myofibroblast differentiation and its functional properties are inhibited by nicotine and e-cigarette via mitochondrial OXPHOS complex III. Sci Rep. (2017) 7:43213. doi: 10.1038/srep43213
73. Kadenbach B. Complex IV - The regulatory center of mitochondrial oxidative phosphorylation. Mitochondrion. (2021) 58:296–302. doi: 10.1016/j.mito.2020.10.004
74. Fukuda R, Zhang H, Kim JW, Shimoda L, Dang CV, Semenza GL. HIF-1 regulates cytochrome oxidase subunits to optimize efficiency of respiration in hypoxic cells. Cell. (2007) 129:111–22. doi: 10.1016/j.cell.2007.01.047
75. Sinkler CA, Kalpage H, Shay J, Lee I, Malek MH, Grossman LI, et al. Tissue- and condition-specific isoforms of mammalian cytochrome c oxidase subunits: From function to human disease. Oxid Med Cell Longev. (2017) 2017:1534056. doi: 10.1155/2017/1534056
76. Cloonan SM, Glass K, Laucho-Contreras ME, Bhashyam AR, Cervo M, Pabón MA, et al. Mitochondrial iron chelation ameliorates cigarette smoke-induced bronchitis and emphysema in mice. Nat Med. (2016) 22:163–74. doi: 10.1038/nm.4021
77. Yin M, O'Neill LAJ. The role of the electron transport chain in immunity. FASEB J. (2021) 35:e21974. doi: 10.1096/fj.202101161R
78. Kotlyarov S, Kotlyarova A. Anti-inflammatory function of fatty acids and involvement of their metabolites in the resolution of inflammation in chronic obstructive pulmonary disease. Int J Mol Sci. (2021) 22:2312803. doi: 10.3390/ijms222312803
79. Xie X, Zhao J, Xie L, Wang H, Xiao Y, She Y, et al. Identification of differentially expressed proteins in the injured lung from zinc chloride smoke inhalation based on proteomics analysis. Respir Res. (2019) 20:36. doi: 10.1186/s12931-019-0995-0
80. Zhang M, Zhang Y, Roth M, Zhang L, Shi R, Yang X, et al. Sirtuin 3 inhibits airway epithelial mitochondrial oxidative stress in cigarette smoke-induced COPD. Oxid Med Cell Longev. (2020) 2020:7582980. doi: 10.1155/2020/7582980
81. Guan R, Wang J, Cai Z, Li Z, Wang L, Li Y, et al. Hydrogen sulfide attenuates cigarette smoke-induced airway remodeling by upregulating SIRT1 signaling pathway. Redox Biol. (2020) 28:101356. doi: 10.1016/j.redox.2019.101356
82. Lu G, Shi W, Zhang Y. Prognostic implications and immune infiltration analysis of ALDOA in lung adenocarcinoma. Front Genet. (2021) 12:721021. doi: 10.3389/fgene.2021.721021
83. Chang YC, Chan YC, Chang WM, Lin YF, Yang CJ, Su CY, et al. Feedback regulation of ALDOA activates the HIF-1α/MMP9 axis to promote lung cancer progression. Cancer Lett. (2017) 403:28–36. doi: 10.1016/j.canlet.2017.06.001
84. Fu H, Gao H, Qi X, Zhao L, Wu D, Bai Y, et al. Aldolase A promotes proliferation and G(1)/S transition via the EGFR/MAPK pathway in non-small cell lung cancer. Cancer Commun. (2018) 38:18. doi: 10.1186/s40880-018-0290-3
85. Pastor MD, Nogal A, Molina-Pinelo S, Meléndez R, Salinas A, González De la Peña M, et al. Identification of proteomic signatures associated with lung cancer and COPD. J Proteom. (2013) 89:227–37. doi: 10.1016/j.jprot.2013.04.037
86. Bai D, Du J, Bu X, Cao W, Sun T, Zhao J, et al. ALDOA maintains NLRP3 inflammasome activation by controlling AMPK activation. Autophagy. (2021) 2021:1997051. doi: 10.1080/15548627.2021.1997051
Keywords: COPD, transcriptomics, proteomics, acetylomics, multi-omics associative analysis, single-cell RNA sequencing
Citation: Gao J, Liu H, Wang X, Wang L, Gu J, Wang Y, Yang Z, Liu Y, Yang J, Cai Z, Shu Y and Min L (2023) Associative analysis of multi-omics data indicates that acetylation modification is widely involved in cigarette smoke-induced chronic obstructive pulmonary disease. Front. Med. 9:1030644. doi: 10.3389/fmed.2022.1030644
Received: 29 August 2022; Accepted: 22 December 2022;
Published: 12 January 2023.
Edited by:
Harry Karmouty Quintana, University of Texas Health Science Center at Houston, United StatesReviewed by:
Pornngarm Dejkriengkraikul, Chiang Mai University, ThailandLisandra Vila Ellis, University of Texas MD Anderson Cancer Center, United States
Copyright © 2023 Gao, Liu, Wang, Wang, Gu, Wang, Yang, Liu, Yang, Cai, Shu and Min. This is an open-access article distributed under the terms of the Creative Commons Attribution License (CC BY). The use, distribution or reproduction in other forums is permitted, provided the original author(s) and the copyright owner(s) are credited and that the original publication in this journal is cited, in accordance with accepted academic practice. No use, distribution or reproduction is permitted which does not comply with these terms.
*Correspondence: Lingfeng Min,  bWlubGluZ2ZlbmdAMTI2LmNvbQ==; Yusheng Shu, MTgwNTEwNjE5OTlAeXp1LmVkdS5jbg==
†These authors have contributed equally to this work and share first authorship