 Eleonora De Martino1
 Ilaria Gandin2
 Eros Azzalini1Cesare Massone3Maria Antonietta Pizzichetta1,4Erika Giulioni5Sanja Javor6Caterina Pinzani4
 Claudio Conforti1
 Iris Zalaudek1,7
 Serena Bonin1*
- 1Dermatology and Venerology Unit, Department of Medical Sciences, University of Trieste, Trieste, Italy
- 2Biostatistics Unit, Department of Medical Sciences, University of Trieste, Trieste, Italy
- 3Dermatology Unit and Scientific Directorate, Ospedali Galliera, Genova, Italy
- 4Oncologic Dermatology Prevention Unit, Centro di Riferimento Oncologico (CRO), IRCCS, Aviano, Italy
- 5Dermatology Unit, AS FO Azienda sanitaria Friuli Occidentale, Pordenone, Italy
- 6Dermatology Unit, Ospedali Galliera, Genova, Italy
- 7Dermatology Unit, ASU GI Azienda sanitaria universitaria integrata Giuliano Isontina, Trieste, Italy
Background: Staging of melanoma and follow up after melanoma diagnosis aims at predicting risk and detecting progression or recurrence at early stage, respectively in order to timely start and/or change treatment. Tumor thickness according to Breslow, status of the sentinel node and value of the lactate dehydrogenase (LDH) are well-established prognostic markers for metastatic risk, but reliable biomarkers identifying early recurrence or candidates who may benefit best from medical treatment are still warranted. Liquid biopsy has emerged to be a suitable method for identifying biomarkers for early cancer diagnosis, prognosis, therapeutic response prediction, and patient follow-up. Liquid biopsy is a blood-based non-invasive procedure that allows analyzing circulating analytes, including extracellular vesicles.
Methods: In this study we have explored the use of 7 miRNAs, namely hsa-miR-149-3p, hsa-miR-150-5p, hsa-miR-21-5p, hsa-miR-200c-3p, hsa-miR-134-5p, hsa-miR-144-3p and hsa-miR-221-3p in plasma exosomes to discriminate melanoma patients from controls without melanoma in a cohort of 92 individuals.
Results and discussion: Our results showed that three out seven miRNAs, namely hsa-miR-200c-3p, hsa-miR-144-3p and hsa-miR-221-3p were differentially expressed in plasma-derived exosomes from melanoma patients and controls. Furthermore, the expression of the three miRNAs may be a promising ancillary tool as a melanoma biomarker, even for discriminating between nevi and melanoma.
Introduction
The staging of melanoma aims at estimating the risk of metastases in order to define individuals who benefit from close follow-up and/or medical oncological treatment. The most potent markers to estimate the risk of metastases are tumor thickness of the primary melanoma, the status of the sentinel lymph node (SLN), and the value of lactate dehydrogenase (LDH). Therefore, a high risk for metastatic disease is associated with thicker tumors (>0.8 mm), the positivity of the SLN, and increased values of the LDH. For high-risk individuals (stages II B, C, D, and stage III), the mutational analysis of primary tumor or metastases is performed in order to offer adjuvant treatment, i.e., targeted treatment (mainly BRAF and MEK inhibitors for BRAF mutant melanoma) or immune checkpoint inhibitors (ICI).
In contrast, follow-up after melanoma diagnosis aims at detecting secondary cancers, recurrence, or progression at an early stage in order to timely initiate or change concurrent oncologic medical treatment. Follow-up includes regular clinical and radiological examinations and assessment of LDH. It has been shown that ~30–40% of metastases in patients with stages II or III are self-detected, which highlights the need to improve biomarkers for disease monitoring (1, 2). In this regard, liquid biopsy has been proven to be a suitable method for monitoring and treatment response evaluation but also for early diagnosis. Several studies in metastatic melanoma patients highlighted the clinical utility of liquid biopsy in detecting and monitoring BRAF/NRAS mutations (3–5). Nonetheless, wild-type patients currently cannot benefit from this monitoring approach. Liquid biopsy provides a source also for other circulating analytes, such as exosomes, circulant cancer cells, and microRNA (miRNA). Particular attention was paid to circulating tumoral microRNA (miRNA) based on their stability and easy methodology for detection. Recent studies reported on the molecular characterization of skin melanoma through their analysis from liquid biopsy (6–8).
Seven miRNAs, hsa-miR-149-3p, hsa-miR-150-5p, hsa-miR-21-5p, hsa-miR-200c-3p, hsa-miR-134-5p, hsa-miR-144-3p, and hsa-miR-221-3p, are of particular interest in melanoma tumorigenesis. Both hsa-miR-21-5p and hsa-miR-221-3p are onco-miRNAs, and hsa-miR-21-5p was found upregulated in melanoma tissues, and in vitro experiments have established its role in cell cycle regulation by targeting the cyclin-dependent kinase inhibitor 2C (CDKN2C) (9). On the contrary, hsa-miR-200c-3p and hsa-miR-144-3p are onco-suppressor microRNAs (10, 11), however, hsa-miR-200c-3p is highly expressed in serum and plasma of patients with others solid tumors (12–14). Other dysregulated microRNAs are hsa-miR-134-5p and hsa-miR-150-5p, and hsa-miR-134-5p is involved in the regulation of cell proliferation, apoptosis, invasion, and drug resistance; only recently, its expression was investigated in liquid biopsies from patients with melanoma (7, 15). Data on hsa-miR-150-5p in melanoma are contradictory as in tissues and cultured cells, it seems to act as a possible tumor suppressor (16), while it appears highly expressed in plasma of patients with melanoma (6), and hsa-miR-149-3p seems to be involved in the interaction between cancer cells and tumor microenvironment (17).
In this study, we investigated the abovementioned miRNAs as possible diagnostic/monitoring biomarkers in plasma extracellular vesicles of a cohort of melanoma patients and controls.
Methods and materials
Plasma collection
This is a multi-centric study where participants were recruited from four Italian hospitals, namely, the University Hospital of Trieste, the Galliera Hospitals of Genoa, the National Cancer Institute of Aviano (CRO), and the Santa Maria Degli Angeli Hospital of Pordenone. Written informed consent was obtained from each participant, and the study was approved by the ethical committee of the study coordinator (ID study 2937, approval protocol number CEUR-2019-PR-05 of 10/09/2019). Whole peripheral blood samples were collected in EDTA or PAXgene Blood ccfDNA tubes (Cat. No.768165; PreAnalyticX, Qiagen, Hilden, Germany) during dermatological examination, before the excision of the pigmented lesion. Therefore, during the collection of blood, the diagnosis of melanoma was suspected. Finally, blood samples were withdrawn from 92 individuals. All participating hospitals enrolled consecutive patients from 01 September 2019 through 28 February 2021. To fulfill the ISO standard for pre-analytical processes (42), blood samples were collected in EDTA only from some patients of the University Hospital of Trieste, where plasma separation and molecular tests were carried out. In that case, after blood withdrawal, EDTA tubes were transferred to the laboratory at a controlled temperature (4–8°C) within 2 h of collection. For all the other samples, in order to preserve samples' stability during the storage and transport, PAXgene Blood ccfDNA tubes were used. Blood samples collected in PAXgene Blood ccfDNA tubes were delivered at the central laboratory within 7 days from blood withdrawal. Tube storage and transportation were carried out at a controlled temperature (≤25°C) as suggested by the manufacturer. Plasma was immediately separated by centrifugation upon arrival in the laboratory.
Plasma separation was obtained by centrifugation for 15 min at 3,000x g at room temperature in agreement with the manufacturer's indications for PaxGene tubes and following the ISO standard for EDTA tubes (42). Briefly, EDTA tubes were centrifuged for 10 min at 1,600x g at 4°C, and after plasma transferal to new tubes, it was centrifuged for 10 min at 13,000x g at 4°C. Plasma supernatant was aliquoted into 1 ml vial and stored at −80°C until use.
RNA isolation from exosomes and extracellular vesicles
Total RNA from exosomes and extracellular vesicles (EVs) was isolated from 2 ml of plasma using the ExoRNeasy Maxi Kit (Cat. No.77164; Qiagen, Hilden, Germany) following the manufacturer's instructions. Before starting the procedure, the frozen plasma was incubated at room temperature for slow thawing, and then centrifugation of 5 min at 4°C at 3,000x g was performed to eliminate cryoprecipitates and residual cellular material. The standard protocol described in the ExoRNeasy Serum/Plasma Handbook has been followed (18). After centrifugation, plasma was diluted in a ratio of 1:1 with the binding buffer provided by the manufacturer and added to the membrane affinity column that binds exosomes and EVs to the membrane. Steps of centrifugation and washing were performed to eliminate non-specific retained material. The bound vesicles were then lysed and eluted with QIAzol. As a control, after the Qiazol elution step, 1 μl of spike-in mix (UniSp2, UniSp4, and UniSp5; Cat. No. 339390; Qiagen, Hilden, Germany) was added to the solution and incubated at room temperature for 5 min. Chloroform was added to obtain aqueous and organic phase separation. Subsequently, the aqueous phase was added to the spin column, and total RNA was eluted in 14 μl of RNase-free water (2 μl were of dead volume), split into aliquots, and stored at −80°C. The RNA quantity and purity were checked through a NanoDropTM ND-1000 spectrophotometer (Thermo Fischer Scientific, Waltham MA 02451, USA). Total RNA yield was calculated by multiplying the concentration by the elution volume (12 μl).
Hemolysis
The impact of hemolysis was evaluated by measuring the absorbance at 414 nm and 375 nm using a NanoDropTM ND-1000 spectrophotometer (Thermo Fischer Scientific, Waltham MA 02451, USA), and the ratio between the two absorbances was calculated. Samples with a ratio less than or equal to two were considered free from hemolysis (19).
Reverse transcription and real-time PCR setting up
Both the reverse transcription and the real-time PCR reactions were set up as reported in the Supplementary file (Supplementary Table S2).
Reverse transcription and real-time PCR of microRNA
In total, 3 μl of total RNA were reverse transcribed using a miRCURY LNA RT kit (Qiagen, Hilden, Germany; Cat. No. 339340) following the manufacturer's protocol. During the setting up of the mix, 0.5 μl of spike-in mix (UniSp6 and cel-miR-39-3p) was added to the reaction solution.
The real-time PCR has been carried out with 40-fold diluted cDNA (40X), Fast EvaGreen qPCR Master Mix 2X (Biotium, Fremont CA 94538, USA; Cat. No. 31003), and 1 μl of specific pre-designed and validated miRCURY LNA miRNA PCR assays (QIAGEN, Hilden, Germany; Cat. No. 339306) in a total reaction volume of 10 μl. Each reaction was run in duplicate in a CFX96 Touch real-time PCR Detection system (Bio-Rad, Hercules CA, USA), using the following cycling conditions: 95°C for 10 min, 45 cycles of 95°C/10 s, and 55°C or 52°C/1 min; in addition, the melting curve was carried out to evaluate the specificity of amplified products (Table 1).
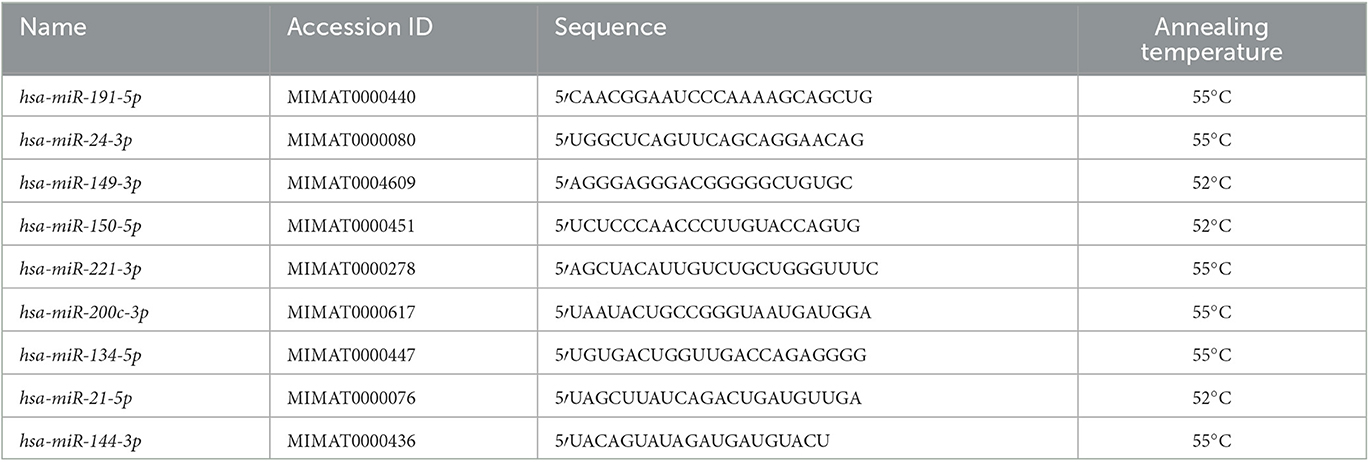
Table 1. microRNAs information: microRNA sequences, ID accession number, and annealing temperature.
For relative quantification, the “ΔΔCt” method was used (20), where, as normalizer, the geometric mean of hsa-miR-191-5p and hsa-miR-24-3p was employed; and as a calibrator, a pool of cDNA made of 12 melanoma and 12 healthy samples was used. In four cases, no expression was detected for hsa-miR-221-3p even after repeating the analysis. In order to include those cases in the statistical analysis for hsa-miR-221-3p, their Ct value was set to 45, representing the amplification cycle number in the corresponding protocol, namely, the detection threshold.
Statistical analysis
In total, two individuals were excluded from the analysis for the high missing rate in microRNA levels (>30%). Individuals without real-time PCR output were excluded from data analysis (1 case for hsa-miR-150-5p, 1 control, and 1 case for hsa-miR-134-5p). Data distribution was checked by the Shapiro–Wilk normality test, and the parametric or non-parametric tests were used for statistical analysis. Given the setting of multiple testing, the significance level was set to α = 0.05/7 = 7e – 3 (Bonferroni correction).
The diagnostic power was calculated by ROC analyses (confidence interval for AUC was calculated using the Delong method), the optimal cutoff values were obtained by the Youden index (21), and the Swets classification was used to describe the area under the curve (AUC) (22). For combined analysis, z-scores for miRNAs were calculated and used to obtain the average value. Measures of performance relative to the optimal cutoff (sensitivity, specificity, and accuracy) were internally validated. Since the performance measured in the data used to obtain the classifier will be higher than what we would obtain in new observations, leading to an optimistically biased evaluation, such “optimism” was estimated with the bootstrapping technique (23), and all measures were reported after subtracting this value. Statistical analyses were carried out using GraphPad Prism 8.0 software (San Diego, CA 92108, USA) and R 4.2.1 environment.
Results
In this prospective multicenter study, blood samples for miRNA profiling were obtained from consecutive patients with the clinical and dermoscopic suspected diagnosis of melanoma and a control group without melanoma. Seven miRNAs were profiled by quantitative real-time PCR (qPCR) in plasma from patients with malignant melanoma (MM) and patients without melanoma (woM).
Clinical features
In total, 44 patients with histologically confirmed malignant melanoma (MM) and 41 patients without melanoma (woM) were gender and age-matched. Of the 92 blood specimens, 7 were excluded from the control group (at collection 48 individuals) because of a previous diagnosis of melanoma. The clinical characteristics of all subjects are reported in Table 2.
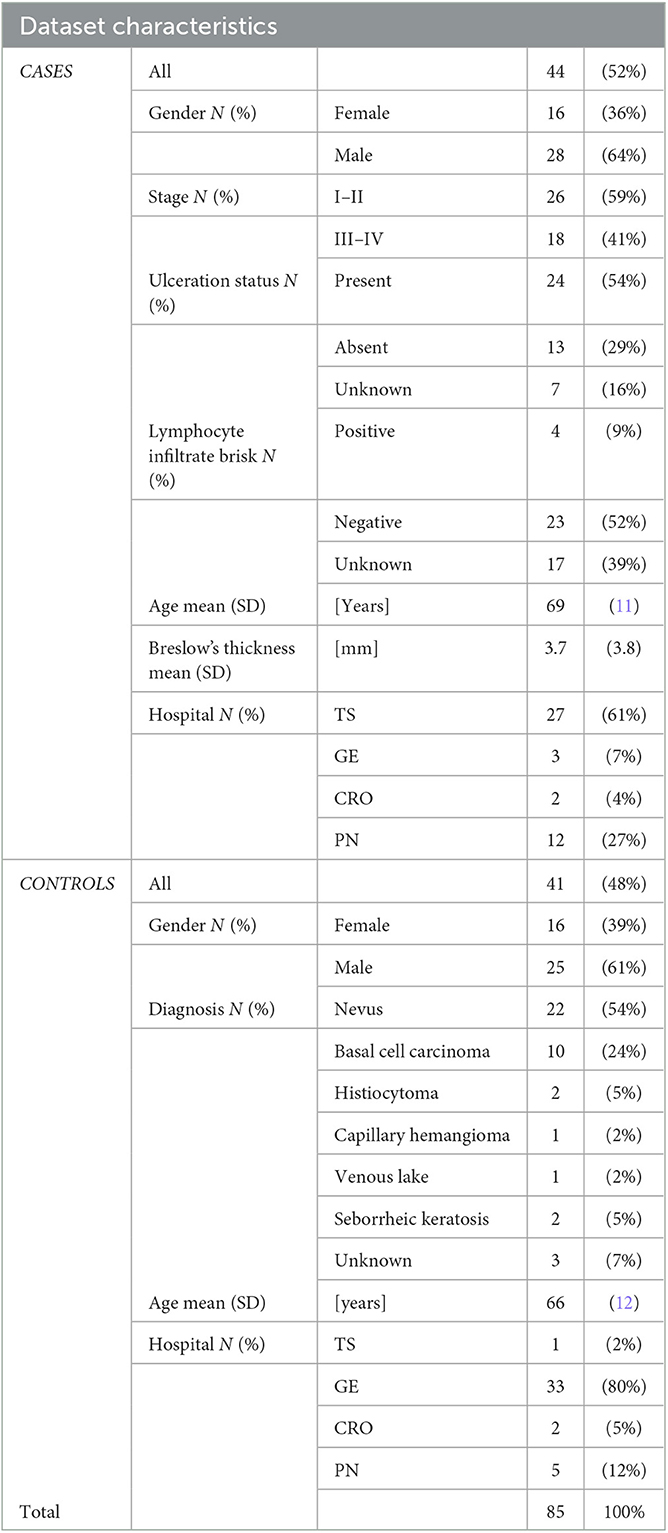
Table 2. Clinical features of melanoma patients and controls.
In detail, the mean age of patients with malignant melanoma was 69 years (SD = 11), while in the control group, the average age was 66 years (SD = 12, p = 0.1). The cases group consisted of 16 women (36%) and 28 men (64%), whereas 16 women (39%) and 25 men (61%) comprised the control group (p = 1.0).
At the time of blood collection, 26 (59%) patients were in stage I–II, and 18 (41%) were in stage III–IV of the disease. Patients' age was not correlated with the tumor's stage (p = 0.5, rho = 0.11). Among controls, most patients (54%) had a diagnosis of nevus (blue nevus, junctional nevus, and dysplastic nevus).
Hemolysis
The sample's hemolysis was evaluated by the A414/A375 ratio. On average, the ratio did not exceed the critical value of 2, but a slight difference was measured between the cases and control groups (1.9 ± 0.5 and 1.7 ± 0.5, p = 0.01, respectively). The A414/A375 ratio did not vary with respect to the collection tubes (p = 0.08) and hospital pre-analytical processes (p = 0.4).
Total RNA yield and purity
Total RNA amount and purity were investigated by a NanoDropTM ND-1000 spectrophotometer (Thermo Fischer Scientific, Waltham MA 02451, USA). No differences were found between cases and control groups in terms of both RNA yield and purity, as reported in the Supplementary file (Supplementary Table S1).
microRNA expression and patients' features
The correlation between microRNAs fold change and patients' features was investigated. Overall, our results suggested that miRNAs expression was not affected by gender although hsa-miR-150-5p expression was positively correlated with patients' age (rho = 0.33, p = 8 −4).
The microRNA expression and clinical features
The relationship between microRNA expression and clinical features, namely, the melanoma stage, Breslow's thickness, the ulceration status, and the presence of brisk lymphocyte infiltrate, was investigated. An association between hsa-miR-200c-3p expression and the tumor stage was detected with significantly higher expression levels in patients with stages III and IV melanomas (Mann–Whitney test, p =2e−5). Contrarily, hsa-miR-144-3p and hsa-miR-221-3p were over-expressed in patients with stages I and II melanomas (Mann–Whitney test, p = 9e – 4 and p = 9e – 4, respectively) compared to higher stages (Figure 1). These three markers showed good performance in discriminating patients with stages I and II from patients with stages III and IV: AUC was 0.86 (95% CI [0.74,0.97]) for hsa-miR-200c-3p, 0.79 (95% CI [0.65,0.93]) for hsa-miR-144-3p, and 0.80 (95% CI [0.66,0.93]) for hsa-miR-221-3p.
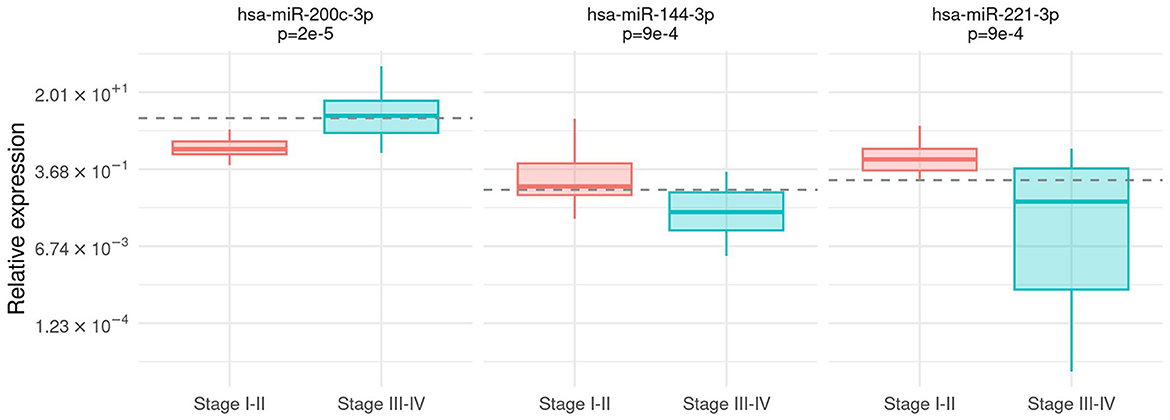
Figure 1. Association between tumor stage and microRNA expression. Box-plot of relative expression (log-scale) for hsa-miR-200c-3p, hsa-miR-144-3p, and hsa-miR-221-3p separately for I–II and III–IV stages. The dashed line shows the cutoff on the expression level calculated by the Youden index.
The microRNA expression in cases and control groups
The expression of all microRNAs was compared between the group of patients with malignant melanoma (MM) and the control group (woM). The hsa-miR-200c-3p expression prevailed in plasma from MM (Mann–Whitney test, p = 5e – 5). On the contrary, hsa-miR-144-3p and hsa-miR-221-3p were significantly highly expressed in controls (Mann–Whitney test, p = 6e – 4, p = 5e – 3, respectively) (Figure 2). The association was confirmed using the multivariable analysis including age and gender as covariates (Supplementary Table S4). The diagnostic power of the abovementioned microRNAs was calculated by a ROC analysis (Supplementary Table S3). Considering the discrimination ability, hsa-miR-221-3p and hsa-miR-144-3p resulted only moderately accurate (AUC values 0.68, 95% CI [0.56, 0.79] and 0.71, 95% CI [0.60, 0.83], respectively), whereas hsa-miR-200c-3p could be considered a fair accurate marker (AUC value 0.75, 95% CI [0.64, 0.85]).
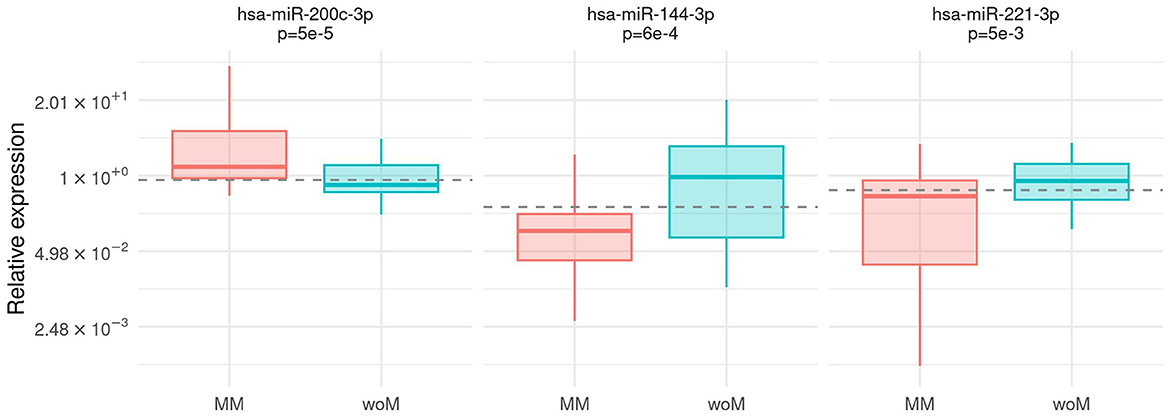
Figure 2. Association between case/control status and microRNA expression. Box-plot of relative expression (log-scale) of hsa-miR-200c-3p, hsa-miR-144-3p, and hsa-miR-221-3 separately for malignant melanoma patients (MM) and patients without melanoma (woM). The dashed line shows the cutoff on the expression level calculated by the Youden index.
The microRNA expression in nevi and melanoma
For clinicians, the differential diagnosis between melanomas and nevi could be challenging. Therefore, the fold change obtained from nevi was compared to the fold change of samples with melanoma, stratified by stages.
In particular, hsa-miR-200c-3p accurately discriminated patients with nevi from patients with melanoma (AUC 0.78, 95% CI [0.66, 0.90]), whereas hsa-miR-144-3p resulted to be moderately accurate in the discrimination (AUC 0.76, 95% CI [0.63, 0.90]). Our results showed that hsa-miR-221-3p was a poor discriminator (AUC 0.71, 95% CI [0.54, 0.82]). By combining the three markers (hsa-miR-200c-3p, hsa-miR-144-3p, and hsa-miR-221-3p), the best discrimination was obtained (AUC 0.84, 95% CI [0.71, 0.95]), as shown in Figure 3.
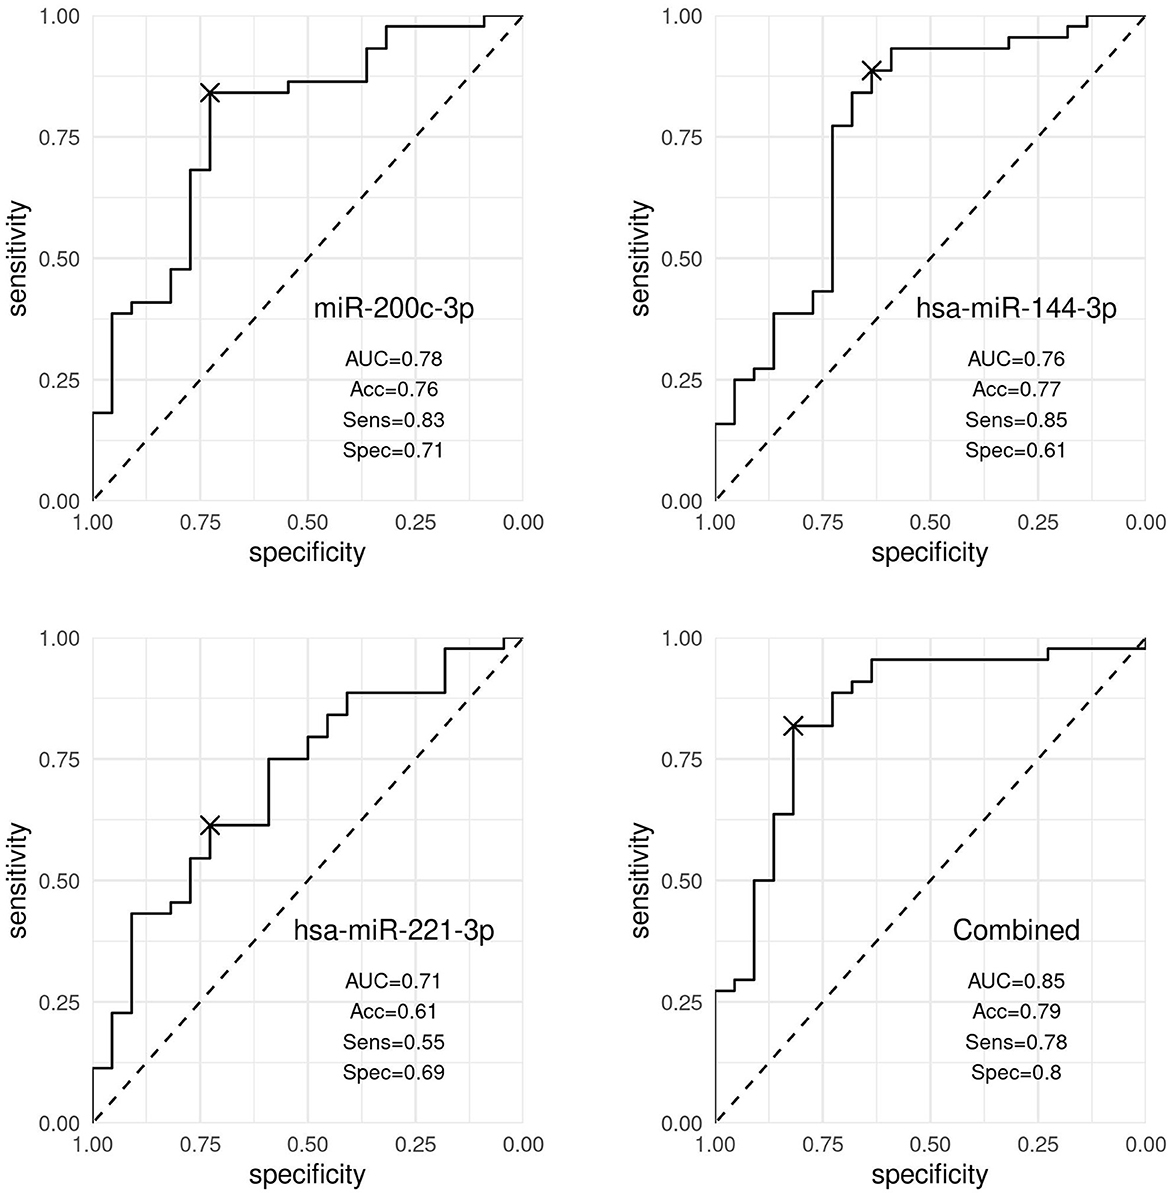
Figure 3. Discrimination analysis. ROC curves representing the discrimination ability of hsa-miR-200c-3p, hsa-miR-144-3p, and hsa-miR-221-3p, and the three markers expression combined, distinguishing patients with nevi and patients with melanoma. Accuracy (Acc), sensitivity (Sens), and specificity (Spec) values were obtained using the optimal cutoff point by the Youden index and corrected by optimism through internal validation.
Discussion
In this study, we investigated miRNA profiles of plasma-derived exosomes from melanoma patients and controls. Three out of seven miRNAs, namely, hsa-miR-200c-3p, hsa-miR-144-3p, and hsa-miR-221-3p, were differentially expressed in plasma-derived exosomes from melanoma patients and controls. We showed that those miRNAs are differentially expressed in cases compared to controls but also in patients with early vs. advanced melanoma stages. Among miRNAs, hsa-miR-200c-3p was highly expressed in the plasma of melanoma patients. Moreover, it was significantly more expressed in stage III-IV melanoma samples in comparison to stage I-II. This miRNA is a member of the miR-200 family, which has a critical role in the epithelial-mesenchymal transition (EMT) in cancers (14). As a circulating biomarker, hsa-miR-200c-3p was increased in the plasma of metastatic breast cancer patients (14), and it was associated with progression-free survival events and reduced overall survival (24). Nevertheless, the results on hsa-miR-200c-3p are contradictory even in melanoma studies, where it has been reported as a tumor suppressor miRNA in tissues (25). Our results of a high expression of hsa-miR-200c-3p, especially in high stages of melanoma, confirm previous findings in other solid tumors (14). Notwithstanding the downregulation of hsa-miR-200c-3p in primary melanoma tissues has been associated with shorter survival and its expression was found higher in primary tumors than in melanoma metastases (26). Interestingly, hsa-miR-200c-3p upregulation in melanoma cells has been shown to lead to a rounded mode of invasion (27). In agreement with others, our results highlighted that the regulation and activity of the miR-200 family, including hsa-miR-200c-3p, is highly context-dependent (27). Micro RNAs, as per definition, are pleiotropic regulators with possible conflictual functions depending on the tumor microenvironment and involved cell type (28). Our results on hsa-miR-200c-3p can find an explanation for the well-known activity of the miR200 family as regulators of the epithelial mesenchymal transition. Taken that low miR-200 levels favor EMT, higher levels promote the mesenchymal epithelial transition, which permits cells that have escaped the primary tumor to establish colonies in a new location (14). This fits well with exosomes' function as active mediators of intercellular communication by transporting and protecting their cargoes. In our study, higher hsa-miR-200c-3p in circulating exosomes can be explained by the presence of circulating melanoma cells that try to seed other tissues and are prone to mesenchymal epithelial transition (MET), and this is more likely seen in advanced melanomas (stages III and IV), as shown in our results. A predicted target of hsa-miR-200c-3p is the microtubule-associated protein MAP2 (see Supplementary material), which seems to act as an inhibitor of melanoma cell proliferation, invasion, and tumor growth (29). MAP2 is mainly involved in dendritic morphology and has already been reported as a good prognostic marker in melanoma (30). The MAP2 activity in melanoma has also been supported by the gene expression profiling analysis (http://gepia2.cancer-pku.cn/#index), as shown in the Supplementary file of results. In detail, MAP2 resulted in significantly higher expression in the normal skin tissue when compared to melanoma. According to our results, higher hsa-miR-200c-3p levels in melanoma vs. controls and in higher stage melanoma support for a repression of MAP2 expression.
Both hsa-miR-144-3p and hsa-miR-221-3p expression levels are significantly lower in melanoma patients than in controls and, contrary to hsa-miR-200c-3p, they also resulted in significantly higher expression in low stages of melanoma compared to advanced melanoma. In uveal melanomas, miR144 was shown to act as tumor suppressor miRNA through ADAM10 and c-Met modulation (31). A decrease in hsa-miR-144-3p has already been reported in plasmatic levels in RCC patients with more advanced clinical-stage tumors, which also supports our findings (32). In melanoma cells, hsa-miR-144-3p has been shown to inhibit cell migration, supporting its tumor suppressor role (33).
It should be noted that the low hsa-miR-221-3p expression in high-stage melanoma patients in our study contrasts relatively with previous reports, showing a high expression of hsa-miR-221-3p in plasma samples of cancer patients with lung adenocarcinomas (34) and hepatocellular carcinomas (35). However, with regard to melanoma, Pfeffer et al. (36) were not able to detect any difference in the plasma levels of hsa-miR-221-3p between melanoma patients and healthy controls. In the serum of melanoma patients, Li et al. (37) identified miR-221 as a predictor of poor outcomes in melanoma patients, but recently other authors did not find significant differences in hsa-miR-221-3p levels in serum between healthy donors and melanoma patients (38). Similarly, Gasparello et al. (39) found that hsa-miR-221-3p did not discriminate between early CRC patients and healthy donors. In agreement with our findings, Deng et al. found that high hsa-miR-221-3p expression was associated with better 5-year disease-free survival of triple-negative breast cancer patients (40), and in uveal melanoma, Vashishtha et al. (41) found that the downregulation of hsa-miR-221-3p was associated with metastatic disease. Some reports on melanoma and hsa-miR-221 did not specify whether−5p or−3p species were analyzed (37). Discrepancies on miR-221 can find indeed an explanation by target differences between 5p/3p species and sample differences (tissue vs. plasma). Overall, hsa-miR-221-3p and hsa-miR-221-5p seem to act mostly on different targets (by miRDIP and miDB), which explains our findings.
In conclusion, our data show that the combined expression level of three miRNAs, namely, hsa-miR-200c-3p, hsa-miR-144-3p, and hsa-miR-221-3p, is a strong candidate biomarker for discriminating between nevi and melanoma with high accuracy. If validated, this finding has possible implications both for early diagnosis and follow-up procedures. Taking the association with the melanoma stage, it is more likely that hsa-miR-144-3p and hsa-miR-221-3p could be relevant for early diagnosis while hsa-miR-200c-3p for follow-up monitoring of high-risk stages. We acknowledge that the main limitation of our study is the lack of an external validation cohort and that no target mRNAs were analyzed to support our hypotheses. Furthermore, although hemolysis analysis did not return any significant difference with respect to tubes and pre-analytical processes, we acknowledge an inhomogeneity in the collection of cases and controls among participant centers, without excluding a possible impact on results. Therefore, a larger and independent series of samples are needed to validate our results and to inspect the real clinical value of those miRNAs in melanoma diagnosis and follow-up.
Data availability statement
The raw data supporting the conclusions of this article will be made available by the authors, without undue reservation.
Ethics statement
The studies involving human participants were reviewed and approved by CEUR; ID study 2937, approval protocol number CEUR-2019-PR-05 of 10/09/2019. The patients/participants provided their written informed consent to participate in this study.
Author contributions
IG: statistical analysis. ED, EA, and SB: formal analysis. IZ, SB, and IG: funding acquisition. ED, EA, CM, EG, CC, SJ, CP, IZ, and MP: investigation. SB and ED: methodology. ED, IG, EA, SB, CC, CM, EG, SJ, CP, MP, and IZ: resources. IZ and SB: supervision. SB, ED, EA, IG, and IZ: original draft preparation. ED, IG, EA, SB, CM, EG, CC, SJ, CP, MP, and IZ: review and editing. All authors contributed to the article and approved the submitted version.
Acknowledgments
This research was supported by grants from SiDeMaST- Società Italiana di Dermatologia medica, Chirurgica, Estetica e Delle Malattie Sessualmente Trasmesse (project award 2018), from the University of Trieste (FRA2021). This study was supported, in part, by the project iToBoS, funded by the European Union's Horizon 2020 research and innovation program under grant agreement No. 965221.
Conflict of interest
The authors declare that the research was conducted in the absence of any commercial or financial relationships that could be construed as a potential conflict of interest.
Publisher's note
All claims expressed in this article are solely those of the authors and do not necessarily represent those of their affiliated organizations, or those of the publisher, the editors and the reviewers. Any product that may be evaluated in this article, or claim that may be made by its manufacturer, is not guaranteed or endorsed by the publisher.
Supplementary material
The Supplementary Material for this article can be found online at: https://www.frontiersin.org/articles/10.3389/fmed.2023.1180799/full#supplementary-material
References
1. Romano E, Scordo M, Dusza SW, Coit DG, Chapman PB. Site and timing of first relapse in stage III melanoma patients: implications for follow-up guidelines. J Clin Oncol. (2009) 28:3042–7. doi: 10.1200/JCO.26.2063.
2. Lee AY, Droppelmann N, Panageas KS, Zhou Q, Ariyan CE, Brady MS, et al. Patterns and timing of initial relapse in pathologic stage II melanoma patients. Ann Surg Oncol. (2017) 24:939–46. doi: 10.1245/s10434-016-5642-0
3. Long-Mira E, Ilie M, Chamorey E, Leduff-Blanc F, Montaudie H, Tanga V, et al. Monitoring BRAF and NRAS mutations with cell-free circulating tumor DNA from metastatic melanoma patients. Oncotarget. (2018) 9:36238–49. doi: 10.18632/oncotarget.26343
4. Marczynski GT, Laus AC, Dos Reis MB, Reis RM, Vazquez VL. Circulating tumor DNA (ctDNA) detection is associated with shorter progression-free survival in advanced melanoma patients. Sci Rep. (2020) 10:18682. doi: 10.1038/s41598-020-75792-1
5. Giunta EF, Falco De, Vitiello V, Guerrera PP, Suarato LP, Napolitano G, et al. Clinical utility of liquid biopsy to detect BRAF and NRAS mutations in stage III/IV melanoma patients by using real-time PCR. Cancers. (2022) 14:3053. doi: 10.3390/cancers14133053
6. Fogli S, Polini B, Carpi S, Pardini B, Naccarati A, Dubbini N, et al. Identification of plasma microRNAs as new potential biomarkers with high diagnostic power in human cutaneous melanoma. Tumour Biol. (2017) 39:1010428317701646. doi: 10.1177/1010428317701646
7. Sole C, Tramonti D, Schramm M, Goicoechea I, Armesto M, Hernandez LI, et al. The circulating transcriptome as a source of biomarkers for melanoma. Cancer. (2019) 11:70. doi: 10.3390./cancers11010070
8. Carpi S, Polini B, Fogli S, Podesta A, Ylosmaki E, Cerullo V, et al. Circulating microRNAs as biomarkers for early diagnosis of cutaneous melanoma. Expert Rev Mol Diagn. (2020) 20:19–30. doi: 10.1080/14737159.2020.1696194
9. Yang Z, Liao B, Xiang X, Ke S. miR-21-5p promotes cell proliferation and G1/S transition in melanoma by targeting CDKN2C. FEBS Open Bio. (2020) 10:752–60. doi: 10.1002/2211-5463.12819
10. Kooshkaki O, Rezaei Z, Rahmati M, Vahedi P, Derakhshani A, Brunetti O, et al. MiR-144: a new possible therapeutic target and diagnostic/prognostic tool in cancers. Int J Mol Sci. (2020) 21:2578. doi: 10.3390./ijms21072578
11. Zhou WJ, Wang HY, Zhang J, Dai HY, Yao ZX, Zheng Z, et al. NEAT1/miR-200b-3p/SMAD2 axis promotes progression of melanoma. Aging. (2020) 12:22759–75. doi: 10.18632/aging.103909
12. Teng Y, Su X, Zhang X, Zhang Y, Li C, Niu W, et al. miRNA-200a/c as potential biomarker in epithelial ovarian cancer (EOC): evidence based on miRNA meta-signature and clinical investigations. Oncotarget. (2016) 7:81621–33. doi: 10.18632/oncotarget.13154
13. Ardila HJ, Sanabria-Salas MC, Meneses X, Rios R, Huertas-Salgado A, Serrano ML, et al. Circulating miR-141-3p, miR-143-3p and miR-200c-3p are differentially expressed in colorectal cancer and advanced adenomas. Mol Clin Oncol. (2019) 11:201–7. doi: 10.3892/mco.2019.1876
14. Cavallari I, Ciccarese F, Sharova E, Urso L, Raimondi V, Silic-Benussi M, et al. The miR-200f of microRNAs: fine tuners of epithelial-mesenchymal transition and circulating cancer biomarkers. Cancers. (2021) 13:5874. doi: 10.3390./cancers13235874
15. Pan JY, Zhang F, Sun CC, Li SJ, Li G, Gong FY, et al. miR-134: a human cancer suppressor? Mol Ther Nucleic Acids. (2016) 6:140–9. doi: 10.1016/j.omtn.11003
16. Sun X, Zhang C, Cao Y, Liu E. miR-150 suppresses tumor growth in melanoma through downregulation of MYB. Oncol Res. (2019) 27:317–23. doi: 10.3727/096504018X15228863026239
17. Bellazzo A, Di Minin G, Valentino E, Sicari D, Torre D, Marchionni L, et al. Cell-autonomous and cell non-autonomous downregulation of tumor suppressor DAB2IP by microRNA-149-3p promotes aggressiveness of cancer cells. Cell Death Differ. (2018) 25:1224–1238. doi: 10.1038/s41418-018-0088-5
18. Enderle D, Spiel A, Coticchia CM, Berghoff E, Mueller R, Schlumpberger M, et al. Characterization of RNA from exosomes and other extracellular vesicles isolated by a novel spin column-based method. PLoS ONE. (2015) 10:e0136133. doi: 10.1371/journal.pone.0136133
19. Blondal T, Jensby Nielsen S, Baker A, Andreasen D, Mouritzen P, Wrang Teilum M, et al. Assessing sample and miRNA profile quality in serum and plasma or other biofluids. Methods. (2012) 59:S1–6. doi: 10.1016/j.ymeth.09015
20. Livak KJ, Schmittgen TD. Analysis of relative gene expression data using real-time quantitative PCR and the 2(-Delta Delta C(T)) method. Methods. (2001) 25:402–8. doi: 10.1006/meth.2001.1262
21. Youden WJ. Index for rating diagnostic tests. Cancer. (1950) 3:32–5. doi: 10.1002/1097-0142(1950)3:1<32::aid-cncr2820030106>3.0.co;2-3
22. Swets JA. Measuring the accuracy of diagnostic systems. Science. (1988) 240:1285–93. doi: 10.1126/science.3287615
23. Steyerberg EW, Harrell Jr FE, Borsboom GJ, Eijkemans MJ, Vergouwe Y, Habbema JD. Internal validation of predictive models: efficiency of some procedures for logistic regression analysis. J Clin Epidemiol. (2001) 54:774–781. doi: 10.1016/s0895-4356(01)00341-9
24. Antolín S, Calvo L, Blanco-Calvo M, Santiago MP, Lorenzo-Patiño MJ, Haz-Conde M, et al. Circulating miR-200c and miR-141 and outcomes in patients with breast cancer. BMC Cancer. (2015) 15:297. doi: 10.1186/s12885-015-1238-5
25. Xu Y, Brenn T, Brown ERS, Doherty V, Melton DW. Differential expression of microRNAs during melanoma progression: miR-200c, miR-205 and miR-211 are downregulated in melanoma and act as tumour suppressors. Br J Cancer. (2012) 106:553–61. doi: 10.1038/bjc.2011.568
26. Sánchez-Sendra B, Martinez-Ciarpaglini C, González-Muñoz JF, Murgui A, Terrádez L, Monteagudo C, et al. Downregulation of intratumoral expression of miR-205, miR-200c and miR-125b in primary human cutaneous melanomas predicts shorter survival. Sci Rep. (2018) 8:17076. doi: 10.1038/s41598-018-35317-3
27. Elson-Schwab I, Lorentzen A, Marshall CJ. MicroRNA-200 family members differentially regulate morphological plasticity and mode of melanoma cell invasion. PLoS One. (2010) 5:3176. doi: 10.1371./journal.pone.0013176
28. Yang N, Zhu S, Lv X, Qiao Y, Liu YJ, Chen J, et al. MicroRNAs: pleiotropic regulators in the tumor microenvironment. Front Immunol. (2018) 9:2491. doi: 10.3389/fimmu.2018.02491
29. Song Z, He CD, Sun C, Xu Y, Jin X, Zhang Y, et al. Increased expression of MAP2 inhibits melanoma cell proliferation, invasion and tumor growth in vitro and in vivo. Exp Dermatol. (2010) 19:958–64. doi: 10.1111/j.1600-0625.2009.01020.x
30. Soltani MH, Pichardo R, Song Z, Sangha N, Camacho F, Satyamoorthy K, et al. Microtubule-associated protein 2, a marker of neuronal differentiation, induces mitotic defects, inhibits growth of melanoma cells, and predicts metastatic potential of cutaneous melanoma. Am J Pathol. (2005) 166:1841–50. doi: 10.1016/S0002-9440(10)62493-5
31. Amaro A, Croce M, Ferrini S, Barisione G, Gualco M, Perri P, et al. Potential onco-suppressive role of miR122 and miR144 in uveal melanoma through ADAM10 and C-met inhibition. Cancers. (2020) 12:1468. doi: 10.3390/cancers12061468
32. Morais M, Dias F, Nogueira I, Leão A, Gonçalves N, Araújo L, et al. Cancer cells' metabolism dynamics in renal cell carcinoma patients' outcome: influence of GLUT-1-related hsa-miR-144 and hsa-miR-186. Cancers. (2021) 13:1733. doi: 10.3390/cancers13071733
33. Babapoor S, Fleming E, Wu R, Dadras SS. A novel miR-451a isomiR, associated with amelanotypic phenotype, acts as a tumor suppressor in melanoma by retarding cell migration and invasion. PLoS ONE. (2014) 9:e107502. doi: 10.1371/journal.pone.0107502
34. Zhou X, Wen W, Shan X, Zhu W, Xu J, Guo R, et al. A six-microRNA panel in plasma was identified as a potential biomarker for lung adenocarcinoma diagnosis. Oncotarget. (2016) 8:6513. doi: 10.18632/oncotarget.14311
35. Ghosh S, Bhowmik S, Majumdar S, Goswami A, Chakraborty J, Gupta S, et al. The exosome encapsulated microRNAs as circulating diagnostic marker for hepatocellular carcinoma with low alpha-fetoprotein. Int J Cancer. (2020) 147:2934–47. doi: 10.1002/ijc.33111
36. Pfeffer SR, Grossmann KF, Cassidy PB, Yang CH, Fan M, Kopelovich L, et al. Detection of exosomal miRNAs in the plasma of melanoma patients. J Clin Med. (2015) 4:2012–27. doi: 10.3390/jcm4121957
37. Li P, He QY, Luo CQ, Qian LY. Circulating miR-221 expression level and prognosis of cutaneous malignant melanoma. Med Sci Monit. (2014) 20:2472–7. doi: 10.12659/MSM.891327
38. Gerloff D, Kewitz-Hempel S, Hause G, Ehrenreich J, Golle L, Kingreen T, et al. Comprehensive analyses of miRNAs revealed miR-92b-3p, miR-182-5p and miR-183-5p as potential novel biomarkers in melanoma-derived extracellular vesicles. Front Oncol. (2022) 12:935816. doi: 10.3389/fonc.2022.935816
39. Gasparello J, Papi C, Allegretti M, Giordani E, Carboni F, Zazza S, et al. A distinctive microRNA (miRNA) signature in the blood of colorectal cancer (CRC) patients at surgery. Cancers. (2020) 2:2410. doi: 10.3390./cancers12092410
40. Deng L, Lei Q, Wang Y, Wang Z, Xie G, Zhong X, et al. Downregulation of miR-221-3p and upregulation of its target gene PARP1 are prognostic biomarkers for triple negative breast cancer patients and associated with poor prognosis. Oncotarget. (2017) 8:108712–25. doi: 10.18632/oncotarget.21561
41. Vashishtha A, Lee TJ, Sharma A, Wallbillich JJ. Changes in microRNA expression associated with metastasis and survival in patients with uveal melanoma. Oncotarget. (2020) 11:1435–47. doi: 10.18632/oncotarget.27559
Keywords: liquid biopsy, plasma, exosomes, miRNA, melanoma
Citation: De Martino E, Gandin I, Azzalini E, Massone C, Pizzichetta MA, Giulioni E, Javor S, Pinzani C, Conforti C, Zalaudek I and Bonin S (2023) A group of three miRNAs can act as candidate circulating biomarkers in liquid biopsies from melanoma patients. Front. Med. 10:1180799. doi: 10.3389/fmed.2023.1180799
Received: 06 March 2023; Accepted: 16 May 2023;
Published: 14 June 2023.
Edited by:
Gerardo Ferrara, G. Pascale National Cancer Institute Foundation (IRCCS), ItalyReviewed by:
Theresa L. Whiteside, University of Pittsburgh, United StatesElin Solomonovna Gray, Edith Cowan University, Australia
Copyright © 2023 De Martino, Gandin, Azzalini, Massone, Pizzichetta, Giulioni, Javor, Pinzani, Conforti, Zalaudek and Bonin. This is an open-access article distributed under the terms of the Creative Commons Attribution License (CC BY). The use, distribution or reproduction in other forums is permitted, provided the original author(s) and the copyright owner(s) are credited and that the original publication in this journal is cited, in accordance with accepted academic practice. No use, distribution or reproduction is permitted which does not comply with these terms.
*Correspondence: Serena Bonin, c2JvbmluQHVuaXRzLml0