 Getachew Mesfin Bambo1*†
 Daniel Asmelash1†‡
 Ermiyas Alemayehu2
 Alemu Gedefie2
 Tadesse Duguma1Samuel Sahile Kebede1‡
- 1Department of Medical Laboratory Sciences, College of Health Sciences, Mizan-Tepi University, Mīzan, Ethiopia
- 2Department of Medical Laboratory Sciences, College of Medicine and Health Sciences, Wollo University, Dessie, Ethiopia
Background: Diabetes mellitus is a chronic metabolic disorder that causes hyperglycemia and various life-threatening health problems. Although hematological parameters play a significant role in the progression and pathogenesis of diabetes, many studies have explored contradictory findings. Therefore, this evidence-based study aimed to determine the pooled mean difference of white blood cell and red blood cell parameters in diabetic patients in order to investigate hematological dysfunctions in type 1 and type 2 diabetes mellitus.
Methods: Articles were extensively searched in bibliographic databases (PubMed, Cochrane library, Scopus, Web of Science, PsycINFO, Embase, online archives and university repositories) using appropriate entry terms. For studies meeting the eligibility criteria, the first author’s name, year of publication, study design and area, type of diabetes mellitus, sample size, and mean and standard deviation of hematological parameters were extracted using Microsoft Excel and exported to Stata 11 for meta-analysis. The pooled standardized mean difference (SMD) was determined using the random effects model, and heterogeneity was quantified using Higgins’ I2 statistics. Egger’s test and funnel plot were performed to measure bias. Furthermore, a sensitivity analysis was performed to determine the small study effect.
Results: Initially 39, 222 articles were identified. After screening of the entire methodology, 22 articles with 14,041 study participants (6,146 T2DM, 416 T1DM patients and 7,479 healthy controls) were included in this study. The pooled SMD in TLC (109/L) was 0.66 and −0.21, in T2DM and T1DM, respectively. Differences in absolute differential WBC counts for neutrophils, eosinophils, basophils, lymphocytes and monocytes in T2DM were 0.84, −1.59, 3.20, 0.36 and 0.26, respectively. The differences in relative differential counts (%) in T2DM were as follows: neutrophils: 1.31, eosinophils: −0.99, basophils: 0.34, lymphocytes: −0.19 and monocyte: −0.64. The SMD of differential counts of WBC (109/L) parameters; neutrophils, lymphocytes, monocytes and basophils in T1DM were −0.10, −0.69, 0.19, and −0.32, respectively. The pooled SMD in RBC parameters in T2DM were as follows: RBC: −0.57 (106/μL), Hb: −0.73 g/dL and HCT: −1.22%, Where as in T1DM RBC, Hb and HCT were −1.23 (106/μL), −0.80 g/dL and −0.29%, respectively.
Conclusion: Patients with T2DM had significantly increased TLC counts, absolute neutrophil, basophil, lymphocyte, monocyte counts and relative counts of neutrophils and basophils in comparison to controls. On the contrary, the absolute eosinophil count and relative lymphocyte, eosinophil and monocyte counts were decreased. In T1DM, WBC parameters were significantly decreased except monocytes. RBC parameters were found to be significantly decreased in T2DM patients. In T1DM, Hb and HCT were significantly decreased. However, there is no significant difference in RBC as compared with non-diabetic controls. The findings indicated a significant alteration of WBC and RBC parameters in both diabetic patients suggesting the considerable metabolic effect of diabetes on hematologic parameters.
Systematic review registration: https://www.crd.york.ac.uk/prospero/export_details_pdf.php, identifier [CRD42023413486].
Introduction
Diabetes mellitus (DM) is a chronic metabolic disorder that causes hyperglycemia and various life-threatening health problems in association with insulin secretion or action disorders. It is classified into type 1 diabetes mellitus (T1DM), type 2 diabetes mellitus (T2DM), hybrid form, gestational diabetes mellitus (GDM) and other types of diabetes (1, 2). T2DM is the most common type of diabetes, accounting for approximately 90% of all DM cases (3–6). T1DM is mainly characterized by autoimmune pancreatic B-cell destruction that leads to insulin deficiency in adults and children (7). According to current epidemiological data, around 537 million adults have diabetes mellitus and the prevalence is anticipated to rise to 783 million people globally by 2045 (3). Diabetes affects 8.8% of adults in 2015 and the proportion will increase to 10.04% in 2024 (8, 9).
Indeed, T1DM and T2DM have multiple consequences attributed to many metabolic changes including lipid metabolism, inflammation regulation, vasodilation, vascular, immunological, and hematological parameters, and cell growth (10). Chronic hyperglycemia has a higher risk of long-term damage to many vital organs, such as the eyes (retinopathy), kidneys (nephropathy), nerves (neuropathy), heart (cardiomyopathy), and blood vessels (vasculopathy), ultimately leading to a variety of diabetic complications. These complications of diabetes affect patients’ quality of life and the risk of morbidity and mortality (11, 12).
Moreover, hyperglycemia has a range of effects on RBC indices, including Hb glycation, decreased deformability, and decreased longevity (13). In diabetic patients, hematological alterations are associated with the production of reactive oxygen species (ROS) as a consequence of long-term hyperglycemia. Excessive ROS production causes oxidative stress, leading to tissue damage, hematological alterations, and endothelial and RBC dysfunction (14, 15). Patients with DM are more prone to anemia (16, 17). Several studies have revealed that total leukocyte count (TLC), Neutrophil and lymphocyte counts are higher in T2DM patients (14, 18–20).
However, some studies investigated decreased TLC and neutrophils in T2DM as compared to healthy controls (18, 21). In T1DM patients, changes in morphological and RBC and WBC counts are common in adults with T1DM (22, 23).
The majority of scientific findings demonstrated decreased WBC parameters in T1DM compared to healthy controls (22, 24, 25). In contrast, other sources reported an increase (26–28). In addition, RBC parameters are significantly decreased in T2DM (29–31). On the other hand, other studies revealed a significant increment (19, 32, 33). Cellular components of hematological parameters are altered in association with the underlying pathogenesis of DM. They are also being used to predict glycemic control and in turn various degenerative complications of DM (34). Moreover, hematological parameters play a significant role in the progression and pathogenesis of DM (35). Despite these facts, different studies have revealed inconsistent findings. The main aim of this study is to investigate the evidence-based pooled mean difference of TLC, differential WBC count, and RBC parameters in T1DM and T2DM. Therefore, the study would provide robust and sufficient evidence.
Methods
Design and protocol registration
This systematic review and meta-analysis were designed to estimate the mean difference in hematological parameters in diabetic patients in order to investigate hematological changes. Studies conducted on hematological parameters in T1DM and T2DM were used in this study. The result was reported in accordance with the Preferred Reporting Items for Systematic Review and Meta-analysis Protocols (PRISMA-P) (36). Moreover, the review protocol was registered in the international Prospective Register of Systematic Review (PROSPERO) under the registration number CRD42023413486.
Eligibility criteria
Inclusion and exclusion criteria
(1) Community and institutional-based studies, (2) articles published in the English language, (3) studies conducted among patients with T1DM, T2DM, (4) studies published until 30 August 2023, (5) observational and experimental studies were all included. (1) Case reports, (2) abstracts without full-length articles, (3) articles with restricted access, (4) full-length articles that did not report the outcome of interest, (5) studies conducted among pregnant women, (6) patients with other complications, (7) animal studies and (8) retrospective studies were all excluded.
Database and search strategies
Databases such as PubMed, Cochrane Library, Scopus, Web of Science and PsycINFO, Embase, online archives, and university repositories were searched. In addition grey literature including Google scholar were extensively searched. Reference lists were used to select potentially relevant studies. A comprehensive and extensive search strategy was employed using Population, Intervention, Comparator or Control and Outcome of interest (PICO) formulating questions. Appropriate entry and search terms were used by combining the “AND” and “OR” Boolean operators; ((((((((((((((Hematological profile) AND (Hematological parameters)) AND (Red blood cells)) AND (White blood cells)) AND (Biochemical profile)) AND (Blood cell indices)) AND (Diabetic patient’s)) AND (Diabetes)) AND (Non-diabetic)) AND (Type 1 diabetes)) AND (Type 2 diabetes)) AND (Glycemic control)) AND (Healthy control)) AND (Blood cell count)) OR (T1DM)) OR (T2DM). We also searched extensively for titles, abstracts, and keywords.
Study selection and quality assessment for the risk of bias
Three authors (GB, SK, and DA) independently identified available records from repeatable databases and other sources. Initially identified records were combined into Endnot-7 to remove duplicates. Two authors (DA and SK) assessed the title, abstract and full text of the records for data abstraction. Disagreements between two independent reviewers (SK and DA) were resolved by GB for a consensus. The methodological validity of each full-length article was assessed for individual study design using the Joanna Briggs Institute (JBI) manual (37, 38). The JBI checklist of related items, sampling, eligibility protocols, description of study subject and setting, appropriate statistical analysis, case definition, confounder identification, valid and reliable result measurement, bias minimization, comparability among study participants and generalizability of the study were checked independently. The scoring system was 0 (not done), 1 (done), UC (unclear), NA (not applicable) and the judgments of the score range for cross-sectional were 0 (lowest quality) to 8 (highest quality), for case-control, 0 (lowest quality) to 10 (highest quality) for cohort 0 (lowest quality) to 11 (highest quality), experimental 0 (lowest quality) to 13 (highest quality) and quasi-experimental studies 0 (lowest quality) to 9 (highest quality) (37, 38). Articles with an average methodological score of ≥50% for each item were included in this meta-analysis (Supplementary Table S1).
Data extraction
After careful assessment of the methodological quality of the studies, data elements were subjected to data extraction using a Microsoft Excel spreadsheet. For each article that met the eligibility protocol, the first author’s name, year of publication, study design, study area, type of DM, sample size in DM and controls, and mean and standard deviation for each hematological parameter were extracted.
Outcome of interest
The outcome of interest was the mean difference in WBC and RBC parameters in patients with T1DM and T1DM.
Statistical analysis
The extracted data were exported to Stata 11 for further analysis. The degree of heterogeneity was checked using Higgins’ (I2) statistics to estimate the variability in effect size estimation (4). The standard mean difference (SMD) difference was determined using a random effects model with a 95% CI (39). The pooled estimate of the SMD was presented in forest plots. In addition, publication bias was checked using a funnel plot and Egger’s statistical test. Finally, a sensitivity analysis was performed to determine the effect of a small study size on the pooled effect size. A p-value <0.05 was used to declare significance.
Results
Review process and study description
Initially, 39,222 articles were retrieved through an extensive search of electronic databases and other gray literature. From these, 23 articles were removed due to duplication. Then, approximately 39,199 records were screened for titles and abstracts. After careful assessment, 39,037 articles were discarded by abstract and title. Moreover, 162 full-length records were assessed for eligibility. Finally, 22 articles met the inclusion criteria (Figure 1).
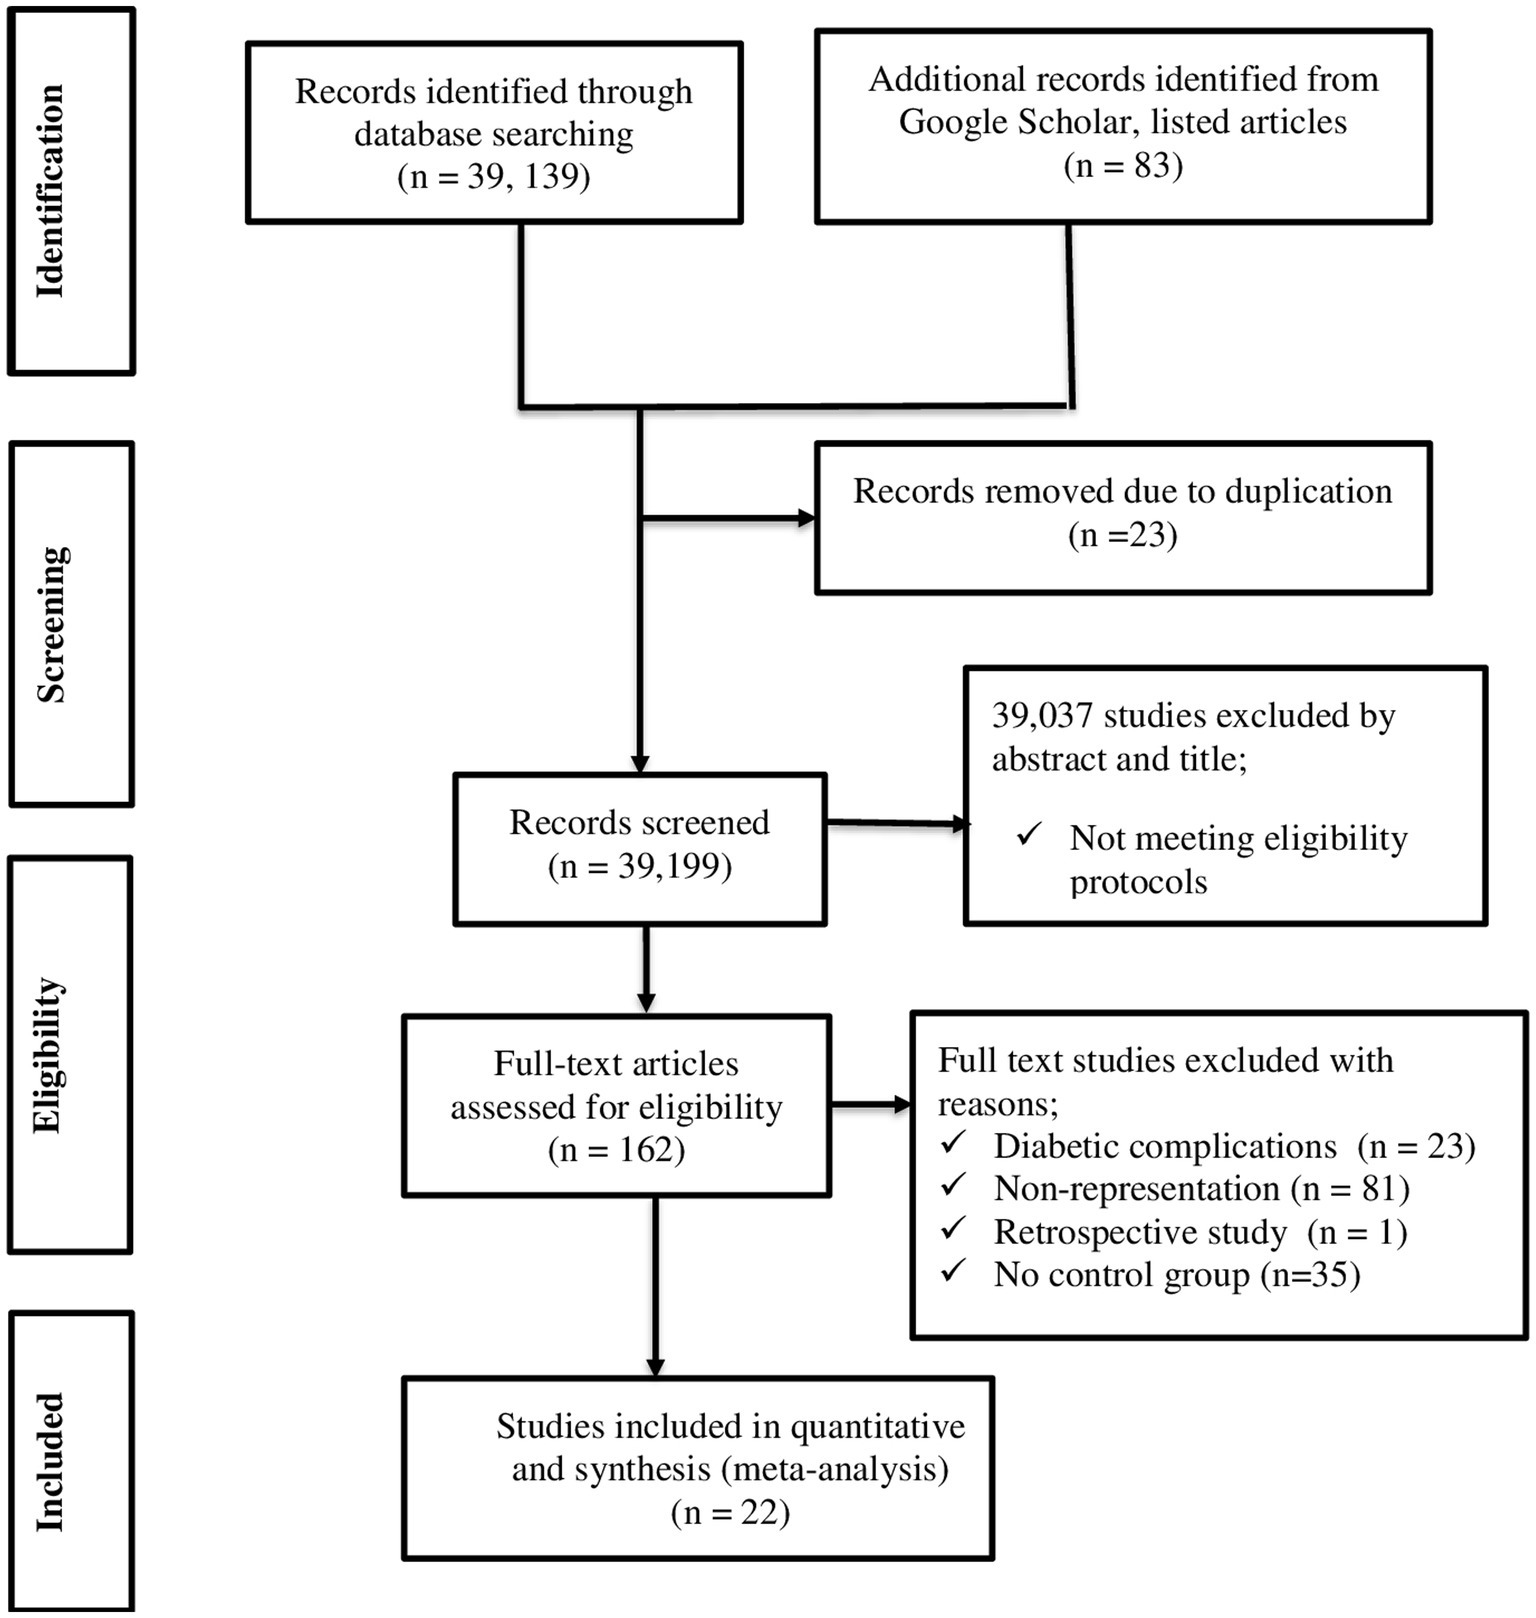
Figure 1. PRISMA flow chart describing screening protocols of studies for meta-analysis.
Characteristics of the included studies
A total of 14,041 study participants (6,146 T2DM, 416 T1DM patients and 7,479 healthy controls) were involved in the 22 included studies. Studies were conducted to assess the hematological profile in diabetic and non-diabetic patients to evaluate the changes in blood cell parameters. The majority of the studies were conducted in patients with T2DM (14, 18–21, 28–33, 40–43) and a few with T1DM (22, 24–28, 44, 45). Moreover, 19 studies were observational (14, 18–22, 25–33, 40–43, 45) and 2 were experimental studies (24, 44). One study was conducted before 2010 (24), and 21 were conducted after 2010 (14, 18–22, 25–33, 40–45) (Table 1).
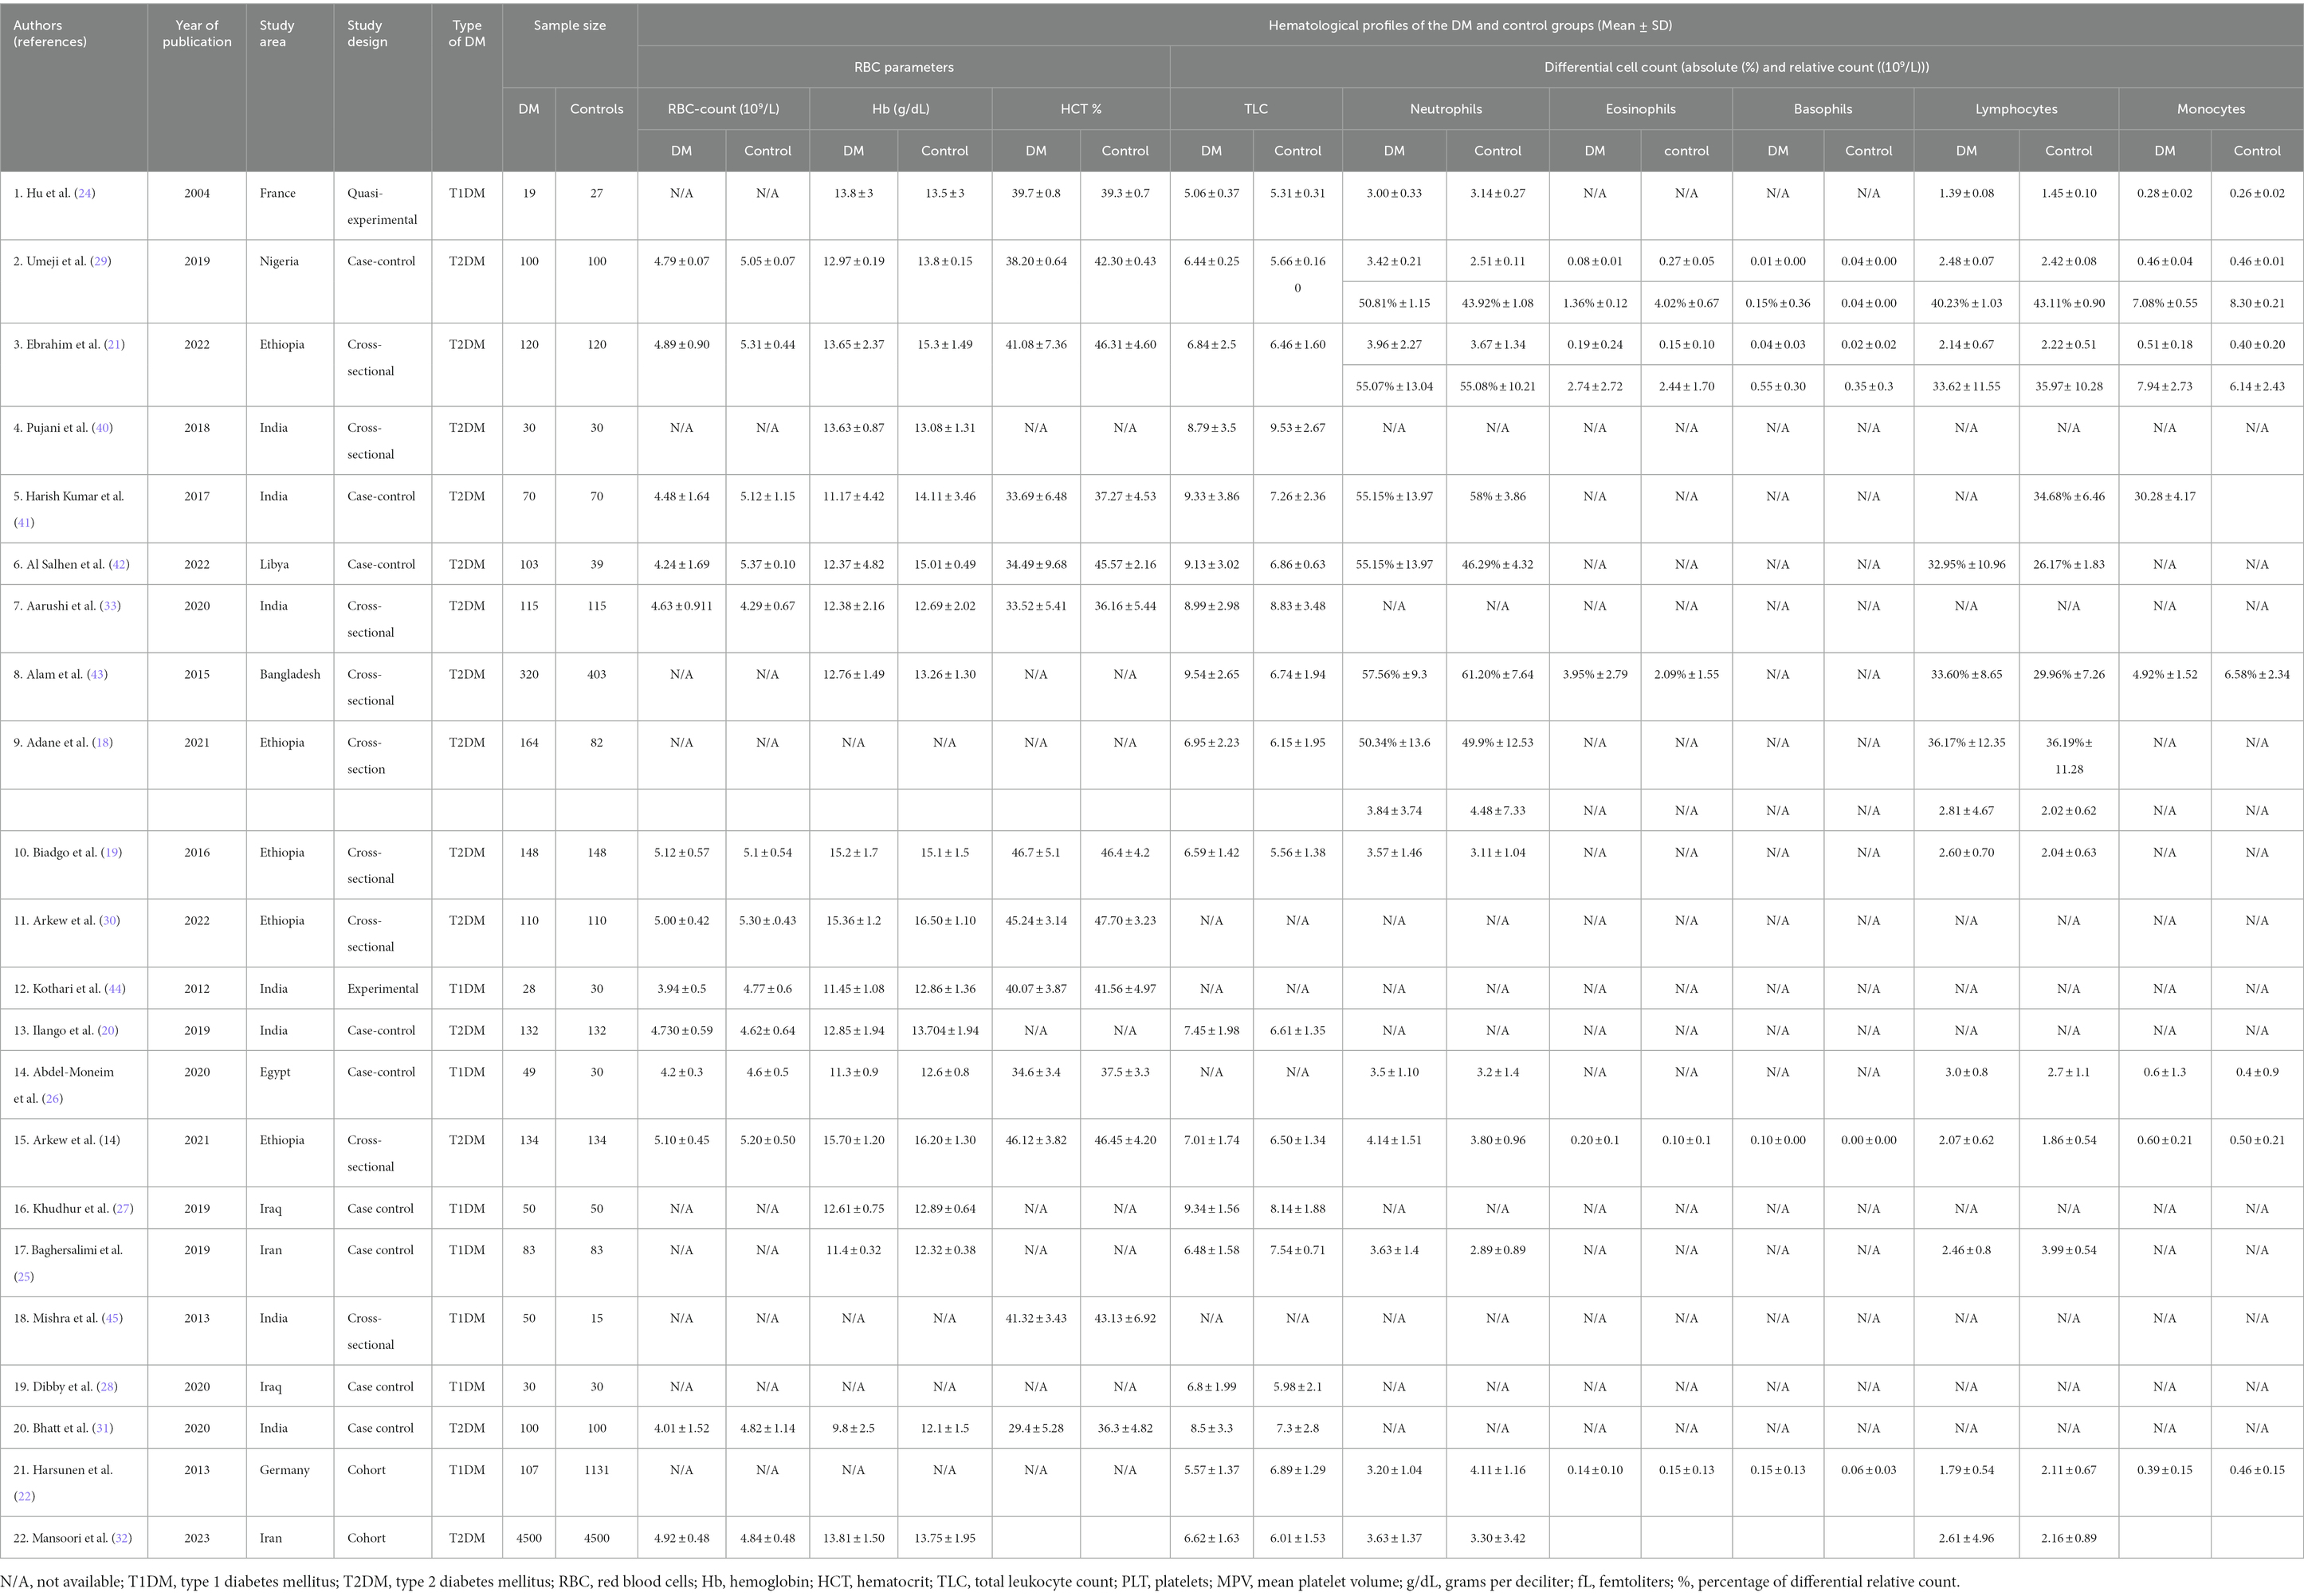
Table 1. Summary characteristics of research articles included in quantitative analysis of systematic review and meta-analysis (N = 22).
Quality and heterogeneity
The majority of the studies were of high quality, more than 75%. For individual studies, quality was assessed by using the JBI manual to minimize the risk of bias (Supplementary Table S1). The included studies exhibited substantial heterogeneity in both fixed and random effect models. To reduce the substantial heterogeneity we used the random effect model and SMD to measure the outcome of interest.
Sensitivity analysis
When the mean difference was pooled by omitting one study at a time, each study had a negligible impact, suggesting the robustness of the pooled estimate of the mean difference (Supplementary Figures S2–S4).
Publication bias
A funnel plot and Egger’s test were used to assess the publication bias of the included studies. Visual inspection of a funnel plot demonstrated that the articles were symmetrically distributed and fell into a funnel triangle (Supplementary Figure S1). Egger’s test showed an insignificant publication bias with a p-value = 0.06 (Table 2).
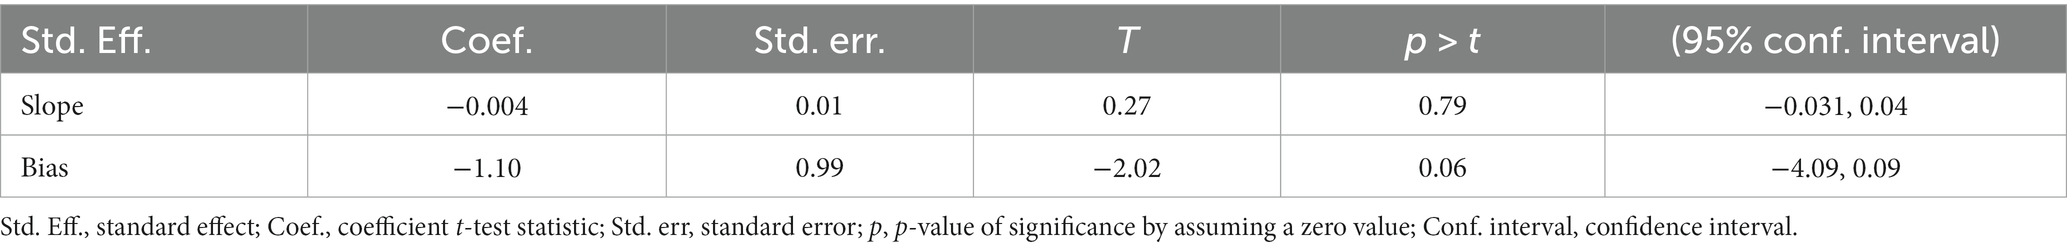
Table 2. Egger’s test.
Pooled estimated mean difference of hematological parameters in diabetic patients
White blood cell parameters in T2DM
Based on the random effect model analysis, the pooled SMD of TLC was 0.66 (109/L); 95% CI: 0.39, 0.94. Pooled SMD in neutrophils, eosinophils, basophils, lymphocytes, and monocytes were 0.84 (109/L); 95% CI: 0.31, 1.37, −1.59 (109/L); 95% CI: −3.84, 0.66, 3.2 (109/L); 95% CI: −0.37, 6.77, 0.36 (109/L); 95% CI: 0.12, 0.59 and 0.26 (109/L); 95% CI: −0.07, 0.58, respectively at p < 0.001 (Figure 2). SMD in relative differential counts were as following; neutrophil: 1.31%; 95% CI: 0.13, 2.49, eosinophil: −0.99%; 95% CI: −2.52, 0.55, basophil: 0.34%; 95% CI: −0.03, 0.72, lymphocyte: −0.19%; 95% CI: −1.01, 0.63 and monocyte: −0.64%; 95% CI: −1.85, 0.58 at p < 0.001 (Figure 3).
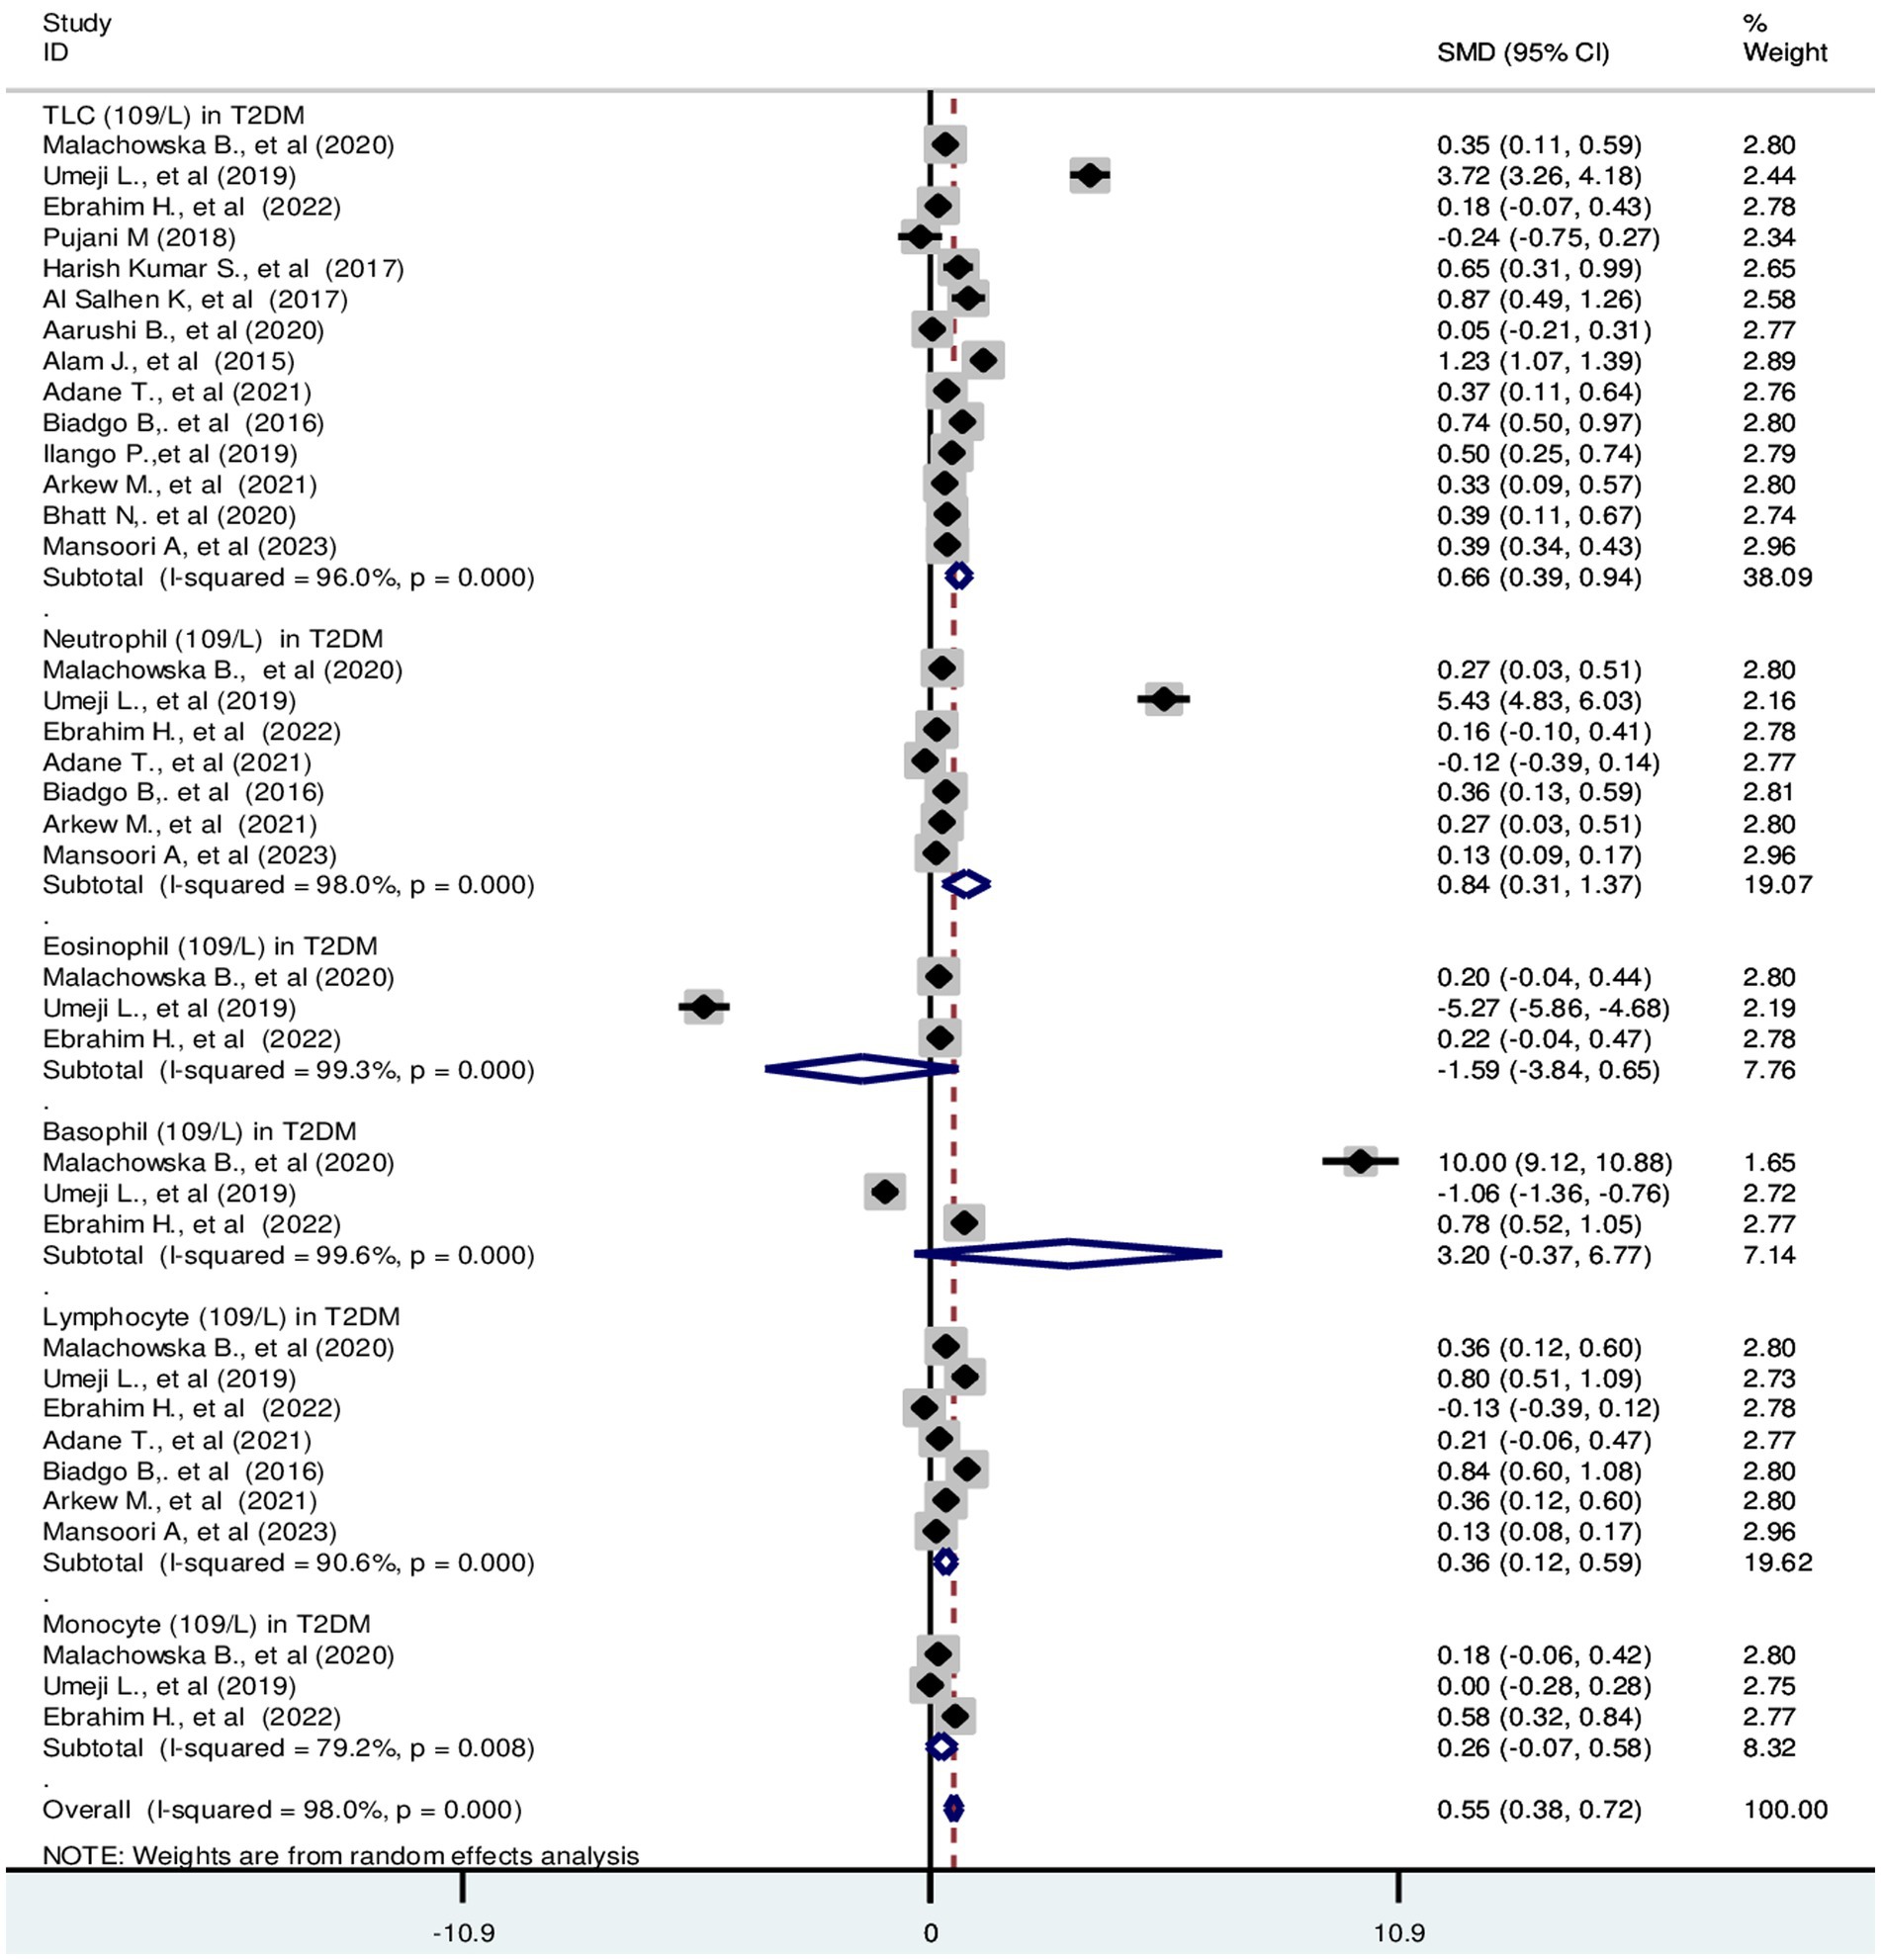
Figure 2. Forest plot depicting total leukocyte and absolute differential count of WBC in T2DM. The black dot in the middle of the gray box reflects the estimated mean difference of each studies point and the line shows the 95% CI of the estimates. The gray boxes represent each study weight that contributes to the estimates. I-squared illustrates the heterogeneity between the included studies. p-value indicates statistical significance of heterogeneity as well as mean difference.
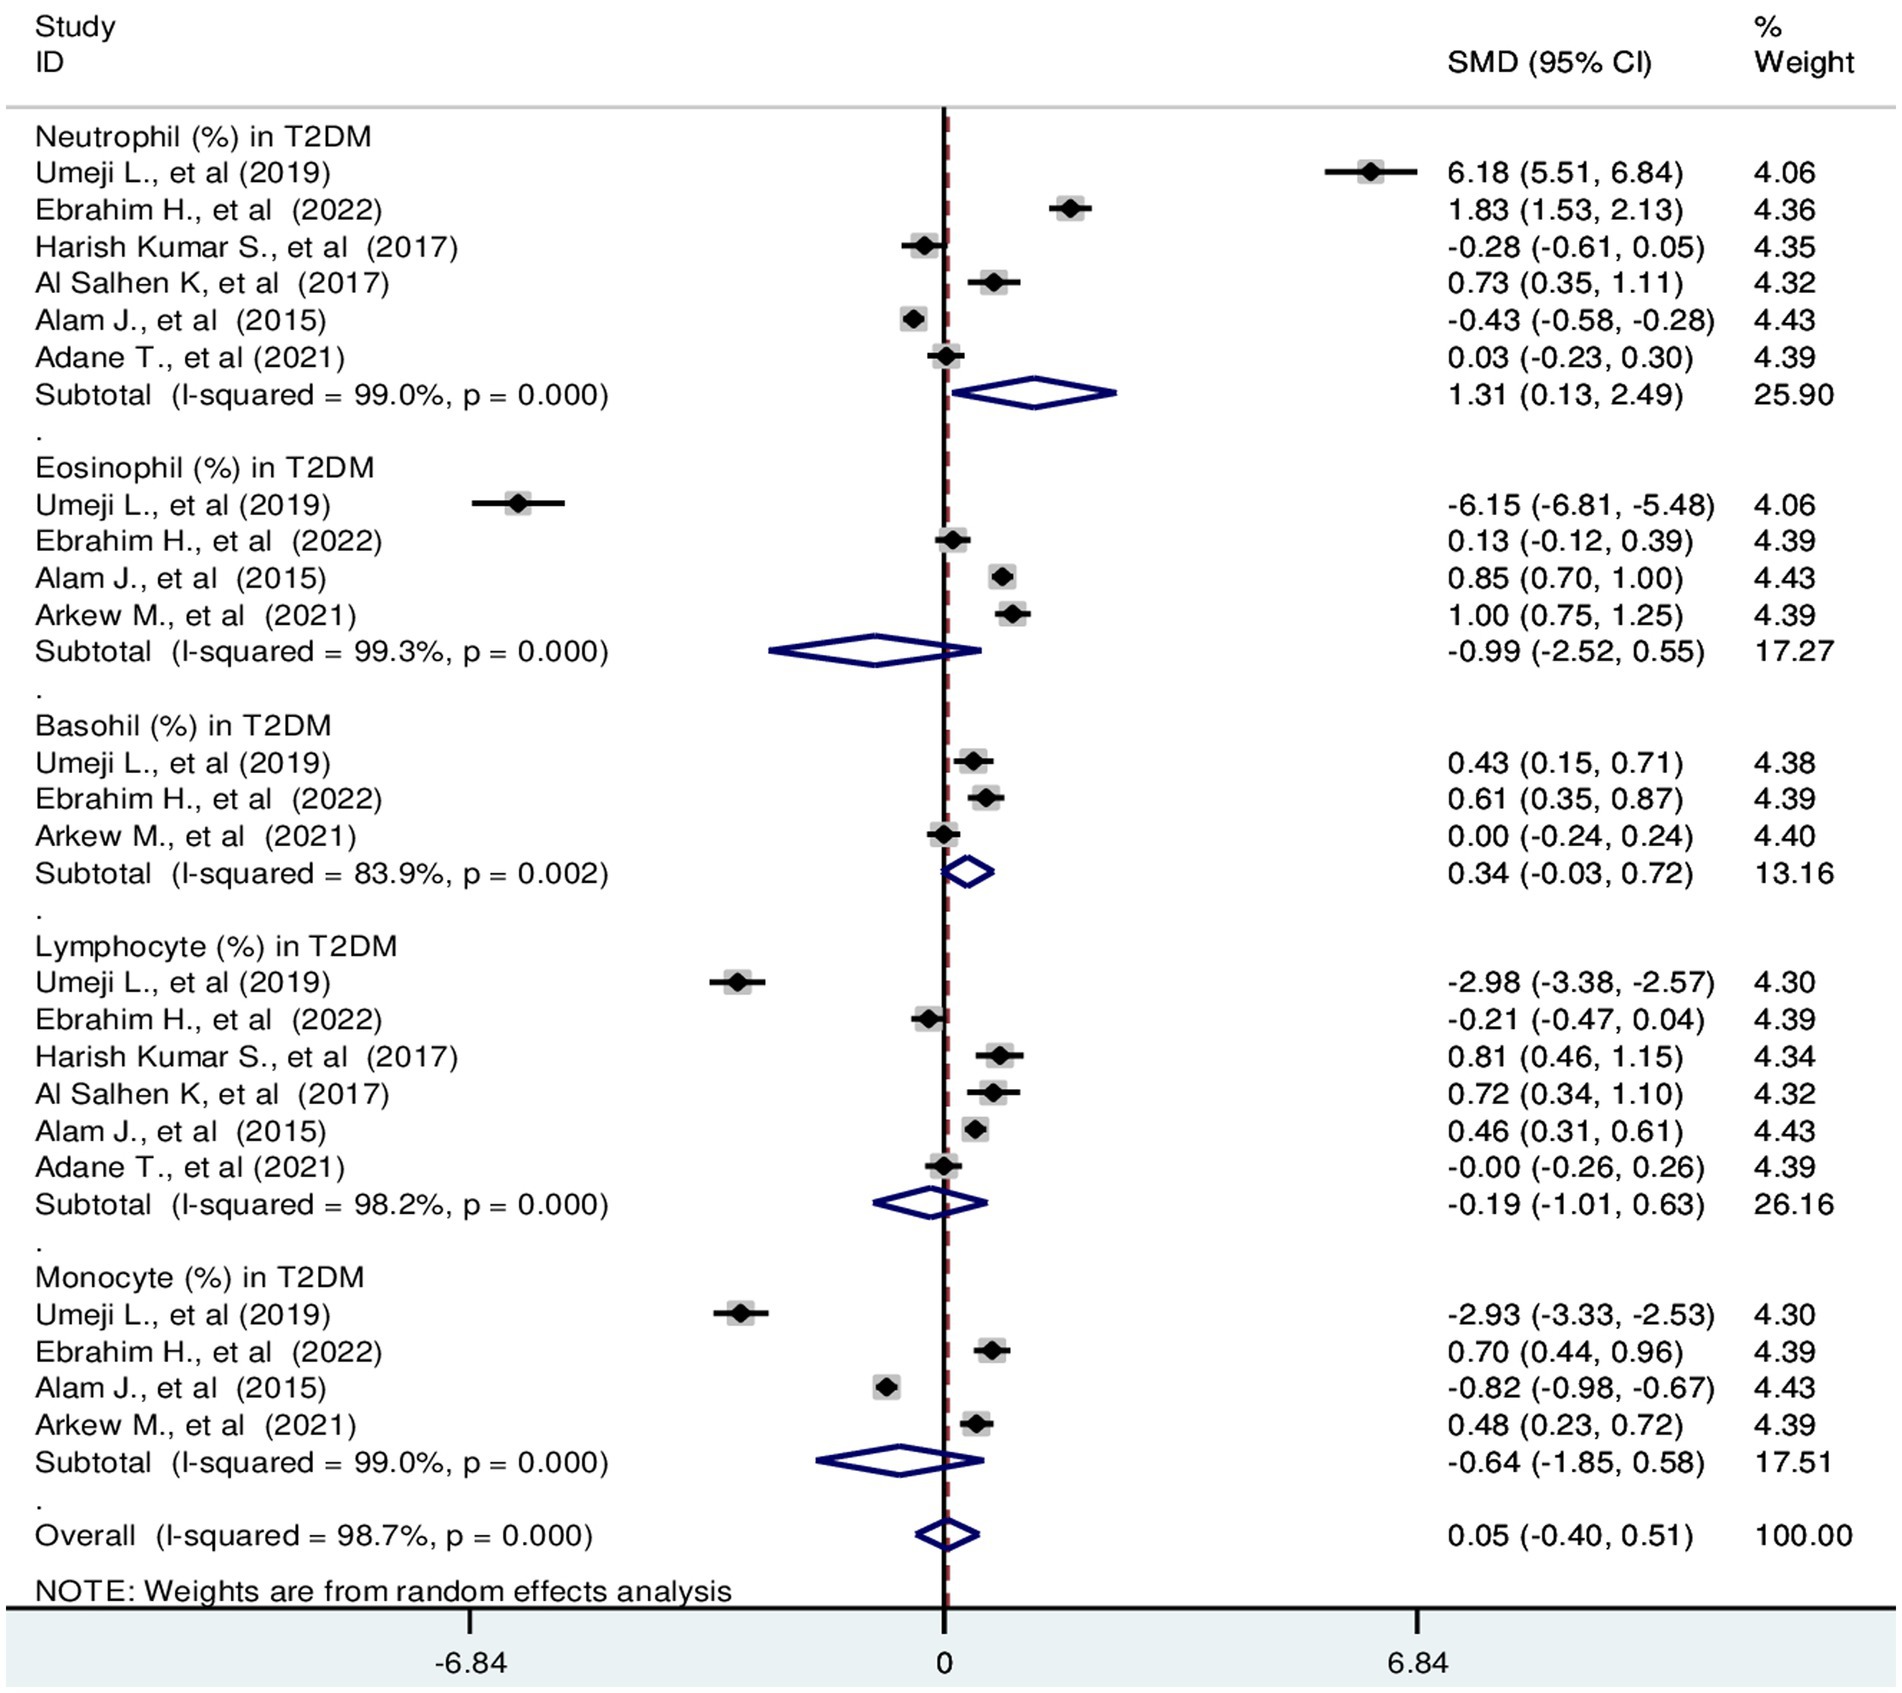
Figure 3. Forest plot depicting relative differential WBC count in T2DM. The black dot in the middle of the gray box reflects the estimated mean difference in relative WBC parameters of each studies point and the line shows the 95% CI of the estimates. The gray boxes represent each study weight that contributes to the contributes to the estimates. I-squared illustrates the heterogeneity between the included studies. p-value indicates statistical significance of heterogeneity as well as mean difference.
White blood cell parameters in T1DM
The pooled SMD of TLC in T1DM patients was −0.21 (109/L); 95% CI: −0.85, 0.44. The SMD of differential counts of WBC parameters; neutrophils, lymphocytes, monocytes and basophils was −0.10 (109/L); 95% CI: −0.90, 0.70, −0.69 (109/L); 95% CI: −1.34, −0.04, 0.19 (109/L); 95% CI: −0.61, 1.00 and −0.32(109/L); 95% CI: −0.52, −0.12, respectively with a p-value <0.001 (Figure 4).
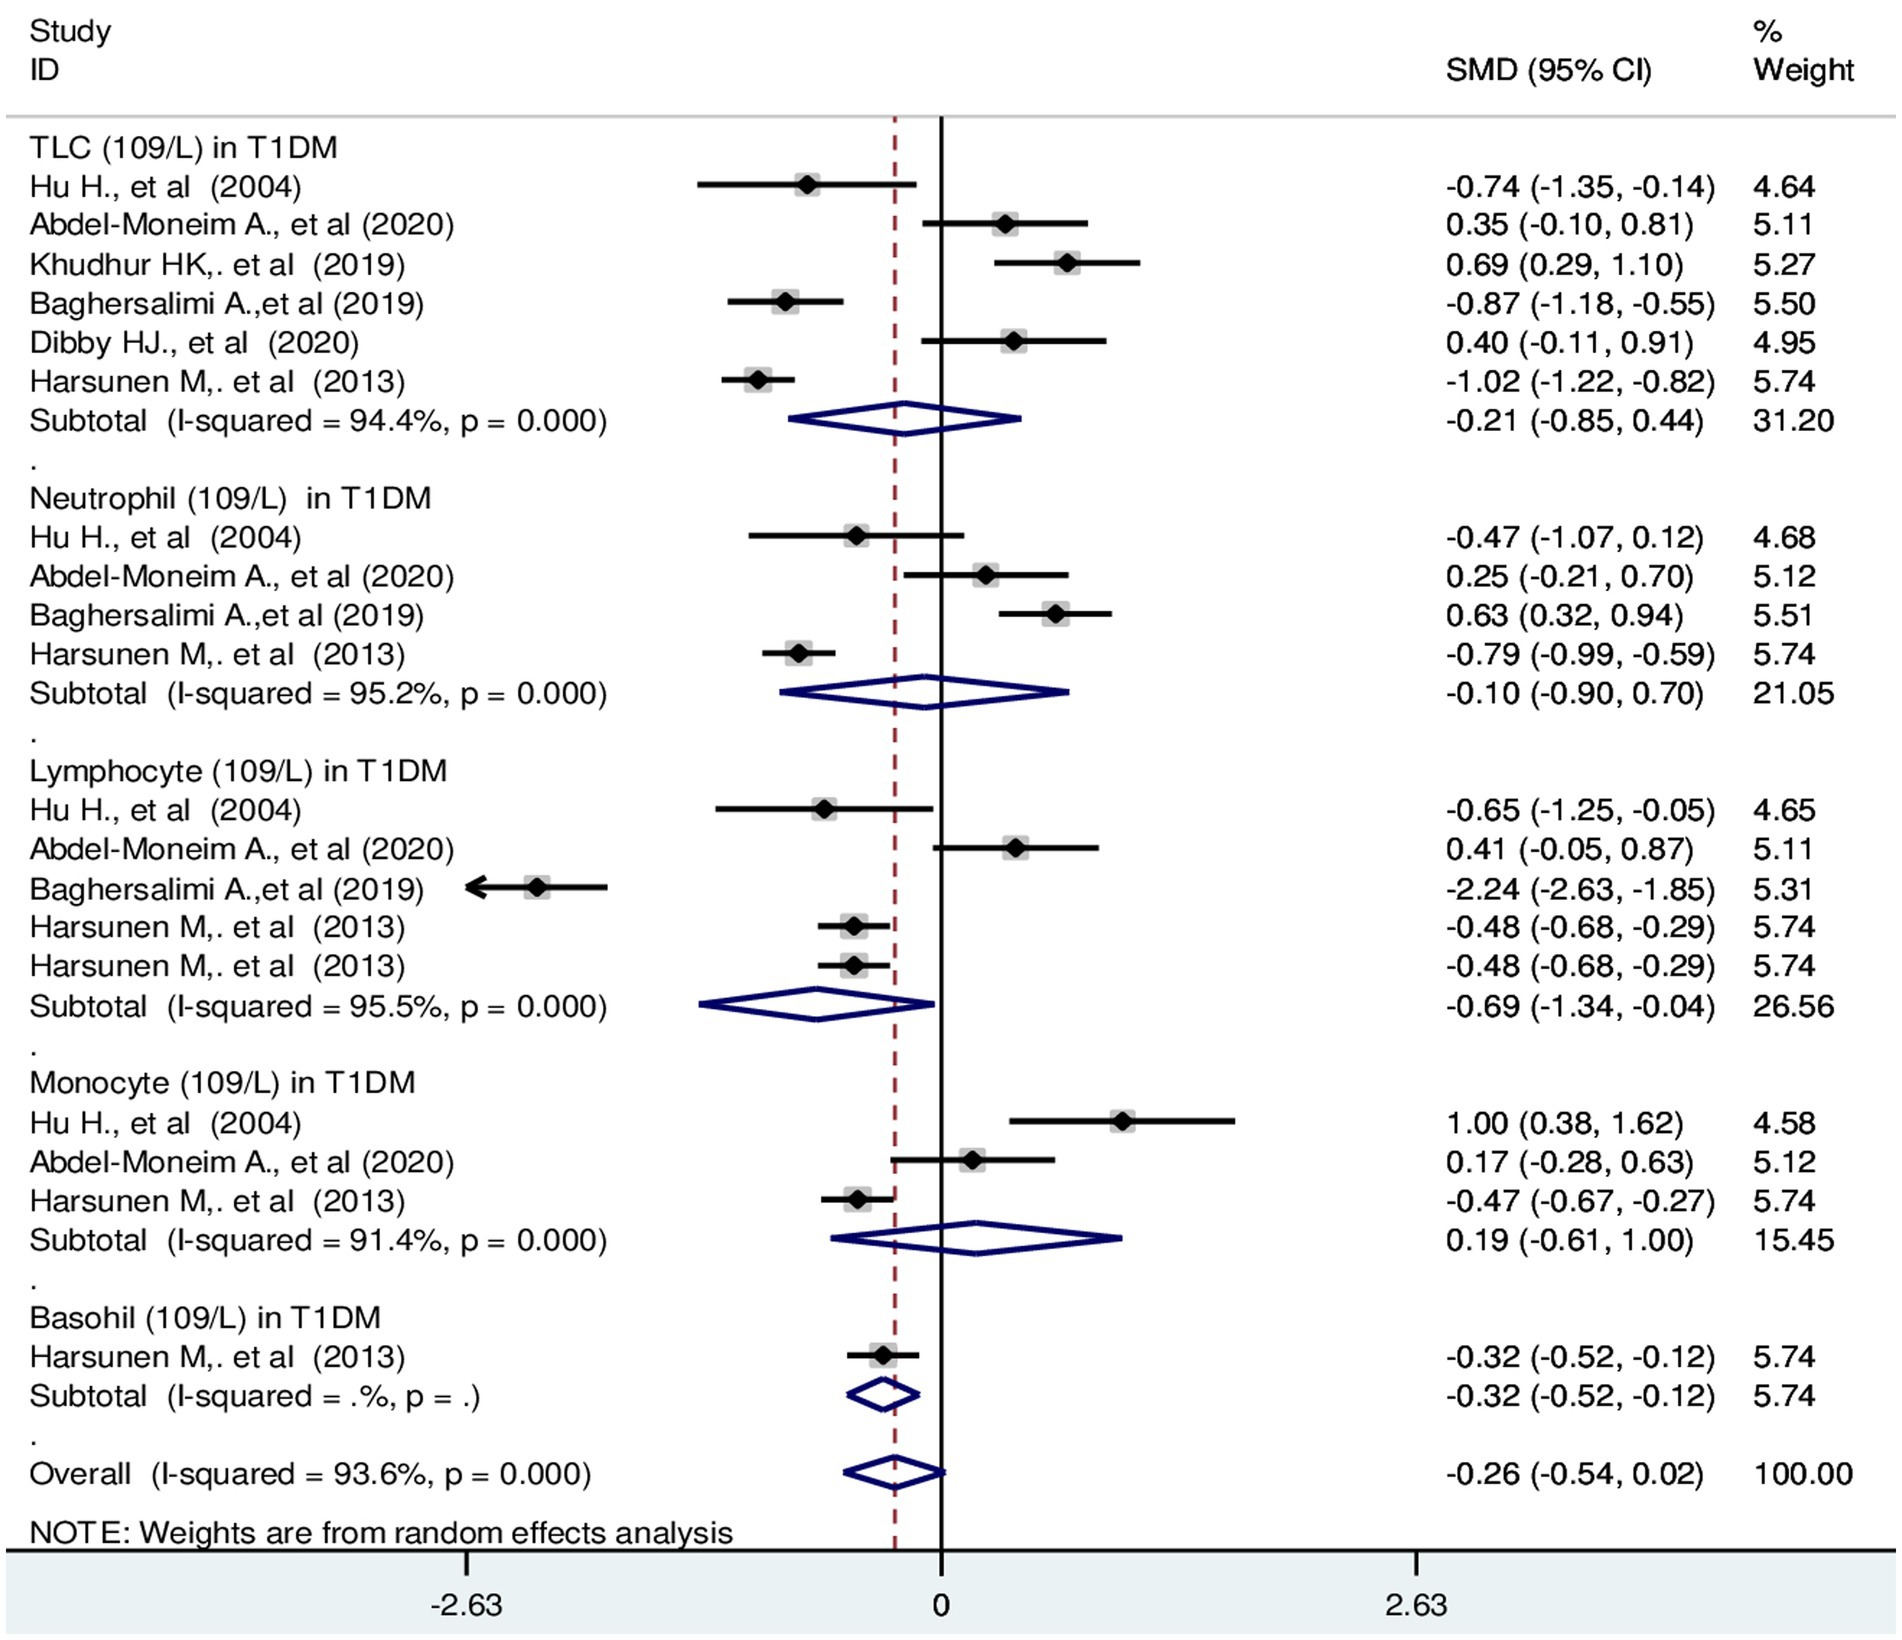
Figure 4. Forest plot depicting total leukocyte and differential count of WBC in T1DM. The black dot in the middle of the gray box reflects the estimated mean difference of each studies point and the line shows the 95% CI of the estimates. The gray boxes represent each study weight that contributes to the estimates.I-squared illustrates the heterogeneity between the included studies. p-value indicates statistical significance of heterogeneity as well as mean difference.
Red blood cell parameters In T2DM
The pooled SMD in RBC parameters in T2DM were as follows: RBC: −0.57 (106/μL); 95% CI: −0.97, −0.17, Hb: −0.73 g/dL; 95% CI: −1.09, −0.37 and HCT: −1.22%; 95% CI: −1.84, −0.61 with a p-value <0.001 (Figure 5).
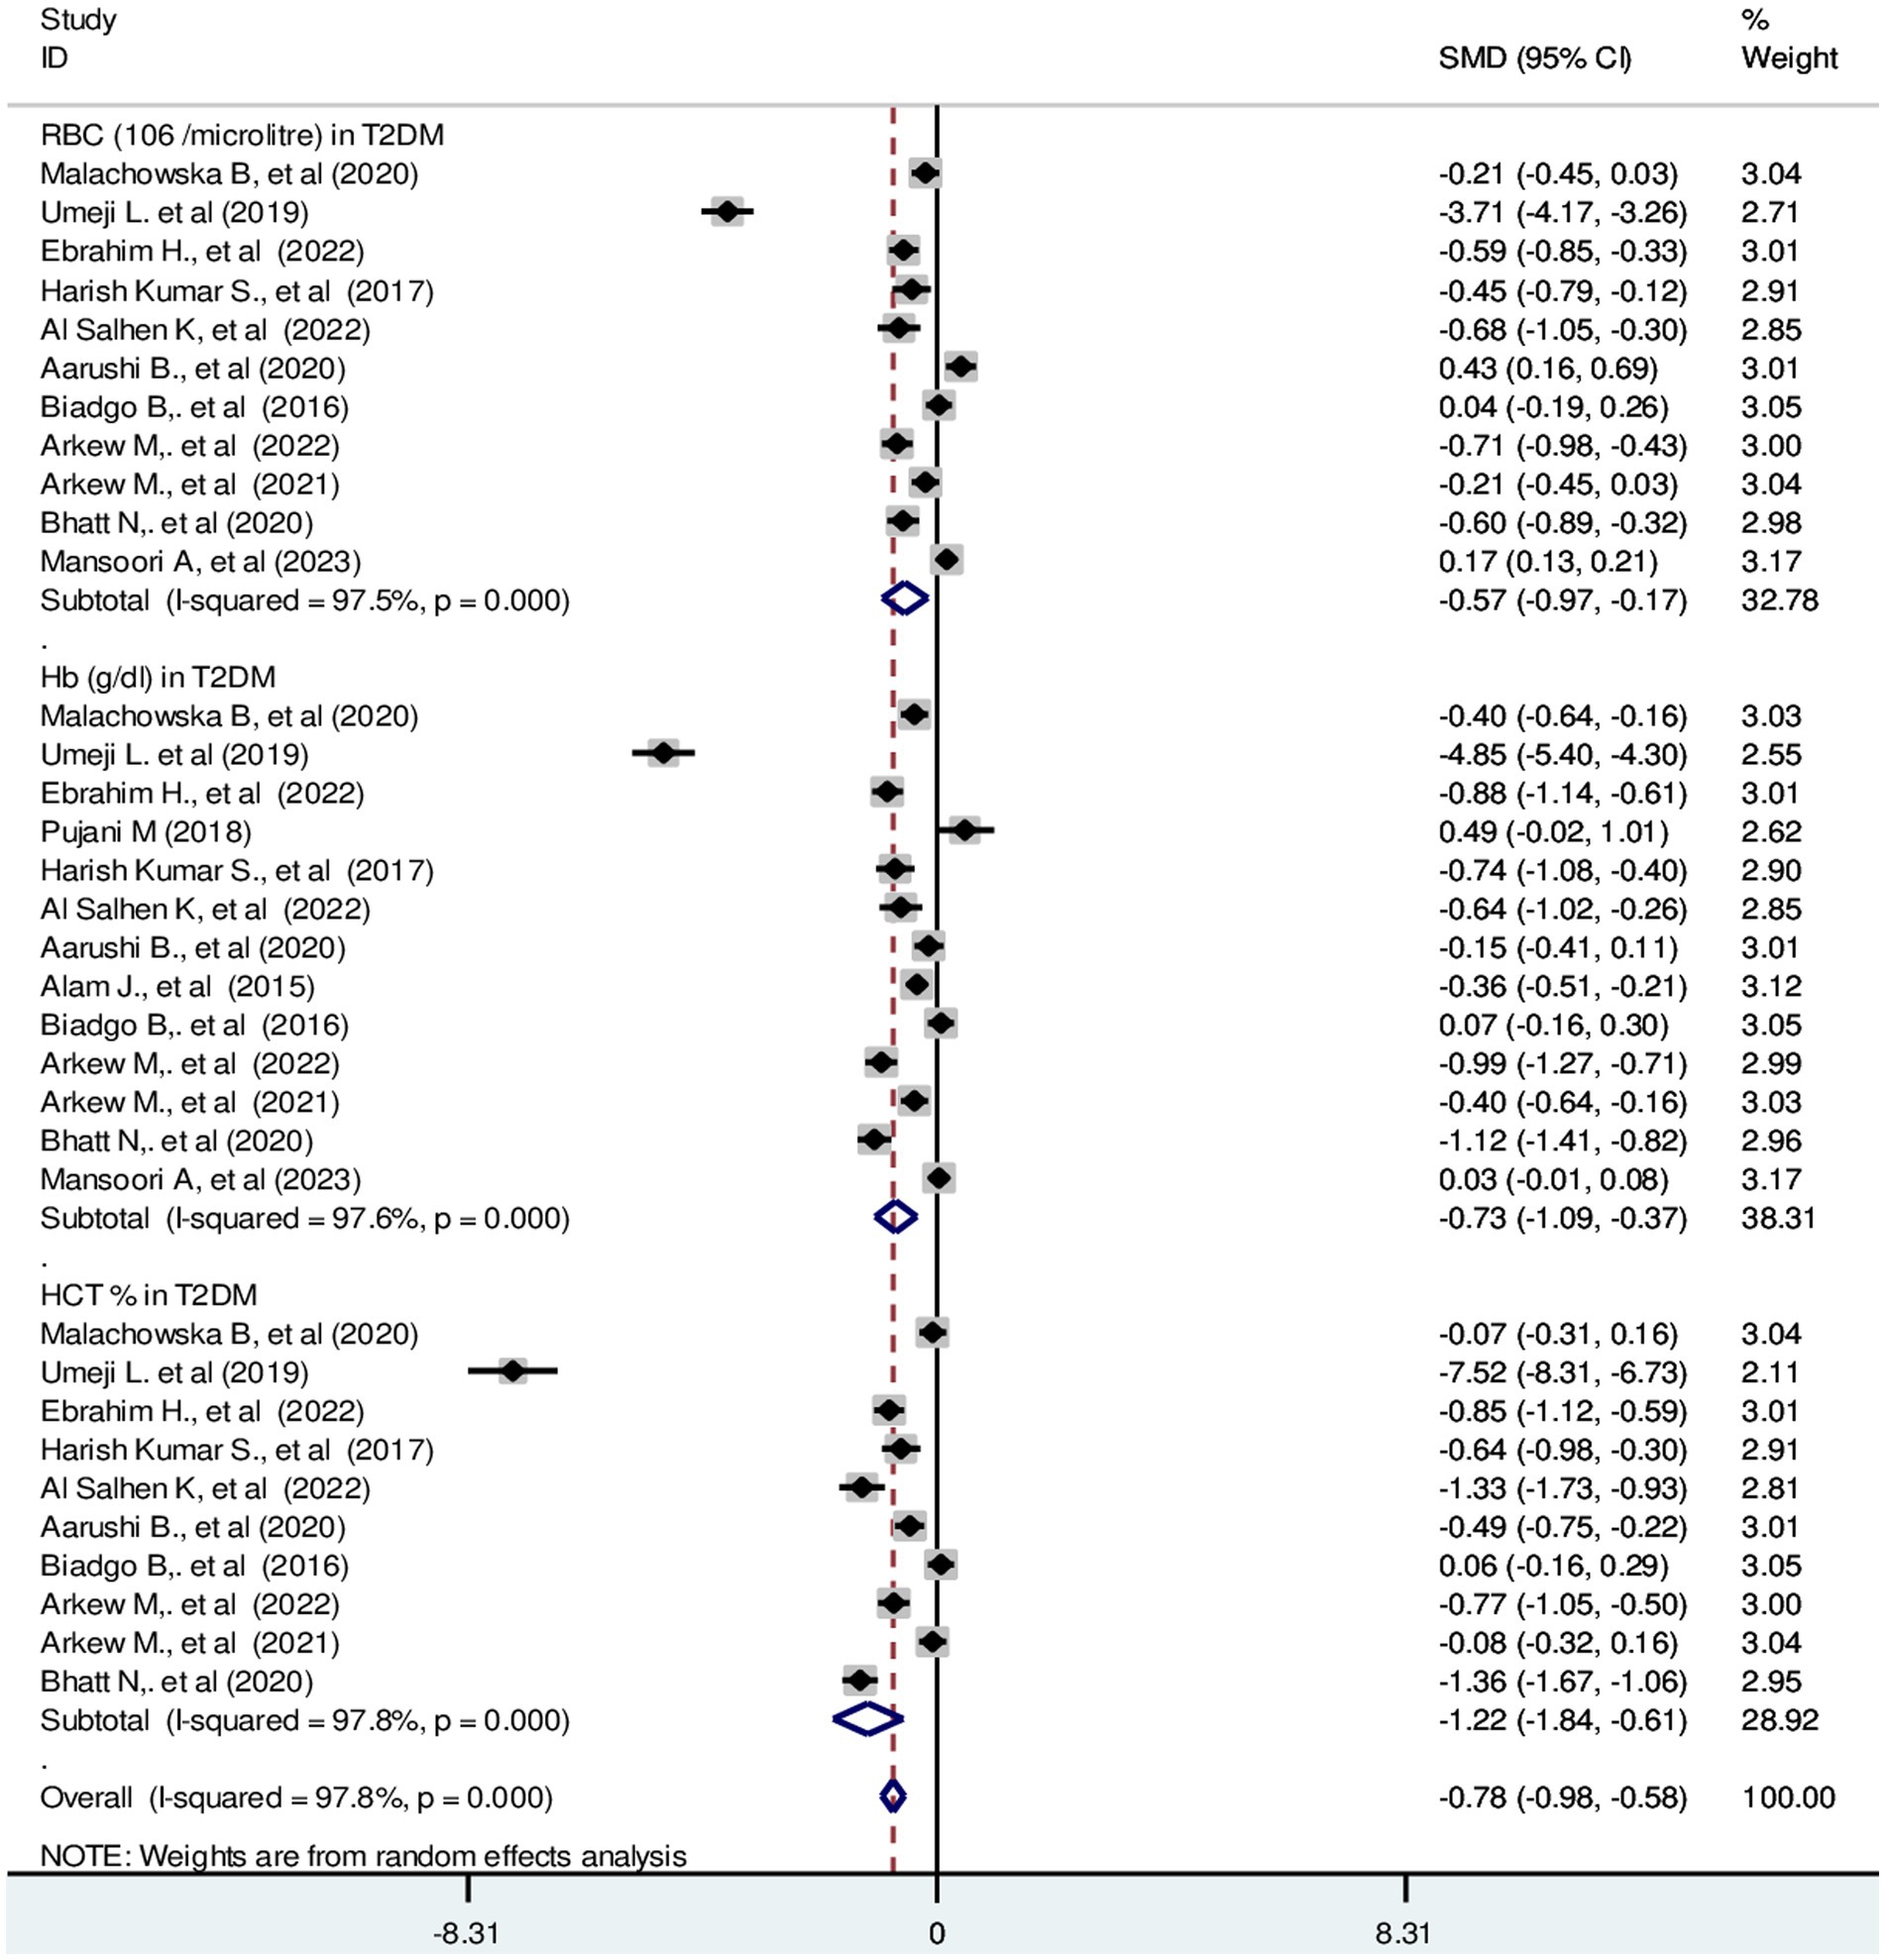
Figure 5. Forest plot showing RBC parameters in T2DM. The black dot in the middle of the gray box reflects the estimated mean difference of each studies point and the line shows the 95% CI of the estimates. The gray boxes represent each study weight that contributes to the estimates. I-squared illustrates the heterogeneity between the included studies. p-value indicates statistical significance of heterogeneity as well as mean difference.
Red blood cell parameters in T1DM
The pooled SMD in RBC parameters in T1DM were as follows: RBC: −1.23 (106/μL); 95% CI: −1.69, −0.78, p-value = 0.23, Hb: −0.80 g/dL; 95% CI: −1.28, −0.32, with a p-value <0.001 and HCT: −0.29%; 95% CI: −0.84, −0.25 with a p-value = 0.008, respectively (Figure 6).
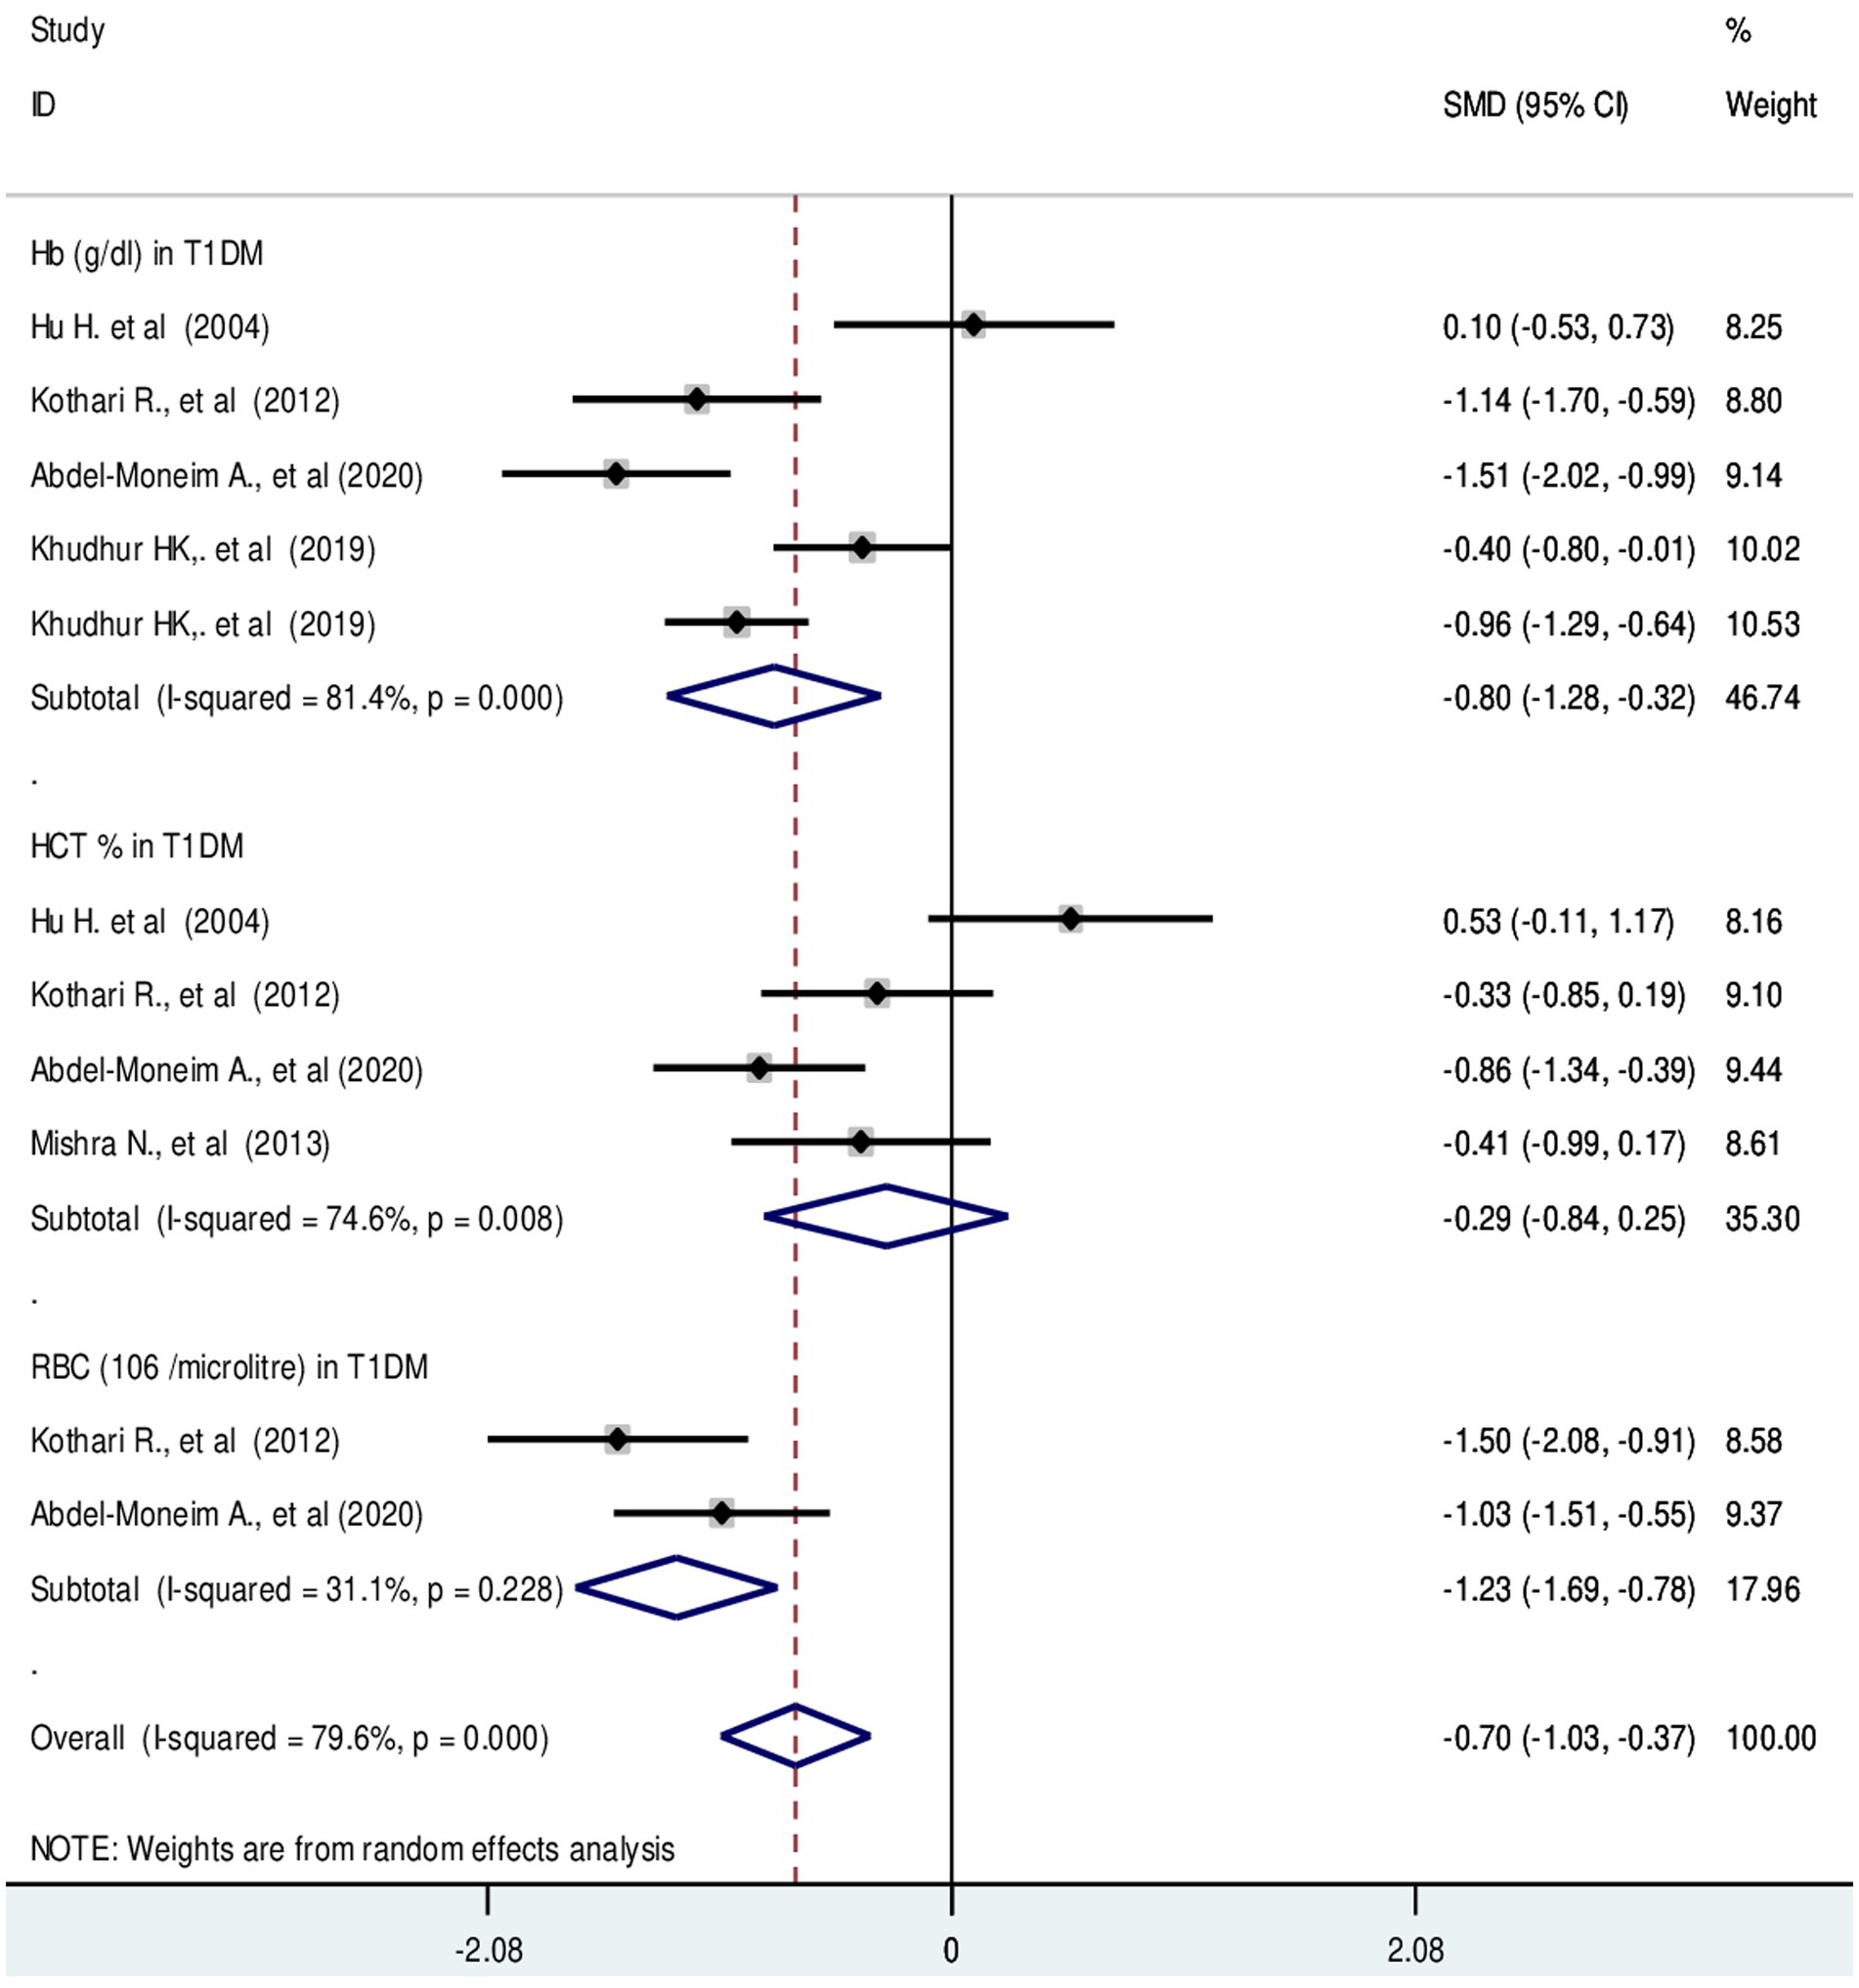
Figure 6. Forest plot showing RBC parameters in T1DM. The black dot in the middle of the gray box reflects the estimated mean difference of each studies point and the line shows the 95% CI of the estimates. The gray boxes represent each study weight that contributes to the estimates. I-squared illustrates the heterogeneity between the included studies. p-value indicates statistical significance of heterogeneity as well as mean difference.
Discussion
Diabetes is a serious and chronic disease that is a major public health concern. Uncontrolled diabetes increases the risk of metabolic, cellular, and blood anomalies, which in turn lead to vascular problems, cancer, and mortality (12, 46). However, the accumulated evidence on the hematological profile of diabetic patients is less clear and contradictory for the management of patients. The main aim of this evidence-based study was to assess changes in hematological parameters (WBC and RBC) in T1DM and T2DM in order to provide accurate and substantial information for proper management of diabetes.
In this study we found that the TLC count was significantly increased in T2DM patients. Additionally, absolute differential counts of neutrophils, basophils, lymphocytes and monocytes were increased. This finding is supported by several studies (14, 18–20). However, the same finding is not supported by studies conducted in Ethiopia and India (18, 21). The possible explanation for the leukocytosis may be related to insulin resistance. Diabetes mellitus causes endothelial dysfunction, hypertension and damage to the vascular bed through a variety of biological mechanisms, including the formation of ROS, resulting in an imbalance between vasodilators and vasoconstrictors. This condition of vascular remodeling may contribute to disturbances in WBC parameters (47). Ischemic heart disease and peripheral arterial disease have also been associated with higher neutrophil counts (48, 49). These conditions are common complications of diabetes (50).
In addition, neutrophils have also been suggested as a marker of inflammation. It is a fact that chronic low-grade inflammation is involved in the pathogenesis of obese T2DM. Adipose tissue is the main trigger of low-grade inflammation in obesity-related T2DM with prominent infiltration of WBC components and immune cells (51–53).
Moreover, absolute and relative eosinophil counts decreased in T2DM as compared to healthy controls. This may be related to the systemic inflammation of diabetes. Meanwhile, eosinopenia is an emerging marker of inflammation (54). It is a fact that the release of inflammatory mediators is enhanced by hyperglycemia and diabetes-induced ROS (55). In addition, cytokines, particularly interleukin-3, interleukin-5 and granulocyte-macrophage colony-stimulating factors control and regulate the formation of eosinophils. The formation and maturation of eosinophils may be impeded by a decrease in these crucial cytokines (56). Indeed, the relative differential count of monocytes and lymphocytes was significantly decreased in T2DM.
In T1DM TLC, neutrophils, basophils and lymphocytes were found to be decreased. This finding is supported by a number of studies (22, 24, 25). A possible explanation would be cell-specific autoantibodies (22). Reduced numbers of neutrophils could be due to abnormal neutrophil yield and maturation, peripheral consumption or damage, and tissue retention (57, 58). Alteration of neutrophil migration may be another reason. The rate of neutrophil migration is lower in T1DM than in T2DM and healthy controls (59). Moreover, patients with T1DM are at risk of developing neutropenia due to neutrophil sequestration in pancreatic tissue or neutrophil infiltration of the islets of Langerhans (60–62). The neutrophil count mediates a decrease in the total WBC count. However, the finding is not supported by reports of recent studies (26–28). Surprisingly, lymphocytes reflect a calm and controlled immune response to reduce cardiac damage and decreased lymphocytes suggest an increment in apoptosis (63). Generally, perturbation of leukocyte homeostasis may indicate the involvement of the innate immune system in the progression of T1DM. Low neutrophil counts are linked with defective extravasation, a compromised bone marrow environment, a shortened half-life, increased turnover and enhanced clearance by macrophages during chronic autoimmune inflammation and islet autoimmunity (22). Additionally, T1DM is characterized by cellular-mediated autoimmune destruction of β cells in the pancreas. This aberrant T cell activation can destroy immune cells (64). Activated phagocytosis may be another explanation. Natural killer cells (NKC) can affect neutrophils during the activation of phagocytosis (65).
Moreover, this study revealed an increased monocyte count in T1DM. The possible explanation may be the severity of diabetic ketoacidosis and evidence of infection. Patients with severe diabetic ketoacidosis had higher WBC counts than those with moderate diabetic ketoacidosis (66, 67). The incidence of leukocytosis was significantly higher in patients with diabetic ketoacidosis (68). Metabolic acidosis and ketosis are the hallmarks of T1DM. In addition monocytosis may be a leukemoid reaction rather than a systemic inflammatory response. Imbalances in hormones, cytokines, and their mediators may also promote an increase in monocyte counts (67, 69).
Regarding RBC parameters; HCT, Hb and RBC mass exhibited a significant decrease in type 2 diabetic patients compared with non-diabetic controls. In T1DM, HCT and Hb values were significantly decreased. However, there is no significant difference in RBC compared with their counterparts. The possible explanation for decreased RBC parameters would be bone marrow depression, hematotoxic effects of hematopoietic precursor cells. Additionally, hyperglycemia may have long-term effects that result in the production of ROS, which could lead to irreversible glycation of Hb and RBC membranes (70, 71). Indeed, marked hematological abnormalities in children with T1DM are linked with inflammation and oxidative stress (26). Besides, hypoinsulinemia would be another reason for decreased erythropoiesis. Insulin has a synergistic effect on erythropoietin hormone stimulation. Defective iron utilization and malabsorption syndrome in association with chronic inflammation and obesity may be another explanation. Because, the central regulatory protein, hepcidin increases with diabetic-induced inflammation (72). It known that, decreased serum ferritin level in T2DM (73). Persistent hyperglycemia invariably subjects RBC to several alterations that further influence hemorheology and microcirculation (74). Moreover, increased expression of chronic hyperglycemia-induced proinflammatory cytokines like interleukin 1 and 6, tumor necrosis factor, transforming growth factor and interferons may be involved in erythroid progenitor cell apoptosis. Elevated levels of these cytokines contribute significantly to insulin resistance and cause anemia. The increase in interleukin-6 in hyperglycemic individuals has an anti-erythropoietic effect that may promote the death of immature RBCs (75).
Substantial heterogeneity was found in this study. Significant heterogeneity was observed in pooling RBC in T2DM, and WBC parameters. The possible explanations would be differences in study design, target population, statistical methods, reference range, standard operating procedures, electronic cell counters and sample size.
Strengths and limitations of this study
The articles were thoroughly searched and retrieved. The study was conducted with high-quality records in accordance with the PRISMA guidelines. However, there were some limitations. First, the source of substantial heterogeneity was not identified. Second, only articles published in the English language were included. Third, the relative differential count of WBC in T1DM was not investigated.
Conclusion and recommendations
Total leukocyte count and absolute differential counts; neutrophils, basophils, lymphocytes and monocytes were remarkably increased in T2DM. Additionally, the relative counts of neutrophils and basophils were increased. In contrast, the relative lymphocyte eosinophil and monocyte counts were decreased. Similarly, eosinophil count was significantly decreased in T2DM. In patients with T1DM, WBC parameters were significantly decreased except for monocytes. Hb and HCT were found to be significantly decreased in both T1DM and T2DM patients compared to healthy controls. Moreover, RBC mass was significantly decreased in T2DM, but no significant difference was found in T1DM compared with their counterparts. Comparatively, the leukocyte subset counts were lower in T1DM than in T2DM. In summary, this study demonstrated considerable changes in WBC and RBC parameters in both diabetic patients. Therefore, the findings have implications for the management of diabetic patients and highlight a diagnostic significance. Hence, early assessment and evaluation of hematological parameters is very important for the proper management of diabetes and its complications.
Data availability statement
The original contributions presented in the study are included in the article/Supplementary material, further inquiries can be directed to the corresponding author.
Author contributions
GB: Conceptualization, Data curation, Formal analysis, Funding acquisition, Investigation, Methodology, Project administration, Resources, Software, Supervision, Validation, Visualization, Writing – original draft, Writing – review & editing. DA: Conceptualization, Data curation, Formal analysis, Funding acquisition, Investigation, Methodology, Project administration, Resources, Software, Supervision, Validation, Visualization. EA: Conceptualization, Data curation, Formal analysis, Investigation, Methodology, Project administration, Software, Supervision, Validation, Visualization. AG: Conceptualization, Data curation, Formal analysis, Investigation, Methodology, Project administration, Software, Supervision, Validation, Visualization. TD: Conceptualization, Data curation, Formal analysis, Investigation, Methodology, Project administration, Software, Supervision, Validation, Visualization. SK: Conceptualization, Data curation, Formal analysis, Investigation, Methodology, Project administration, Software, Supervision, Validation, Visualization.
Funding
The author(s) declare that no financial support was received for the research, authorship, and/or publication of this article.
Conflict of interest
The authors declare that the research was conducted in the absence of any commercial or financial relationships that could be construed as a potential conflict of interest.
Publisher’s note
All claims expressed in this article are solely those of the authors and do not necessarily represent those of their affiliated organizations, or those of the publisher, the editors and the reviewers. Any product that may be evaluated in this article, or claim that may be made by its manufacturer, is not guaranteed or endorsed by the publisher.
Supplementary material
The Supplementary material for this article can be found online at: https://www.frontiersin.org/articles/10.3389/fmed.2024.1294290/full#supplementary-material
References
1. American Diabetes Association. Classification and diagnosis of diabetes: standards of medical care in diabetes-2019. Diabetes Care. (2019) 42:S13–s28. doi: 10.2337/dc19-S002
2. World Health Organization. Classification of diabetes mellitus. (2019). Available at: https://www.who.int/publications/i/item/classification-of-diabetes-mellitus
3. Sun, H, Saeedi, P, Karuranga, S, Pinkepank, M, Ogurtsova, K, Duncan, BB, et al. IDF diabetes atlas: global, regional and country-level diabetes prevalence estimates for 2021 and projections for 2045. Diabetes Res Clin Pract. (2022) 183:109119. doi: 10.1016/j.diabres.2021.109119
4. Cheng, YJ, Gregg, EW, Brinks, R, Saydah, SH, Albright, AL, and Imperatore, G. 103-OR: change in lifetime risk for diabetes in the United States, 1997–2015. Diabetes. (2020) 69:103-OR. doi: 10.2337/db20-103-OR
5. Kim, H-G. Cognitive dysfunctions in individuals with diabetes mellitus. Yeungnam Univ J Med. (2019) 36:183–91. doi: 10.12701/yujm.2019.00255
6. Ozougwu, J, Obimba, K, Belonwu, C, and Unakalamba, C. The pathogenesis and pathophysiology of type 1 and type 2 diabetes mellitus. J Physiol Pathophysiol. (2013) 4:46–57. doi: 10.5897/JPAP2013.0001
7. American Diabetes Association. Diagnosis and classification of diabetes mellitus. Am Diabetes Assoc Diabetes Care. (2014) 37:S81–90. doi: 10.2337/dc14-S081
8. Ogurtsova, K, da Rocha, FJ, Huang, Y, Linnenkamp, U, Guariguata, L, Cho, NH, et al. IDF diabetes atlas: global estimates for the prevalence of diabetes for 2015 and 2040. Diabetes Res Clin Pract. (2017) 128:40–50. doi: 10.1016/j.diabres.2017.03.024
9. Zhang, L, Long, J, Jiang, W, Shi, Y, He, X, Zhou, Z, et al. Trends in chronic kidney disease in China. N Engl J Med. (2016) 375:905–6. doi: 10.1056/NEJMc1602469
10. Sobczak, AI, and Stewart, AJ. Coagulatory defects in type-1 and type-2 diabetes. Int J Mol Sci. (2019) 20:6345. doi: 10.3390/ijms20246345
11. American Diabetes Association. Diagnosis and classification of diabetes mellitus. Diabetes Care. (2013) 36:S67–74. doi: 10.2337/dc13-S067
12. Saeedi, P, Petersohn, I, Salpea, P, Malanda, B, Karuranga, S, Unwin, N, et al. Global and regional diabetes prevalence estimates for 2019 and projections for 2030 and 2045: results from the international diabetes federation diabetes atlas, 9th edition. Diabetes Res Clin Pract. (2019) 157:107843. doi: 10.1016/j.diabres.2019.107843
13. Fava, C, Cattazzo, F, Hu, ZD, Lippi, G, and Montagnana, M. The role of red blood cell distribution width (RDW) in cardiovascular risk assessment: useful or hype? Ann Transl Med. (2019) 7:581. doi: 10.21037/atm.2019.09.58
14. Arkew, M, Yemane, T, Mengistu, Y, Gemechu, K, and Tesfaye, G. Hematological parameters of type 2 diabetic adult patients at Debre Berhan Referral Hospital, Northeast Ethiopia: a comparative cross-sectional study. PLoS One. (2021) 16:e0253286. doi: 10.1371/journal.pone.0253286
15. Mahdi, A, Cortese-Krott, MM, Kelm, M, Li, N, and Pernow, J. Novel perspectives on redox signaling in red blood cells and platelets in cardiovascular disease. Free Radic Biol Med. (2021) 168:95–109. doi: 10.1016/j.freeradbiomed.2021.03.020
16. Mbata, CA, Adegoke, A, Nwagu, C, and Nyeso, W. Some haematological parameters in diabetic patients in Port Harcourt Nigeria. Am J Med Sci. (2015) 3:2348–7186.
17. Mirza, S, Hossain, M, Mathews, C, Martinez, P, Pino, P, Gay, JL, et al. Type 2-diabetes is associated with elevated levels of TNF-alpha, IL-6 and adiponectin and low levels of leptin in a population of Mexican Americans: a cross-sectional study. Cytokine. (2012) 57:136–42. doi: 10.1016/j.cyto.2011.09.029
18. Adane, T, Asrie, F, Getaneh, Z, and Getawa, S. White blood cells and platelet profiles of diabetic patients at University of Gondar specialized referral hospital: a comparative cross-sectional study. J Clin Lab Anal. (2021) 35:e23808. doi: 10.1002/jcla.23808
19. Biadgo, B, Melku, M, Abebe, SM, and Abebe, M. Hematological indices and their correlation with fasting blood glucose level and anthropometric measurements in type 2 diabetes mellitus patients in Gondar, Northwest Ethiopia. Diabetes Metab Syndr Obes. (2016) 9:91–9. doi: 10.2147/DMSO.S97563
20. Ilango, P, Vummidi, A, Suresh, V, Chandran, V, and Bharathy, V. Evaluation of periodontal and hematological findings in diabetes patients-a case-control study. Dentistry. (2019) 9:535. doi: 10.4172/2161-1122.1000535
21. Ebrahim, H, Fiseha, T, Ebrahim, Y, and Bisetegn, H. Comparison of hematological parameters between type 2 diabetes mellitus patients and healthy controls at Dessie comprehensive specialized hospital, Northeast Ethiopia: comparative cross-sectional study. PLoS One. (2022) 17:e0272145. doi: 10.1371/journal.pone.0272145
22. Harsunen, MH, Puff, R, D’Orlando, O, Giannopoulou, E, Lachmann, L, Beyerlein, A, et al. Reduced blood leukocyte and neutrophil numbers in the pathogenesis of type 1 diabetes. Horm Metab Res. (2013) 45:467–70. doi: 10.1055/s-0032-1331226
23. Korkmaz, O. Assessment of the platelet parameters in children with type 1 diabetes mellitus. J Endocrinol Metab. (2019) 8:144–8. doi: 10.14740/jem537
24. Hu, H, Li, N, Yngen, M, Östenson, CG, Wallén, N, and Hjemdahl, P. Enhanced leukocyte–platelet cross-talk in type 1 diabetes mellitus: relationship to microangiopathy. J Thromb Haemost. (2004) 2:58–64. doi: 10.1111/j.1538-7836.2003.00525.x
25. Baghersalimi, A, Koohmanaee, S, Darbandi, B, Farzamfard, V, Hassanzadeh Rad, A, Zare, R, et al. Platelet indices alterations in children with type 1 diabetes mellitus. J Pediatr Hematol Oncol. (2019) 41:e227–32. doi: 10.1097/MPH.0000000000001454
26. Abdel-Moneim, A, Zanaty, MI, El-Sayed, A, Khalil, RG, and Rahman, HA. Relation between oxidative stress and hematologic abnormalities in children with type 1 diabetes. Can J Diabetes. (2020) 44:222–8. doi: 10.1016/j.jcjd.2019.07.153
27. Khudhur, HK, and Al-Ani, HM. Hematological parameters in children with type-1 diabetes. Med J Babylon. (2019) 16:184. doi: 10.4103/MJBL.MJBL_24_19
28. Dibby, HJ, and Shlash, RF. The predictive value of red cell distribution (RDW) in patients with type 1 and type 2 diabetes mellitus. Med.Legal Update. (2020) 20:747–51. doi: 10.37506/v20%2Fi1%2F2020%2Fmlu%2F194409
29. Umeji, L, Paul, A, Felix, S, Umeji, C, Folake, A, and Chrisitian, O. Haematological profile of diabetes and non-diabetes patients in Abuja, Nigeria. Int J Res Sci Innov. (2019) 6:2321–705.
30. Arkew, M, Asmerom, H, Tesfa, T, Tsegaye, S, Gemechu, K, Bete, T, et al. Red blood cell parameters and their correlation with glycemic control among type 2 diabetic adult patients in eastern Ethiopia: a comparative cross-sectional study. Diabetes Metab Syndr Obes. (2022) 15:3499–507. doi: 10.2147/DMSO.S386093
31. Bhatt, N, Dawande, P, Noman, O, Bahadure, S, and Bhake, A. Significance of hematological parameters in uncomplicated diabetes mellitus. Indian J Forensic Med Toxicol. (2020) 14:6279–85.
32. Mansoori, A, Sahranavard, T, Hosseini, ZS, Soflaei, SS, Emrani, N, Nazar, E, et al. Prediction of type 2 diabetes mellitus using hematological factors based on machine learning approaches: a cohort study analysis. Sci Rep. (2023) 13:663. doi: 10.1038/s41598-022-27340-2
33. Aarushi, B, Shankar, H, and Swati, S. Comparative analysis of haematological parameters in diabetics and non diabetics and their correlation with fasting blood sugar levels and glycated haemoglobin. Indian J Pathol Res Pract. (2020) 9:1. doi: 10.21088/ijprp.2278.148X.9120.18
34. Kizilgul, M, Sencar, E, Bekir, U, Beysel, S, Ozcelik, O, Ozbek, M, et al. Components of the complete blood count in type 2 diabetes mellitus with inadequate glycemic control. Dicle Tıp Dergisi. (2018) 45:113–20. doi: 10.5798/dicletip.410811
35. Rafaqat, S, and Rafaqat, S. Role of hematological parameters in pathogenesis of diabetes mellitus: a review of the literature. World J Hematol. (2023) 10:25–41. doi: 10.5315/wjh.v10.i3.25
36. Moher, D, Shamseer, L, Clarke, M, Ghersi, D, Liberati, A, Petticrew, M, et al. Preferred reporting items for systematic review and meta-analysis protocols (PRISMA-P) 2015 statement. Syst Rev. (2015) 4:1–9. doi: 10.1186/2046-4053-4-1
37. Moola, S, Munn, Z, Tufanaru, C, Aromataris, E, Sears, K, Sfetcu, R, et al. Chapter 7: systematic reviews of etiology and risk In: Joanna Briggs Institute reviewer’s manual : The Joanna Briggs Institute (2017) Available at: https://reviewersmanual.joannabriggs.org/display/manual
38. Barker, TH, Stone, JC, Sears, K, Klugar, M, Tufanaru, C, Leonardi-Bee, J, et al. The revised JBI critical appraisal tool for the assessment of risk of bias for randomized controlled trials. JBI Evid Synth. (2023) 21:494–506. doi: 10.11124/JBIES-22-00430
39. Borenstein, M, Hedges, LV, Higgins, JPT, and Rothstein, HR. A basic introduction to fixed-effect and random-effects models for meta-analysis. Res Synth Methods. (2010) 1:97–111. doi: 10.1002/jrsm.12
40. Pujani, M, Gahlawat, H, Agarwal, C, Chauhan, V, Singh, K, and Lukhmana, S. Platelet parameters: can they serve as biomarkers of glycemic control or development of complications in evaluation of type 2 diabetes mellitus. Iraqi J Hematol. (2018) 7:72–8. doi: 10.4103/ijh.ijh_8_18
41. Harish Kumar, S, Srinivasa, SV, and Prabhakar, K. Haematological profile of diabetes and non-diabetes patients in rural tertiary Centre. Int J Adv Med. (2017) 4:1271–5. doi: 10.18203/2349-3933.ijam20174111
42. Al Salhen, K, and Mahmoud, A. Hematological profile of patients with type 2 diabetic mellitus in El-Beida, Libya. Ibnosina J Med Biomed Sci. (2017) 9:76–80. doi: 10.4103/1947-489X.210115
43. Alam, J, Chandra, S, Mokarrama, M, Hoque, M, Hasan, M, and Islam, S. A comparative analysis of biochemical and hematological parameters in diabetic and non-diabetic adults. Adv Med Sci. (2015) 2:1–9.
44. Kothari, R, and Bokariya, P. A comparative study of haematological parameters in type 1 diabetes mellitus patients and healthy young adolescents. Int J Biol Med Res. (2012) 3:2429–32.
45. Mishra, N, and Singh, N. Blood viscosity, lipid profile, and lipid peroxidation in type-1 diabetic patients with good and poor glycemic control. N Am J Med Sci. (2013) 5:562–6. doi: 10.4103/1947-2714.118925
46. Xu, G, Liu, B, Sun, Y, Du, Y, Snetselaar, LG, Hu, FB, et al. Prevalence of diagnosed type 1 and type 2 diabetes among US adults in 2016 and 2017: population based study. BMJ. (2018):k1497. doi: 10.1136/bmj.k1497
47. Kaur, R, Kaur, M, and Singh, J. Endothelial dysfunction and platelet hyperactivity in type 2 diabetes mellitus: molecular insights and therapeutic strategies. Cardiovasc Diabetol. (2018) 17:1–17. doi: 10.1186/s12933-018-0763-3
48. Klopf, J, Brostjan, C, Eilenberg, W, and Neumayer, C. Neutrophil extracellular traps and their implications in cardiovascular and inflammatory disease. Int J Mol Sci. (2021) 22:559. doi: 10.3390/ijms22020559
49. Shah, AD, Denaxas, S, Nicholas, O, Hingorani, AD, and Hemingway, H. Neutrophil counts and initial presentation of 12 cardiovascular diseases: a CALIBER cohort study. J Am Coll Cardiol. (2017) 69:1160–9. doi: 10.1016/j.jacc.2016.12.022
50. Soyoye, DO, Abiodun, OO, Ikem, RT, Kolawole, BA, and Akintomide, AO. Diabetes and peripheral artery disease: a review. World J Diabetes. (2021) 12:827–38. doi: 10.4239/wjd.v12.i6.827
51. Johnson, AR, Justin Milner, J, and Makowski, L. The inflammation highway: metabolism accelerates inflammatory traffic in obesity. Immunol Rev. (2012) 249:218–38. doi: 10.1111/j.1600-065X.2012.01151.x
52. Van Greevenbroek, M, Schalkwijk, C, and Stehouwer, C. Obesity-associated low-grade inflammation in type 2 diabetes mellitus: causes and consequences. Neth J Med. (2013) 71:174–87.
53. Esser, N, Legrand-Poels, S, Piette, J, Scheen, AJ, and Paquot, N. Inflammation as a link between obesity, metabolic syndrome and type 2 diabetes. Diabetes Res Clin Pract. (2014) 105:141–50. doi: 10.1016/j.diabres.2014.04.006
54. Alkhalil, M, Kearney, A, Hegarty, M, Stewart, C, Devlin, P, Owens, CG, et al. Eosinopenia as an adverse marker of clinical outcomes in patients presenting with acute myocardial infarction. Am J Med. (2019) 132:e827–34. doi: 10.1016/j.amjmed.2019.05.021
55. Rashid, MS, Jamil, H, Hontecillas, R, and Bassaganya-Riera, J. Gene regulatory network reveals oxidative stress as the underlying molecular mechanism of type 2 diabetes and hypertension. BMC Med Genet. (2010) 3:45. doi: 10.1186/1755-8794-3-45
56. Huang, C, Wang, Y, Li, X, Ren, L, Zhao, J, Hu, Y, et al. Clinical features of patients infected with 2019 novel coronavirus in Wuhan, China. Lancet. (2020) 395:497–506. doi: 10.1016/S0140-6736(20)30183-5
57. Jackson, MH, Collier, A, Nicoll, JJ, Muir, AL, Dawes, J, Clarke, BF, et al. Neutrophil count and activation in vascular disease. Scott Med J. (1992) 37:41–3. doi: 10.1177/003693309203700205
58. Battaglia, M. Neutrophils and type 1 autoimmune diabetes. Curr Opin Hematol. (2014) 21:8–15. doi: 10.1097/MOH.0000000000000008
59. Huang, J, Xiao, Y, Zheng, P, Zhou, W, Wang, Y, Huang, G, et al. Distinct neutrophil counts and functions in newly diagnosed type 1 diabetes, latent autoimmune diabetes in adults, and type 2 diabetes. Diabetes Metab Res Rev. (2019) 35:e3064. doi: 10.1002/dmrr.3064
60. Mutua, V, and Gershwin, LJ. A review of neutrophil extracellular traps (NETs) in disease: potential anti-NETs therapeutics. Clin Rev Allergy Immunol. (2021) 61:194–211. doi: 10.1007/s12016-020-08804-7
61. Berezin, A. Neutrophil extracellular traps: the core player in vascular complications of diabetes mellitus. Diabetes Metab Syndr Clin Res Rev. (2019) 13:3017–23. doi: 10.1016/j.dsx.2018.07.010
62. Gupta, S, and Kaplan, MJ. The role of neutrophils and NETosis in autoimmune and renal diseases. Nat Rev Nephrol. (2016) 12:402–13. doi: 10.1038/nrneph.2016.71
63. Ibrahim, MSM, Khalil, AA, and Ali, A-SAA. Neutrophils-to-lymphocytes ratio in children with acute heart failure. Egypt J. Hosp Med. (2020) 81:1878–83. doi: 10.21608/ejhm.2020.121015
64. Singh, S, Usha, SG, Agrawal, NK, Singh, RG, and Kumar, SB. Prevalence of autoantibodies and HLA DR, DQ in type 1 diabetes mellitus. J Clin Diagn Res. (2016) 10:EC09-13:ZC34–7. doi: 10.7860/JCDR/2016/18657.8163
65. Costantini, C, Micheletti, A, Calzetti, F, Perbellini, O, Pizzolo, G, and Cassatella, MA. Neutrophil activation and survival are modulated by interaction with NK cells. Int Immunol. (2010) 22:827–38. doi: 10.1093/intimm/dxq434
66. Liu, Q, Yin, X, and Li, P. Clinical, hormonal, and biochemical characteristics of 70 chinese children with moderate to severe type 1 diabetic ketoacidosis. BMC Endocr Disord. (2022) 22:1–8. doi: 10.1186/s12902-022-01227-9
67. Xu, W, Wu, H-f, Ma, S-g, Bai, F, Hu, W, Jin, Y, et al. Correlation between peripheral white blood cell counts and hyperglycemic emergencies. Int J Med Sci. (2013) 10:758–65. doi: 10.7150/ijms.6155
68. Hamtzany, O, Weiser, G, Heiman, E, Avnon-Ziv, C, Auerbauch, A, and Levy-Khademi, F. Leukocytosis and C-reactive protein levels as indicators of infection in children with diabetic ketoacidosis. Pediatr Emerg Care. (2023) 39:828–31. doi: 10.1097/PEC.0000000000002934
69. Gonzalez, LK, Malhotra, S, Levine, M, and Jacobson-Dickman, E. Leukemoid reaction in a pediatric patient with diabetic ketoacidosis. Pediatr Emerg Care. (2017) 33:e27–9. doi: 10.1097/PEC.0000000000000558
70. Asmah, RH, Yeboah, G, Archampong, TN, Brown, CA, Amegatcher, G, and Adjei, DN. Relationship between oxidative stress and haematological indices in patients with diabetes in the Ghanaian population. Clin Diabetes Endocrinol. (2015) 1:4–8. doi: 10.1186/s40842-015-0008-2
71. Abdel, N, and Hamed, M. Alterations in hematological parameters: could it be a marker in diabetes mellitus? BAOJ Diabet. (2016) 2:1–9.
72. Weiner, MA, and Cairo, MS. Pediatric hematology/oncology secrets. Philadelphia PA, US: HENLEY & BELFUS. INC. Medical publisher An Imprint of Elsevier (2001).
73. Al-Dedah, RM, Al-Ghanimi, HH, Mashrea, DS, and Alnasawi, TH. Evaluation of haematological; biochemical parameters and lipid profile in patients with type 2 diabetes mellitus in Kerbala holy city. AIP Conf Proc. (2023) 2787:090028. doi: 10.1063/5.0149103
74. Zhou, Z, Mahdi, A, Tratsiakovich, Y, Zahorán, S, Kövamees, O, Nordin, F, et al. Erythrocytes from patients with type 2 diabetes induce endothelial dysfunction via arginase I. J Am Coll Cardiol. (2018) 72:769–80. doi: 10.1016/j.jacc.2018.05.052
75. Angelousi, A, and Larger, E. Anaemia, a common but often unrecognized risk in diabetic patients: a review. Diabetes Metab. (2015) 41:18–27. doi: 10.1016/j.diabet.2014.06.001
Glossary
Keywords: diabetic patients, hematological parameters, leukocyte count, T1DM, T2DM, red cell parameters
Citation: Bambo GM, Asmelash D, Alemayehu E, Gedefie A, Duguma T and Kebede SS (2024) Changes in selected hematological parameters in patients with type 1 and type 2 diabetes: a systematic review and meta-analysis. Front. Med. 11:1294290. doi: 10.3389/fmed.2024.1294290
Edited by:
Marko Lucijanic, Clinical Hospital Dubrava, CroatiaReviewed by:
Gergo A. Molnar, University of Pécs, HungaryKeneth Iceland Kasozi, University of Edinburgh, United Kingdom
Copyright © 2024 Bambo, Asmelash, Alemayehu, Gedefie, Duguma and Kebede. This is an open-access article distributed under the terms of the Creative Commons Attribution License (CC BY). The use, distribution or reproduction in other forums is permitted, provided the original author(s) and the copyright owner(s) are credited and that the original publication in this journal is cited, in accordance with accepted academic practice. No use, distribution or reproduction is permitted which does not comply with these terms.
*Correspondence: Getachew Mesfin Bambo, Z21lc2ZpbjIwMDdAZ21haWwuY29t
†These authors have contributed equally to this work and share first authorship
‡ORCID: Daniel Asmelash, https://orcid.org/0000-0001-8345-2982
Samuel Sahile Kebede, https://orcid.org/0000-0001-6409-3849