 Didi Bu
 Shaobo Duan
 Shanshan Ren
 Yujing Ma
 Yuanyuan Liu1
 Yahong Li
 Xiguo Cai
 Lianzhong Zhang
- 1Department of Ultrasound, Zhengzhou University People’s Hospital, Henan Provincial People’s Hospital, Zhengzhou University, Zhengzhou, China
- 2Department of Health Management, Henan Provincial People’s Hospital, Zhengzhou, China
- 3Department of Ultrasound, Henan Provincial People’s Hospital, Zhengzhou, China
- 4Department of Ultrasound, Henan University People’s Hospital, Henan Provincial People’s Hospital, Zhengzhou, China
- 5Henan Rehabilitation Clinical Medical Research Center, Henan Provincial People’s Hospital, Zhengzhou, China
- 6Henan Key Laboratory for Ultrasound Molecular Imaging and Artificial Intelligence Medicine, Henan Provincial People’s Hospital, Zhengzhou, China
Objectives: To explore the utility of machine learning-based ultrasound radiomics for predicting TP53 gene mutation in hepatocellular carcinoma (HCC).
Methods: 154 HCC patients with 182 lesions from 2019 to 2024 were reviewed retrospectively. All lesions were randomly split into the training set (n = 129) and the test set (n = 53), and ultrasound radiomics features were extracted and selected. Extreme gradient boosting tree (XGBoost), decision tree (DT), random forest (RF), support vector machine (SVM), and logistic regression (LR) were used to construct the ultrasound radiomics models, the clinical models, and the combined models. The predictive performance of various models was evaluated by the area under the curve (AUC), accuracy, calibration curve, and decision curve analysis (DCA).
Results: Among the 182 lesions, 102 were confirmed as mutant TP53 and 80 were confirmed as wild-type TP53. The ultrasound radiomics model obtained an AUC of 0.778 and an accuracy of 0.774 in the test set. The clinical model achieved an AUC of 0.761 and an accuracy of 0.710 in the test set. Notably, integrating clinical features with ultrasound radiomics further enhanced predictive performance. The XGBoost-based combined model exhibited the highest predictive performance among all models, achieving an AUC of 0.846 and an accuracy of 0.823 in the test set. The decision curve analysis and calibration curve revealed that the XGBoost-based combined model provided the highest clinical benefit and exhibited strong predictive consistency.
Conclusion: Machine learning-based ultrasound radiomics signatures accurately predict TP53 gene mutations in HCC. The XGBoost-based combined model, which combined ultrasound radiomics features with clinical features, showed the best performance and represented a promising noninvasive approach for screening TP53-mutated HCC.
1 Introduction
Hepatocellular carcinoma (HCC) ranks third among cancer-related causes of mortality worldwide, posing a significant public health challenge (1). Surgical resection and liver transplantation remain the primary treatment options for HCC. However, the postoperative recurrence rate reaches up to 70% within 5 years (2). Despite advancements in immunotherapy that have expanded treatment options for HCC, the prognosis remains poor, with a five-year survival rate of only 15% (3). The poor prognosis of HCC is largely attributable to the highly heterogeneous and aggressive biological behavior of the tumor (4). Numerous studies have identified various tumor-specific gene mutations in HCC, which play a crucial role in regulating its biological behavior (5–7). Characterizing the genetic profile of HCC offers valuable insights for developing personalized treatment strategies and assessing prognosis.
TP53 is a crucial tumor suppressor gene that regulates multiple signaling pathways and plays a key role in cellular processes, including apoptosis, cellular senescence, and DNA repair (8, 9). TP53 mutations are the most prevalent genetic alterations in HCC, occurring in 15–40% of advanced cases (10). Mutations in TP53 result in the loss of its regulatory function, thereby promoting tumorigenesis (11). Moreover, TP53 mutations cause excessive nuclear accumulation of the p53 protein, which serves as a specific indicator of malignancy (12). TP53 mutations are associated with HCC tumor staging, elevated AFP levels, poor prognosis, and vascular invasion (13–16). Mutant TP53 enhances the aggressiveness and metastatic potential of HCC by inducing epithelial-mesenchymal transition (EMT) (17). Recent studies have demonstrated that TP53 status influences the tumor immune microenvironment (TIME) (18–21). Specifically, wild-type TP53 fosters a tumor-suppressive microenvironment, whereas mutant TP53 contributes to an immunosuppressive microenvironment and promotes tumor immune evasion (22). Furthermore, TP53 has emerged as a promising target for antitumor therapies, demonstrating significant clinical potential in HCC-targeted treatments (23). Thus, identifying TP53 mutation status is crucial for guiding personalized treatment strategies and improving patient prognosis. Specifically, it enables clinicians to tailor therapeutic approaches, including surgical planning, adjuvant therapy selection, and follow-up monitoring, thereby optimizing clinical outcomes for HCC patients with different TP53 statuses.
In clinical practice, preoperative assessment of TP53 gene status primarily relies on immunohistochemistry (IHC) of biopsy tissue (24). However, spatial sampling errors during biopsy procedures may limit the accuracy of detection results, failing to fully capture tumor heterogeneity (25). Moreover, invasive procedures pose risks of bleeding, infection, and potential tumor dissemination (26). Therefore, there is an urgent need for a non-invasive approach capable of accurately predicting TP53 gene status in HCC prior to surgery.
As an emerging technology, radiomics enables the high-throughput extraction of quantitative features from medical images, which provides more information on tumor phenotypes in a noninvasive manner from a multi-dimensional and multi-space perspective (27, 28). Radiomics overcomes the limitations of traditional molecular detection techniques and enables the comprehensive evaluation of the biological characteristics of tumors in a non-invasive manner (29). Previous studies have demonstrated the favorable performance of radiomics models based on computed tomography (CT) and magnetic resonance imaging (MRI) images in predicting the TP53 gene status in rectal cancer and endometrial cancer (30, 31). However, limited radiomics studies have focused on predicting TP53 gene status in HCC. To date, only one study has highlighted the potential of CT-derived texture features in predicting TP53-mutated HCC (32). Ultrasound is a radiation-free real-time imaging technology with convenient operation and low economic cost, making it highly valuable for early screening and prognostic monitoring of HCC (33, 34). The integration of ultrasound and radiomics has shown significant potential in the diagnosis and treatment monitoring of HCC. It has been widely applied in pathological grading, therapeutic efficacy assessment, and biomarker prediction in HCC (35–37). However, the ultrasound radiomics features of TP53-mutated HCC have not been investigated.
The study aims to investigate the potential of ultrasound radiomics models to predict TP53 mutation status, in the hope of offering a novel method to promote the precision diagnosis and treatment of HCC.
2 Methods
2.1 Case inclusion
The ethics committee of our hospital granted approval for this retrospective study [Ethical number: (2021) Ethics Application No. (01)], and informed consent was waived.
In this study, we consecutively evaluated patients who were postoperative histopathologically confirmed as HCC from January 2019 to January 2024 in our hospital. The inclusion criteria were as follows: (1) patients with pathologically confirmed HCC; (2) IHC results include p53; (3) liver ultrasound within 1 month before surgery; (4) no history of previous antitumor treatment; and (5) no history of other malignancies. The inclusion and exclusion process of the study is illustrated in Figure 1. Finally, 182 lesions from 154 patients were enrolled in this study. All lesions were partitioned into a training set (n = 129) and a test set (n = 53) by stratified sampling at a ratio of 7:3. The training set was used to train the model, and the test set was used to verify the model performance.
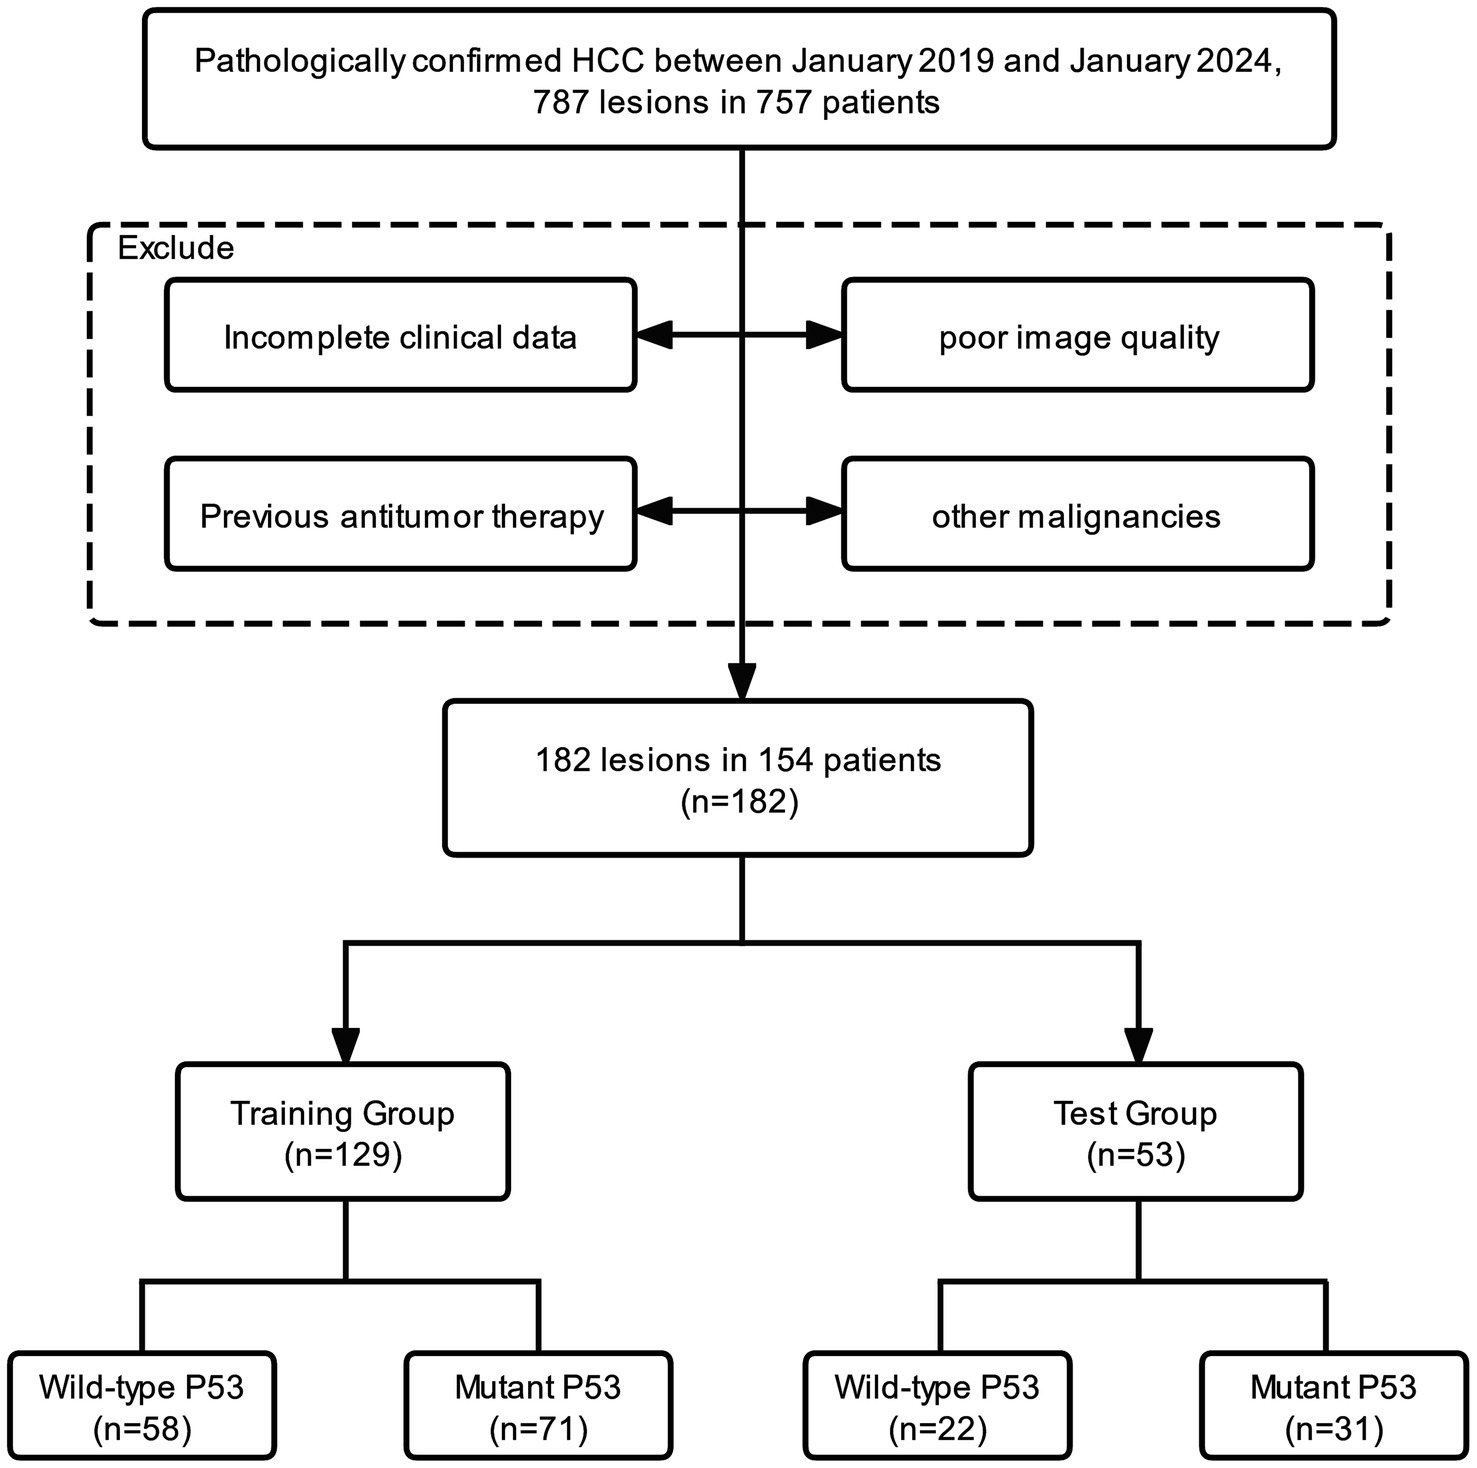
Figure 1. Flowchart of study inclusion and exclusion.
2.2 Clinical data and IHC
Clinical data of patients were collected from the electronic health record management system, including demographic characteristics such as age, sex, and preoperative laboratory parameters such as hepatitis B surface antigen (HBsAg), alpha-fetoprotein (AFP), aspartate aminotransferase (AST), alanine aminotransferase (ALT), total bilirubin (TBIL), albumin level (ALB), and prothrombin time (PT), as well as conventional ultrasound features such as lesion echo signal, lesion diameter, and doppler flow signal.
TP53 gene status was evaluated based on p53 IHC expression patterns. Two pathologists independently assessed p53 expression following a previously described method (16). Both pathologists were blinded to the patient’s clinical and imaging data. p53 expression was evaluated according to the proportion of tumor cells with positive nuclear staining. Positive expression was defined as 10% or more of tumor cells with positive nuclear staining. Abnormal complete deletion was defined as the complete absence of tumor cell staining, with positive staining in internal controls (normal stromal cells). Negative expression was defined as less than 10% of tumor cells with positive nuclear staining. Positive expression or abnormal complete deletion were identified as mutant TP53, while negative expression was identified as wild-type TP53 (24).
The preparation of p53 immunohistochemical sections and the detection methods for experimental indicators are detailed in Supplementary material 1.
2.3 Image acquisition
The ultrasound examination was performed following a standardized protocol. The ultrasound examination was conducted using Philips EPIQ 7, GE Vivid E9, or HIVISION Ascendus (C715; frequency range: 1–5 MHz). All patients fasted for 8 h and underwent liver ultrasound in the supine position. The maximum diameter, echo signal, and Doppler flow signal of lesions were assessed by two radiologists with 5 years of liver ultrasound experience. Both radiologists were blinded to the clinical and pathological information of the patients. The image indicating the maximum diameter of the lesion was saved in digital imaging and communications in medicine (DICOM) format for subsequent image segmentation. In total, 182 ultrasound images from 182 lesions were included for further analysis.
2.4 Image segmentation
The region of interest (ROI) of the HCC lesions was manually segmented using ITK-SNAP software (version 3.8.0) (38). The ROIs of all lesions were manually delineated by a radiologist along the tumor margin. To assess the reproducibility of the features, 30 HCC lesions were randomly selected and their ROIs were independently delineated by another radiologist. Both radiologists were blinded to the clinical and pathological information of the patients. The intraclass correlation coefficient (ICC) was calculated to assess the reproducibility of the features. An ICC value closer to 1 indicates higher reliability. Only features with an ICC value of ≥ 0.80 were included in the subsequent feature selection. Figure 2 illustrates the representative segmentation results of the HCC lesions.
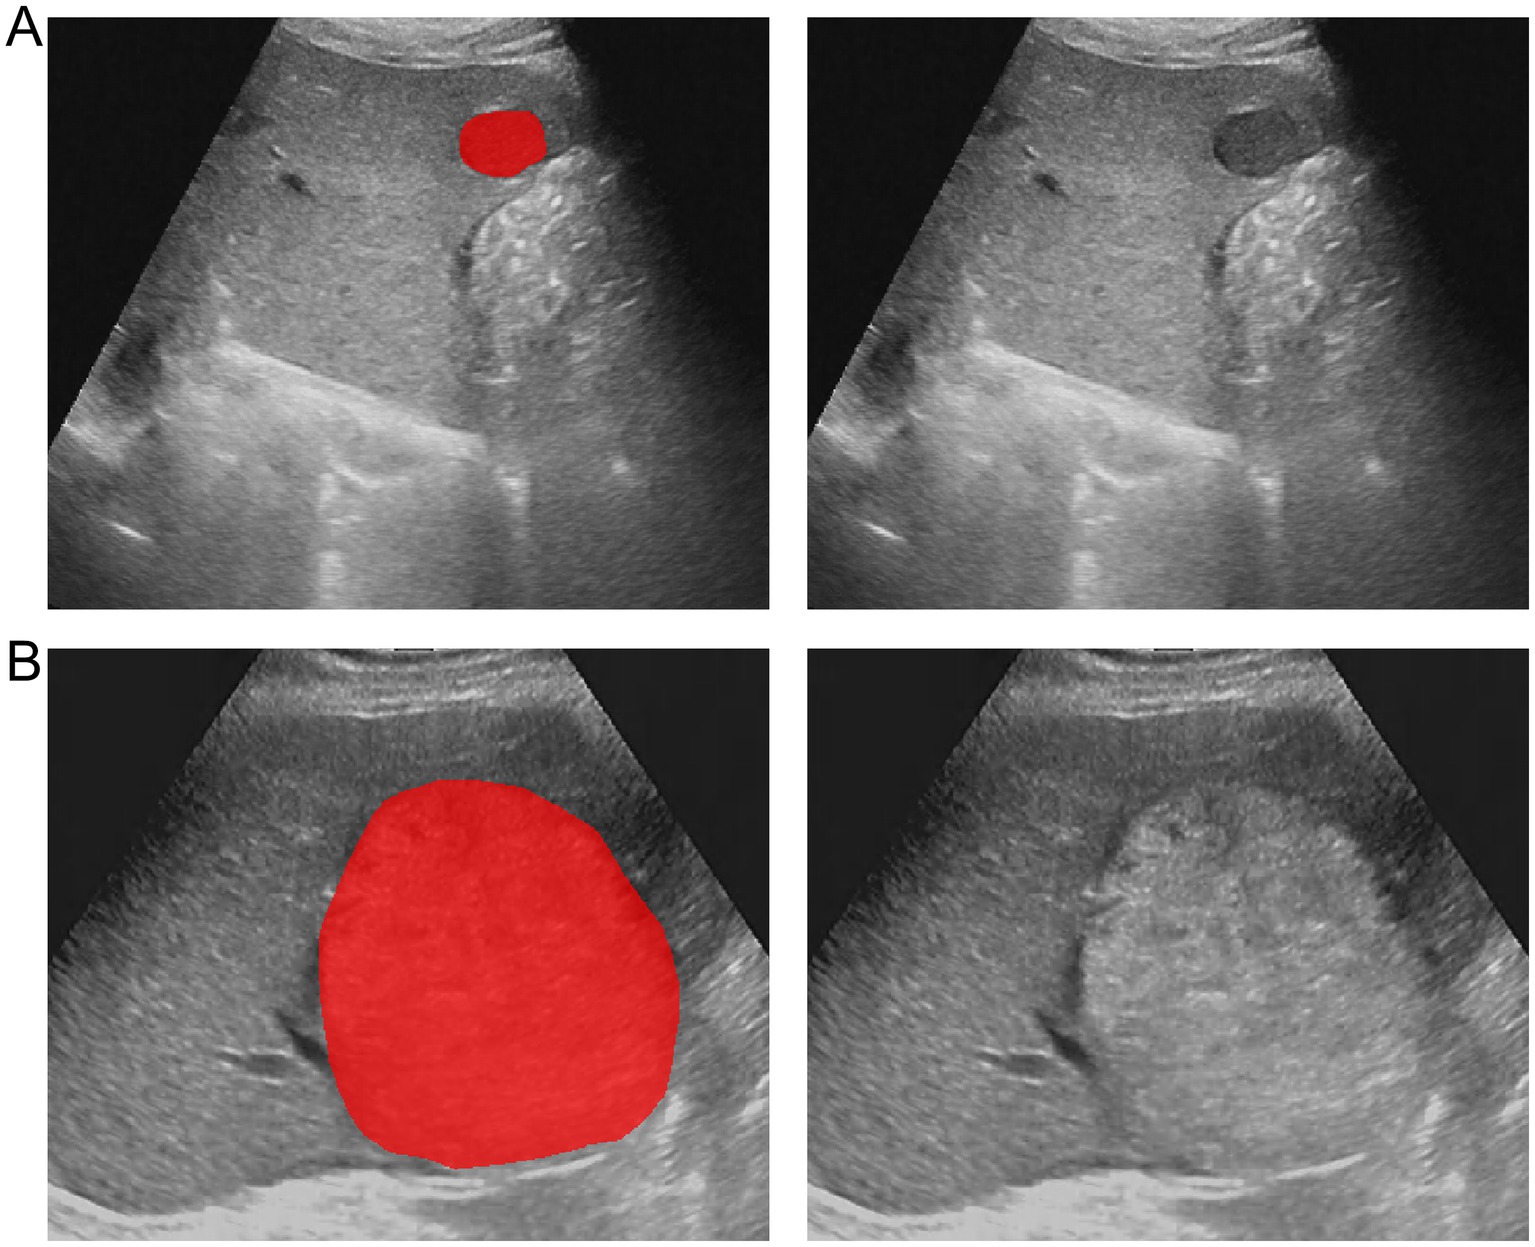
Figure 2. Example of delineating region of interest (ROI) on grayscale ultrasound images. (A) The lesion segmentation image and original image of a patient with wild-type TP53. (B) The lesion segmentation image and original image of a patient with mutant TP53.
2.5 Image preprocessing
Before extracting features, the images were preprocessed to ensure isotropy. First, the ultrasound images were normalized using the mean and standard deviation to mitigate the effects of variations in scanners and parameters. Subsequently, the images were resampled using the B-spline interpolation algorithm, standardizing the pixel size of all images to 1 mm × 1 mm. This step ensured uniform spatial resolution across all images. Finally, the images were subjected to gray-level discretization to constrain the gray-level value of each pixel in the interval of [0, 255] (39).
2.6 Feature extraction and selection
The original images were processed with 14 types of filters for noise reduction, and derived images were obtained. Ultrasound radiomics features were subsequently extracted from both the original and derived images utilizing the Pyradiomics package (version 2.1.2) in Python. The features were categorized into the following 7 classes: (1) first-order features, (2) shape features, (3) gray-level dependence matrix (GLDM), (4) gray-level co-occurrence matrix (GLCM), (5) gray-level run length matrix (GLRLM), (6) gray-level size-zone matrix (GLSZM), and (7) neighboring gray-tone-difference matrix (NGTDM). Except for the shape features, all other ultrasound radiomics features were computed from the original and derived images. To ensure uniform data distribution, the feature data were subjected to Z-score normalization.
Since the extracted features were high-dimensional, this may result in computational inefficiency and overfitting. Therefore, feature selection was required to screen the features most relevant to the model performance. First, the features with an ICC value of less than 0.8 were removed. Second, the variance threshold method was employed to exclude features with zero variance. Then, the maximal information coefficient (MIC) was calculated to evaluate the correlation between features and the target variables, and features with an MIC value of zero were eliminated. Finally, 24 features with the highest information were screened using the embedded method in combination with extreme gradient boosting (XGBoost).
2.7 Model establishment and evaluation
To address the imbalance in the dataset, we employed synthetic oversampling techniques (SMOTE) (40). The Python scikit-learn package (version 0.23.2) was utilized to build the model. Since each algorithm has distinct core principles and areas of applicability, their performance varies across different types of data. Five supervised learning classifiers were employed to build the ultrasound radiomics models, clinical models, and combined models to identify the optimal model, namely extreme gradient boosting (XGBoost), decision tree (DT), random forest (RF), support vector machine (SVM), and logistic regression (LR). Hyperparameter tuning is crucial for optimizing the performance of machine learning models. We applied random search and grid search methods to select the optimal hyperparameters for the machine learning models (Supplementary material 2).
First, the ultrasound radiomics models were developed using the 24 screened radiomics features. Then, clinical models were constructed using the clinical features of patients, such as sex, age, HBsAg, Child-Pugh class, AFP, AST, ALT, ALB, GGT, PT, liver cirrhosis, splenomegaly, tumor diameter. Finally, the combined models were developed by incorporating clinical characteristics and radiomics features.
The predictive performance of each model was analyzed using the area under the curve (AUC) and accuracy. Decision curve analysis (DCA) was used to calculate the clinical net benefits of the optimal ultrasound radiomics model, the optimal clinical model, and the optimal combined model, thereby evaluating the clinical value of all three models. The calibration curve was employed to assess the calibration degree of the optimal model.
The study procedure is illustrated in Figure 3.
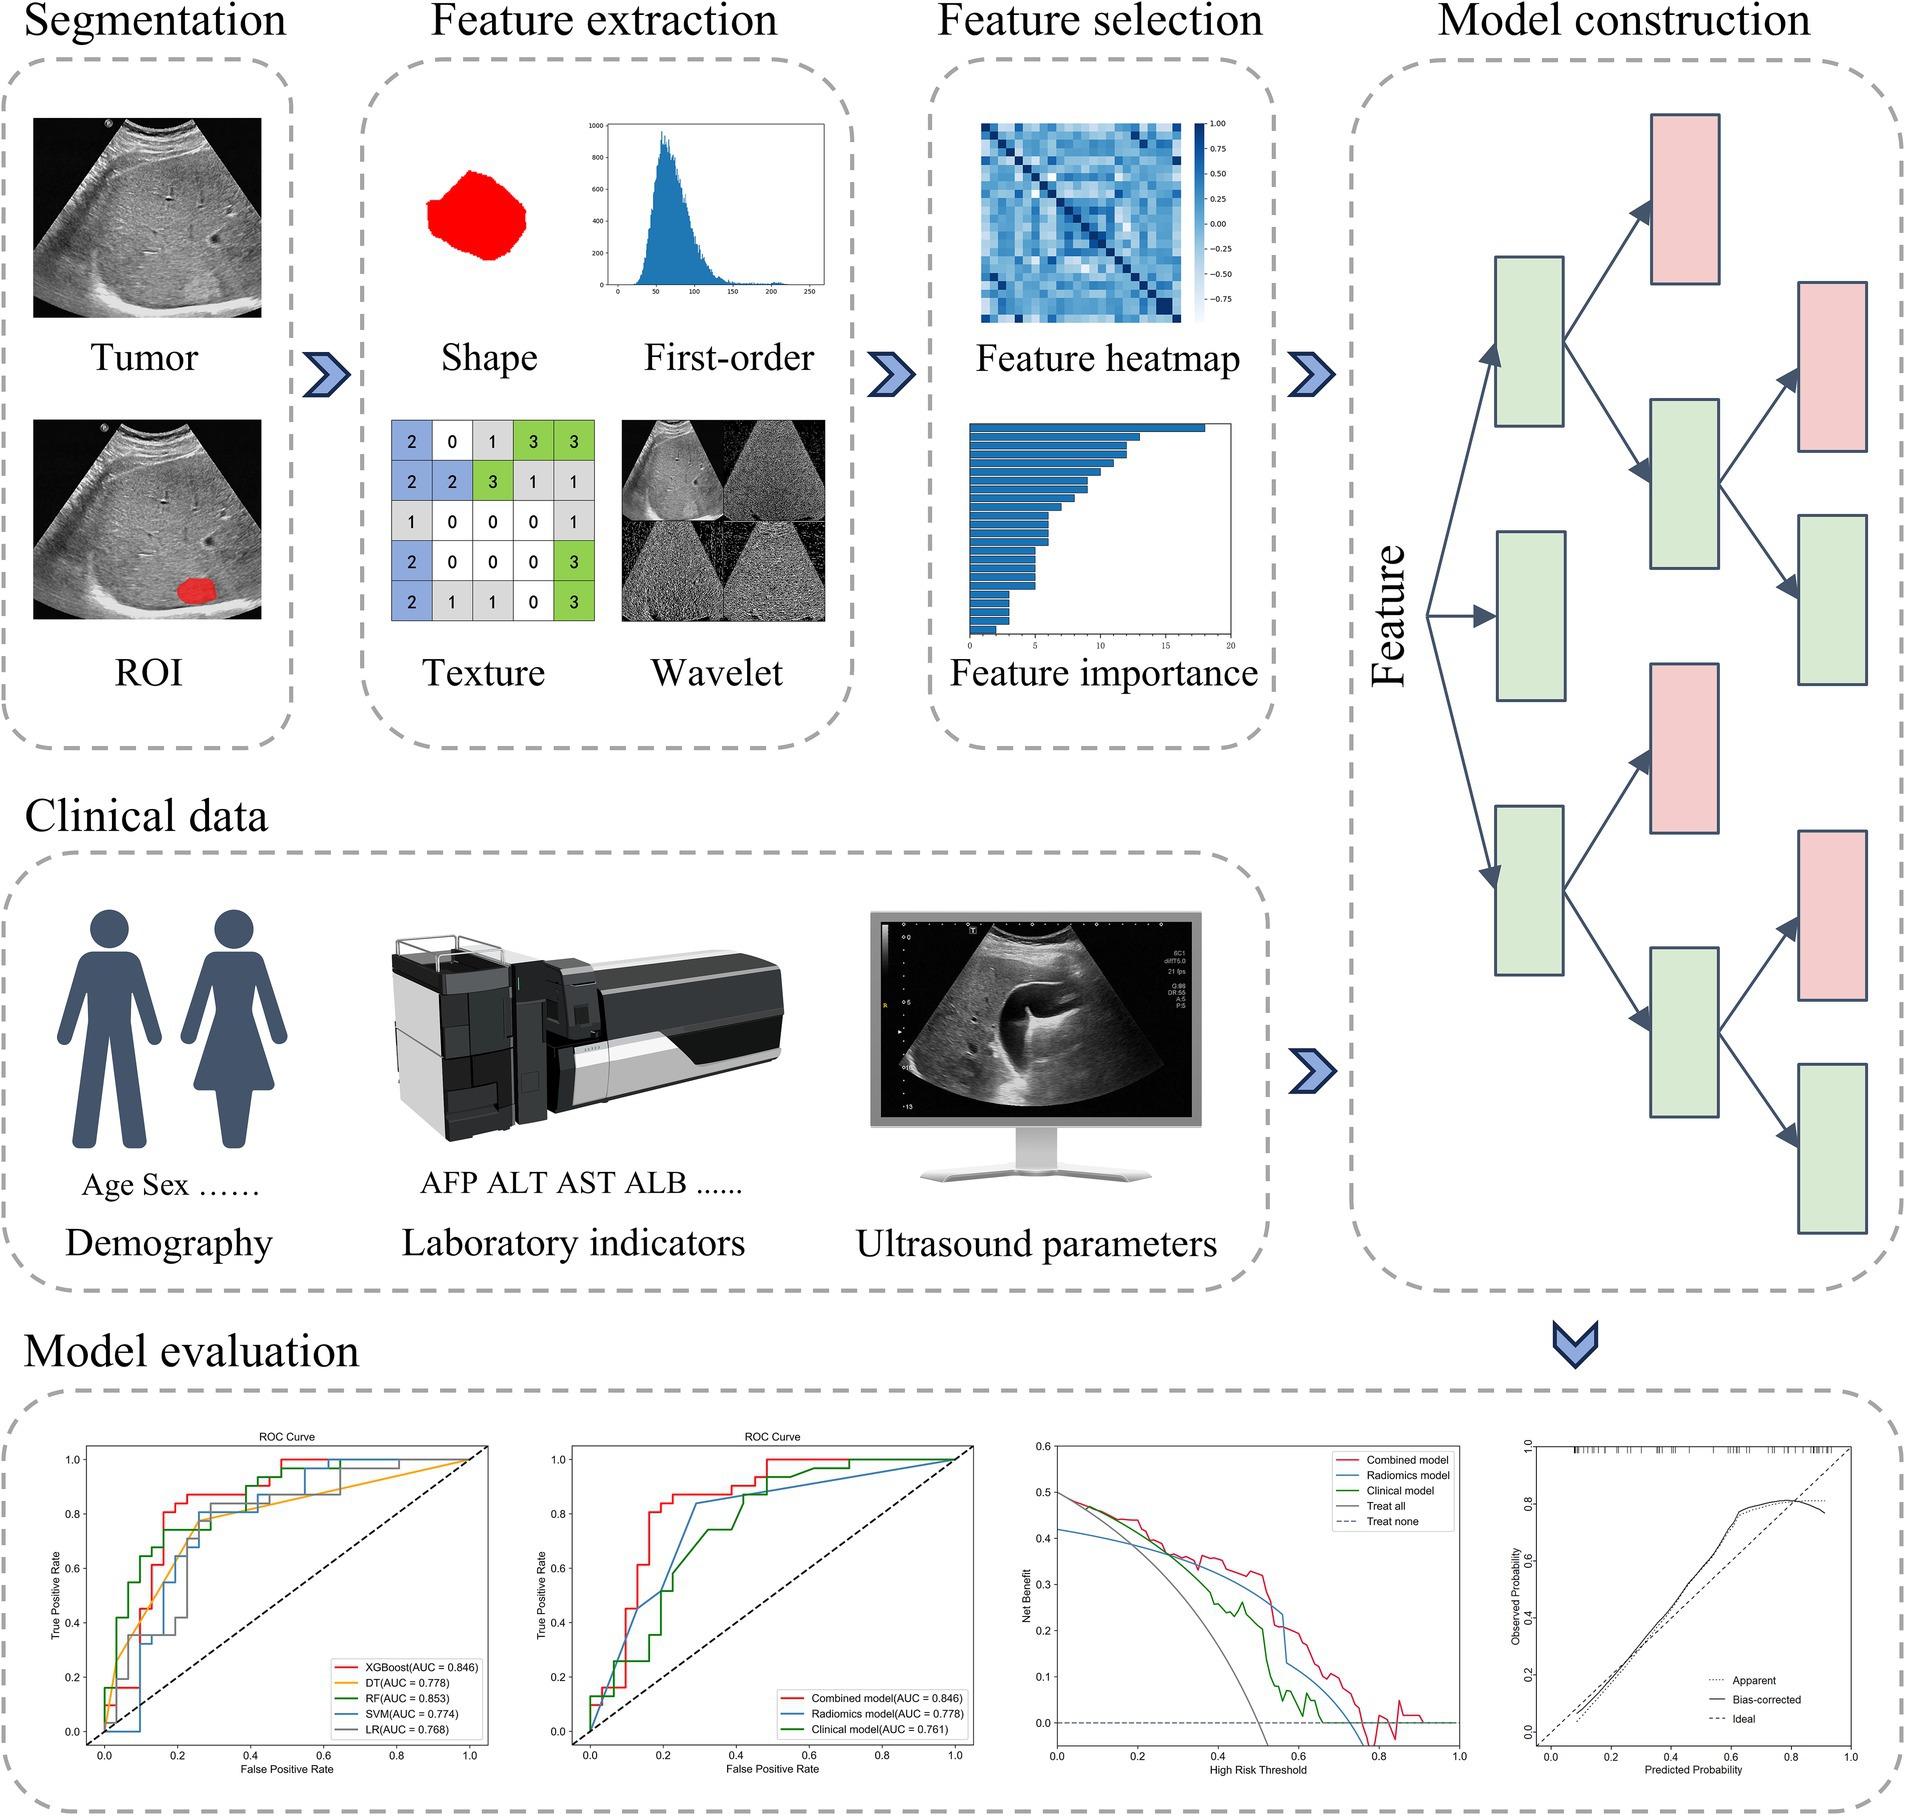
Figure 3. The radiomics workflow. ROI, region of interest; AFP, alpha-fetoprotein; ALT, alanine aminotransferase; AST, aspartate aminotransferase; ALB, albumin; AUC, the area under the curve.
2.8 Statistical analysis
SPSS 26.0 and R 4.4.1 were employed for statistical analysis. Continuous variables were analyzed using the t-test or Mann–Whitney U test. Categorical variables were analyzed using the Chi-square test. Statistical significance was defined as p < 0.05.
3 Results
3.1 Clinical characteristics of lesions
In this study, a total of 182 lesions were finally included, with 102 classified as mutant TP53 and 80 as wild-type TP53. The training set and test set, respectively, comprised 129 and 53 lesions. The clinical characteristics of wild-type TP53 and mutant TP53 in the training and test sets are presented in Table 1. In the training set, AST existed a significant difference in the two groups (p < 0.05). In the test set, significant differences were observed in AFP levels and tumor diameter between the two groups (p < 0.05). In addition, we conducted a comparison of the clinical features between the training set and the test set. Except for portal hypertension and TBIL, there were no notable differences in other clinical and conventional ultrasound features between the training and test sets (Supplementary Table 1).
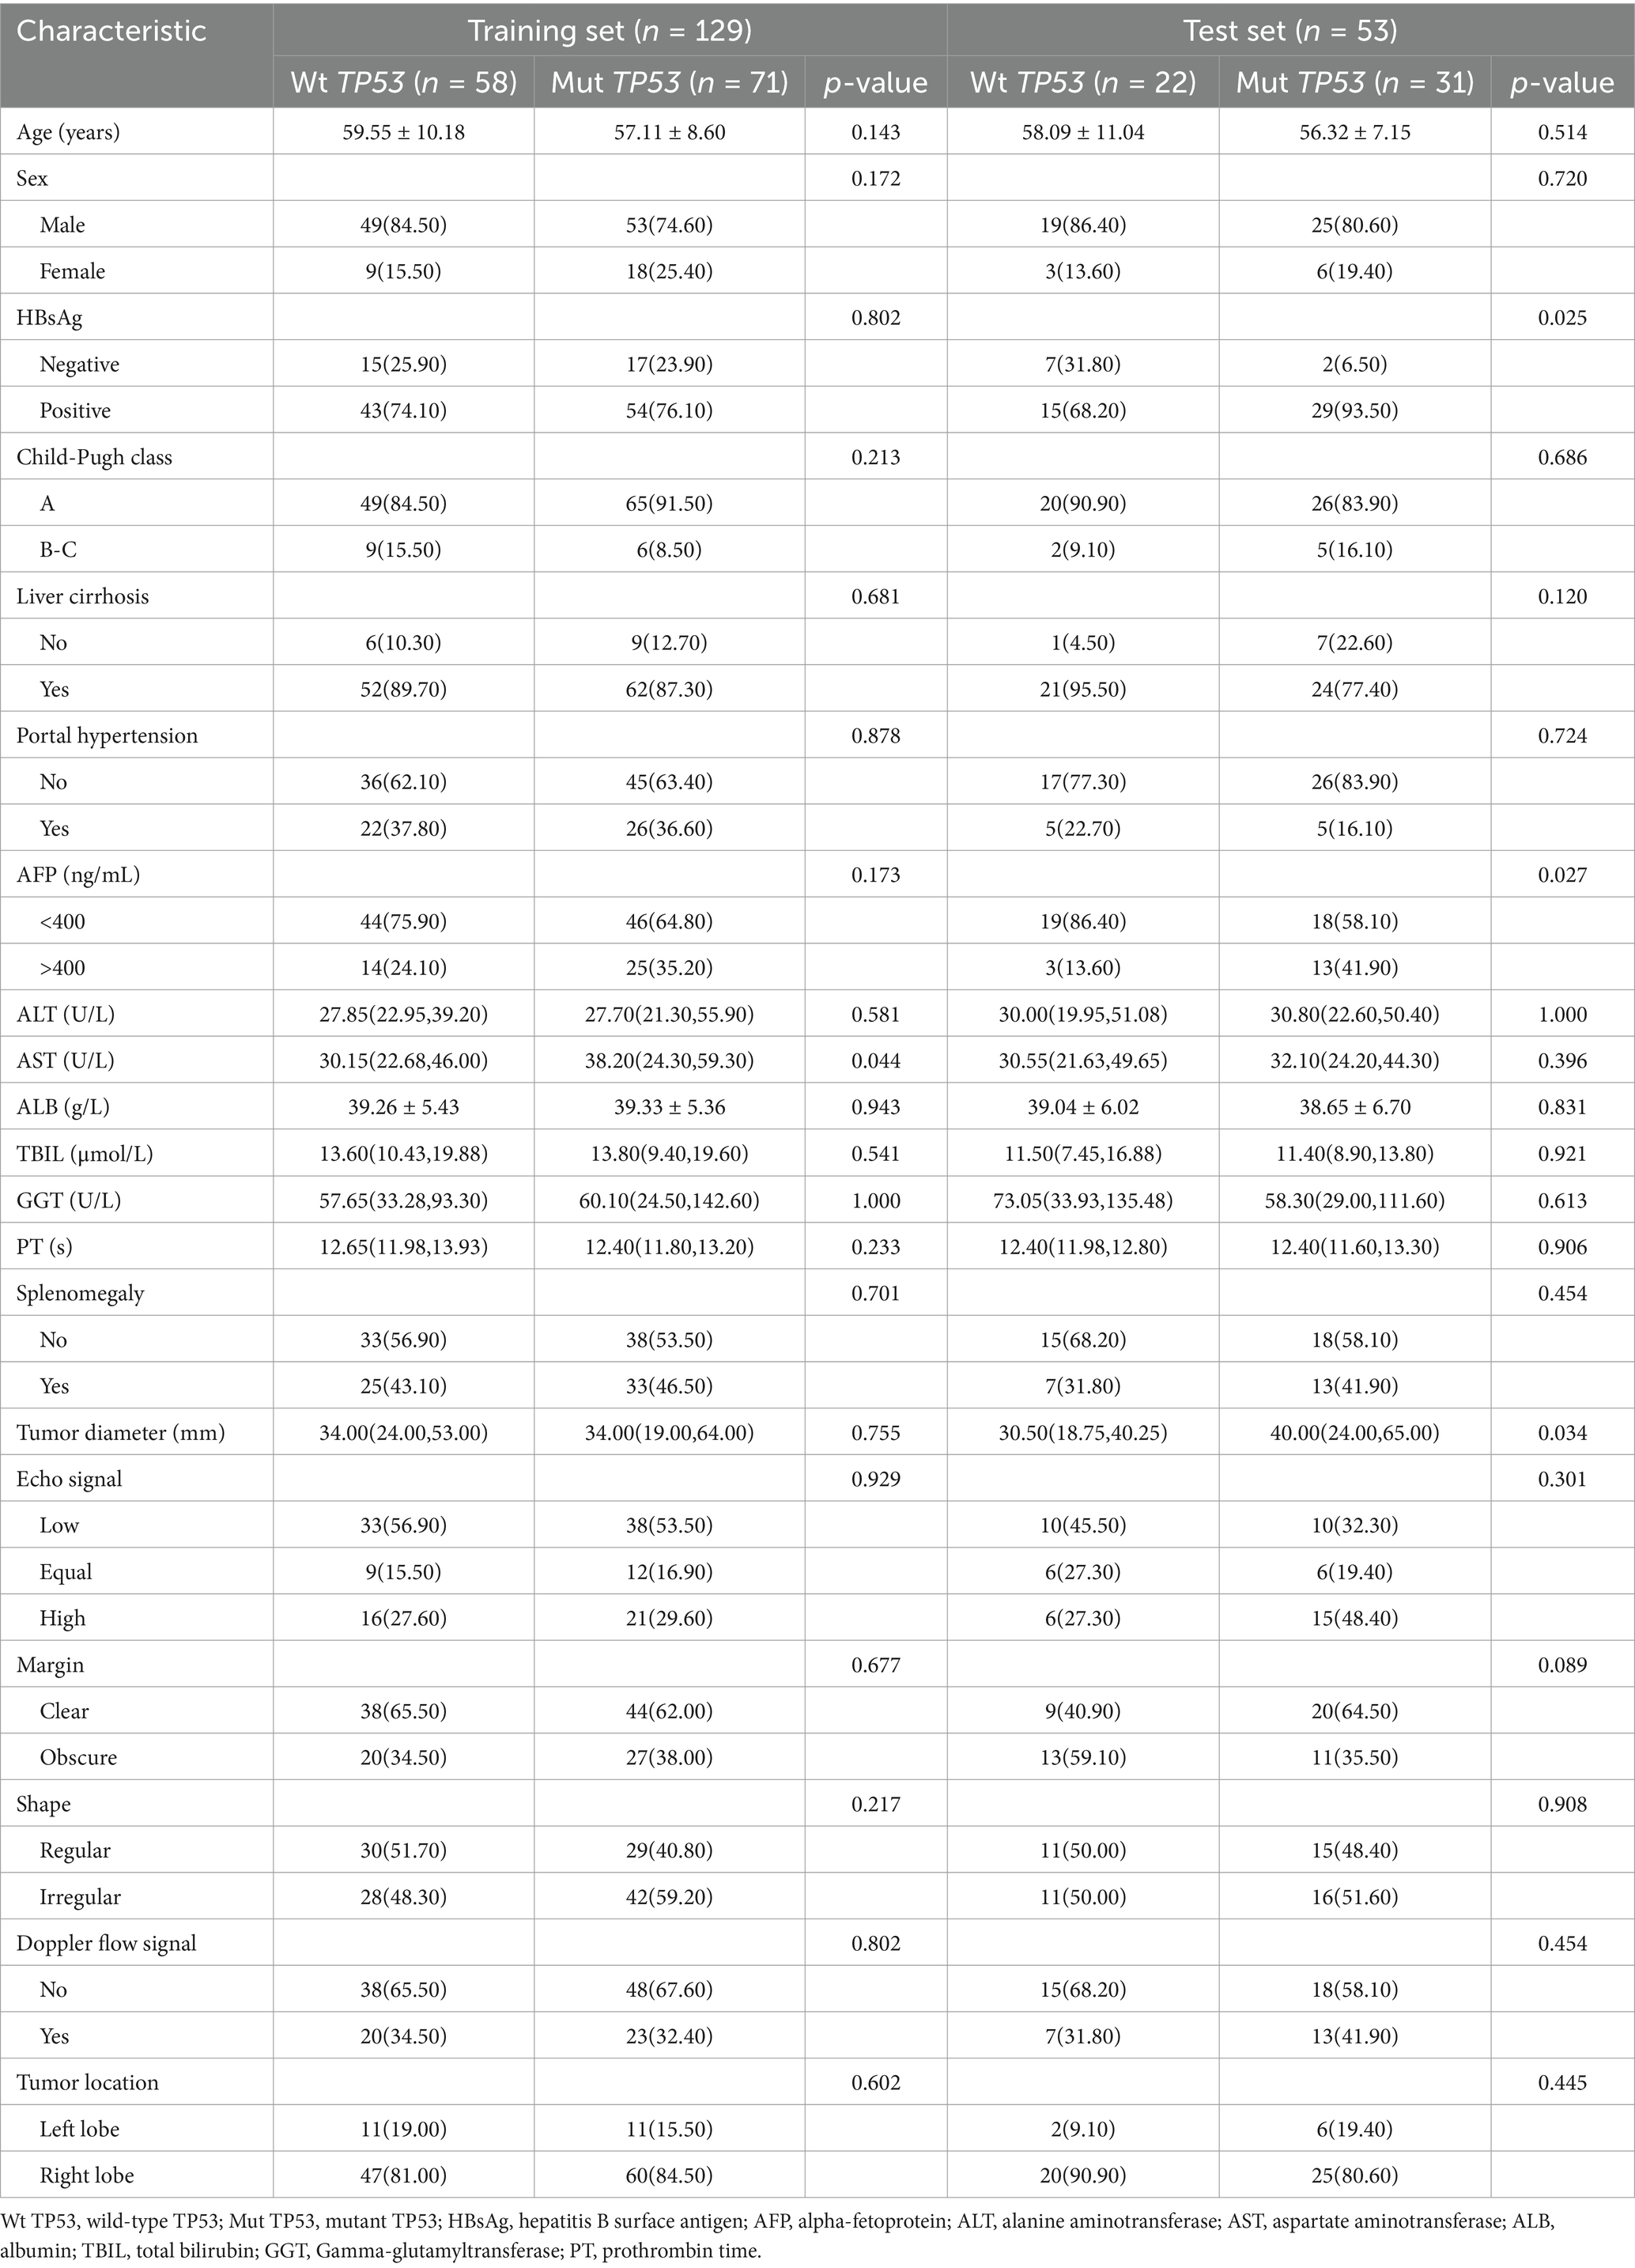
Table 1. Clinical characteristics of TP53 status in the training set and the test set.
3.2 Feature extraction and selection
We extracted a total of 1,409 ultrasound radiomics features from the images. Of the extracted features, 256 features were eliminated due to ICC < 0.8. Next, 20 features exhibiting zero variance and 612 features with MIC value of zero were removed by applying the variance threshold and mutual information method. After further dimensionality reduction using the embedded method and XGBoost, the 24 most relevant radiomics features were finally selected (Figure 4). The detailed characteristics are provided in Supplementary Table 2.
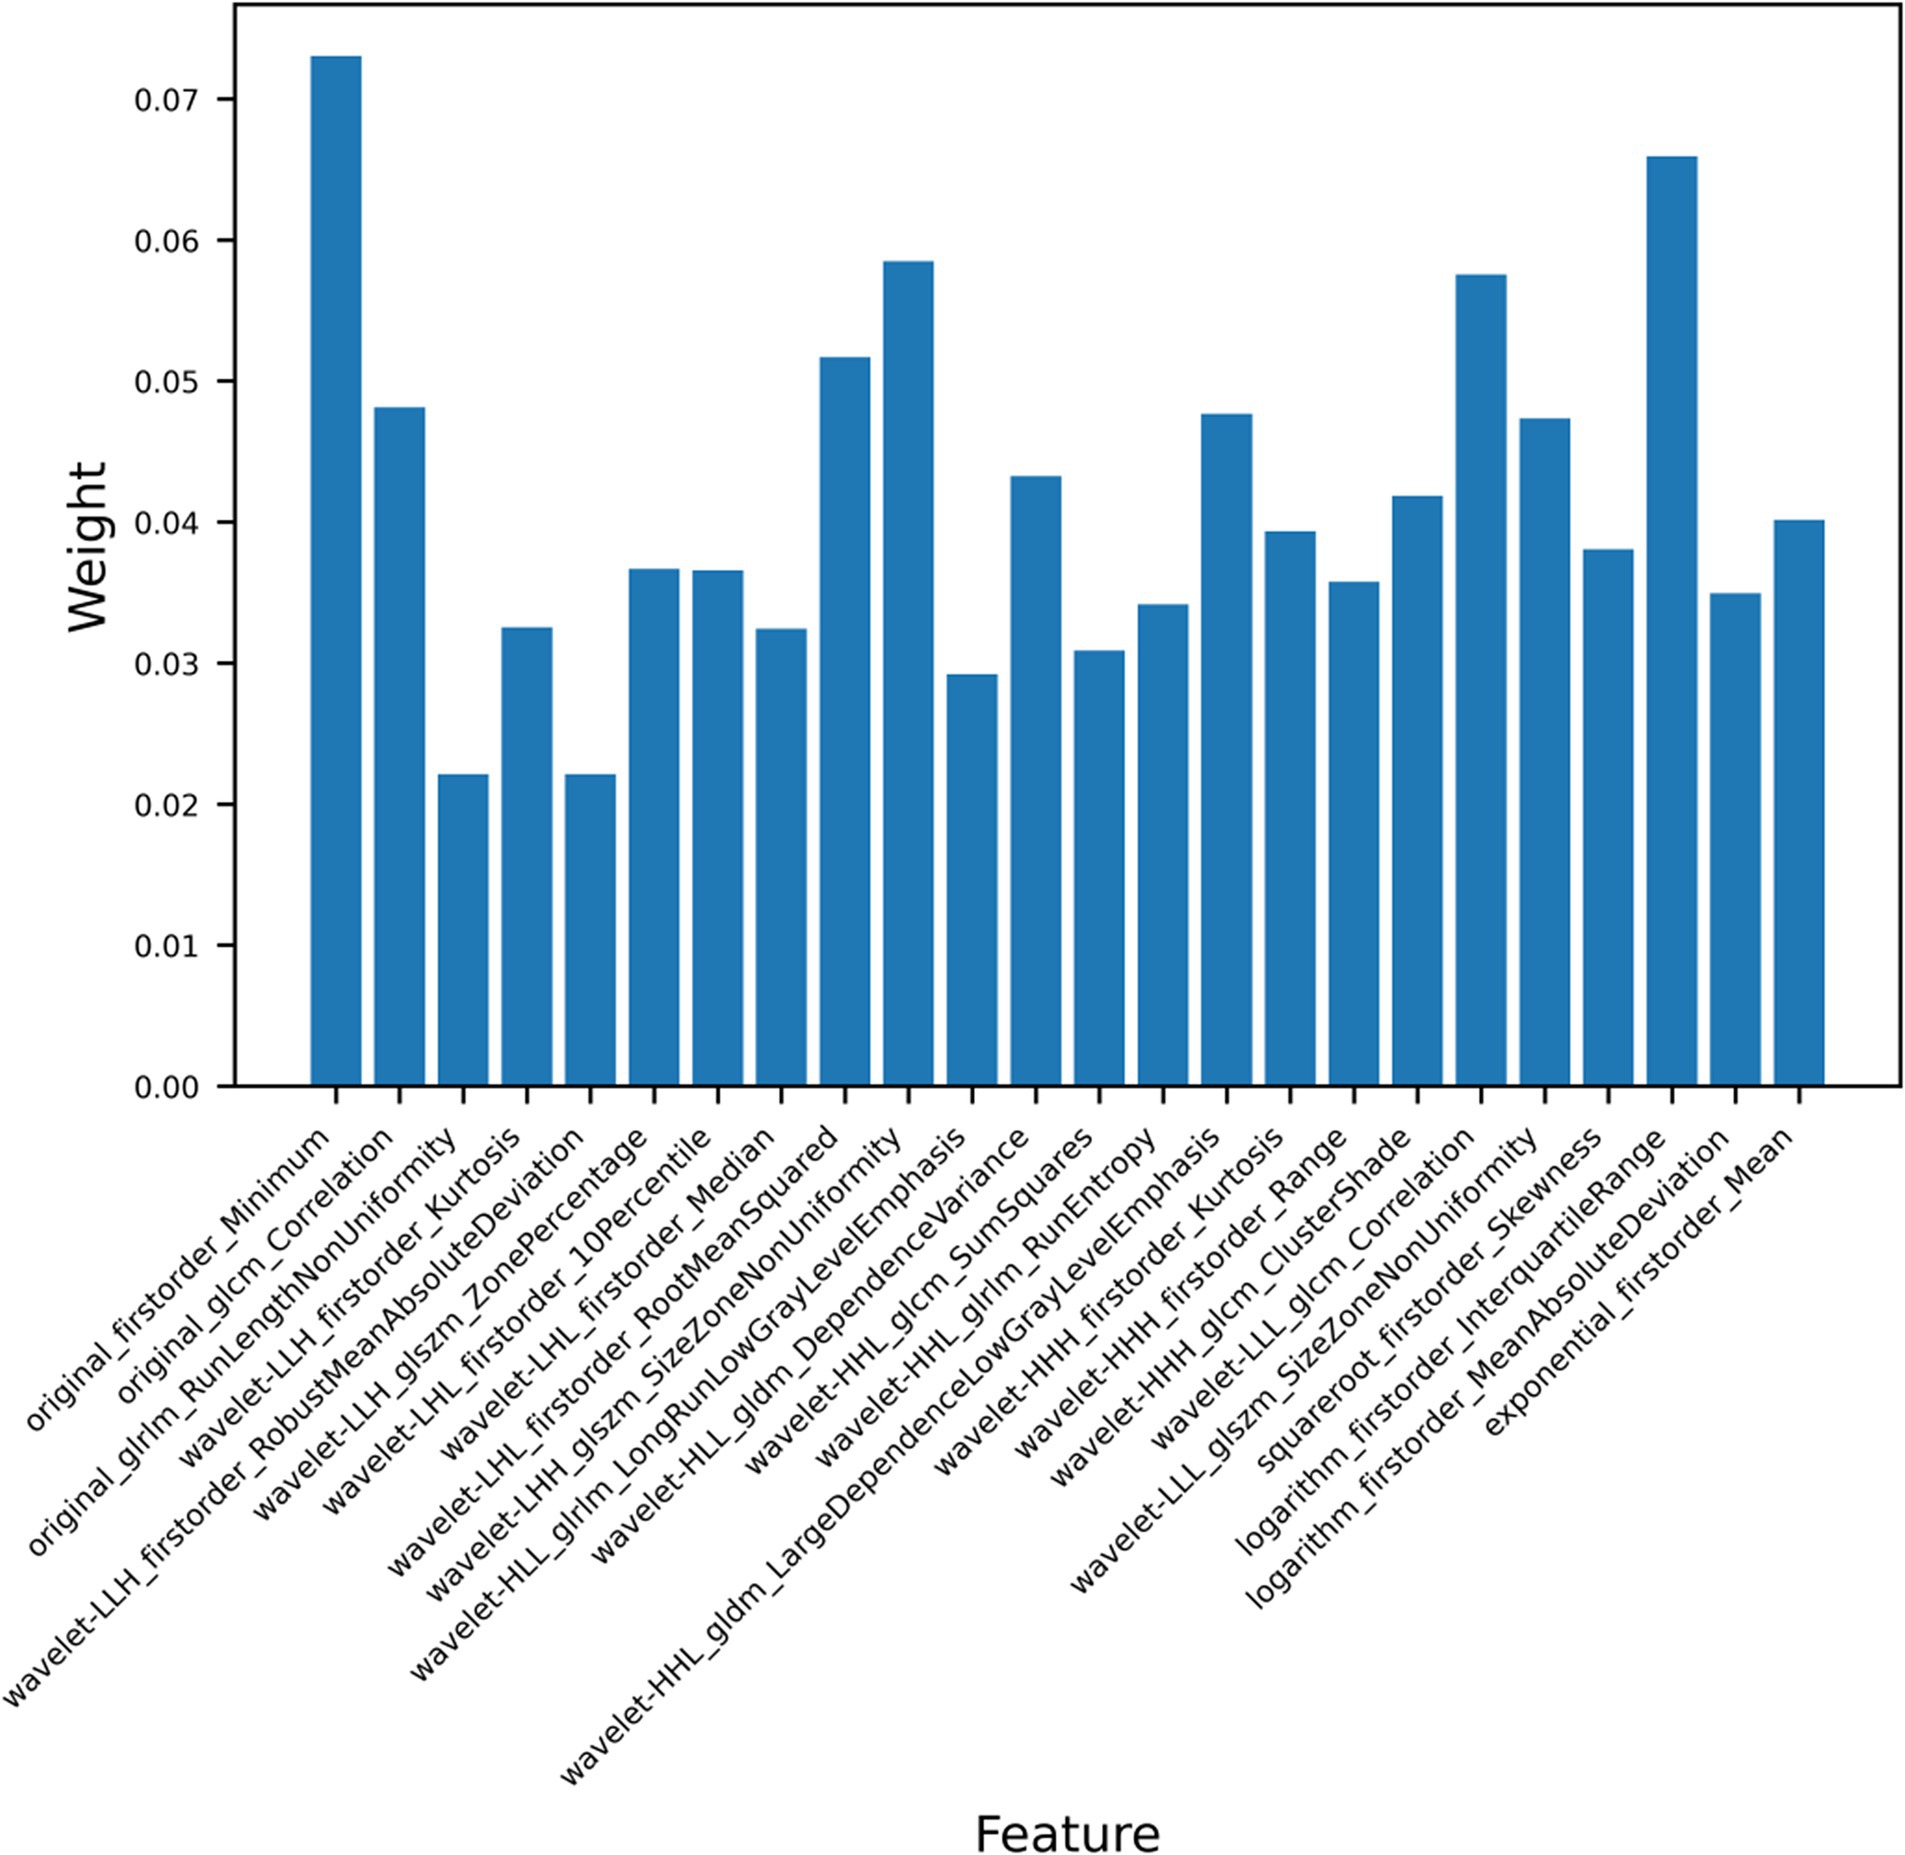
Figure 4. Weight histogram of 24 the radiomics features.
3.3 Performance of ultrasound radiomics models and clinical models
We used five machine learning algorithms (XGBoost, DT, RF, SVM, and LR) to build ultrasound radiomics models and clinical models, and analyze and compare their predictive performance. Table 2 provides the detailed predictive performance of the ultrasound radiomics models and the clinical models. The ROC curves of the models are illustrated in Figures 5A,B,D,E.
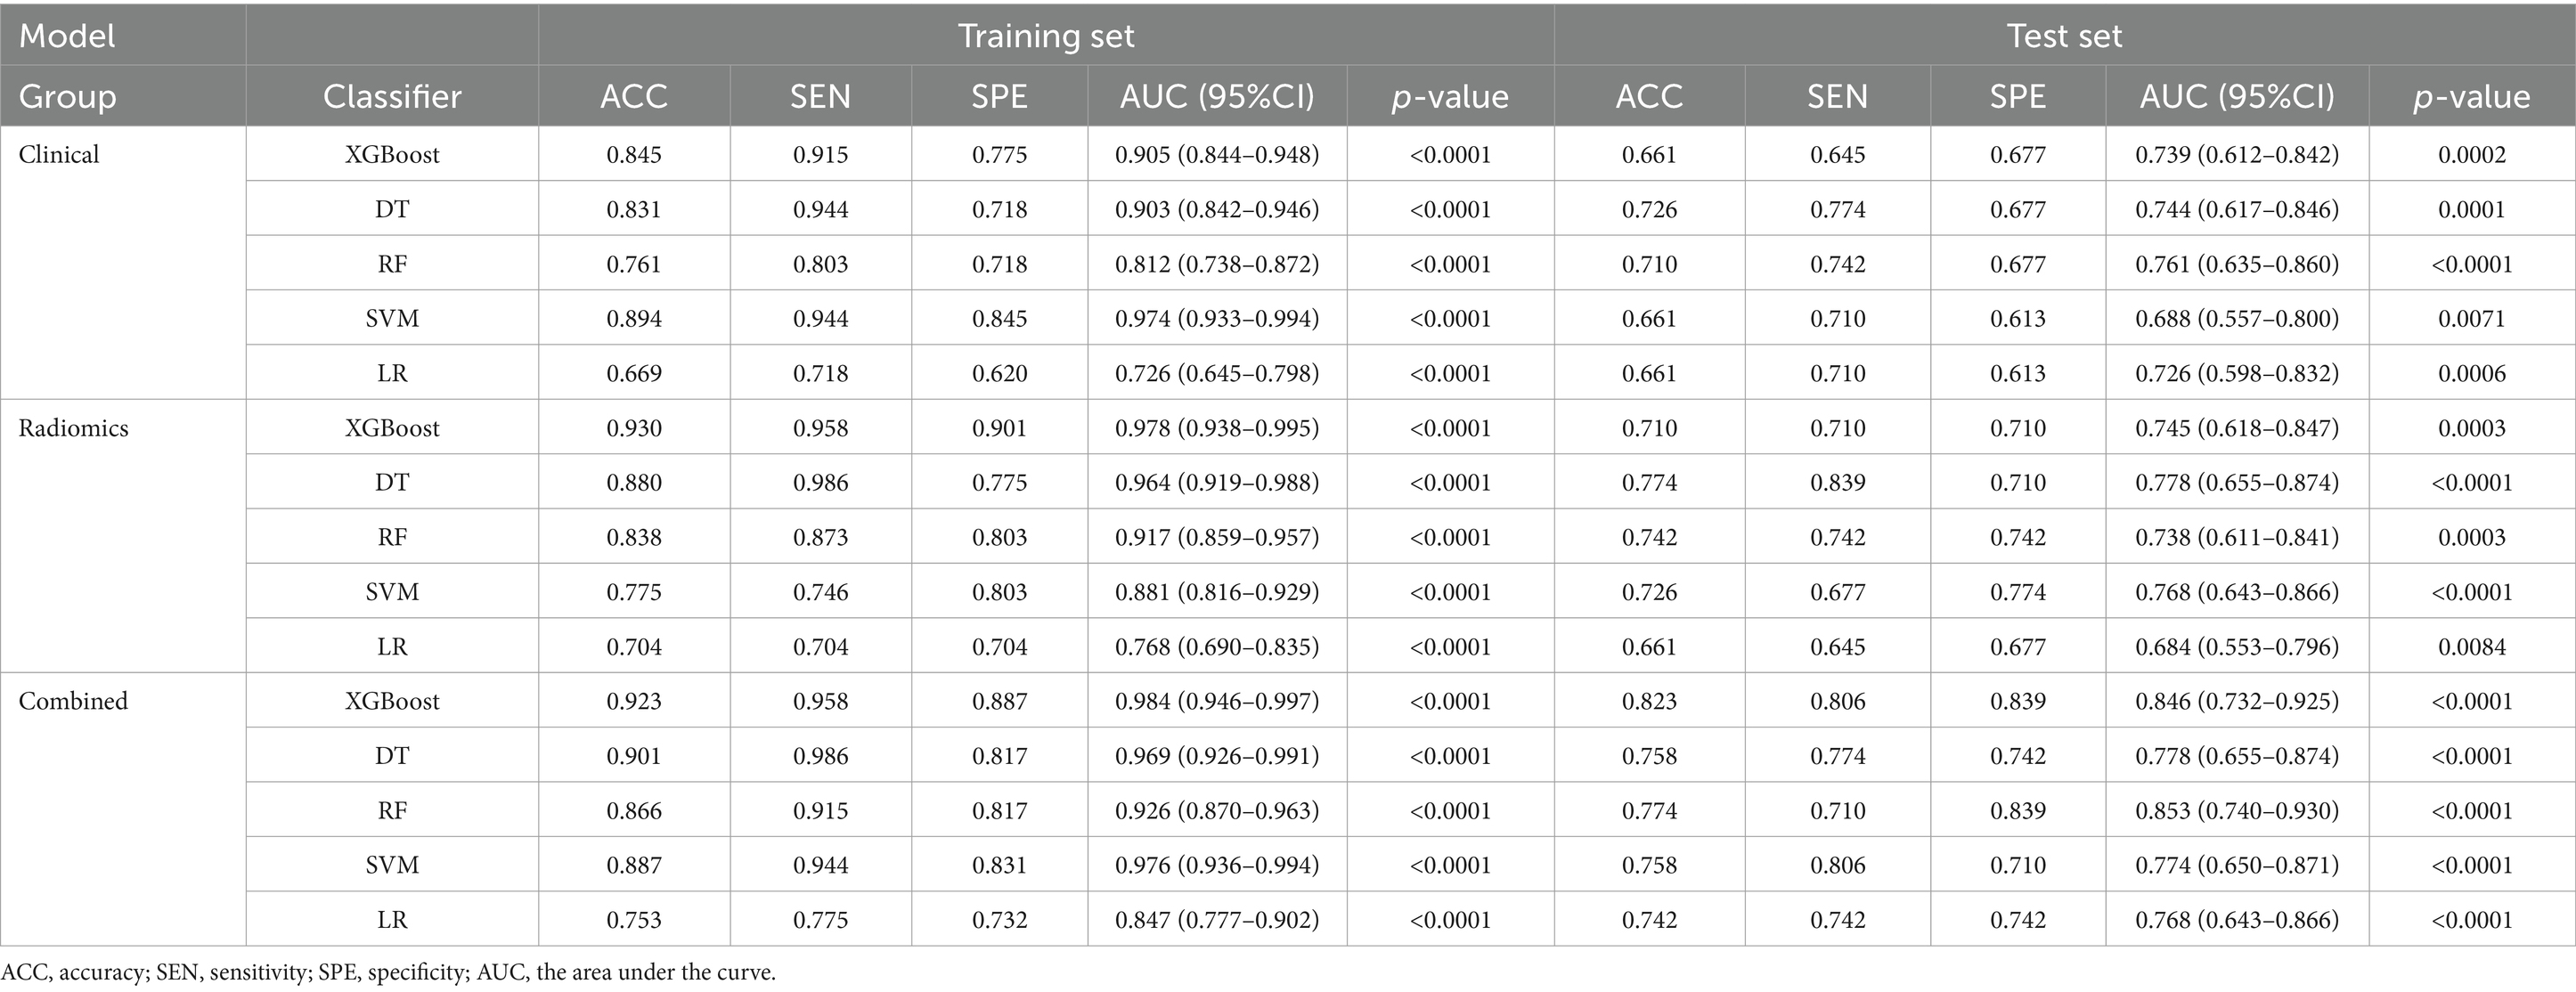
Table 2. The performance of the models in the training set and the test set.
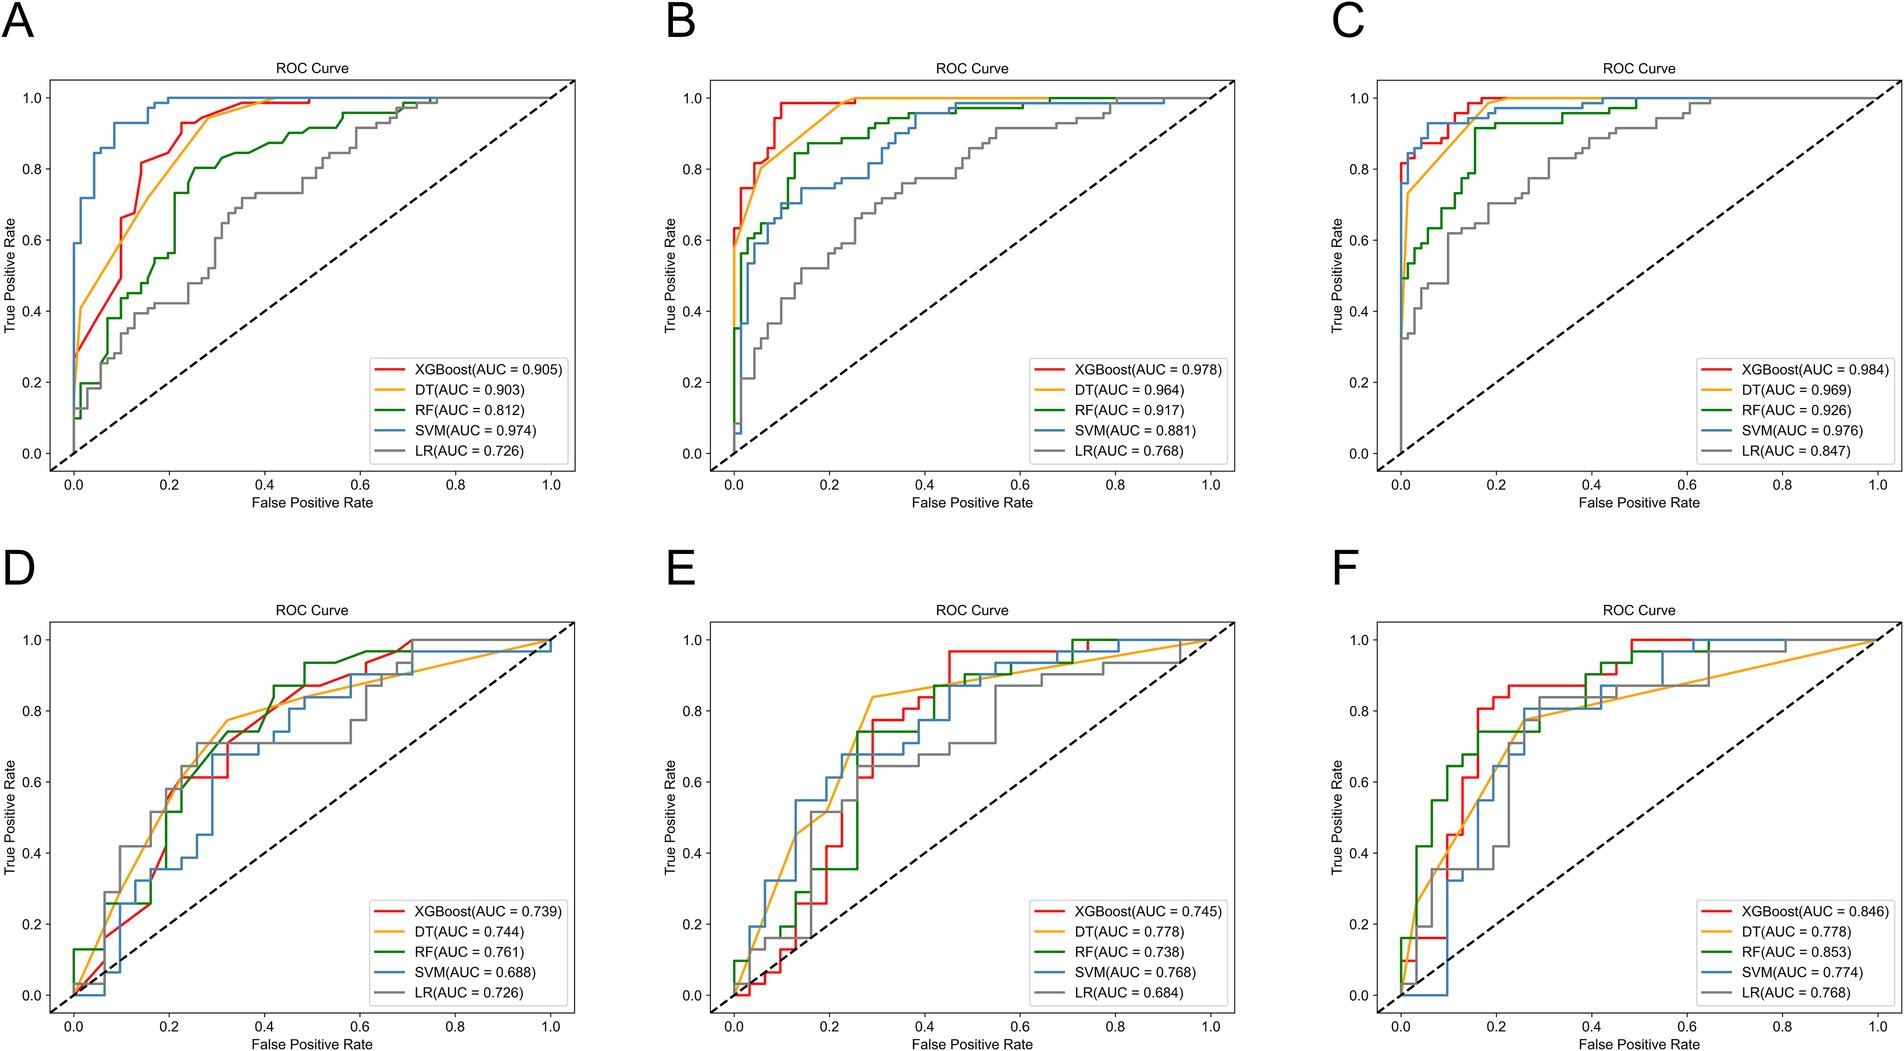
Figure 5. The ROC curves of machine learning models in the training set of (A) the clinical models, (B) the radiomics models, and (C) the combined models, and the test set of (D) the clinical models, (E) the radiomics models, and (F) the combined models.
Among the five ultrasound radiomics models, the DT classifier exhibited the best predictive performance, with an AUC value of 0.778 and an accuracy of 0.774 in the test set. The AUC values of the ultrasound radiomics models based on XGBoost, SVM, RF, and LR were 0.745, 0.768, 0.738, and 0.684, respectively, with corresponding accuracies of 0.710, 0.726, 0.742, and 0.661.
Among the five clinical models, the RF classifier performed best, with an AUC value of 0.761 and an accuracy of 0.710 in the test set. The AUC values of XGBoost, SVM, DT, and LR-based clinical models were 0.739, 0.688, 0.744, and 0.726, respectively, with corresponding accuracies of 0.661, 0.661, 0.726, and 0.661.
3.4 Predictive performance of combined models
The predictive performance of the combined models is shown in Table 2 and Figures 5C,F. The AUC values of XGBoost, SVM, RF, DT, and LR-based combined models in the test set were 0.846, 0.774, 0.853, 0.778, and 0.768, respectively. The XGBoost and RF models exhibited higher AUC values. However, the accuracy and sensitivity of the XGBoost model were 0.823 and 0.806, which were significantly superior to those of the RF model (0.774 and 0.710). Therefore, the XGBoost-based combined model performed best.
3.5 Comparison of performance of different models
We compared and analyzed the performance of the optimal ultrasound radiomics model, the optimal clinical model, and the optimal combined model. As shown in Figure 6A, the combined model demonstrated optimal predictive performance among the three models, with a higher AUC value in the test set (0.846). DCA demonstrated that the combined model provided superior clinical net benefit, indicating its higher utility in clinical practice (Figure 6B). The calibration curve showed that the combined model had a satisfactory agreement between the predicted TP53 status and the actual TP53 status (Figure 6C). The confusion matrix showed that the combined model effectively distinguished both wild-type TP53 and mutant TP53, without any class bias (Figure 7).
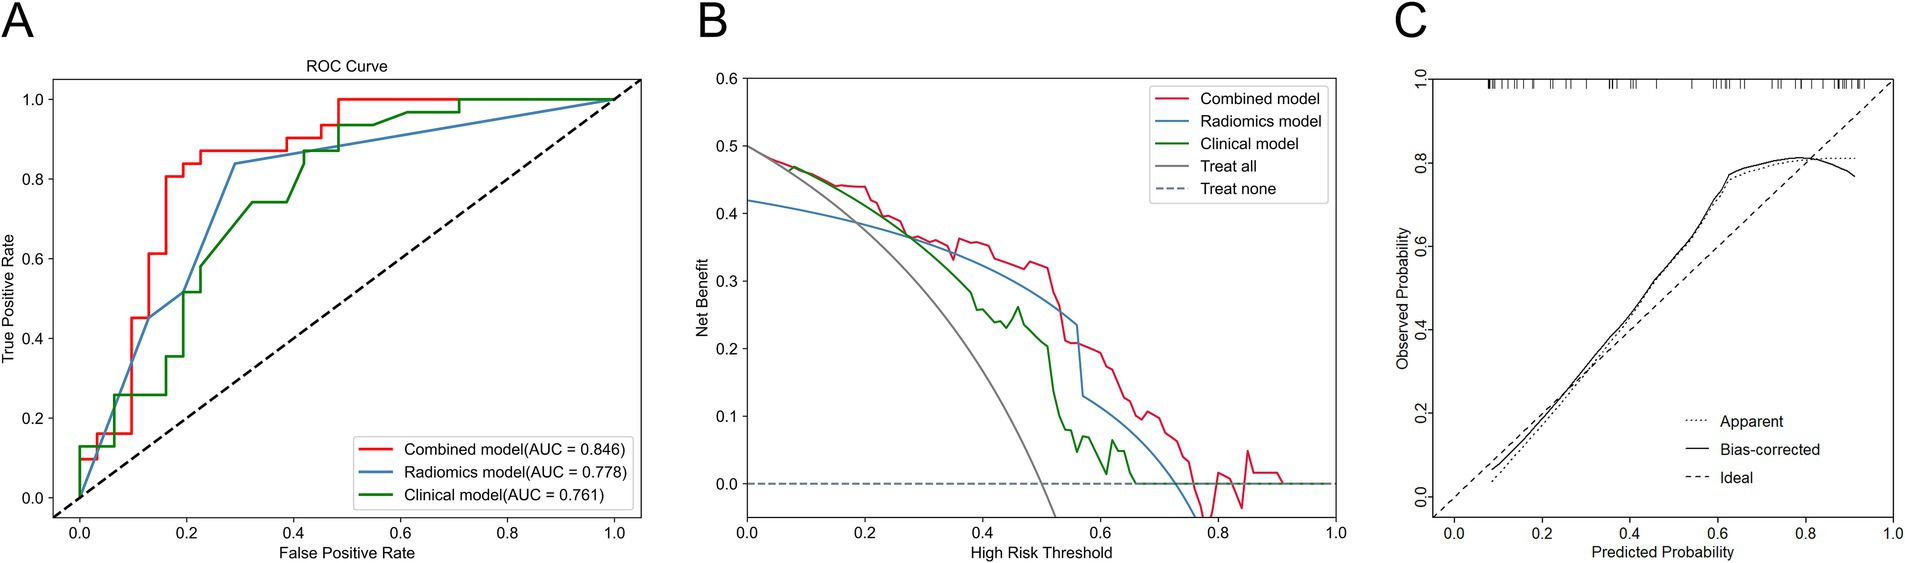
Figure 6. Comparison of the performance of three models in the test set. (A) ROC curve of three models. (B) Decision curve analysis (DCA) for three models. (C) Calibration curve of the combined model.
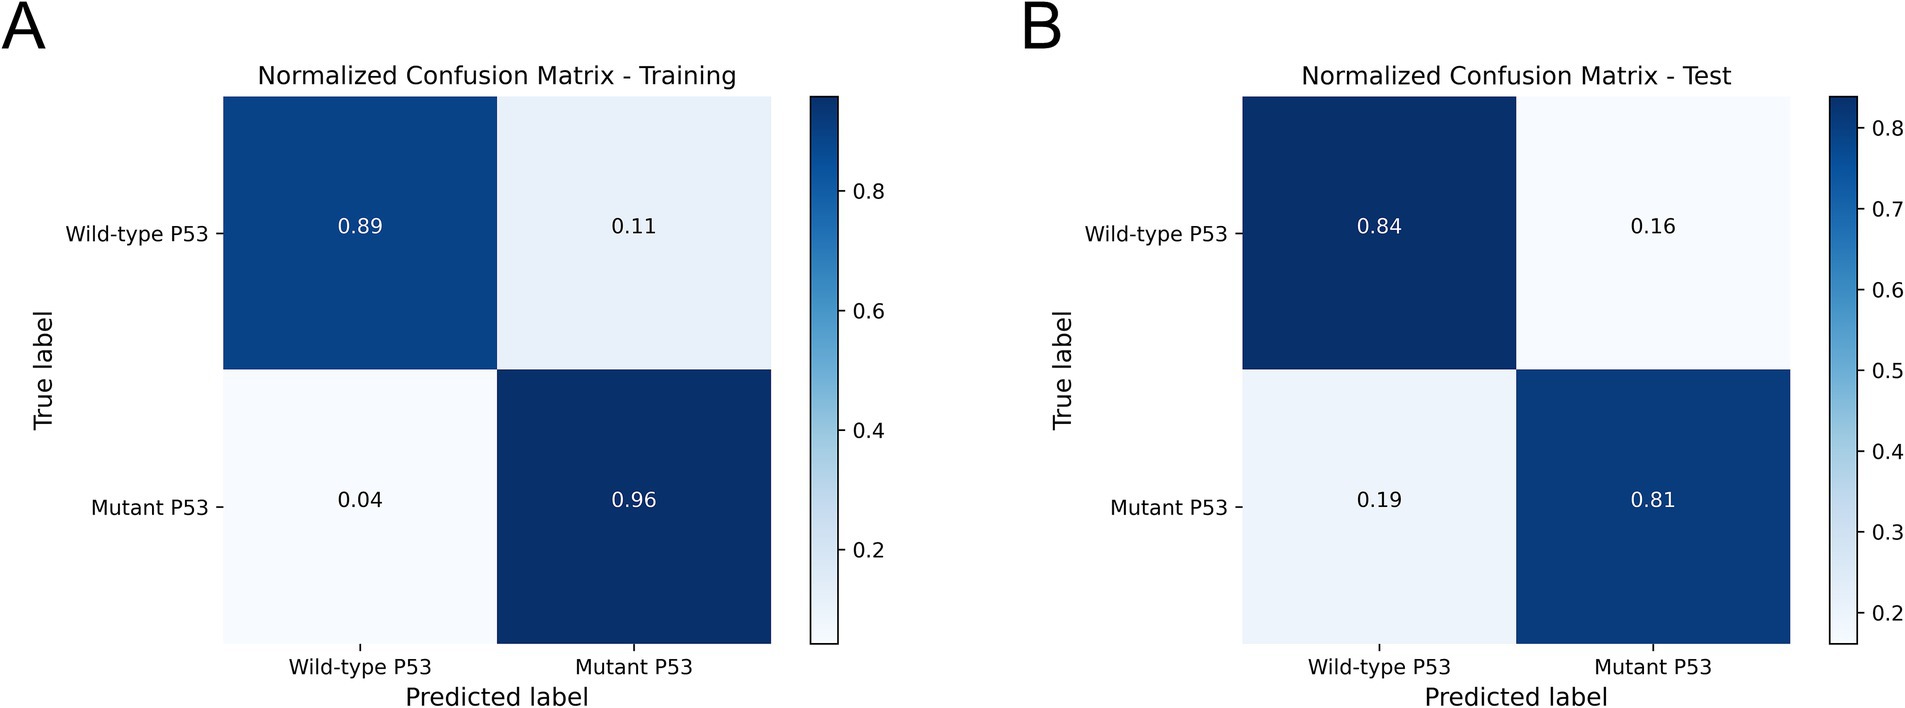
Figure 7. The confusion matrix of the combined model in the training set (A) and the test set (B).
4 Discussion
TP53 mutation is one of the most common gene mutations in HCC, which plays an important role in tumor development, metastasis, and the regulation of tumor microenvironment (TME) (5). In routine clinical practice, the determination of TP53 gene status primarily relies on IHC of surgical resection specimens or biopsy tissues. While IHC is a reliable and standardized method for assessing TP53 status, its invasive nature, delayed diagnosis, and high cost may limit the prevalence of its clinical detection. Therefore, there is a need for a noninvasive and cost-effective method for the preoperative assessment of TP53 gene status. Kitao et al. found that vasodilatation in the arterial phase of dynamic CT and relatively low signal in the hepatobiliary phase of gadoxetic acid-enhanced MRI were independent predictors of TP53-mutated HCC (AUC: 0.770) (41). Wu et al. performed texture analysis on CT images of HCC patients and found that texture parameters had a predictive effect on TP53 mutation (AUC: 0.621–0.792) (32). In the current study, the ultrasound radiomics model and the combined model achieved AUC of 0.778 and 0.846, respectively, demonstrating similar performance to CT and MRI models. The results indicated that ultrasound images contained significant information related to TP53 mutation and possessed substantial potential for clinical application. Furthermore, compared with CT or MRI, ultrasound offers advantages such as real-time imaging, convenience, non-radiation, and lower cost, making it a more suitable imaging tool for large-scale screening and long-term monitoring.
Ultrasound radiomics technology extracts and analyzes quantitative features from medical images, thereby uncovering potential biological information and enabling a comprehensive evaluation of tumor heterogeneity. An ultrasound radiomics study conducted by Zhang et al. to predict the expression status of Ki-67 in HCC showed that the ultrasomics model (AUC: 0.861, accuracy: 0.674) outperformed the clinical model (AUC: 0.700, accuracy: 0.651) (42). This finding aligned with our study results. The superior diagnostic performance of radiomics arises from its ability to detect subtle phenotypic variations and spatial heterogeneity, thereby providing a more comprehensive diagnostic perspective compared to conventional clinical features. Wu et al. only analyzed the correlation between texture parameters of CT images and TP53-mutated HCC (32). However, other radiomics features, such as higher-order features, also play a significant role in the evaluation of HCC. In this study, we extracted and analyzed all types of ultrasound radiomics features. Finally, 24 most significant ultrasound radiomics features were selected, of which 21 were higher-order features and the remaining features were first-order features and texture features. First-order features reflect the distribution of voxel intensity values, such as mean, minimum, and skewness. Texture features, namely second-order features, describe the spatial relationships between voxels exhibiting similar gray values within ROI, which reflect tumor heterogeneity. Common texture features include GLCM, GLDM, and others (43). Higher-order features refer to radiomics features extracted from filter-processed images, capturing more complex details and more clearly reflecting subtle changes within the tumor (44). Among the 21 higher-order features extracted, 17 were wavelet features, while the rest were square root, logarithmic, and exponential features. Our results demonstrate that wavelet features are crucial for predicting TP53 mutation status, consistent with previous studies (30). Wavelet features may capture complex information associated with the TP53 mutation status in HCC. The wavelet filter decomposes the original image into high-frequency and low-frequency sub-images, allowing for multi-scale analysis through wavelet functions. Wavelet transform enables a deeper understanding of the spatial heterogeneity of tumors (45). Previous studies have also demonstrated that wavelet features are powerful tools for analyzing image information and hold significant value in radiomics research (35, 46). Furthermore, incorporating clinical features with ultrasound radiomics features improved predictive performance, highlighting the complementary role of clinical data in radiomics models. This aligned with previous studies, which have demonstrated that integrating multi-source information enhances the robustness and generalizability of predictive models (47–49).
The dominance of the XGBoost-based combined model may be attributed to its intrinsic compatibility with multi-source features. XGBoost, an advanced gradient boosting algorithm, offers notable advantages in scalability and training speed. It incorporates regularization terms and second-order Taylor expansion in the objective function, effectively controlling model complexity, mitigating overfitting, and enhancing generalizability and predictive accuracy (50). Consistent with our finding, previous radiomics studies have also reported superior performance of the XGBoost classifier compared to other classifiers, further supporting the reliability of our modeling approach (48, 49).
Our study presented a novel approach for the preoperative identification of high-risk HCC patients with TP53 mutations. This study may be helpful in the following aspects. First, surgeons should consider a more aggressive surgical approach for HCC patients predicted to have TP53 mutations, due to the heightened risk of recurrence and microvascular invasion (51). Second, oncologists may adjust treatment strategies, as TP53 mutations are linked to resistance to certain systemic therapies, highlighting the potential need for alternative targeted treatments or combination therapies (52). Third, radiologists should conduct more rigorous imaging surveillance to detect early tumor progression or recurrence. Meanwhile, pathologists need to meticulously assess tumor characteristics in pathological specimens, combining the radiomics prediction, to provide more precise diagnostic information (53). Finally, patients predicted to have TP53 mutations should adhere to a personalized treatment regimen and undergo intensive follow-up.
There were some limitations in this study. First, as a retrospective single-center study, it had a limited sample size and lacked external validation. In the future, we plan to conduct a large-scale, multi-center study to validate the generalizability of this model. Second, due to the retrospective nature, there were variations in ultrasound equipment and scanning parameters. Despite image preprocessing and ICC tests, potential confounding factors may still have influenced the results. Third, this study employed IHC to assess TP53 gene status instead of gene sequencing technology. Although IHC is widely used in clinical practice due to its feasibility and cost-effectiveness, its ability to differentiate TP53 gene status is limited. To enhance the accuracy and reliability of future research, gene sequencing technology will be incorporated to precisely determine TP53 mutation status. Additionally, this study only used gray-scale ultrasound images in the current study and did not include contrast-enhanced ultrasound, elastography, CT, or other images. In the future, we plan to conduct a multi-modal radiomics study to enhance predictive performance and clinical applicability.
5 Conclusion
The machine learning-based ultrasound radiomics model was able to effectively predict the TP53 mutation status in HCC. When combined with clinical information, the performance of the ultrasound radiomics model can be further enhanced. The XGBoost-based combined model exhibited the highest predictive performance, highlighting its potential as a powerful tool for TP53 mutation prediction. While these findings require validation with larger sample sizes, ultrasound radiomics provides a non-invasive and efficient approach for detecting TP53 gene mutation. This approach facilitates the preoperative screening of high-risk individuals for TP53 mutation and aids in the development of personalized treatment strategies for HCC patients.
Data availability statement
The original contributions presented in the study are included in the article/Supplementary material, further inquiries can be directed to the corresponding author.
Ethics statement
The studies involving humans were approved by Ethics Committee of Henan Provincial People’s Hospital. The studies were conducted in accordance with the local legislation and institutional requirements. The ethics committee/institutional review board waived the requirement of written informed consent for participation from the participants or the participants’ legal guardians/next of kin because the study was retrospective.
Author contributions
DB: Conceptualization, Data curation, Formal analysis, Investigation, Methodology, Software, Visualization, Writing – original draft, Writing – review & editing. SD: Investigation, Methodology, Visualization, Writing – original draft. SR: Data curation, Formal analysis, Writing – original draft. YM: Data curation, Software, Writing – original draft. YuL: Formal analysis, Writing – original draft. YaL: Software, Writing – original draft. XC: Funding acquisition, Writing – review & editing. LZ: Conceptualization, Funding acquisition, Writing – review & editing.
Funding
The author(s) declare that financial support was received for the research and/or publication of this article. This study was sponsored by the National Natural Science Foundation of China (grant no. 82371987), the Key Research and Development Program of Henan Province (no. 221111310400), the Henan Rehabilitation Clinical Medical Research Center and Medical Appropriate Technology Promotion Project of Henan Province (no. SYJS2022018), and the Science and Technology Breakthrough Plan Project of Henan Province (no. 242102311104).
Acknowledgments
The mass spectrometer in Figure 3 was modified by DBCLS (https://togotv.dbcls.jp/en/pics.html/) and was unchanged, licensed under a Creative Common Attribution 4.0 Generic License (https://creativecommons.org/licenses/by/4.0/).
Conflict of interest
The authors declare that the research was conducted in the absence of any commercial or financial relationships that could be construed as a potential conflict of interest.
Generative AI statement
The author(s) declare that no Gen AI was used in the creation of this manuscript.
Publisher’s note
All claims expressed in this article are solely those of the authors and do not necessarily represent those of their affiliated organizations, or those of the publisher, the editors and the reviewers. Any product that may be evaluated in this article, or claim that may be made by its manufacturer, is not guaranteed or endorsed by the publisher.
Supplementary material
The Supplementary material for this article can be found online at: https://www.frontiersin.org/articles/10.3389/fmed.2025.1565618/full#supplementary-material
References
1. Bray, F, Laversanne, M, Sung, H, Ferlay, J, Siegel, RL, Soerjomataram, I, et al. Global cancer statistics 2022: GLOBOCAN estimates of incidence and mortality worldwide for 36 cancers in 185 countries. CA Cancer J Clin. (2024) 74:229–63. doi: 10.3322/caac.21834
2. Singal, AG, Kanwal, F, and Llovet, JM. Global trends in hepatocellular carcinoma epidemiology: implications for screening, prevention and therapy. Nat Rev Clin Oncol. (2023) 20:864–84. doi: 10.1038/s41571-023-00825-3
3. Calderaro, J, Seraphin, TP, Luedde, T, and Simon, TG. Artificial intelligence for the prevention and clinical management of hepatocellular carcinoma. J Hepatol. (2022) 76:1348–61. doi: 10.1016/j.jhep.2022.01.014
4. Zhang, Q, Lou, Y, Bai, X, and Liang, T. Intratumoral heterogeneity of hepatocellular carcinoma: from single-cell to population-based studies. World J Gastroenterol. (2020) 26:3720–36. doi: 10.3748/wjg.v26.i26.3720
5. Calderaro, J, Couchy, G, Imbeaud, S, Amaddeo, G, Letouzé, E, Blanc, J-F, et al. Histological subtypes of hepatocellular carcinoma are related to gene mutations and molecular tumour classification. J Hepatol. (2017) 67:727–38. doi: 10.1016/j.jhep.2017.05.014
6. Lee, JS, and Thorgeirsson, SS. Genome-scale profiling of gene expression in hepatocellular carcinoma: classification, survival prediction, and identification of therapeutic targets. Gastroenterology. (2004) 127:S51–5. doi: 10.1053/j.gastro.2004.09.015
7. Schulze, K, Imbeaud, S, Letouzé, E, Alexandrov, LB, Calderaro, J, Rebouissou, S, et al. Exome sequencing of hepatocellular carcinomas identifies new mutational signatures and potential therapeutic targets. Nat Genet. (2015) 47:505–11. doi: 10.1038/ng.3252
8. Kruse, JP, and Gu, W. Modes of p53 regulation. Cell. (2009) 137:609–22. doi: 10.1016/j.cell.2009.04.050
9. Bargonetti, J, and Manfredi, JJ. Multiple roles of the tumor suppressor p53. Curr Opin Oncol. (2002) 14:86–91. doi: 10.1097/00001622-200201000-00015
10. Tümen, D, Heumann, P, Gülow, K, Demirci, CN, Cosma, LS, Müller, M, et al. Pathogenesis and current treatment strategies of hepatocellular carcinoma. Biomedicine. (2022) 10:3202. doi: 10.3390/biomedicines10123202
11. Dowell, SP, Wilson, PO, Derias, NW, Lane, DP, and Hall, PA. Clinical utility of the immunocytochemical detection of p53 protein in cytological specimens. Cancer Res. (1994) 5:76–81. doi: 10.1111/j.1365-2303.1994.tb00530.x
12. Long, J, Wang, A, Bai, Y, Lin, J, Yang, X, Wang, D, et al. Development and validation of a TP53-associated immune prognostic model for hepatocellular carcinoma. EBioMedicine. (2019) 42:363–74. doi: 10.1016/j.ebiom.2019.03.022
13. Wölfel, G, Ostheim, E, Staub, A, Tümen, D, Heumann, P, Schmid, S, et al. The p53 family of transcription factors represses the alpha- fetoprotein gene expression in hepatocellular carcinoma. J Gastrointestin Liver Dis. (2023) 32:346–55. doi: 10.15403/jgld-4055
14. Liu, J, Ma, Q, Zhang, M, Wang, X, Zhang, D, Li, W, et al. Alterations of TP53 are associated with a poor outcome for patients with hepatocellular carcinoma: evidence from a systematic review and meta-analysis. Eur J Cancer. (2012) 48:2328–38. doi: 10.1016/j.ejca.2012.03.001
15. Park, NH, Chung, YH, Youn, KH, Song, BC, Yang, SH, Kim, JA, et al. Close correlation of p53 mutation to microvascular invasion in hepatocellular carcinoma. J Clin Gastroenterol. (2001) 33:397–401. doi: 10.1097/00004836-200111000-00011
16. Tseng, PL, Tai, MH, Huang, CC, Wang, CC, Lin, JW, Hung, CH, et al. Overexpression of VEGF is associated with positive p53 immunostaining in hepatocellular carcinoma (HCC) and adverse outcome of HCC patients. J Surg Oncol. (2008) 98:349–57. doi: 10.1002/jso.21109
17. Zhu, G, Pan, C, Bei, J, Li, B, Liang, C, Xu, Y, et al. Mutant p53 in cancer progression and targeted therapies. Front Oncol. (2020) 10:595187. doi: 10.3389/fonc.2020.595187
18. Kieser, A, Weich, HA, Brandner, G, Marmé, D, and Kolch, W. Mutant p53 potentiates protein kinase C induction of vascular endothelial growth factor expression. Oncogene. (1994) 9:963–9.
19. Fontemaggi, G, Dell’Orso, S, Trisciuoglio, D, Shay, T, Melucci, E, Fazi, F, et al. The execution of the transcriptional axis mutant p53, E2F1 and ID4 promotes tumor neo-angiogenesis. Nat Struct Mol Biol. (2009) 16:1086–93. doi: 10.1038/nsmb.1669
20. Novo, D, Heath, N, Mitchell, L, Caligiuri, G, MacFarlane, A, Reijmer, D, et al. Mutant p53s generate pro-invasive niches by influencing exosome podocalyxin levels. Nat Commun. (2018) 9:5069. doi: 10.1038/s41467-018-07339-y
21. Stein, Y, Aloni-Grinstein, R, and Rotter, V. Mutant p53-a potential player in shaping the tumor-stroma crosstalk. J Mol Cell Biol. (2019) 11:600–4. doi: 10.1093/jmcb/mjz071
22. Song, B, Yang, P, and Zhang, S. Cell fate regulation governed by p53: friends or reversible foes in cancer therapy. Cancer Commun. (2024) 44:297–360. doi: 10.1002/cac2.12520
23. Bykov, VJN, Eriksson, SE, Bianchi, J, and Wiman, KG. Targeting mutant p53 for efficient cancer therapy. Nat Rev Cancer. (2018) 18:89–102. doi: 10.1038/nrc.2017.109
24. Sung, YN, Kim, D, and Kim, J. P53 immunostaining pattern is a useful surrogate marker for TP53 gene mutations. Diagn Pathol. (2022) 17:92. doi: 10.1186/s13000-022-01273-w
25. Wang, Q, Zhang, Y, Zhang, E, Xing, X, Chen, Y, Nie, K, et al. A multiparametric method based on clinical and CT-based radiomics to predict the expression of p53 and VEGF in patients with spinal giant cell tumor of bone. Front Oncol. (2022) 12:894696. doi: 10.3389/fonc.2022.894696
26. Androutsakos, T, Dimitriadis, K, Revenas, K, Vergadis, C, Papadakis, DD, Sakellariou, S, et al. Liver biopsy: to do or not to do - a single-center study. Dig Dis. (2023) 41:913–21. doi: 10.1159/000533328
27. Lambin, P, Rios-Velazquez, E, Leijenaar, R, Carvalho, S, van Stiphout, RGPM, Granton, P, et al. Radiomics: extracting more information from medical images using advanced feature analysis. Eur J Cancer. (2012) 48:441–6. doi: 10.1016/j.ejca.2011.11.036
28. Lambin, P, Leijenaar, RTH, Deist, TM, Peerlings, J, de Jong, EEC, van Timmeren, J, et al. Radiomics: the bridge between medical imaging and personalized medicine. Nat Rev Clin Oncol. (2017) 14:749–62. doi: 10.1038/nrclinonc.2017.141
29. Aerts, HJWL, Velazquez, ER, Leijenaar, RTH, Parmar, C, Grossmann, P, Carvalho, S, et al. Decoding tumour phenotype by noninvasive imaging using a quantitative radiomics approach. Nat Commun. (2014) 5:4006. doi: 10.1038/ncomms5006
30. Zhong, X, Peng, J, Shu, Z, Song, Q, and Li, D. Prediction of p53 mutation status in rectal cancer patients based on magnetic resonance imaging-based nomogram: a study of machine learning. Cancer Imaging. (2023) 23:88. doi: 10.1186/s40644-023-00607-1
31. Ning, Y, Liu, W, Wang, H, Zhang, F, Chen, X, Wang, Y, et al. Determination of p53abn endometrial cancer: a multitask analysis using radiological-clinical nomogram on MRI. Br J Radiol. (2024) 97:954–63. doi: 10.1093/bjr/tqae066
32. Wu, H, Chen, X, Chen, J, Luo, Y, Jiang, X, Wei, X, et al. Correlations between P53 mutation status and texture features of CT images for hepatocellular carcinoma. Methods Inf Med. (2019) 58:042–9. doi: 10.1055/s-0039-1688758
33. Renzulli, M, and Golfieri, RBologna Liver Oncology Group (BLOG). Proposal of a new diagnostic algorithm for hepatocellular carcinoma based on the Japanese guidelines but adapted to the Western world for patients under surveillance for chronic liver disease. J Gastroenterol Hepatol. (2016) 31:69–80. doi: 10.1111/jgh.13150
34. Zhang, L, Qi, Q, Li, Q, Ren, S, Liu, S, Mao, B, et al. Ultrasomics prediction for cytokeratin 19 expression in hepatocellular carcinoma: a multicenter study. Front Oncol. (2022) 12:994456. doi: 10.3389/fonc.2022.994456
35. Qian, H, Shen, Z, Zhou, D, and Huang, Y. Intratumoral and peritumoral radiomics model based on abdominal ultrasound for predicting Ki-67 expression in patients with hepatocellular cancer. Front Oncol. (2023) 13:1209111. doi: 10.3389/fonc.2023.1209111
36. Hu, H, Wang, Z, Huang, X, Chen, S, Zheng, X, Ruan, S, et al. Ultrasound-based radiomics score: a potential biomarker for the prediction of microvascular invasion in hepatocellular carcinoma. Eur Radiol. (2019) 29:2890–901. doi: 10.1007/s00330-018-5797-0
37. Wu, J, Ding, W, Wang, Y, Liu, S, Zhang, X, Yang, Q, et al. Radiomics analysis of ultrasound to predict recurrence of hepatocellular carcinoma after microwave ablation. Int J Hyperth. (2022) 39:595–604. doi: 10.1080/02656736.2022.2062463
38. Yushkevich, PA, Piven, J, Hazlett, HC, Smith, RG, Ho, S, Gee, JC, et al. User-guided 3D active contour segmentation of anatomical structures: significantly improved efficiency and reliability. NeuroImage. (2006) 31:1116–28. doi: 10.1016/j.neuroimage.2006.01.015
39. Leijenaar, RTH, Nalbantov, G, Carvalho, S, van Elmpt, WJC, Troost, EGC, Boellaard, R, et al. The effect of SUV discretization in quantitative FDG-PET Radiomics: the need for standardized methodology in tumor texture analysis. Sci Rep. (2015) 5:11075. doi: 10.1038/srep11075
40. Chawla, NV, Bowyer, KW, Hall, LO, and Kegelmeyer, WP. SMOTE: synthetic minority over-sampling technique. J Artif Intell Res. (2002) 16:321–57. doi: 10.1613/jair.953
41. Kitao, A, Matsui, O, Zhang, Y, Ogi, T, Nakada, S, Sato, Y, et al. Dynamic CT and gadoxetic acid-enhanced MRI characteristics of P53-mutated hepatocellular carcinoma. Radiology. (2023) 306:e220531. doi: 10.1148/radiol.220531
42. Zhang, L, Duan, S, Qi, Q, Li, Q, Ren, S, Liu, S, et al. Noninvasive prediction of Ki-67 expression in hepatocellular carcinoma using machine learning-based ultrasomics: a multicenter study. J Ultrasound Med. (2022) 42:1113–22. doi: 10.1002/jum.16126
43. Incoronato, M, Aiello, M, Infante, T, Cavaliere, C, Grimaldi, AM, Mirabelli, P, et al. Radiogenomic analysis of oncological data: a technical survey. Int J Mol Sci. (2017) 18:805. doi: 10.3390/ijms18040805
44. Zhang, N, Wu, M, Zhou, Y, Yu, C, Shi, D, Wang, C, et al. Radiomics nomogram for prediction of glypican-3 positive hepatocellular carcinoma based on hepatobiliary phase imaging. Front Oncol. (2023) 13:1209814. doi: 10.3389/fonc.2023.1209814
45. Wu, S, Zheng, J, Li, Y, Yu, H, Shi, S, Xie, W, et al. A radiomics nomogram for the preoperative prediction of lymph node metastasis in bladder cancer. Clin Cancer Res. (2017) 23:6904–11. doi: 10.1158/1078-0432.CCR-17-1510
46. Liu, J, Cheng, D, Liao, Y, Luo, C, Lei, Q, Zhang, X, et al. Development of a magnetic resonance imaging-derived radiomics model to predict microvascular invasion in patients with hepatocellular carcinoma. Quant Imaging Med Surg. (2023) 13:3948–61. doi: 10.21037/qims-22-1011
47. Ren, S, Qi, Q, Liu, S, Duan, S, Mao, B, Chang, Z, et al. Preoperative prediction of pathological grading of hepatocellular carcinoma using machine learning-based ultrasomics: a multicenter study. Eur J Radiol. (2021) 143:109891. doi: 10.1016/j.ejrad.2021.109891
48. Yan, M, He, D, Sun, Y, Huang, L, Cai, L, Wang, C, et al. Comparative analysis of nomogram and machine learning models for predicting axillary lymph node metastasis in early-stage breast cancer: a study on clinically and ultrasound-negative axillary cases across two centers. Ultrasound Med Biol. (2024) 51:463–74. doi: 10.1016/j.ultrasmedbio.2024.11.003
49. Fan, R, Long, X, Chen, X, Wang, Y, Chen, D, and Zhou, R. The value of machine learning-based radiomics model characterized by PET imaging with 68Ga-FAPI in assessing microvascular invasion of hepatocellular carcinoma. Acad Radiol. (2024) 32:2233–46. doi: 10.1016/j.acra.2024.11.034
50. Chen, T, and Guestrin, C. XGBoost: a scalable tree boosting system. In proceedings of the 22nd ACM SIGKDD international conference on knowledge discovery and data mining. New York: Assoc Computing Machinery. (2016):785–94. doi: 10.1145/2939672.2939785
51. Cao, S, Zhou, Z, Chen, C, Li, W, Liu, J, Xu, J, et al. Early identification of hepatocellular carcinoma patients at high-risk of recurrence using the ADV score: a multicenter retrospective study. World J Surg Oncol. (2024) 22:240. doi: 10.1186/s12957-024-03523-1
52. Chan, K-T, and Lung, ML. Mutant p53 expression enhances drug resistance in a hepatocellular carcinoma cell line. Cancer Chemother Pharmacol. (2004) 53:519–26. doi: 10.1007/s00280-004-0767-4
53. Zhou, Z, Cao, S, Chen, C, Chen, J, Xu, X, Liu, Y, et al. A novel nomogram for the preoperative prediction of Edmondson-Steiner grade III-IV in hepatocellular carcinoma patients. J Hepatocell Carcinoma. (2023) 10:1399–409. doi: 10.2147/JHC.S417878
Glossary
HCC - Hepatocellular carcinoma
ICC - Intraclass correlation coefficient
XGBoost - Extreme gradient boosting
SVM - Support vector machine
RF - Random forest
DT - Decision tree
LR - Logistic regression
AUC - Area under the curve
DCA - Decision curve analysis
TME - Tumor microenvironment
AFP - Alpha-fetoprotein
ALT - Alanine aminotransferase
AST - Aspartate aminotransferase
ALB - Albumin level
TBIL - Total bilirubin
PT - Prothrombin time
DICOM - Digital Imaging and Communications in Medicine
GLCM - Gray-level co-occurrence matrix
GLDM - Gray-level dependence matrix
GLRLM - Gray-level run length matrix
GLSZM - Gray-level size-zone matrix
NGTDM - Neighboring gray-tone-difference matrix
MIC - Maximal Information Coefficient
ROI - Region of interest
Keywords: radiomics, hepatocellular carcinoma, machine learning, TP53, ultrasonography
Citation: Bu D, Duan S, Ren S, Ma Y, Liu Y, Li Y, Cai X and Zhang L (2025) Machine learning-based ultrasound radiomics for predicting TP53 mutation status in hepatocellular carcinoma. Front. Med. 12:1565618. doi: 10.3389/fmed.2025.1565618
Edited by:
Luis Castro-Sánchez, University of Colima, MexicoReviewed by:
Gaosen Zhang, China Medical University, ChinaZheyu Zhou, Nanjing Drum Tower Hospital, China
Francisco A. Molina-Pelayo, Baylor College of Medicine, United States
Copyright © 2025 Bu, Duan, Ren, Ma, Liu, Li, Cai and Zhang. This is an open-access article distributed under the terms of the Creative Commons Attribution License (CC BY). The use, distribution or reproduction in other forums is permitted, provided the original author(s) and the copyright owner(s) are credited and that the original publication in this journal is cited, in accordance with accepted academic practice. No use, distribution or reproduction is permitted which does not comply with these terms.
*Correspondence: Lianzhong Zhang, emx6ODc3N0AxNjMuY29t