 Sotaro Fuchigami
 Toru Niina
 Shoji Takada
- Department of Biophysics, Graduate School of Science, Kyoto University, Kyoto, Japan
The atomic force microscopy (AFM) is a powerful tool for imaging structures of molecules bound on surfaces. To gain high-resolution structural information, one often superimposes structure models on the measured images. Motivated by high flexibility of biomolecules, we previously developed a flexible-fitting molecular dynamics (MD) method that allows protein structural changes upon superimposing. Since the AFM image largely depends on the AFM probe tip geometry, the fitting process requires accurate estimation of the parameters related to the tip geometry. Here, we performed a Bayesian statistical inference to estimate a tip radius of the AFM probe from a given AFM image via flexible-fitting molecular dynamics (MD) simulations. We first sampled conformations of the nucleosome that fit well the reference AFM image by the flexible-fitting with various tip radii. We then estimated an optimal tip parameter by maximizing the conditional probability density of the AFM image produced from the fitted structure.
Introduction
The atomic force microscopy (AFM) is a powerful tool for imaging the structures of molecules bound on surface at atomic resolution (Ando et al., 2001; Kodera et al., 2006; Kodera et al., 2010; Uchihashi et al., 2011; Casuso et al., 2012; Ando et al., 2013; Ando et al., 2014; Dufrêne et al., 2017). However, because the AFM measurement gives only height information and because biomolecular AFM measurements often provide medium-resolution images, one often seeks molecular structures that fit to the AFM image. The fitting of rigid molecules can be achieved simply by translating and rotating a given structure model to find the best match to the AFM image. On the other hand, when the target molecules are flexible, as are often the case for biomolecules, one needs to allow a structural change of the model upon superimposing. This so-called flexible-fitting has been successfully applied in the modeling based on the cryo-electron microscopy data by various methods, for example, the molecular dynamics flexible fitting (MDFF) method and its extension (Trabuco et al., 2008; McGreevy et al., 2016; Singharoy et al., 2016), the correlation-coefficient-based method (Orzechowski and Tama, 2008), and CryoFold (Shekhar et al., 2020). The flexible-fitting can be realized by using molecular dynamics (MD) simulations, where a fitting score is integrated with the standard molecular mechanics force field. Recently, we developed a flexible-fitting MD method for finding molecular structures that fit the AFM image (Niina et al., 2020).
Generally, these fitting processes require knowledge on parameters that characterize the measurement, of which values are often unknown a priori. Therefore, one challenge is to infer these parameters, simultaneously finding the target molecular structures. In the case of the AFM measurement, such parameters include the size and the shape of the probe tip, which are usually unknown, but strongly affect the resulting images.
In this brief report, we focus on the inference of the radius of the AFM probe tip, assuming that it has the spherical shape. Using a Bayesian statistical inference approach, we examine feasibility of the inference of the AFM probe tip radius via flexible-fitting process. We chose a nucleosome as the test molecule (Figure 1A). The nucleosome consists of a histone octamer and a duplex DNA of 223 base pairs, and the initial structure was modeled using crystal structure (PDB ID: 3LZ0), as described in our previous work (Niina et al., 2017; Fuchigami et al., 2020).
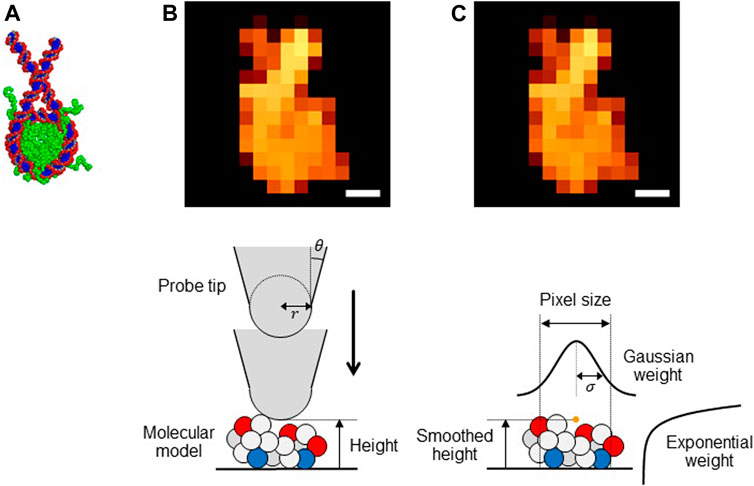
FIGURE 1. (A) Structure of a nucleosome used in this study. (BandC) Pseudo-AFM images of nucleosome (Scale bar: 5 nm) generated (B) by the collision detection method and (C) by the smoothed method (upper) and schematic views of these methods (lower).
Methods
Pseudo-AFM Image Generating Method
The collision detection method: The collision-detection method is to generate a pseudo-AFM image for a given molecular structure. It assumes a simple geometry of the probe tip; the cone-shape with its terminus being a sphere (Figure 1B, lower). Thus, the tip can be characterized by the two parameters, the tip radius
The collision-detection method is available as a tool “afmize” (http://doi.org/10.5281/zenode.3362044). The BioAFMviewer, which provides the pseudo-AFM image via a similar method, is also available (Amyot and Flechsig, 2020).
The smoothed method: While the collision detection method offers perhaps the most straightforward way to generate a pseudo-AFM image from a given structure model, the method does not give a form differentiable with respect to atomic coordinates of target molecules. This precludes its usage in the flexible-fitting MD since MD simulations require the force calculations that include the differentiation of the fitting score. To this end, we previously proposed a differentiable proxy of the collision detection method, which we call the smoothed method. For a target biomolecule represented by its coordinate
We assumed
Importantly, in the smoothed method expression, the tip radius
We note that a smaller
The smoothed method is also available in “afmize” (http://doi.org/10.5281/zenode.3362044).
Flexible-Fitting Molecular Dynamics Simulation
Flexible-fitting MD simulations utilize the total potential energy function,
See the reference (Niina et al., 2020) for more details.
Coarse-Grained Molecular Dynamics Simulation
In this study, as the physical interaction part of
All the simulations were performed by CafeMol (Kenzaki et al., 2011). Specifically, the current simulation setup is provided as an example of the flexible-fitting MD simulation in the CafeMol package.
Results
Relationship Between the Tip Radius and the Parameter σ
Before performing the flexible-fitting MD simulations, we quantify the relation between the AFM probe tip radius in the collision detection method and the
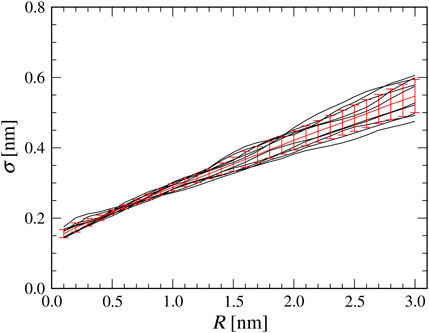
FIGURE 2. Relationship between a tip radius
Using the Bayes’ theorem, we can estimate the probability density to have the tip radius
where we assumed the discrete representation of the tip radius (0.1 nm increment). Without any prior knowledge, we assume
Bayesian Statistical Inference of the Tip Radius Using Flexible-Fitting MD Simulation
To examine the Bayesian statistical inference of the tip radius unambiguously, we need a test system for which we know the “correct” tip radius. To this end, in this study, we performed the so-called twin experiment. We first prepared a reference AFM image of the nucleosome using the collision detection method with the tip radius of 1.0 nm. This AFM image serves as the “experimental AFM image” in this study. Thus, the “correct” tip radius in this study is 1.0 nm.
For the experimental AFM image (Figure 3B), starting from a different structure (Figure 3C), we performed 106-step flexible-fitting MD simulations of the nucleosome system with various values of

FIGURE 3. Flexible-fitting MD simulations. (A) Representative time series of the correlation coefficient (c.c.) of pseudo-AFM image of the simulated structure with the “experimental” AFM image. Shown here are results from three different
To quantify the difference in the reached correlation coefficient (c.c.), we then estimated the probability density distributions of the c.c. for different

FIGURE 4. The probability density distributions of the correlation coefficient (c.c.) for representative
Looking into a finer scale (0.01 nm increment) shown in Figure 4B, we found the highest c.c. value 0.989 at σ = 0.31 nm. From the values of conditional probability density shown in Supplementary Table S2, it is found that the most probable value of tip radius
To test the statistical significance of the estimation of
Discussion
In this brief report, we investigated the statistical inference of the AFM probe tip radius via flexible-fitting MD simulations. First, we statistically characterized the relationship between the tip radius appeared in the collision detection method and the
As shown in Figure 2, a good linear correlation is observed between a tip radius
One possible limitation in the current approach is in the treatment of flexible regions of proteins. In the current test system, the nucleosome contains the histone octamer, which contain rather long disordered tails. Usually, the AFM measurements do not clearly detect the configuration of the histone tails. On the other hand, our collision detection method and the smoothed method detect such flexible regions in the same way as the well-folded regions. While fitting of the well-folded regions is realized in the current simulations, disordered tail configurations were not well fitted, which could cause some discrepancy in the tip radius inference.
While the current approach can infer the tip radius with reasonable accuracy, there can be room for improvement especially in terms of the estimate efficiency. The current approach needs to repeat the flexible-fitting MD with various
Data Availability Statement
The raw data supporting the conclusions of this article will be made available by the authors, without undue reservation.
Author Contributions
SF and ST designed the work. SF and TN developed the methodology. SF performed the calculation. SF and ST wrote the original manuscript. All the authors discussed the result and checked the manuscript.
Funding
This work was supported mainly by the Japan Science and Technology Agency (JST) grant (JPMJCR1762) (ST). The work is also partly supported by Grant-in-Aid for Scientific Research (C) to SF (Grant Number 19K06598) from Japan Society for the Promotion of Science (JSPS).
Conflict of Interest
The authors declare that the research was conducted in the absence of any commercial or financial relationships that could be construed as a potential conflict of interest.
Supplementary Material
The Supplementary Material for this article can be found online at: https://www.frontiersin.org/articles/10.3389/fmolb.2021.636940/full#supplementary-material.
References
Amyot, R., and Flechsig, H. (2020). BioAFMviewer: an interactive interface for simulated AFM scanning of biomolecular structures and dynamics. PLoS Comput. Biol. 16, e1008444. doi:10.1371/journal.pcbi.1008444
Ando, T., Kodera, N., Takai, E., Maruyama, D., Saito, K., and Toda, A. (2001). A high-speed atomic force microscope for studying biological macromolecules. Proc. Natl. Acad. Sci. U.S.A. 98, 12468–12472. doi:10.1073/pnas.211400898
Ando, T., Uchihashi, T., and Kodera, N. (2013). High-Speed AFM and applications to biomolecular systems. Annu. Rev. Biophys. 42, 393–414. doi:10.1146/annurev-biophys-083012-130324
Ando, T., Uchihashi, T., and Scheuring, S. (2014). Filming biomolecular processes by high-speed atomic force microscopy. Chem. Rev. 114, 3120–3188. doi:10.1021/cr4003837
Brandani, G. B., Niina, T., Tan, C., and Takada, S. (2018). DNA sliding in nucleosomes via twist defect propagation revealed by molecular simulations. Nucleic Acids Res. 46, 2788–2801. doi:10.1093/nar/gky158
Casuso, I., Khao, J., Chami, M., Paul-Gilloteaux, P., Husain, M., Duneau, J. P., et al. (2012). Characterization of the motion of membrane proteins using high-speed atomic force microscopy. Nat. Nanotechnol. 7, 525–529. doi:10.1038/nnano.2012.109
Dufrêne, Y. F., Ando, T., Garcia, R., Alsteens, D., Martinez-Martin, D., Engel, A., et al. (2017). Imaging modes of atomic force microscopy for application in molecular and cell biology. Nat. Nanotechnol. 12, 295–307. doi:10.1038/nnano.2017.45
Freeman, G. S., Hinckley, D. M., Lequieu, J. P., Whitmer, J. K., and De Pablo, J. J. (2014). Coarse-grained modeling of DNA curvature. J. Chem. Phys. 141, 165103. doi:10.1063/1.4897649
Fuchigami, S., Niina, T., and Takada, S. (2020). Particle filter method to integrate high-speed atomic force microscopy measurements with biomolecular simulations. J. Chem. Theory Comput. 16, 6609–6619. doi:10.1021/acs.jctc.0c00234
Kenzaki, H., Koga, N., Hori, N., Kanada, R., Li, W., Okazaki, K., et al. (2011). CafeMol: a coarse-grained biomolecular simulator for simulating proteins at work. J. Chem. Theory Comput. 7, 1979–1989. doi:10.1021/ct2001045
Kodera, N., Yamamoto, D., Ishikawa, R., and Ando, T. (2010). Video imaging of walking myosin v by high-speed atomic force microscopy. Nature 468, 72–76. doi:10.1038/nature09450
Kodera, N., Sakashita, M., and Ando, T. (2006). Dynamic proportional-integral-differential controller for high-speed atomic force microscopy. Rev. Sci. Instrum. 77 (2006), 083704. doi:10.1063/1.2336113
Li, W., Wang, Y., and Takada, S. (2014). Energy landscape views for interplays among folding, binding, and allostery of calmodulin domains. Proc. Natl. Acad. Sci. U.S.A. 111 (2014), 10550–10555. doi:10.1073/pnas.1402768111
McGreevy, R., Teo, I., Singharoy, A., and Schulten, K. (2016). Advances in the molecular dynamics flexible fitting method for cryo-EM modeling. Methods 100, 50–60. doi:10.1016/j.ymeth.2016.01.009
Niina, T., Brandani, G. B., Tan, C., and Takada, S. (2017). Sequence-dependent nucleosome sliding in rotation-coupled and uncoupled modes revealed by molecular simulations. PLoS Comput. Biol. 13, e1005880. doi:10.1371/journal.pcbi.1005880
Niina, T., Fuchigami, S., and Takada, S. (2020). Flexible fitting of biomolecular structures to atomic force microscopy images via biased molecular simulations. J. Chem. Theory Comput. 16, 1349–1358. doi:10.1021/acs.jctc.9b00991
Orzechowski, M., and Tama, F. (2008). Flexible fitting of high-resolution x-ray structures into cryoelectron microscopy maps using biased molecular dynamics simulations. Biophys. J. 95, 5692–5705. doi:10.1529/biophysj.108.139451
Shekhar, M., Terashi, G., Gupta, C., Sarkar, D., Debussche, G., Sisco, N. J., et al. (2020). CryoFold: determining protein structures and ensembles from cryo-EM data. bioRxiv 687087. doi:10.1101/687087
Singharoy, A., Teo, I., McGreevy, R., Stone, J. E., Zhao, J., and Schulten, K. (2016). Molecular dynamics-based refinement and validation for sub-5 Å cryo-electron microscopy maps. eLife 5, e16105. doi:10.7554/eLife.16105
Tan, C., and Takada, S. (2020). Nucleosome allostery in pioneer transcription factor binding. Proc. Natl. Acad. Sci. U.S.A. 117, 20586–20596. doi:10.1073/pnas.2005500117
Trabuco, L. G., Villa, E., Mitra, K., Frank, J., and Schulten, K. (2008). Flexible fitting of atomic structures into electron microscopy maps using molecular dynamics. Structure 16, 673–683. doi:10.1016/j.str.2008.03.005
Keywords: atomic force microscopy, probe tip, flexible-fitting, coarse-grained molecular simulation, CafeMol
Citation: Fuchigami S, Niina T and Takada S (2021) Case Report: Bayesian Statistical Inference of Experimental Parameters via Biomolecular Simulations: Atomic Force Microscopy. Front. Mol. Biosci. 8:636940. doi: 10.3389/fmolb.2021.636940
Received: 02 December 2020; Accepted: 25 January 2021;
Published: 10 March 2021.
Edited by:
Fabio Trovato, Freie Universität Berlin, GermanyReviewed by:
Holger Flechsig, Kanazawa University, JapanYi He, University of New Mexico, Albuquerque, NY, United States
Abhishek Singharoy, Arizona State University, Tempe, AZ, United States
Copyright © 2021 Fuchigami, Niina and Takada. This is an open-access article distributed under the terms of the Creative Commons Attribution License (CC BY). The use, distribution or reproduction in other forums is permitted, provided the original author(s) and the copyright owner(s) are credited and that the original publication in this journal is cited, in accordance with accepted academic practice. No use, distribution or reproduction is permitted which does not comply with these terms.
*Correspondence: Sotaro Fuchigami, c290YXJvQGJpb3BoeXMua3lvdG8tdS5hYy5qcA==; Shoji Takada, dGFrYWRhQGJpb3BoeXMua3lvdG8tdS5hYy5qcA==