 Hang Zheng
 Yuge Bai
 Xin Wang
- Department of General Surgery, Peking University First Hospital, Beijing, China
Immunotherapy has achieved efficacy for advanced colorectal cancer (CRC) patients with a mismatch-repair-deficient (dMMR) subtype. However, little immunotherapy efficacy was observed in patients with the mismatch repair-proficient (pMMR) subtype, and hence, identifying new immune therapeutic targets is imperative for those patients. In this study, transcriptome data of stage III/IV CRC patients were retrieved from the Gene Expression Omnibus database. The CIBERSORT algorithm was used to quantify immune cellular compositions, and the results revealed that M2 macrophage fractions were higher in pMMR patients as compared with those with the dMMR subtype; moreover, pMMR patients with higher M2 macrophage fractions experienced shorter overall survival (OS). Subsequently, weighted gene co-expression network analysis and protein–protein interaction network analysis identified six hub genes related to M2 macrophage infiltrations in pMMR CRC patients: CALD1, COL6A1, COL1A2, TIMP3, DCN, and SPARC. Univariate and multivariate Cox regression analyses then determined CALD1 as the independent prognostic biomarker for OS. CALD1 was upregulated specifically the in CMS4 CRC subtype, and single-sample Gene Set Enrichment Analysis (ssGSEA) revealed that CALD1 was significantly correlated with angiogenesis and TGF-β signaling gene sets enrichment scores in stage III/IV pMMR CRC samples. The Estimation of STromal and Immune cells in MAlignant Tumor tissues using Expression data (ESTIMATE) algorithm and correlation analysis revealed that CALD1 was significantly associated with multiple immune and stromal components in a tumor microenvironment. In addition, GSEA demonstrated that high expression of CALD1 was significantly correlated with antigen processing and presentation, chemokine signaling, leukocyte transendothelial migration, vascular smooth muscle contraction, cytokine–cytokine receptor interaction, cell adhesion molecules, focal adhesion, MAPK, and TGF-beta signaling pathways. Furthermore, the proliferation, invasion, and migration abilities of cancer cells were suppressed after reducing CALD1 expression in CRC cell lines. Taken together, multiple bioinformatics analyses and cell-level assays demonstrated that CALD1 could serve as a prognostic biomarker and a prospective therapeutic target for stage III/IV pMMR CRCs.
Introduction
Colorectal cancer (CRC) is expected to rank as the third leading incidence of new malignancy and the second for cancer-specific mortality (Bray et al., 2018). While CRC is relatively curable if detected and treated early, approximately 58% of CRCs are diagnosed at progressive and metastatic stages, which pose a grave threat to human health (Siegel et al., 2017). In the past decade, immunotherapy in first-line has achieved robust disease control and durable response for patients with advanced or metastatic mismatch repair-deficient (dMMR) CRCs (Couzin-Frankel, 2013; Diaz et al., 2017; Le et al., 2017; Overman et al., 2017; Morse et al., 2019); this is because dMMR cancers harbor higher numbers of somatic mutations, which result in the increasing generation of aberrant neopeptides, thus facilitating antitumor cytotoxic cell recruitments and immunotherapy responses (Dolcetti et al., 1999; Smyrk et al., 2001; Prall et al., 2004). However, little immunotherapy efficacy was observed in patients with the mismatch repair-proficient (pMMR) subtype (Le et al., 2015), who constitute a substantial proportion (approximately 80 to 85%) of CRCs (Boland et al., 1998; Peltomäki, 2003) and exhibit more unfavorable prognostic outcomes than those with the dMMR subtype (Gryfe et al., 2000; Popat et al., 2005; Malesci et al., 2007). Low mutational burden and lack of capability to recruit antitumor immune cells have been considered as the essential obstacles for pMMR tumors to benefit from immunotherapy (Ganesh et al., 2019). Therefore, alternative immune modulation approaches are eagerly awaited for the majority of CRC patients with the pMMR subtype.
Interactions in the tumor microenvironment (TME) between cancer cells and their surroundings are intricate (Hanahan and Coussens Lisa, 2012). Tumor-associated macrophages (TAMs) are the most abundant immune cells in the TME (up to 50%) and are generally categorized into M1 and M2 subtypes (Najafi et al., 2019). M1 plays a tumoricidal effect through secreting pro-inflammatory cytokines like CXCL9 and CXCL10 and initiating inflammatory response to enhance adaptive immune response at the preliminary oncogenesis stage, while the M2 subtype often releases anti-inflammatory cytokines and contributes to angiogenesis, tumor progression, and immunosuppression at the advanced tumor stage (Tan et al., 2018; Ubil et al., 2018; Xiang et al., 2018). Although fractions of M1 macrophages were higher in dMMR CRCs (Narayanan et al., 2019), no significant difference in M2 macrophages infiltration density was found between the pMMR and dMMR subgroups (Bernal et al., 2011; Zhao Y. et al., 2019). Collectively, these data raise constructive guidance regarding the identification of biomarkers related to M2 macrophage infiltrations to weaken the tumorigenic immunoediting activity in pMMR CRC patients.
Nowadays, widespread analysis of high-throughput technologies via advanced computational techniques facilitates the identification of disease-related biomarkers (Fernandes et al., 2020). Weighted gene co-expression network analysis (WGCNA) is a well-documented systematic bioinformatics tool to extract co-related gene modules and then identify hub genes that correlated with clinical traits of interest (Horvath and Dong, 2008; Kakati et al., 2019), and has been widely applied for potential therapeutic target detections in various cancers (Zeng et al., 2020; Zhang et al., 2020; Zhu and Hou, 2020). In this study, based on RNA-seq data acquired from public database, M2 macrophage fractions in stage III/IV pMMR CRC patients were calculated by the CIBERSORT algorithm, and WGCNA was then performed to identify the associated hub genes. By applying Cox regression analyses, CALD1 was identified as an independent prognostic biomarker. We further validated CALD1 for its roles in TME components and tumor progression at both the gene expression and cellular level. We propose CALD1 as a potential target for pMMR CRC for further study.
Materials and Methods
Data Pre-processing
The RNA-Seq and corresponding clinical data were acquired from the Gene Expression Omnibus (GEO)1 database, including GSE39582 (Marisa et al., 2013) and GSE41258 (Sheffer et al., 2009). GSE39582 was based on the GPL570 platform (Affymetrix Human Genome U133 Plus 2.0 Array), and 200 pMMR stage III/IV CRC samples were utilized as the training group for M2 macrophages-correlated genes selection. The GSE41258 dataset, which was based on GPL96 (Affymetrix Human Genome U133A Array) and contained 82 stage III/IV pMMR CRC samples, was used for external validation. The raw CEL microarray data were downloaded and preprocessed using the RMA method by the “affy” R package (Gautier et al., 2004). If more probes mapped one gene symbol, the maximum value was chosen. The function normalizeBetweenArrays of the “limma” R package was used to achieve consistency between arrays (Ritchie et al., 2015).
Tumor-Infiltrating Immune Cell (TIIC) Assessment
The CIBERSORT algorithm could accurately quantify the relative infiltration fractions of 22 kinds of immune cells from normalized gene expression profiles by implementing the support vector regression (SVR) machine learning method (Scholkopf et al., 2000; Newman et al., 2015). The TIIC fractions in GSE39582 samples were calculated by “CIBERSORT” R script with the leukocyte gene signature matrix LM22; the significant CIBERSORT P-value was set as less than 0.05. The distribution differences of TIICs between dMMR and pMMR tumors were compared by Wilcoxon test, and the associations between M2 macrophage infiltrations and survival status in pMMR patients were investigated.
Co-expression Network Construction
Stage III/IV pMMR CRC samples with CIBERSORT p < 0.05 were screened for WGCNA analysis through the “WGCNA” R package (Langfelder and Horvath, 2008). Generally, the co-expression similarity sij was computed as the absolute value of Pearson’s correlation between nodes i and j:
Following this, a weighted adjacency matrix could be calculated by raising sij to a soft thresholding power β, which could intensify strong correlations and reduce weak correlations:
Next, the adjacency matrix was transformed to a topological overlap matrix (TOM), and highly interconnected genes were clustered into different modules by calculating TOM dissimilarity (1-TOM) with a minimum cluster size of 30 (Yip and Horvath, 2007). Significant module and trait with the highest coefficient was identified for the following analysis. Module eigengene (ME) was defined as the first principal component of the specific module that could represent the module genes. Module membership (MM) was used to determine the correlation between ME and each module, and gene significance (GS) was the Pearson’s correlation between each gene expression and the representative trait. Genes with high intramodular connectivity were regarded as hub genes; the parameters of candidate hub genes were set as MM > 0.8 and GS > 0.2 (Horvath and Dong, 2008).
Functional and Pathway Enrichment Analysis
Gene Ontology (GO) and Kyoto Encyclopedia of Genes and Genomes (KEGG) pathway enrichment analyses of candidate hub genes were conducted via the “clusterProfiler” R package; an adjusted p-value of less than 0.05 was regarded as statistically significant (Yu et al., 2012).
Protein–Protein Interaction (PPI) Network Integration and Analysis
The PPI network was built by the online STRING database2 (Szklarczyk et al., 2019) and mapped in the Cytoscape software (version 3.7.2)3 (Shannon et al., 2003). Hub genes were ranked by six methods provided from the cytoHubba plugin (Chin et al., 2014). Then we calculated and visualized Spearman’s correlations between hub gene expressions and M2 macrophage fractions.
Prognostic Hub Gene Identification and Validation
The prognostic values of the hub genes were assessed by log-rank test on the total of 200 stage III/IV pMMR CRC patients of the GSE39582 dataset. Hub genes as well as clinicopathological factors such as sex, chemotherapy, and the TNM stage were subjected to univariate and multivariate Cox regression analyses to explore independent prognostic factors.
Tumor Microenvironment Analysis
Firstly, we conducted Spearman correlation analysis for CALD1 expression with 22 types of TIICs based on CIBERSORT results. Then, the consensus molecular subtype (CMS) categorizations of CRC patients were performed via the “CMSCaller” R package (Eide et al., 2017), and the differences in the CALD1 expression between CMS subgroups were analyzed using the Kruskal–Wallis test followed by Dunn post hoc tests for multiple comparisons via the “FSA” R package. Next, the Estimation of STromal and Immune cells in MAlignant Tumor tissues using Expression data (ESTIMATE) algorithm was applied via the “estimate” R package to presume the immune and stromal cellular heterogeneity in the TME (Yoshihara et al., 2013). In addition, based on “HALLMARK_ANGIOGENESIS” and “HALLMARK_TGF_BETA_SIGNALING” gene sets extracted from the Molecular Signature Database (MSigDB)4, the single sample gene set enrichment analysis (ssGSEA) algorithm was employed via the “GSVA” R package to quantify each sample’s enrichment score, which represents the cumulative enrichment degree of the genes in the assigned gene set in the individual sample (Hänzelmann et al., 2013). Finally, correlations of CALD1 expression with ssGSEA enrichment scores, immune and stromal scores, as well as immune cell markers were analyzed and visualized via the “ggcorrplot” R package.
Gene Set Enrichment Analysis (GSEA) of Diverse Pathway Enrichments
Two hundred cases of GSE39582 were separated into CALD1-high and CALD1-low expression groups according to the median CALD1 expression value. GSEA (Subramanian et al., 2005) was then performed to explore different enriched KEGG pathways between two groups via the “clusterProfiler” R package (Yu et al., 2012), and gene sets with an adjusted P < 0.05 was considered as significantly enriched.
Cell Culture and Transfection
Human pMMR CRC cell lines SW480, SW620, and Caco-2 and dMMR cell line HCT116 (Berg et al., 2017) were obtained from the Cancer Institute of the Chinese Academy of Medical Sciences. SW480, SW620, and Caco-2 cells were cultured in Dulbecco’s modified Eagle’s medium (DMEM, Biological Industries, Israel), and HCT116 was cultured in McCoy’s 5A Medium (Biological Industries, Israel) supplemented with 10% fetal bovine serum (FBS, Biological Industries, Israel) and 1% penicillin–streptomycin (Biological Industries, Israel) at 5% CO2 and 37°C.
Western Blotting (WB)
Total protein lysates of cells were extracted with a RIPA lysis buffer supplemented with 1 mM phenylmethylsulfonyl fluoride (PMSF) and 1 mM protease inhibitor cocktail (Beyotime, Shanghai, China). A BCA assay kit (Beyotime, Shanghai, China) was utilized to measure total protein concentration, and 30 μg of denatured proteins was subjected to 10% SDS-PAGE and electroblotted onto PVDF membranes (Millipore, Burlington, MA, United States). After that, the membranes were blocked with 5% milk in TBST for 1 h at room temperature and then incubated with primary antibodies containing rabbit monoclonal anti-Caldesmon (1:1000, Abcam, Cambridge, MA, United States) and GAPDH (1:1000, Cell Signaling Technology, Danvers, MA, United States) overnight at 4 °C. Finally, the membranes were incubated with corresponding secondary antibodies (1:8000, ZSGB-BIO, Beijing, China) for 1 h at room temperature and then treated with a chemiluminescent HRP substrate (Millipore, Burlington, MA, United States) and exposed to the Bio-Rad imaging system.
siRNA Transfection
Transient knockdown of CALD1 in SW480 and SW620 cells was achieved by siRNA transfection. The siRNA sequences for CALD1 (sense 5′–3′, GGAGGAGAUGCGACUCGAATT) and normal control (NC, sense 5′–3′, UUCUCCGAACGUGUCACGUTT) were synthesized by GenePharma (Jiangsu, China). Cells with confluences of 70–80% were transfected with 100 nM CALD1 or NC siRNA using GP-siRNA-Mate (GenePharma, Jiangsu, China). After transfection for 48 h, cells were harvested and CALD1 knockdown was confirmed by WB.
Cell Migration and Invasion Assay
The metastasis abilities of SW480 and SW620 cells were routinely measured in Transwell chambers (8-μm pore size, Corning, NY, United States). The cells (100,000 cells) were inoculated in a serum-free DMEM on the top chamber, while the bottom chamber contained a 600 μl complete medium. After incubation for an appropriate time, cells on the bottom of the membrane were fixed and stained with 0.1% crystal violet solution. For cell invasion assay, the upper compartment of the chamber was precoated with matrix gel.
Cell Proliferation Assay
After transfection for 24h, cells were plated into 96-well plates (2,000 cells/well). At the appointed time points (6, 24, 48, and 72 h), the cells were incubated with a 10 μL cell counting kit 8 (CCK8) solution (Bimake, Houston, TX, United States) for additional 2 h. Then, cell viability was determined by recording a 450 nm absorbance value, and comparisons between normal cancer cells, si-NC, and si-CALD1 transfected cells were conducted by Kruskal–Wallis one-way analysis of variance (ANOVA).
Statistical Analyses
All statistical analyses were performed via R software 3.6.3. Cox regression analysis and Kaplan–Meier log-rank test was performed for survival analysis, and the optimal cut-off value was produced by the “surv_cutpoint” function of the “survminer” R package. All experiments were repeated at least three times, and a P-value of <0.05 was deemed statistically significant.
Results
TIIC Landscape in Stage III/IV pMMR and dMMR CRC Patients
The schematic diagram of this research is manifested in Figure 1. Firstly, CIBERSORT identified 85 pMMR and 20 dMMR significant samples (CIBERSORT P-value < 0.05), M2 macrophage fractions were higher in pMMR patients (Figure 2A), and pMMR patients with higher M2 macrophage fractions experienced shorter overall survival (OS) (Figure 2B). Subsequently, the M2 macrophage fractions in 85 stage III/IV pMMR CRC patients were chosen as clinical traits for WGCNA construction.
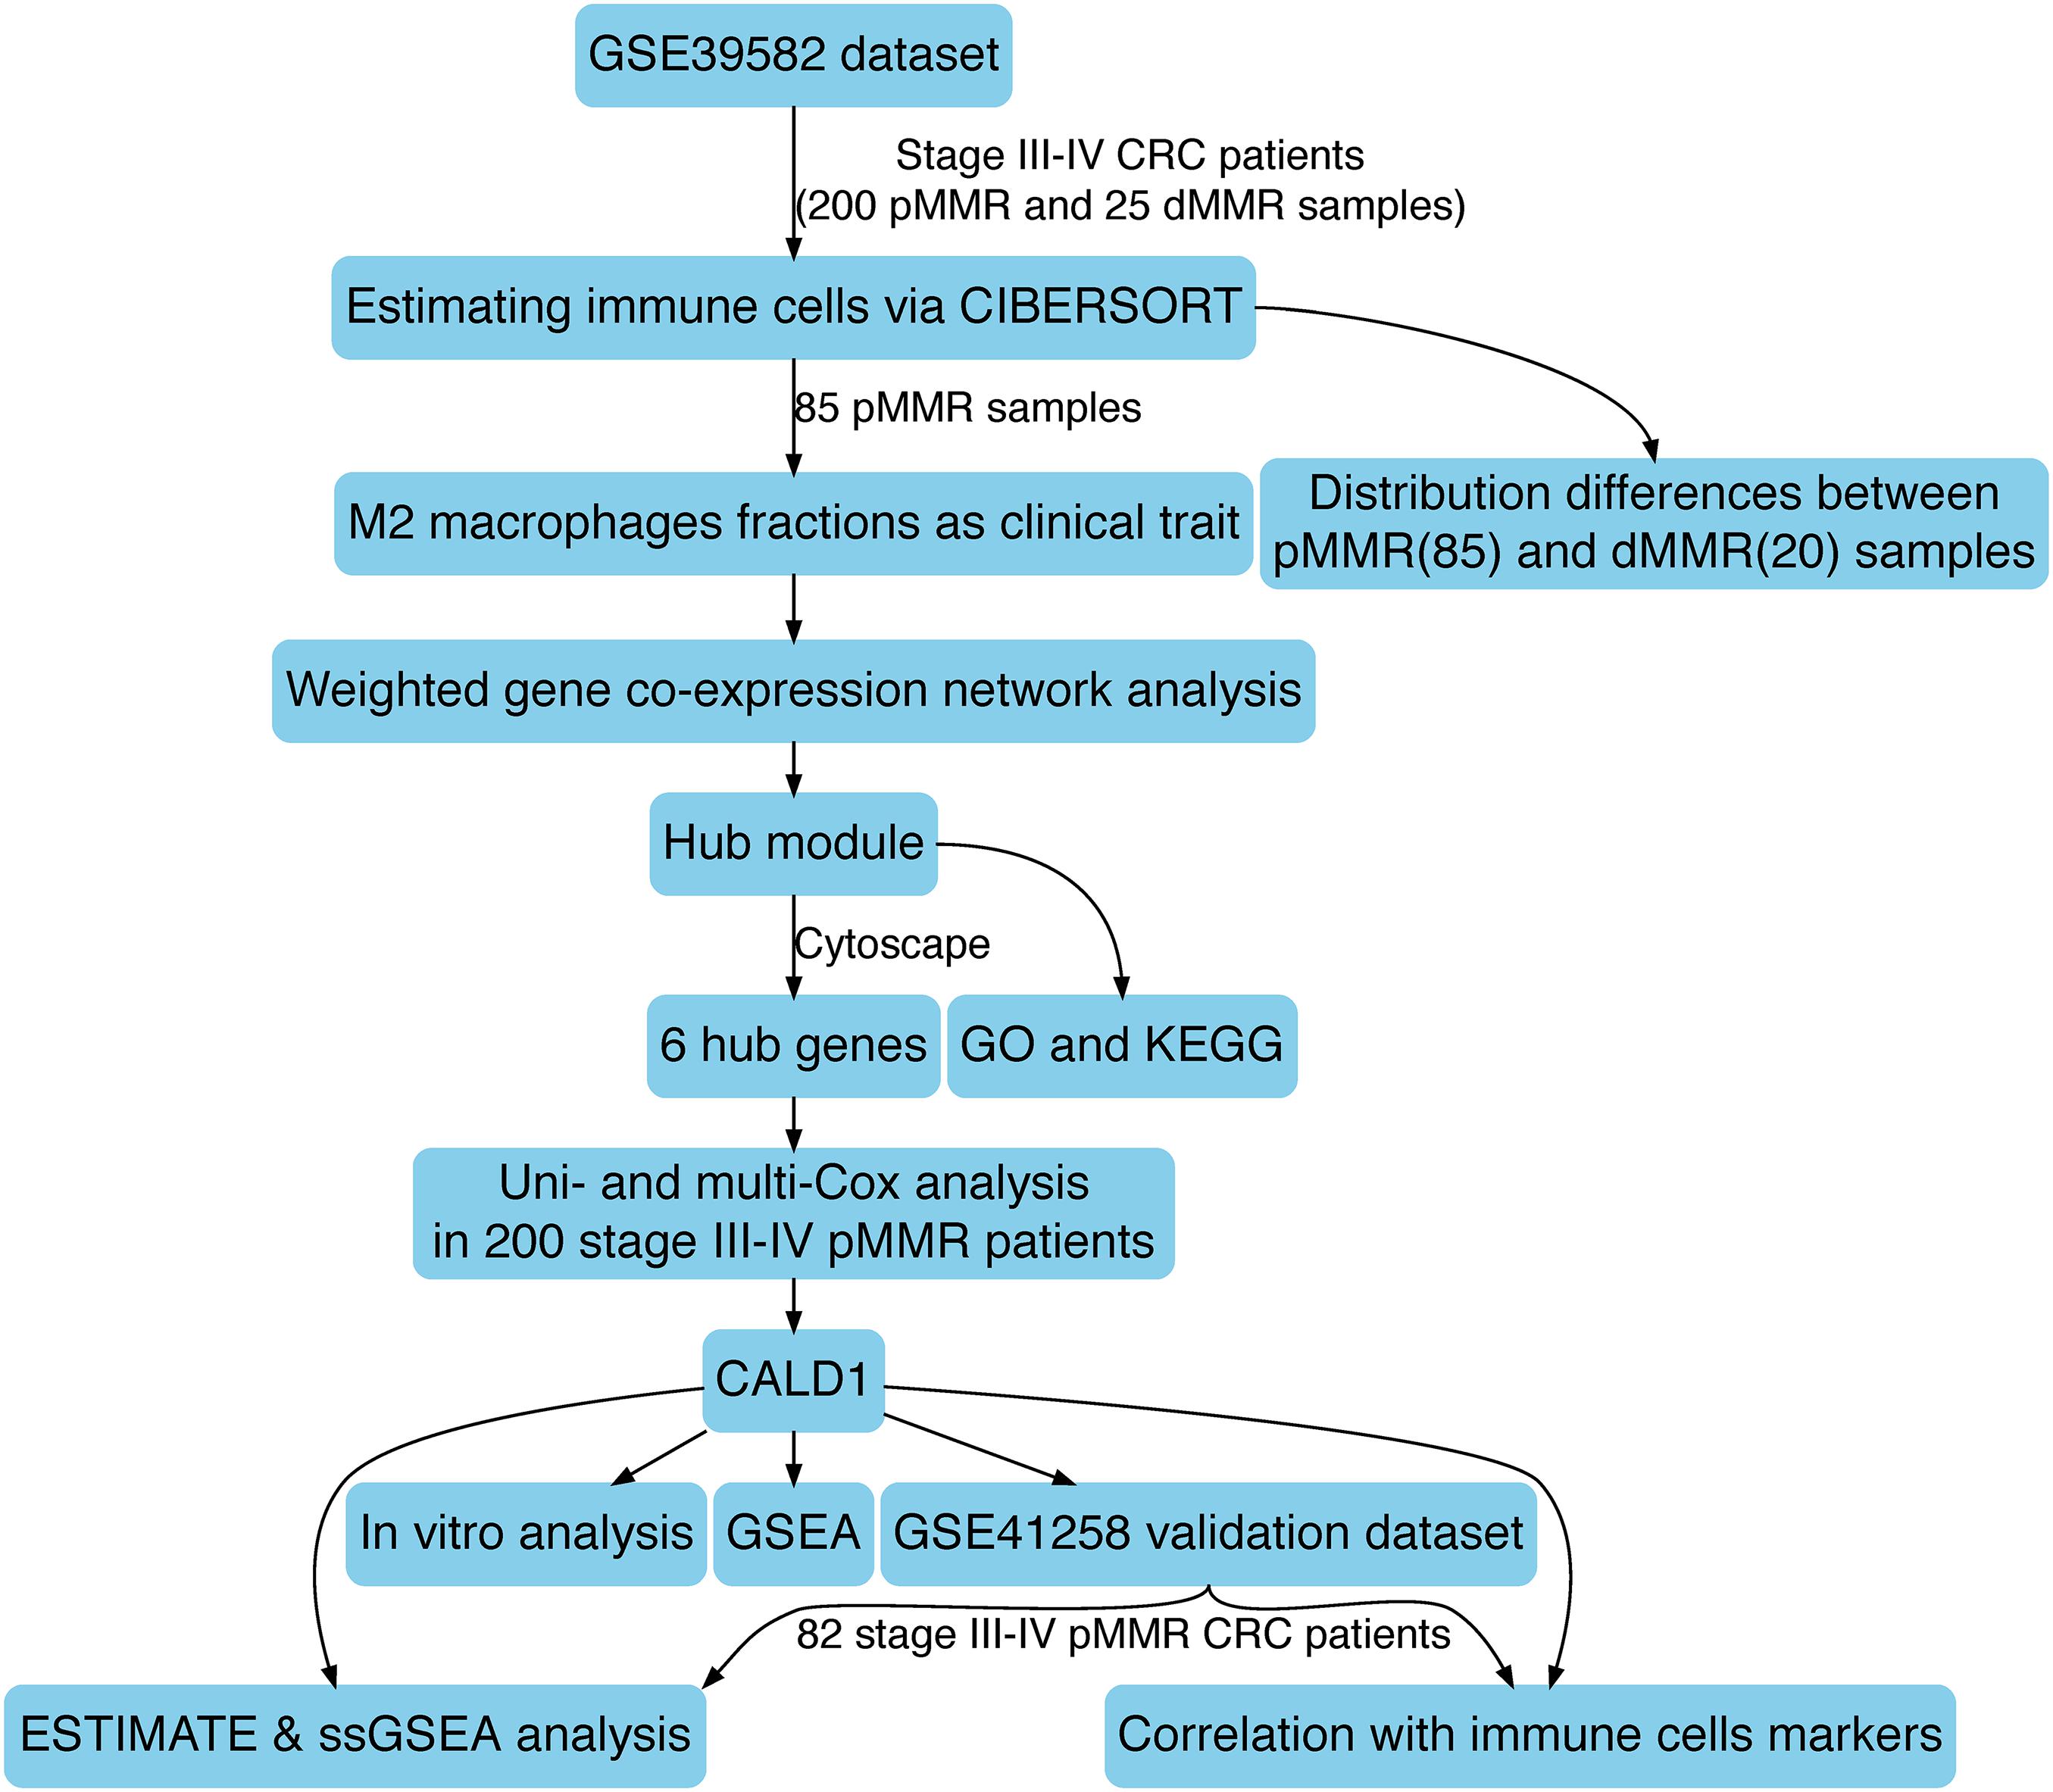
Figure 1. The schematic diagram of this study.
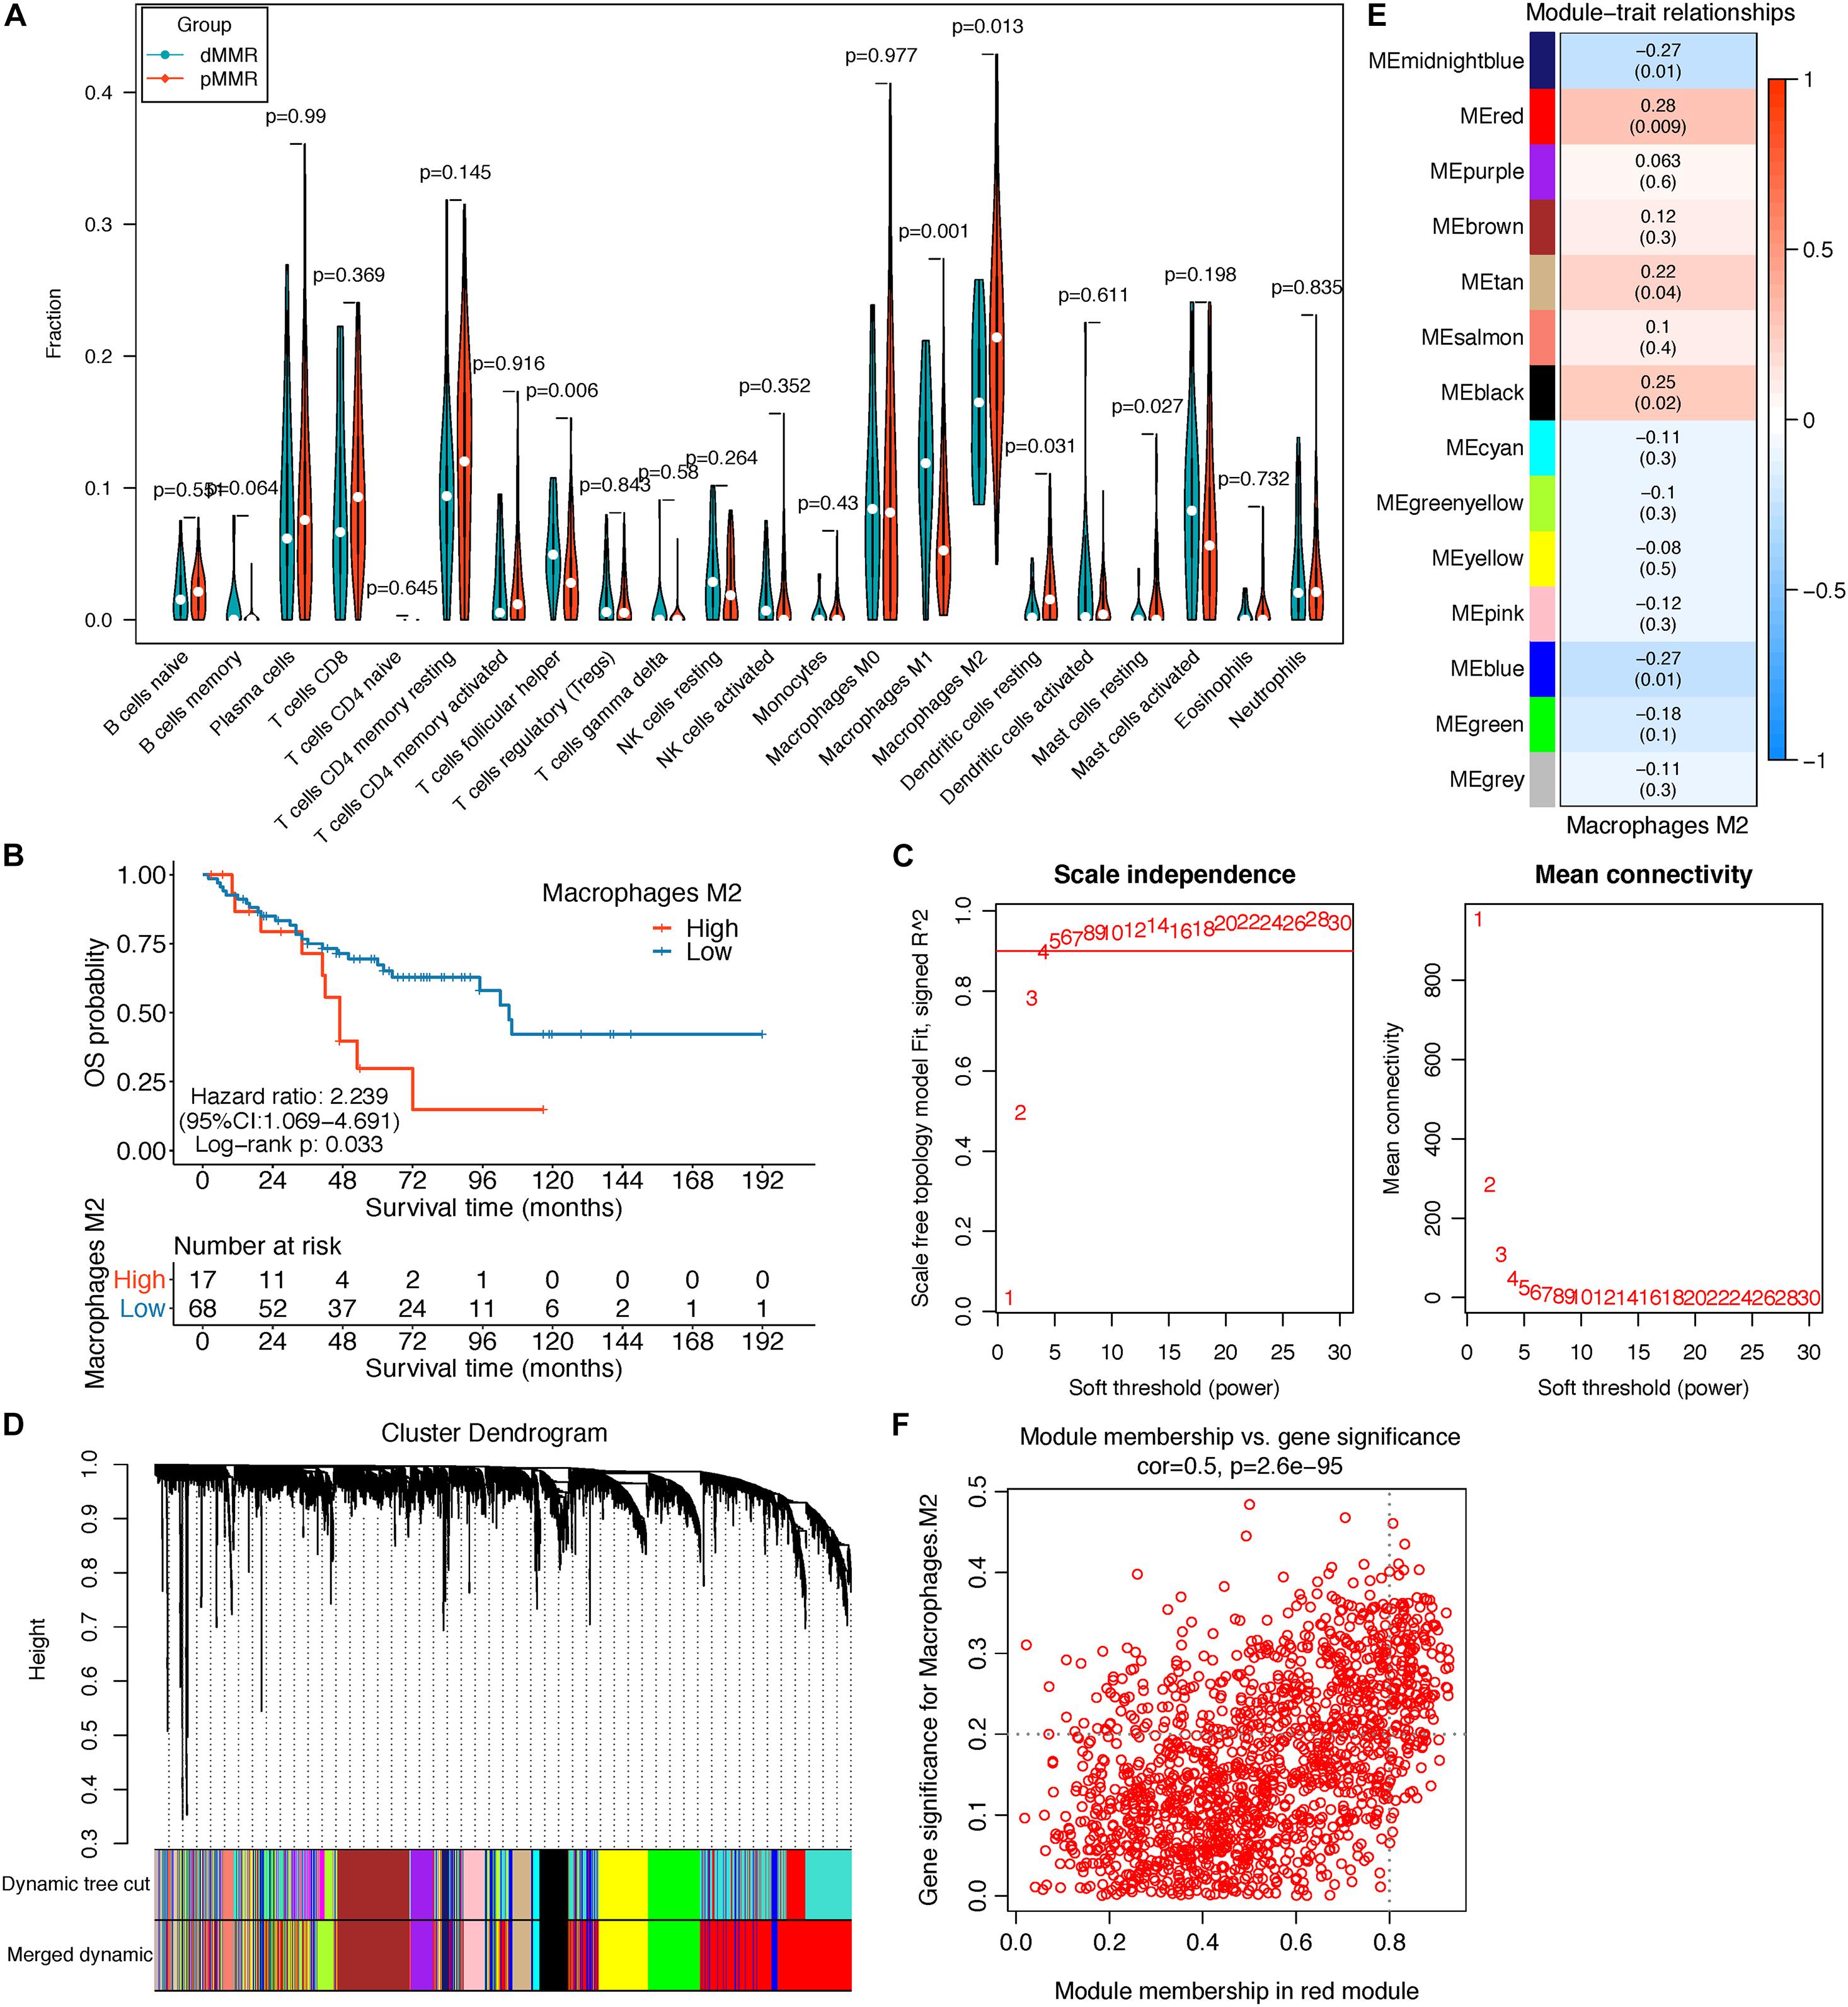
Figure 2. (A) Violin plot displayed the CIBERSORT TIIC fraction difference between pMMR (85) and dMMR (20) stage III/IV CRC samples; only samples with a CIBERSORT P-value < 0.05 were screened for this analysis. (B) Survival curve of the high- and low-M2 macrophage groups in stage III/IV pMMR CRC patients. (C–F) Co-expression network analysis by WGCNA. (C) Analysis of network topology for optimal soft-threshold power. (D) Dendrogram of genes clustered with dissimilarity based on topological overlap; each color below represented an expression module of highly interconnected groups of genes in the constructed gene co-expression network. Gray indicated that genes were not incorporated into any module. (E) Heatmap of the correlation between each module’s module eigengene and M2 macrophage fractions; each cell contains the Pearson’s correlation coefficient and the corresponding P-value. The red module was the most significant module with the strongest correlation. (F) Scatterplot of gene significance (GS) for M2 macrophage fractions vs. module membership (MM) in the red modules. TIICs, tumor-infiltrating immune cells; pMMR, mismatch-repair-proficient; dMMR, mismatch-repair-deficient; CRC, colorectal cancer; WGCNA, weighted gene co-expression network analysis.
Co-expression Network Construction and M2 Macrophage Related Gene Identification
The top 5,000 genes with the highest median absolute deviation (MAD) expression values were incorporated for co-expression network construction. To ensure a scale-free network, a soft thresholding power β of 6 was chosen to plant a hierarchical clustering tree (Figure 2C), and 13 gene modules were identified by average linkage clustering (Figure 2D). Then, we calculated the correlations between MEs and M2 macrophage infiltration levels and noticed that the red module exhibited the highest correlation (cor = 0.28, P = 0.009) (Figure 2E). Next, we found that the GS for M2 macrophage infiltrations was significantly and positively correlated with MM in the red module (cor = 0.5, P = 2.6e-95, Figure 2F). Therefore, the red module was chosen for subsequent analysis.
GO and KEGG Enrichment Analysis
Taking GS > 0.2 and MM > 0.8 as the hub gene thresholds, 144 genes in the red module were screened for GO and KEGG analyses. In the GO analysis, extracellular matrix organization (P = 2.60e-13) and extracellular structure organization (P = 2.82e-12) were the main enriched biological processes, collagen-containing extracellular matrix (P = 2.75e-18) was the major enriched cellular component, and extracellular matrix structural constituent (P = 1.01e-12) was the principal enriched molecular function term (Figure 3A). Focal adhesion (P = 0.0015), protein digestion and absorption (P = 0.0061), ECM–receptor interaction (P = 0.019), and tight junction (P = 0.0441) were the significantly enriched KEGG pathways (Figure 3B).
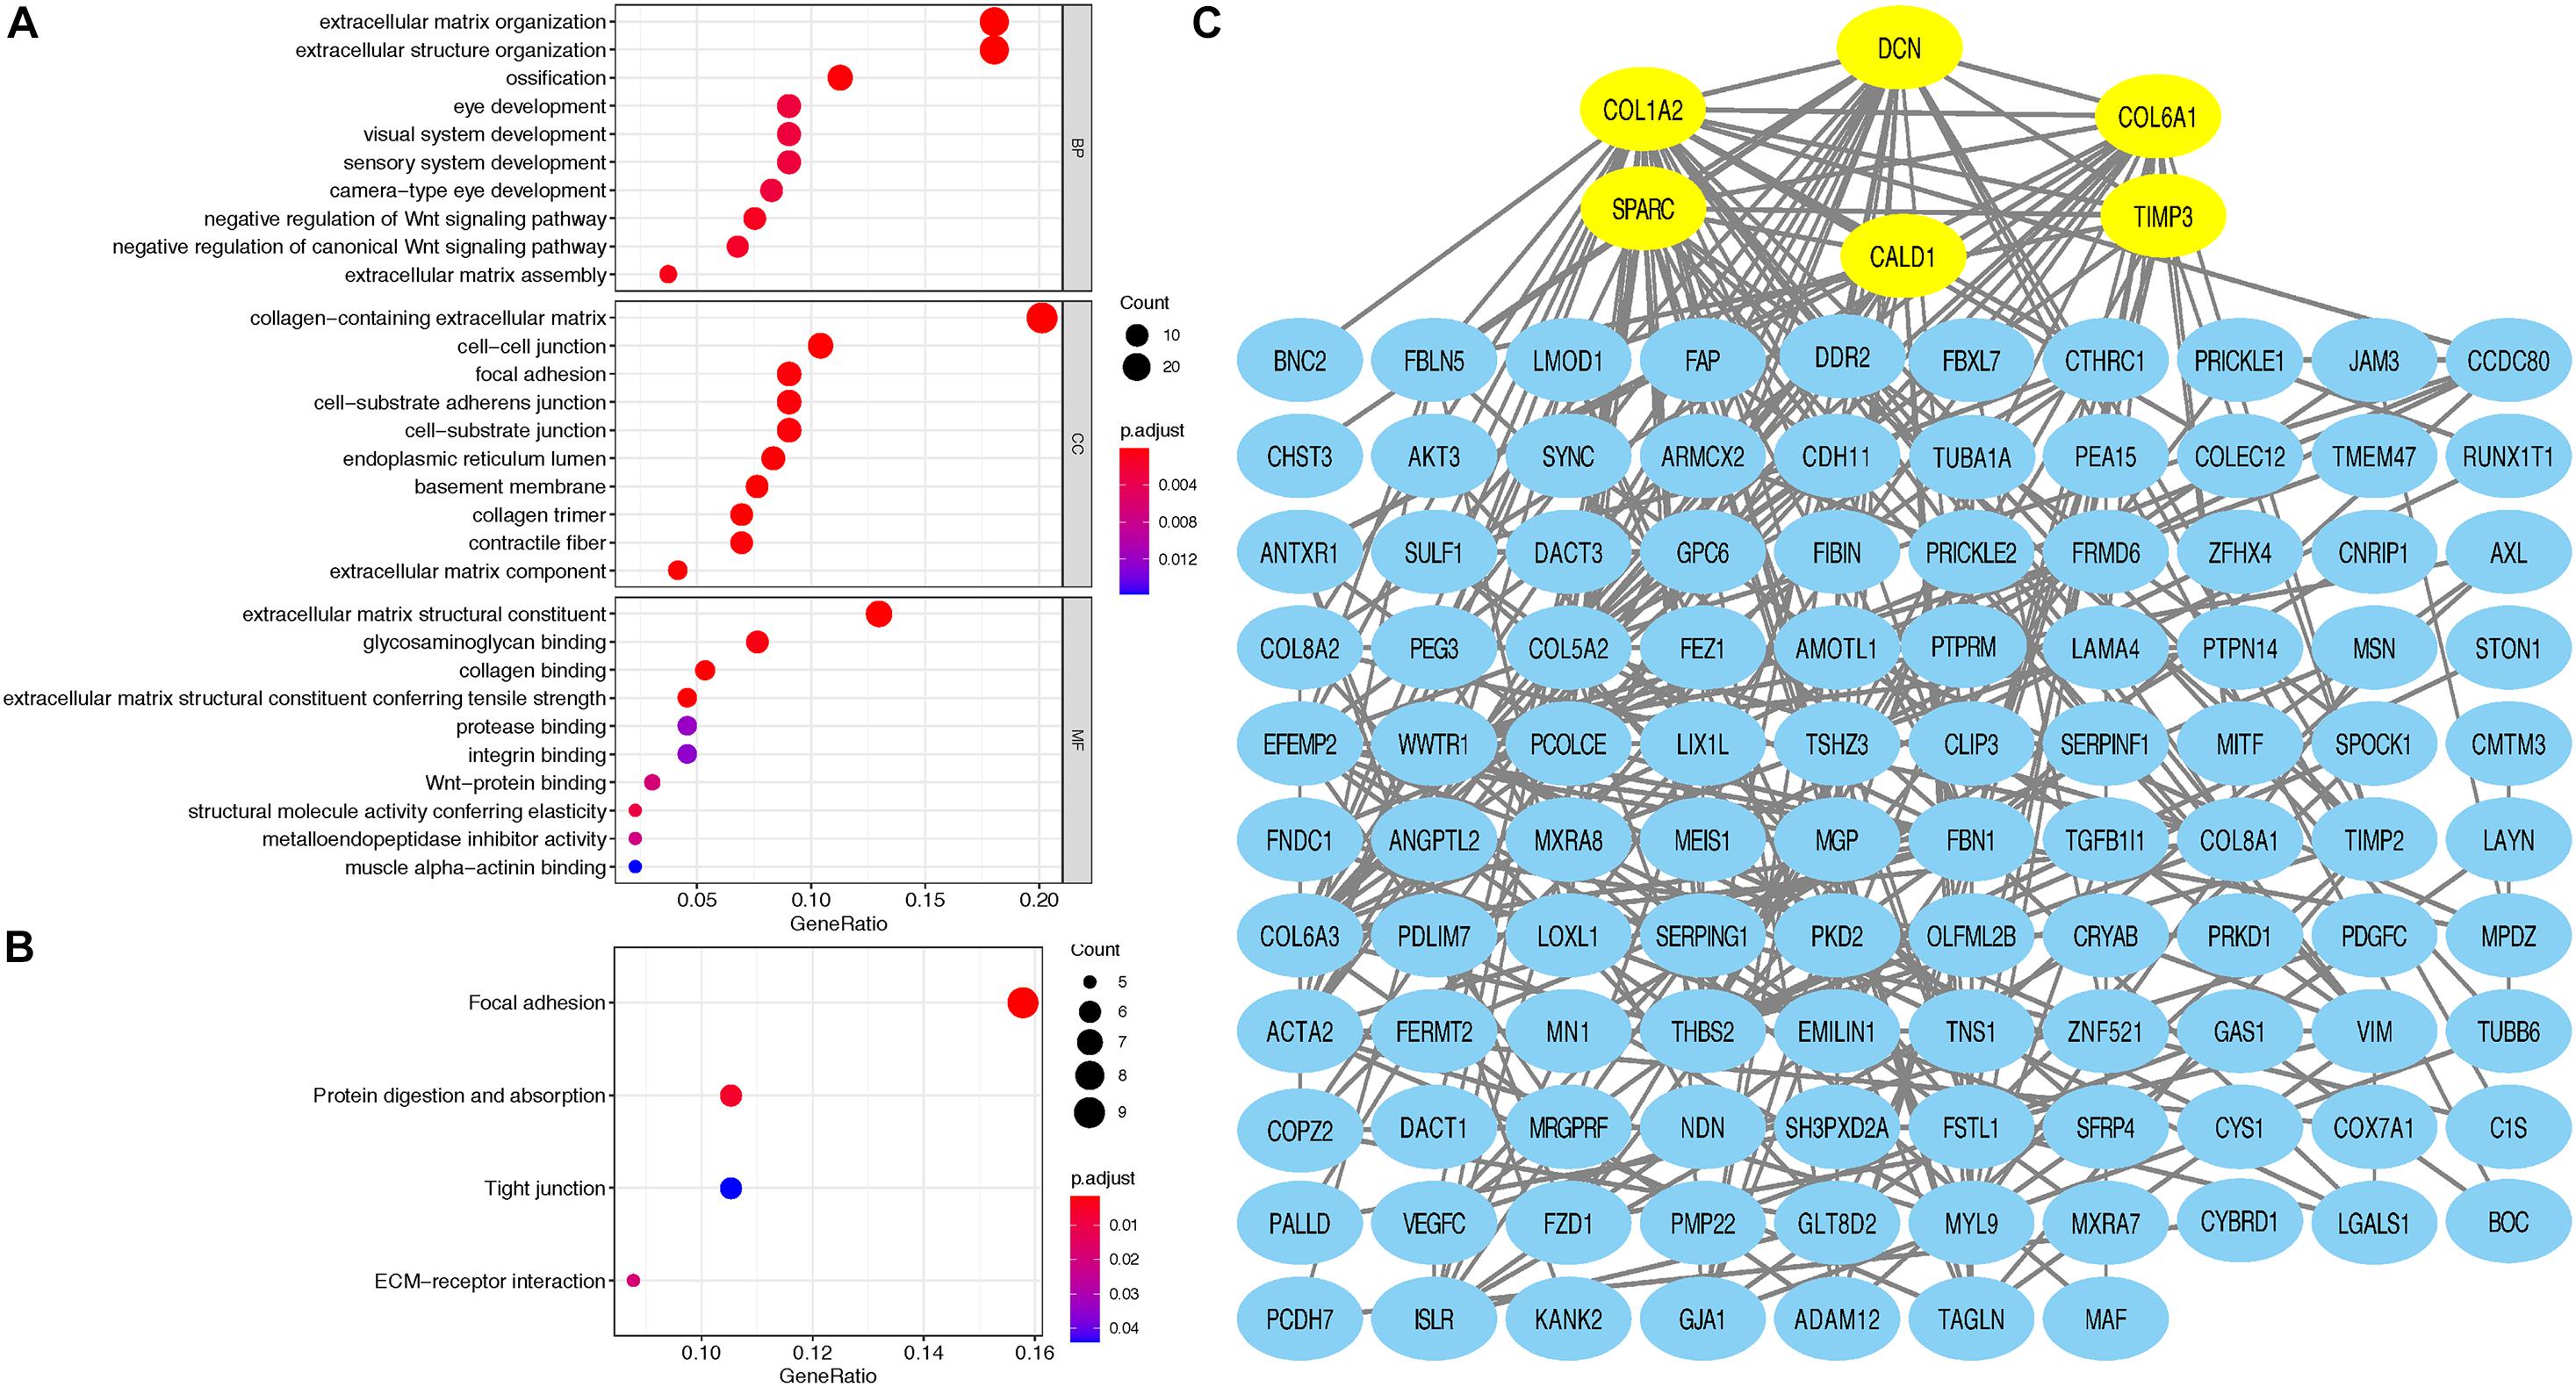
Figure 3. (A) Top 10 GO terms, including BP, CC, and MF, respectively, enriched according to the hub genes in the red module; (B) KEGG terms enriched according to the hub genes in the red module; (C) Cytoscape software was used to establish the PPI network of hub genes in the red module based on the STRING website; yellow signifies the hub nodes. GO, Gene Ontology; BP, biological process; CC, cellular component; MF, molecular function; KEGG, Kyoto Encyclopedia of Genes and Genomes; PPI, protein–protein interaction.
PPI Network Construction and Analysis
Based on the STRING database, a PPI network was built with the minimum interaction score (median confidence) of 0.4 and was then visualized in the Cytoscape software (Figure 3C). By overlapping the top 15 genes ranked by six methods in cytoHubba, six hub genes were identified for subsequent analysis (Table 1), and Spearman’s correlation analyses revealed that TIMP3 and CALD1 expressions were the top two markers positively associated with M2 macrophage fractions (cor = 0.35 and 0.33, respectively) (Figures 4A–F).
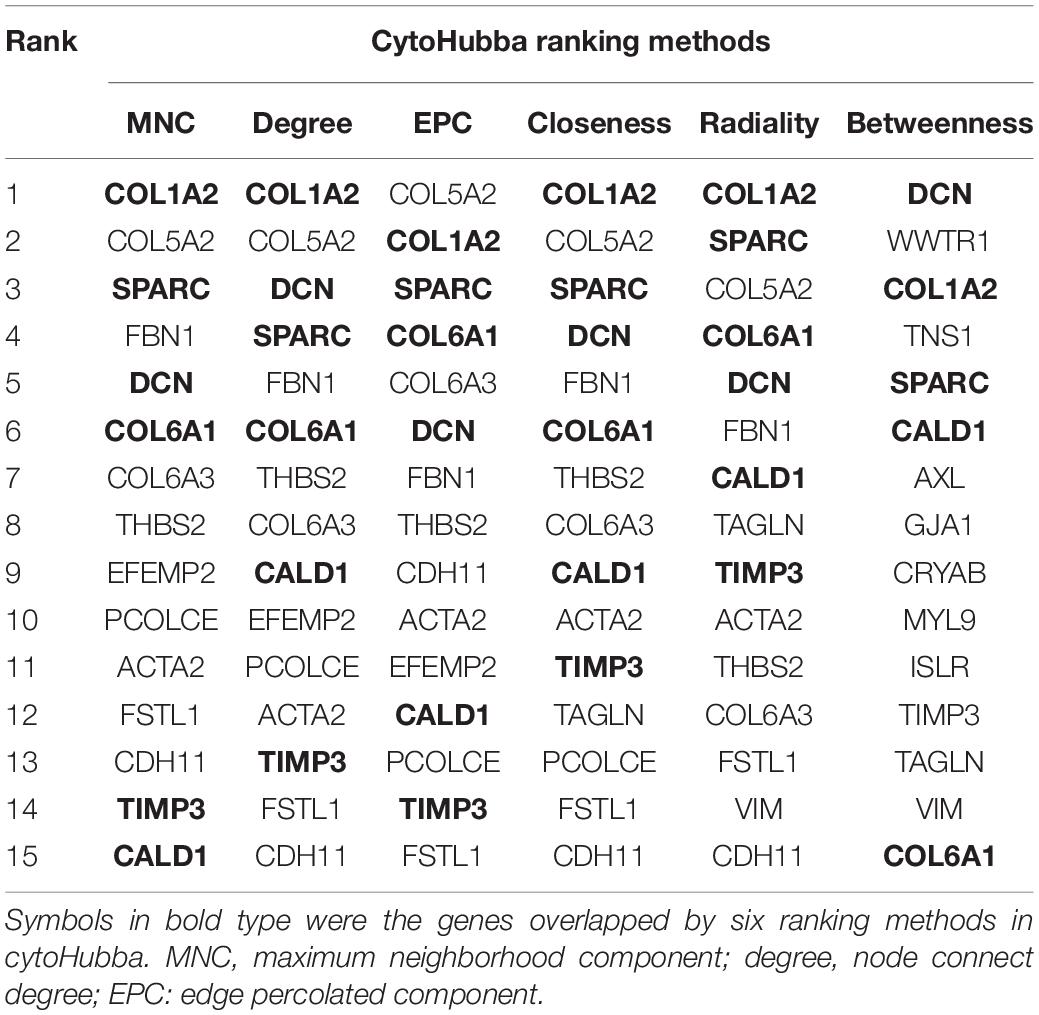
Table 1. Top 15 genes identified by cytoHubba.
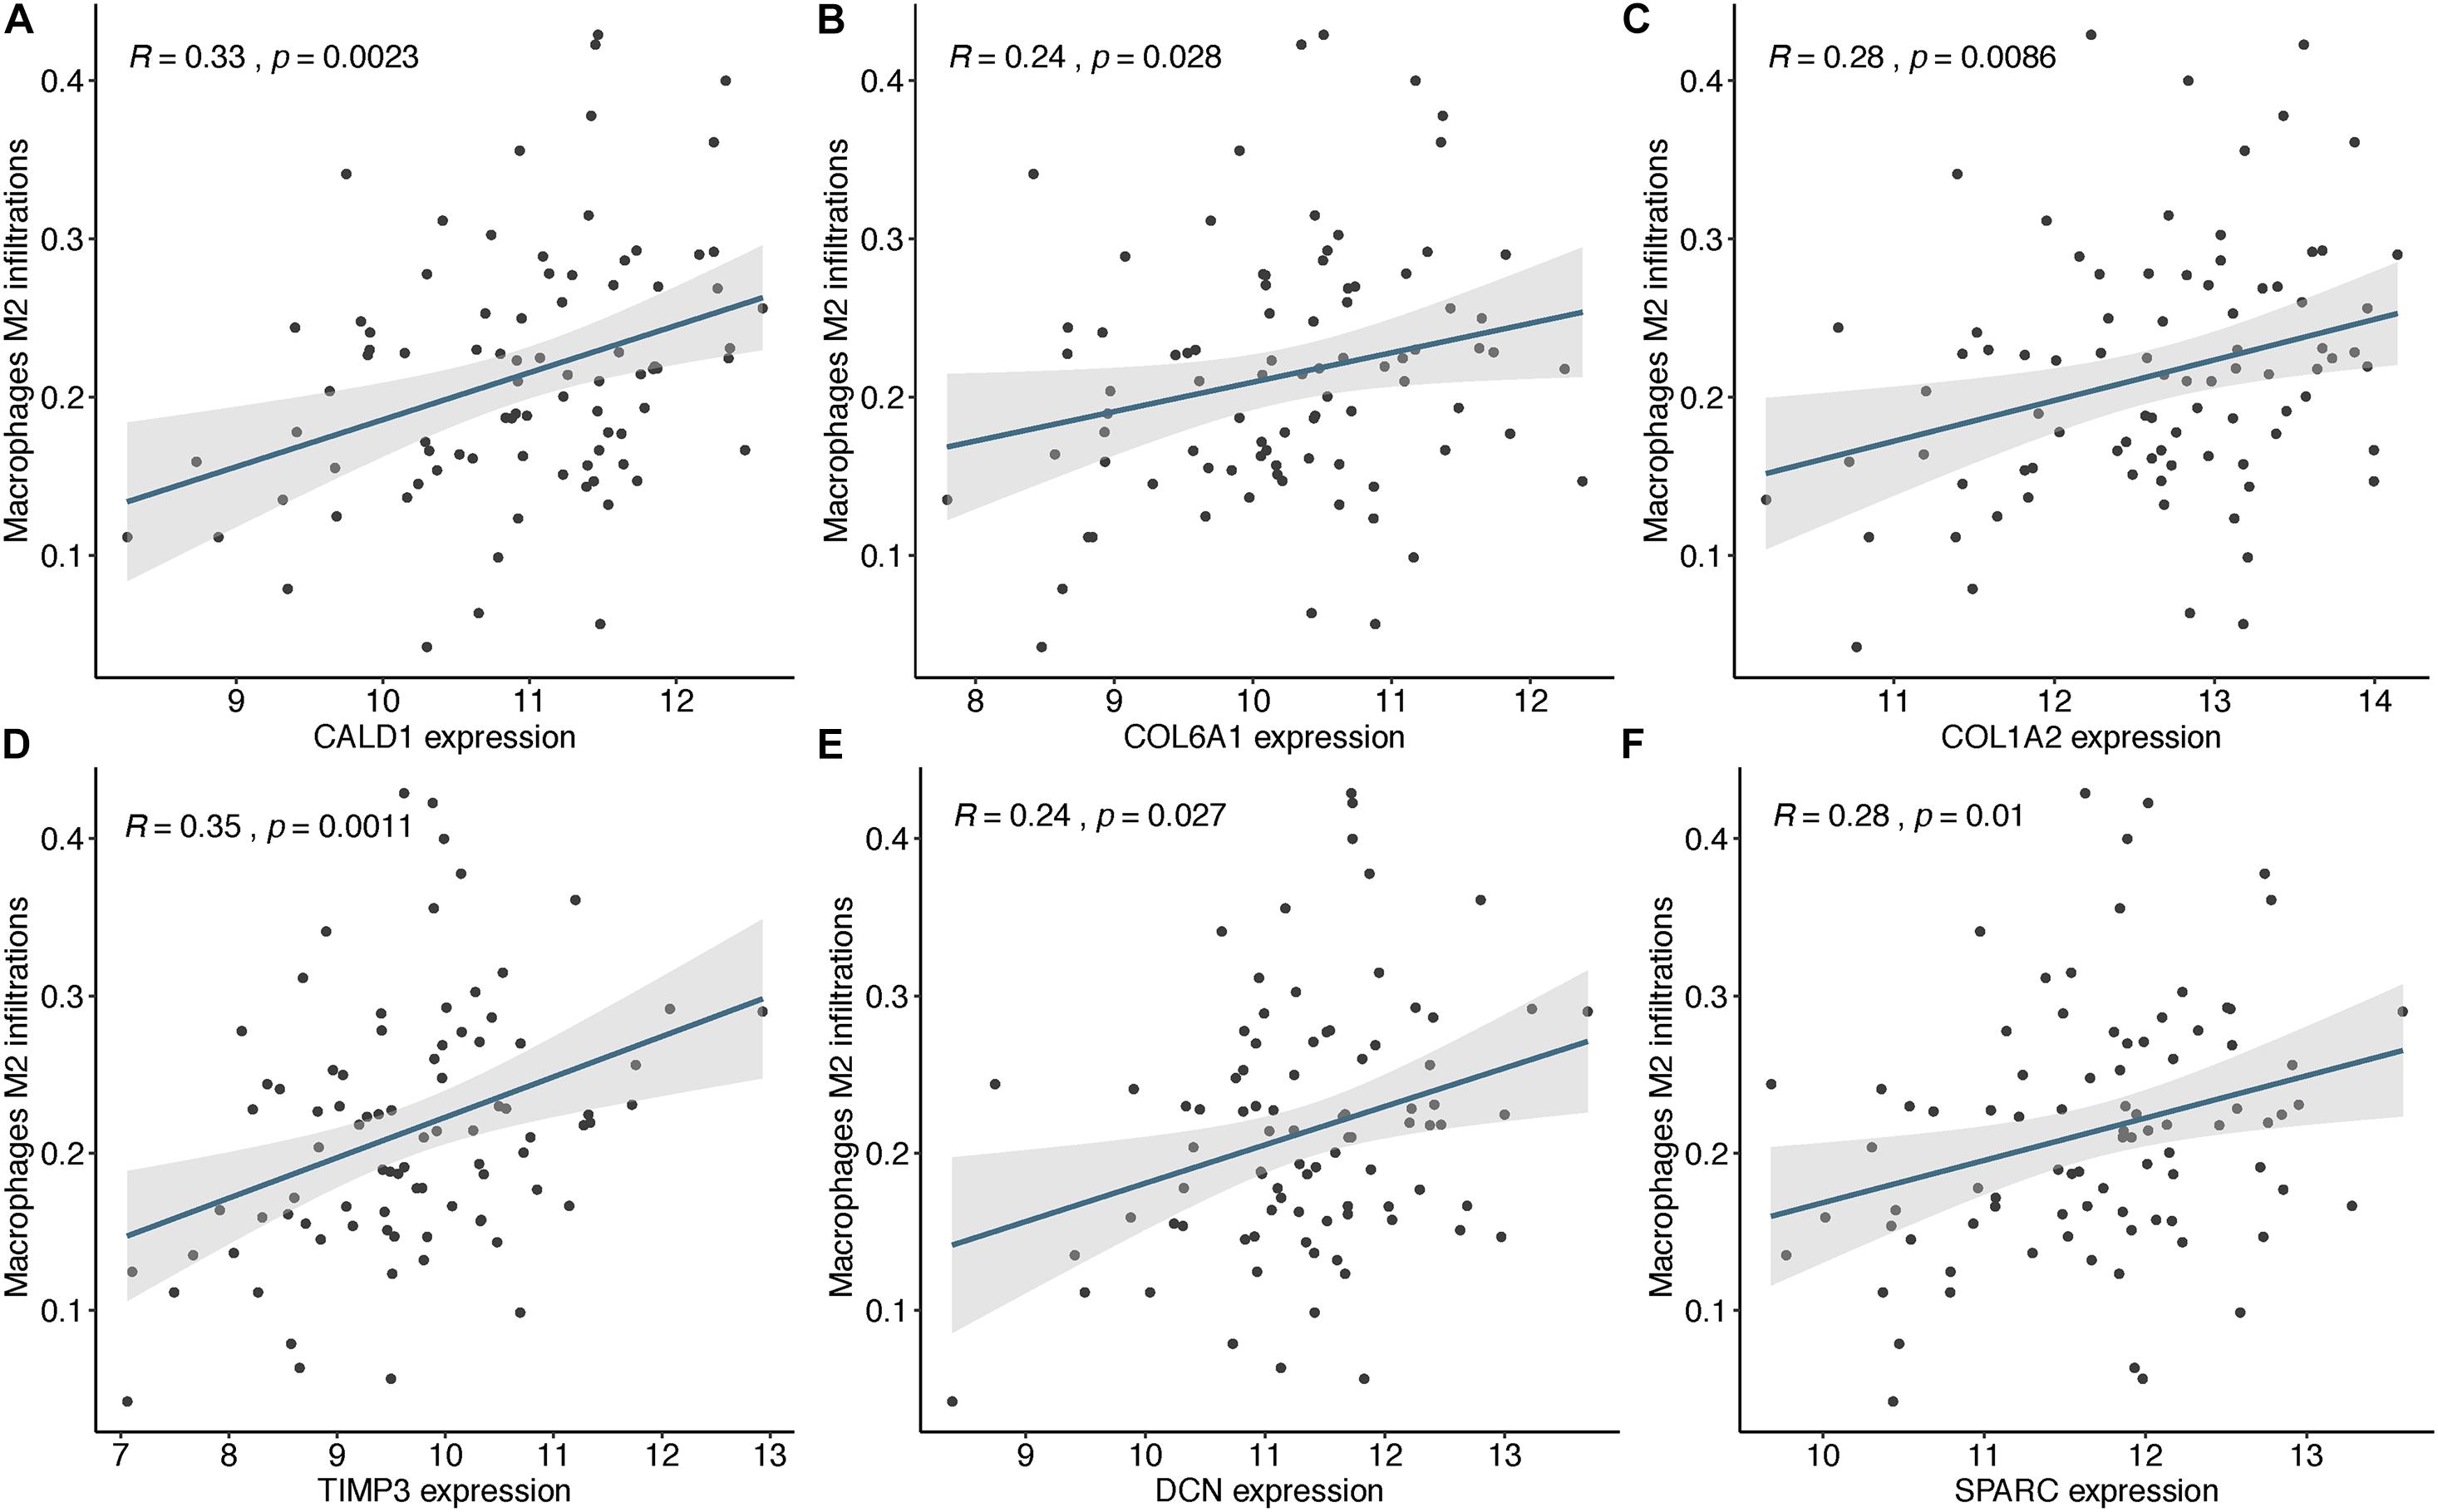
Figure 4. The expressions of CALD1 (A), COL6A1 (B), COL1A2 (C), TIMP3 (D), DCN (E), and SPARC (F) were significantly and positively correlated with M2 macrophage infiltrations.
Identification of CALD1 as an Independent Prognostic Biomarker in Stage III/IV pMMR CRC
Two hundred CRC patients in the GSE39582 cohort were categorized into high/low-expression groups according to the median expression values of each hub gene, then the correlations between the six hub gene expressions and OS were assessed by log-rank test; the results revealed that higher expressions of CALD1 and COL1A2 were associated with poorer OS (log-rank P = 0.012 and 0.044, respectively) (Figure 5). Subsequently, univariate and multivariate Cox regression analyses were implemented to evaluate the association between hub gene expressions as well as clinicopathological variables and prognosis. As shown in Table 2, age, chemotherapy, tumor stage, COL1A2, and CALD1 were significantly associated with worse prognosis (P < 0.05). In multivariate Cox analysis, CALD1 (HR = 1.868, 95% CI: 1.165–2.995, P = 0.009), chemotherapy (HR = 1.869, 95% CI: 1.124–3.109, P = 0.016), and tumor stage (HR = 2.658, 95% CI: 1.414–4.996, P = 0.002) remained to be significantly correlated with OS. Furthermore, similar analyses were performed in the GSE41258 validation dataset, and multivariate Cox analysis identified that both CALD1 (HR = 1.859, 95% CI: 1.095–3.158, P = 0.022) and tumor stage (HR = 4.951, 95% CI: 2.755–8.929, P < 0.001) were independent prognostic predictors (Supplementary Figure 1 and Supplementary Table 1).
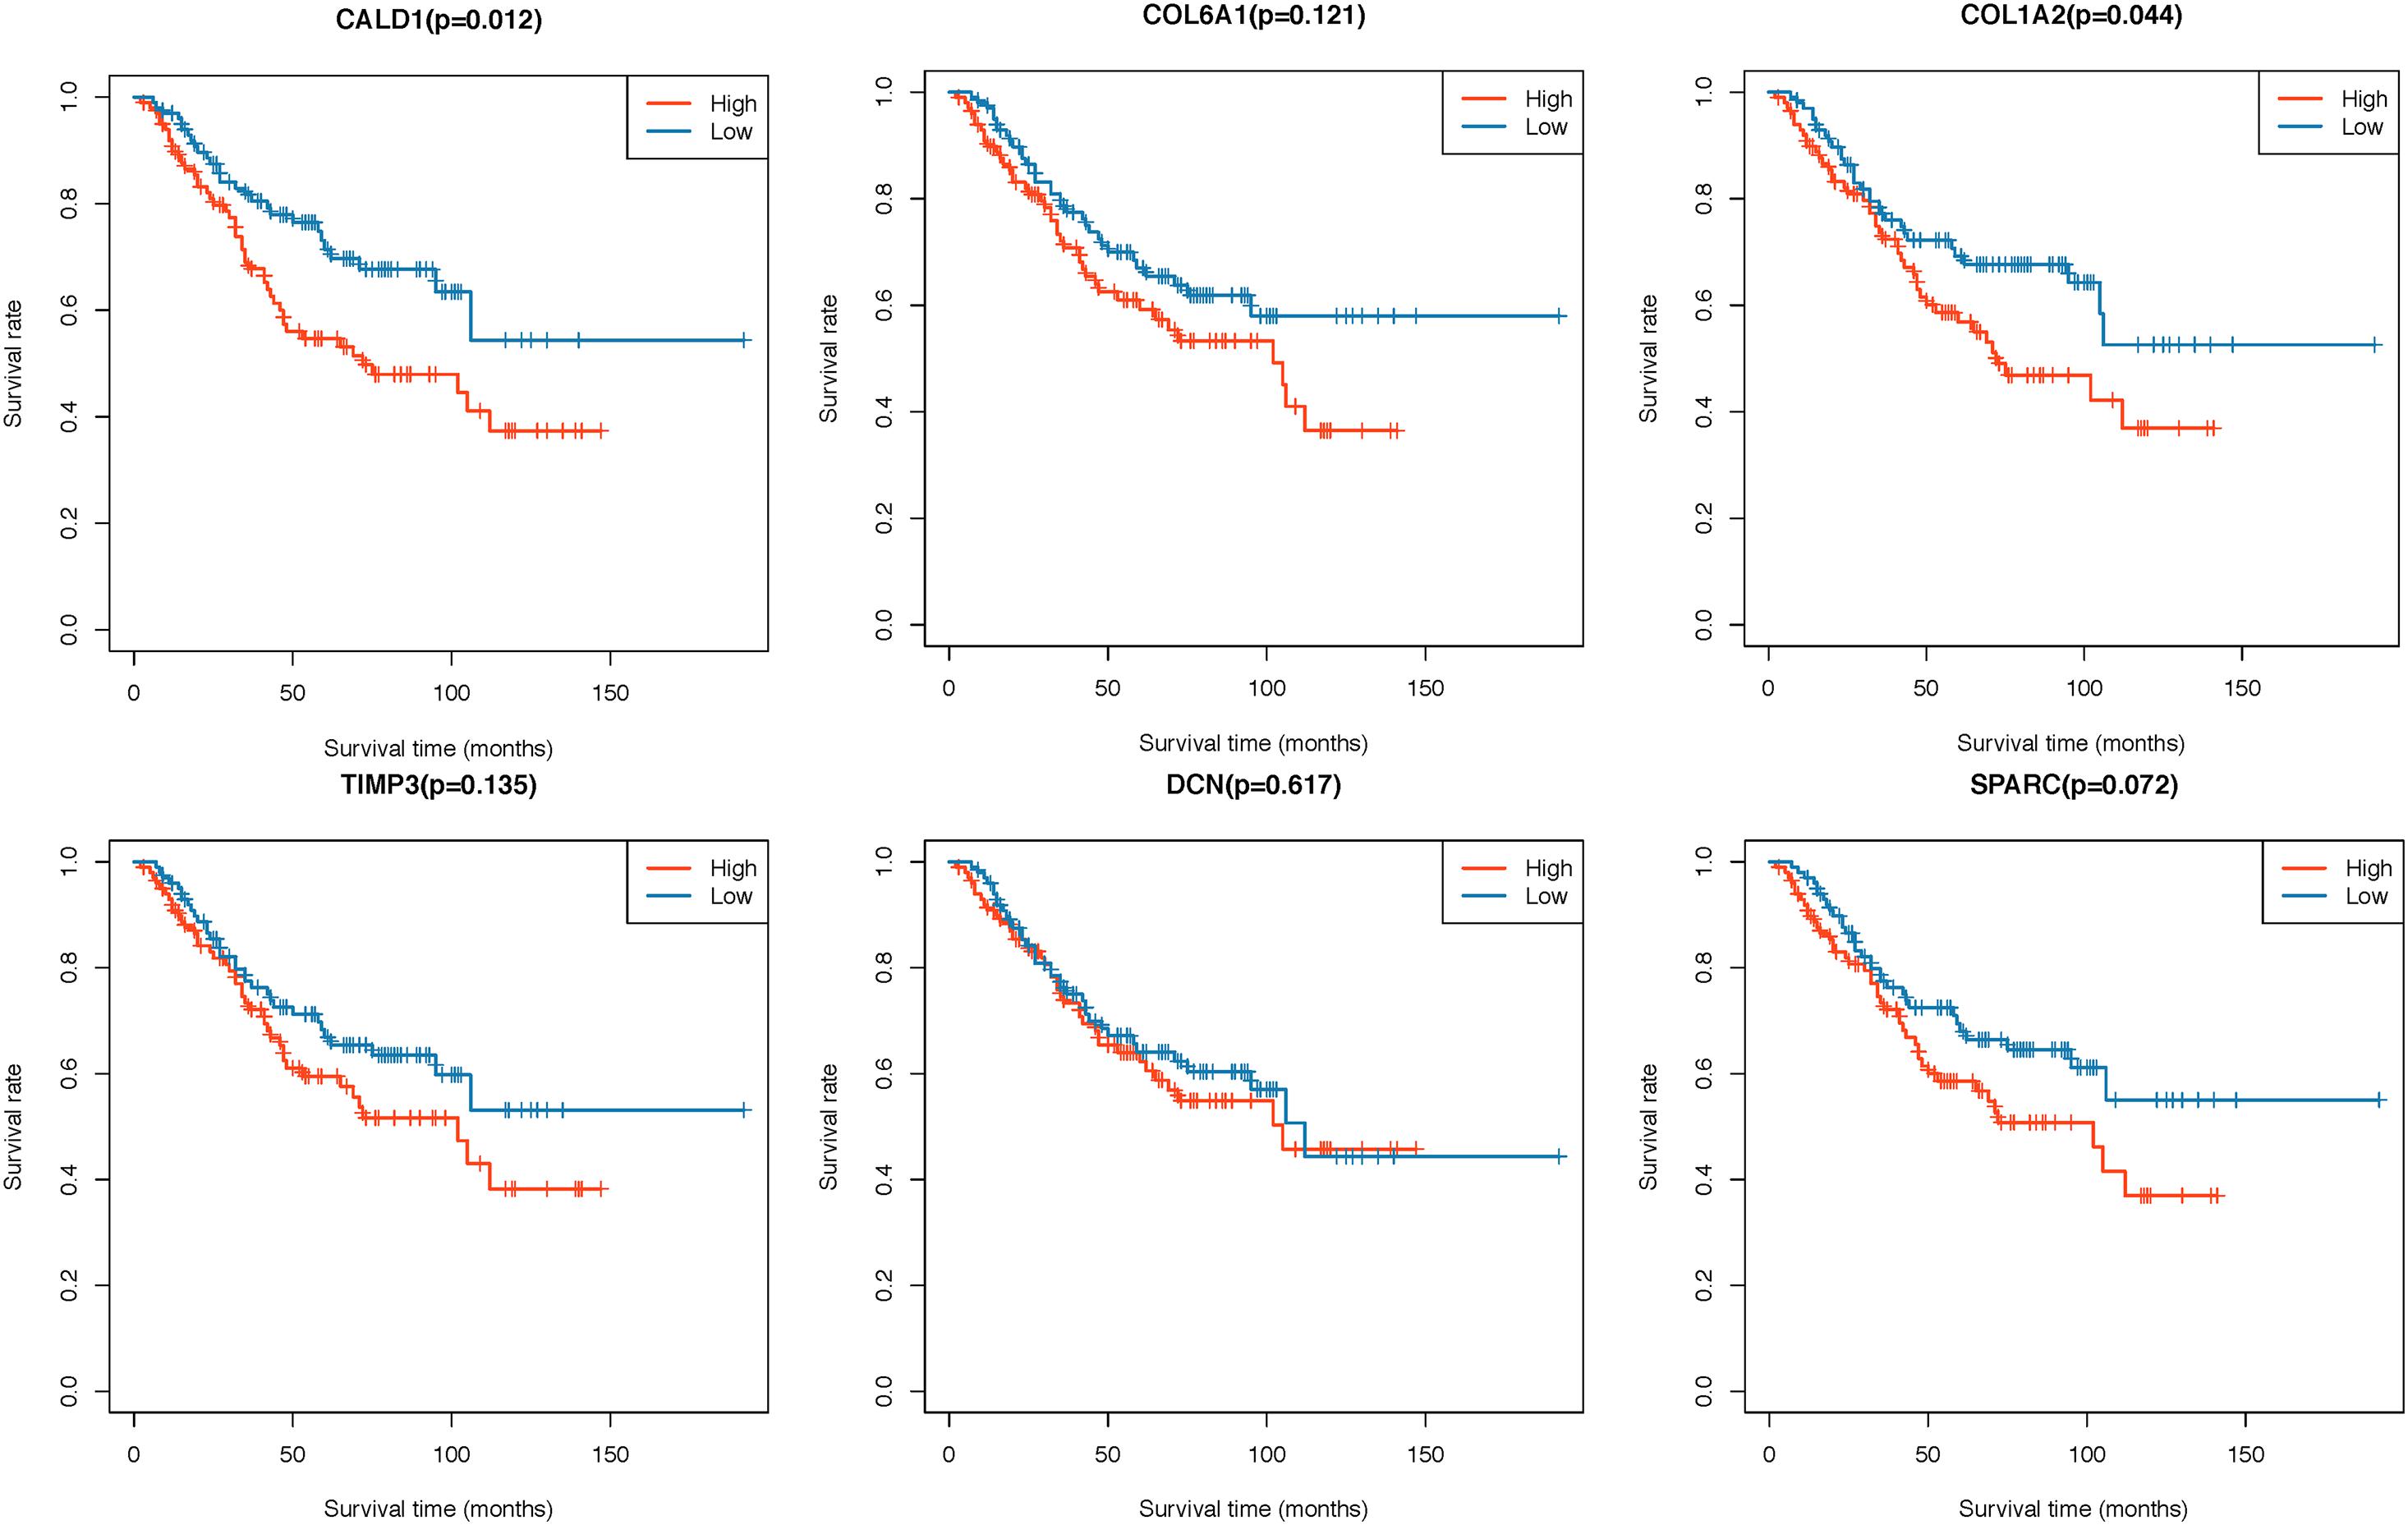
Figure 5. Kaplan–Meier survival curves of six hub genes grouped by their median expression values in the GSE39582 dataset.
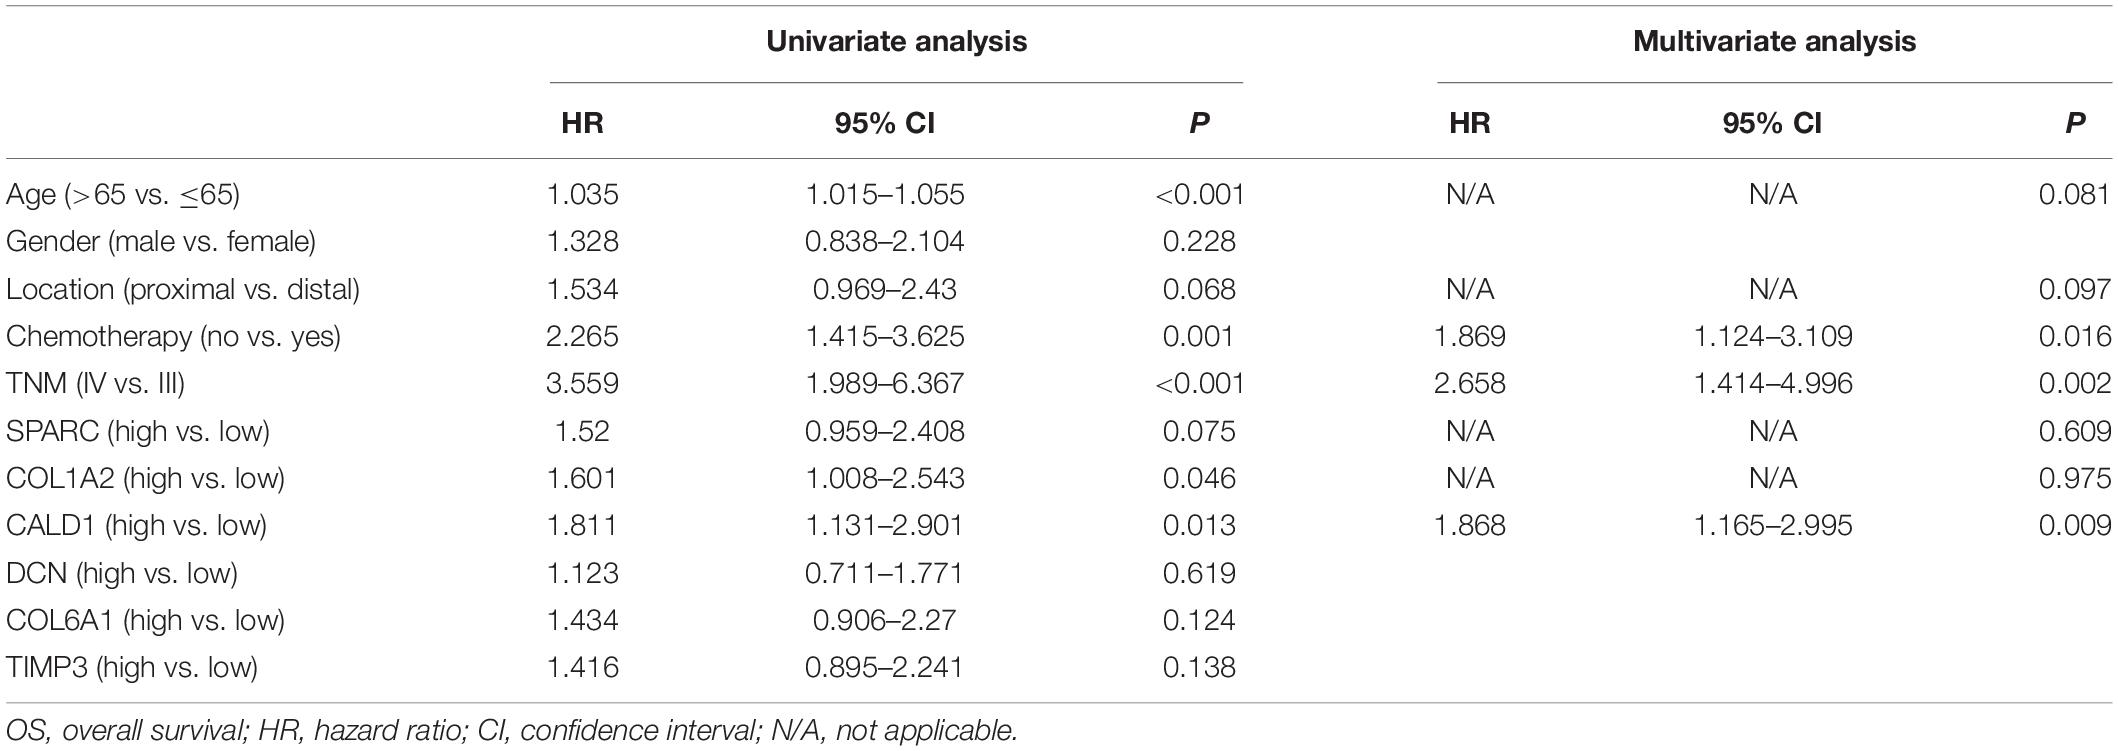
Table 2. Univariate and multivariate Cox proportional hazard regression analysis on OS in GSE39582.
CALD1 Was Correlated With Diverse Tumor Immune Cell Subtypes
After identifying the prognostic value of CALD1 in stage III/IV pMMR CRC patients, we examined the correlations between CALD1 and TIICs as well as the biomarkers of various immune cells. Figure 6A revealed that CALD1 was significantly and positively correlated with fractions of M2 macrophages (cor = 0.33, P = 0.001) and M0 macrophages (cor = 0.35, P = 0.010), whereas it was negatively correlated with fractions of plasma cells (cor = −0.2, P = 0.021), CD8 T cells (cor = −0.25, P = 0.003), T cell CD4 memory activated (cor = −0.27, P = 0.042), NK cells resting (cor = −0.2, P = 0.018), and dendritic cells activated (cor = −0.27, P = 0.028). As shown in Table 3, CALD1 expression was significantly correlated with the biomarkers of monocyte, TAM, M2 macrophages, neutrophils, Treg, and T cell exhaustion in both GSE39582 and GSE41258 datasets (P < 0.05).
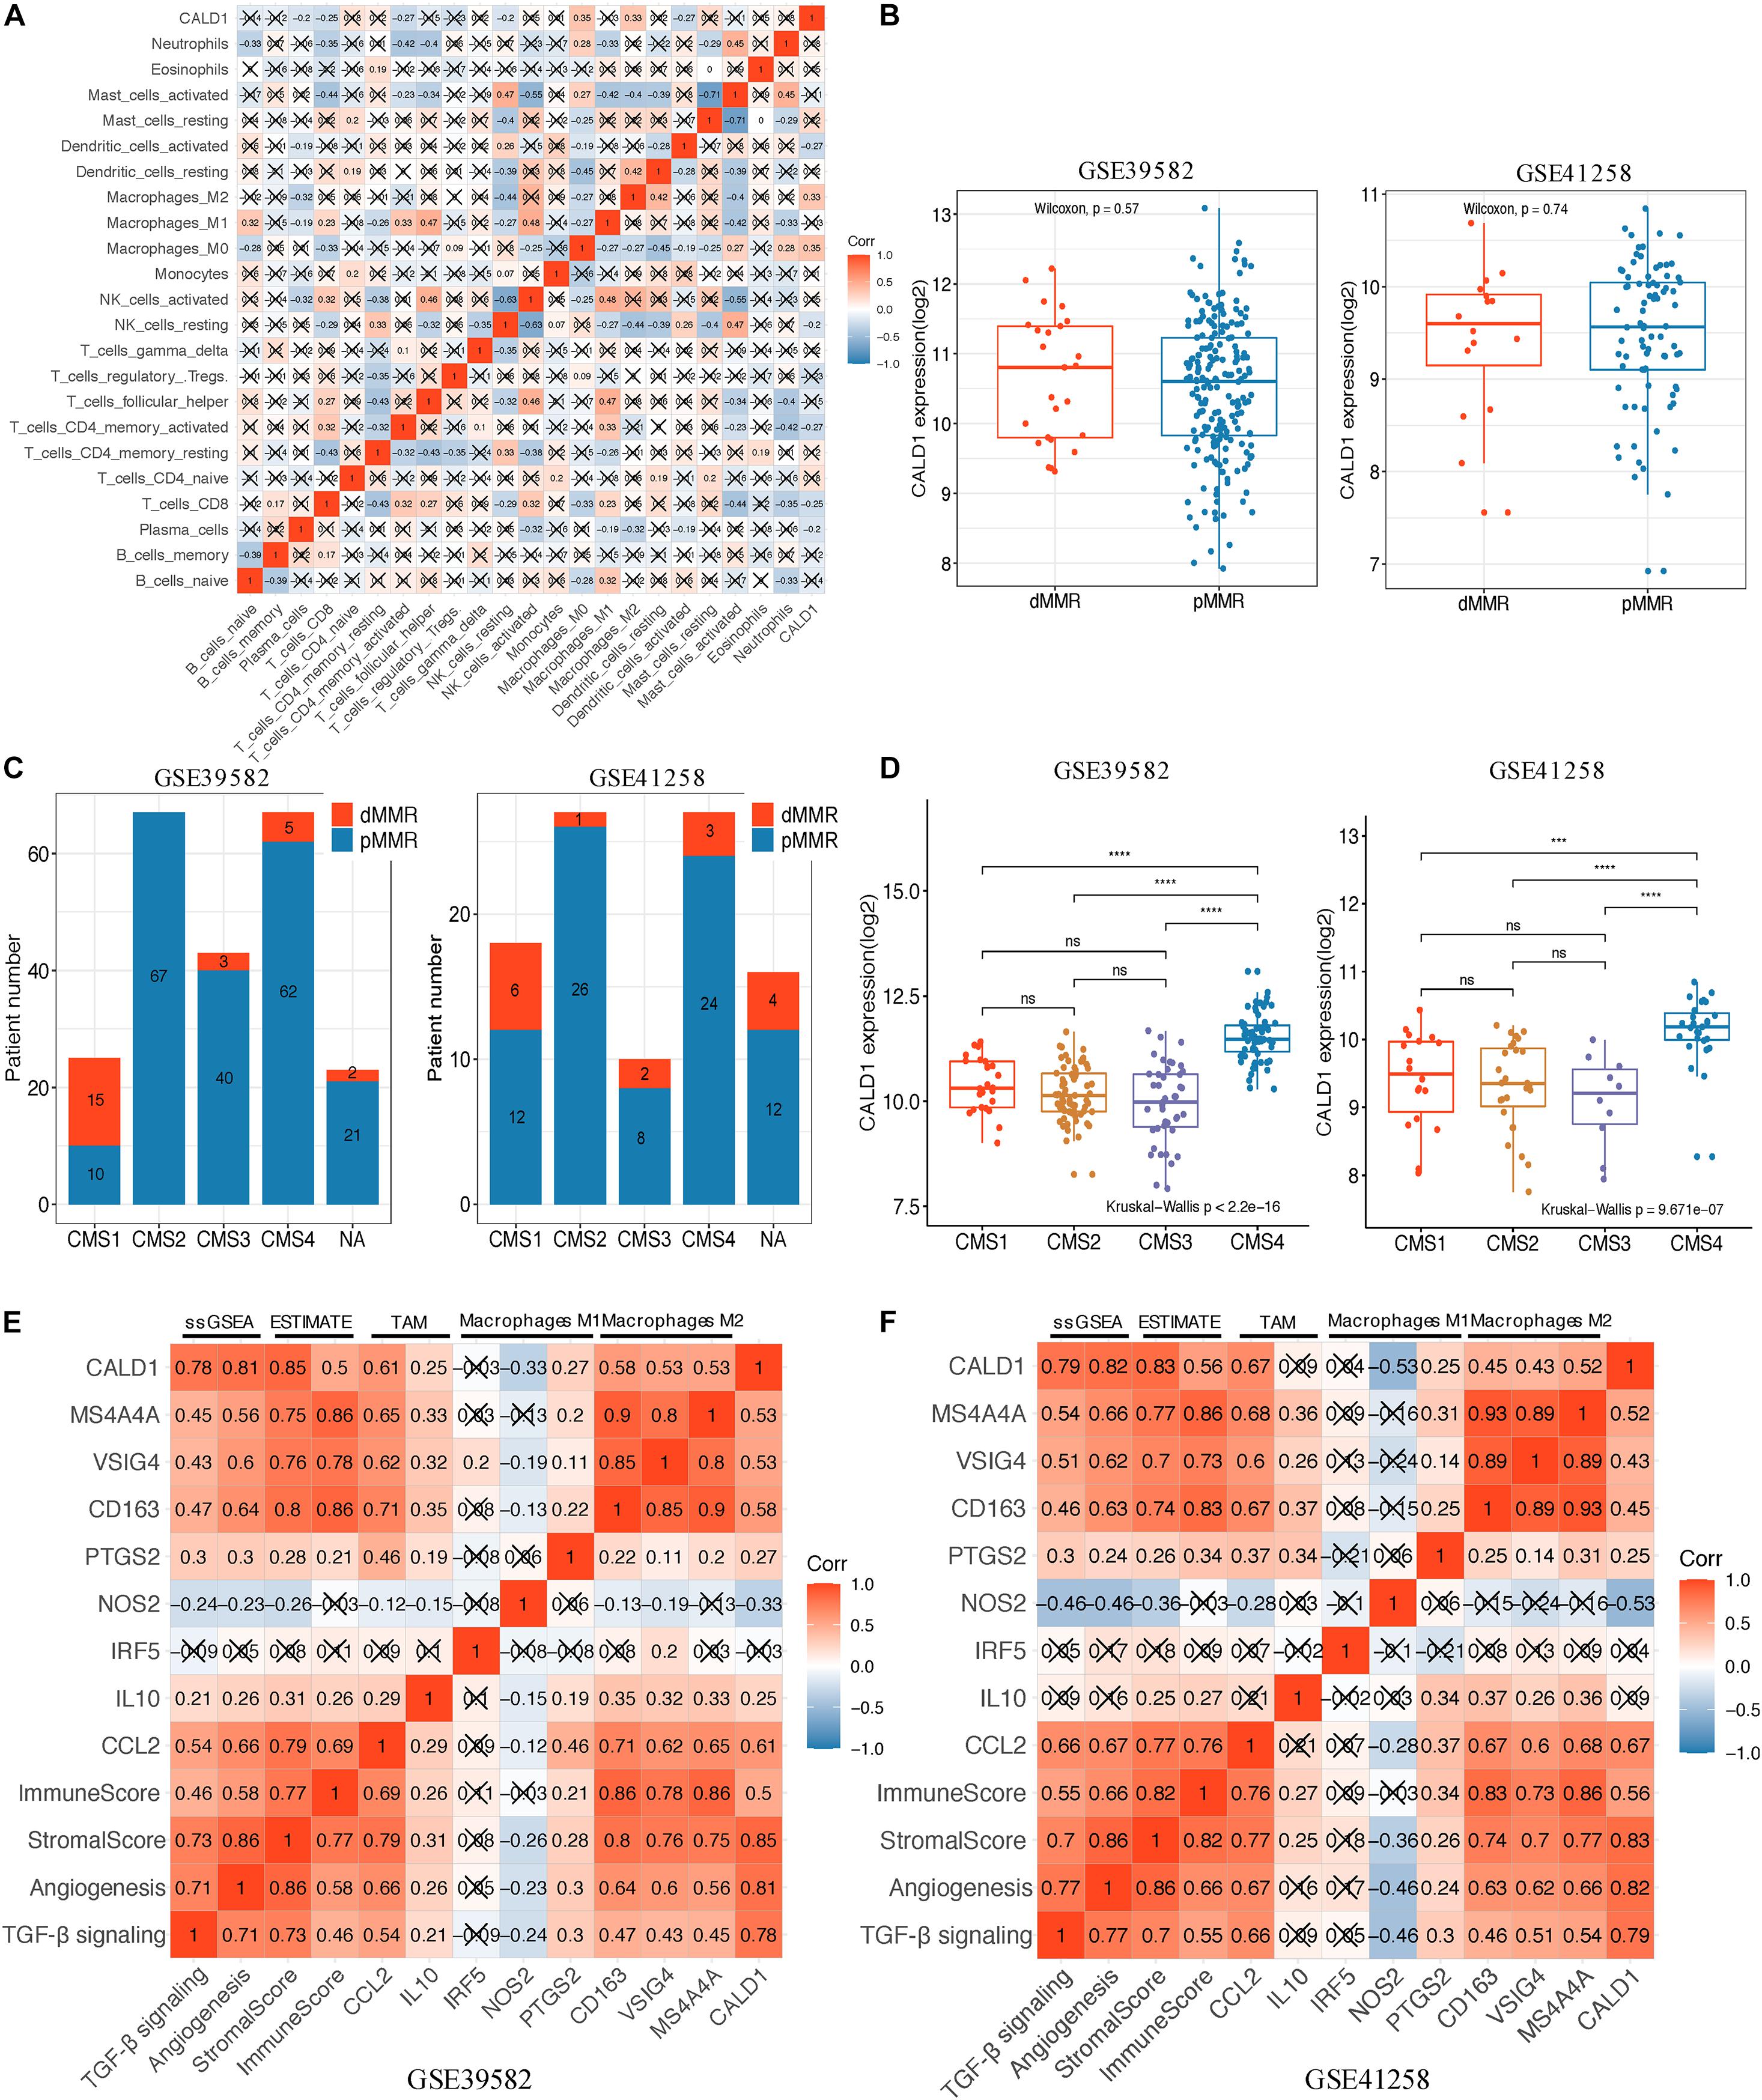
Figure 6. (A) Spearman correlation matrix of CALD1 expression with the 22 tumor-infiltrating immune cell proportions in 85 stage III/IV pMMR CRC samples of GSE39582. (B) Boxplots of CALD1 expression between dMMR and pMMR stage III/IV CRC samples in both GSE39582 (left) and GSE41258 (right) datasets. (C) Histograms of the distribution characteristics of stage III/IV dMMR and pMMR CRC patients in each CMS subgroup. NA, not assigned. (D) Boxplots exhibiting CALD1 expression was significantly and specifically upregulated in the CMS4 subtype in both GSE39582 (left) and GSE41258 (right) datasets. Significant differences between CMS subgroups were indicated as follows: ns, not significant; ***P < 0.001, ****P < 0.0001 (Kruskal–Wallis test followed by Dunn’s tests). (E,F) Correlation heatmap revealed that CALD1 expression was significantly and positively correlated with angiogenesis and TGF-β signaling ssGSEA enrichment scores, immune and stromal scores, gene markers of TAMs (CCL2 and IL10), and M2 macrophages (CD163, VSIG4, and MS4A4A) but was not clear with gene markers of macrophage M1 (IRF5, NOS2, and PTGS2) in the GSE39582 (E) and GSE41258 (F) datasets. pMMR, mismatch-repair-proficient; dMMR, mismatch-repair-deficient; CRC, colorectal cancer; CMS, consensus molecular subtypes; TAMs, tumor-associated macrophages.
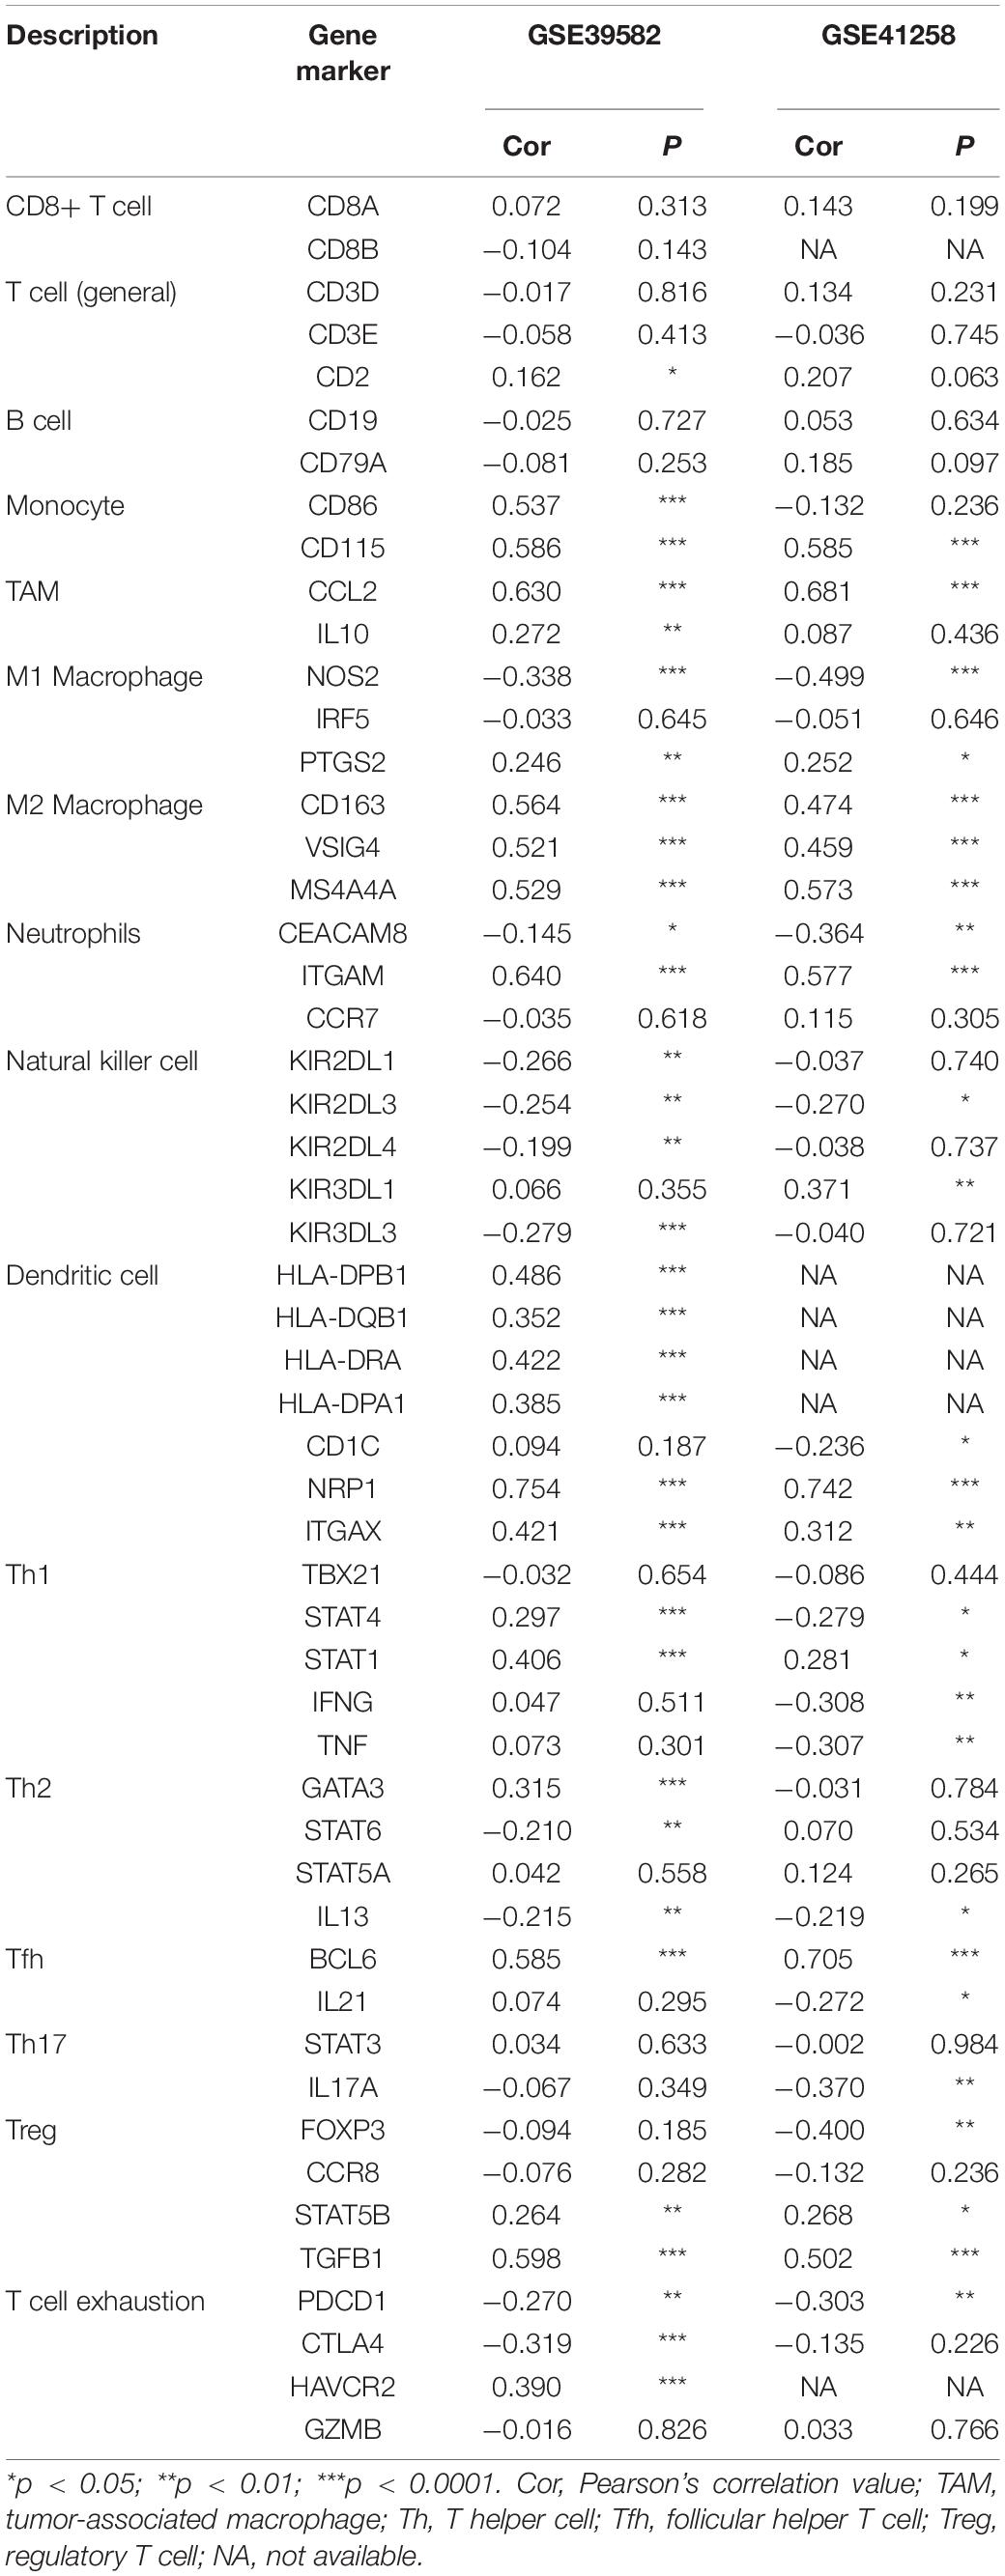
Table 3. Correlations between CALD1 and immune cells markers.
CALD1 Was Upregulated in CMS4 Subtype and Positively Correlated With Stromal and Immune Scores and Angiogenesis and TGF-β Signaling Enrichment Scores
We incorporated dMMR stage III/IV CRC patients and applied comparative analysis of CALD1 expression in different CRC subgroups. As shown in Figure 6B, the CALD1 expression between dMMR and pMMR CRC samples had no significant difference in the two datasets (Wilcoxon test, P = 0.57 and 0.74, respectively). Subsequently, we performed CMS analysis via the “CMSCaller” R package to divide CRCs of GSE39582 and GSE41258 into four biologically distinct classifications: CMS1 (dMMR-like immune), CMS2 (canonical), CMS3 (metabolic), and CMS4 (mesenchymal) (Guinney et al., 2015). The majority of dMMR samples were categorized as CMS1 (Figure 6C), and CALD1 expression was significantly and specifically upregulated in the CMS4 subtype, which is characterized by TGF-β signaling activation, angiogenesis, and stromal invasion (Guinney et al., 2015).
Those results implied the potential regulation mechanisms of CALD1 in CRC prognosis and TAM recruitments as well as polarizations, and as both intrinsic tumor features and extrinsic tumor microenvironment engage in tumor progression and macrophage polarization (Chen et al., 2019), we subsequently calculated the stromal and immune scores as well as the angiogenesis and TGF-β signaling gene sets enrichment scores of each stage III/IV pMMR CRC sample via the ESTIMATE and ssGSEA algorithms. Consistent with previous researches, higher stromal scores were associated with worse overall survival (GSE39582, log-rank P = 0.004; GSE41258, log-rank P = 0.138; Supplementary Figures 2A,C), while immune scores had non-significant impact on survival status (GSE39582, log-rank P = 0.108; GSE41258, log-rank P = 0.578; Supplementary Figures 2B,D) (Liu et al., 2020). The expression of CALD1 exhibited strong positive correlations with stromal and immune scores in both GSE39582 (cor = 0.85, P < 0.001 and cor = 0.5, P < 0.001, respectively) (Figure 6E) and GSE41258 (cor = 0.83, P < 0.001 and cor = 0.56, P < 0.001, respectively) (Figure 6F). The angiogenesis and TGF-β signaling ssGSEA enrichment scores exhibited consistently significant and strong positive correlations with CALD1 and macrophage marker expressions as well as stromal and immune scores in both GSE39582 and GSE41258 datasets (Figures 6E,F). The complicated interactions between CALD1, macrophage markers, as well as stromal and immune scores indicated that CALD1 might engage in the complex modulation of macrophage activations across TME alternations, possibly through promoting angiogenesis and activating TGF-β signaling pathways.
GSEA of CALD1 Related Signaling Pathways
Gene Set Enrichment Analysis identified several immune-related and oncogenic KEGG pathways that were enriched in the high-CALD1 expression group (Figures 7A,B), including antigen processing and presentation, chemokine signaling, cytokine–cytokine receptor interaction, leukocyte transendothelial migration, vascular smooth muscle contraction, cell adhesion molecules, focal adhesion, MAPK signaling pathway, pathways in cancer, and TGF-beta signaling pathway.
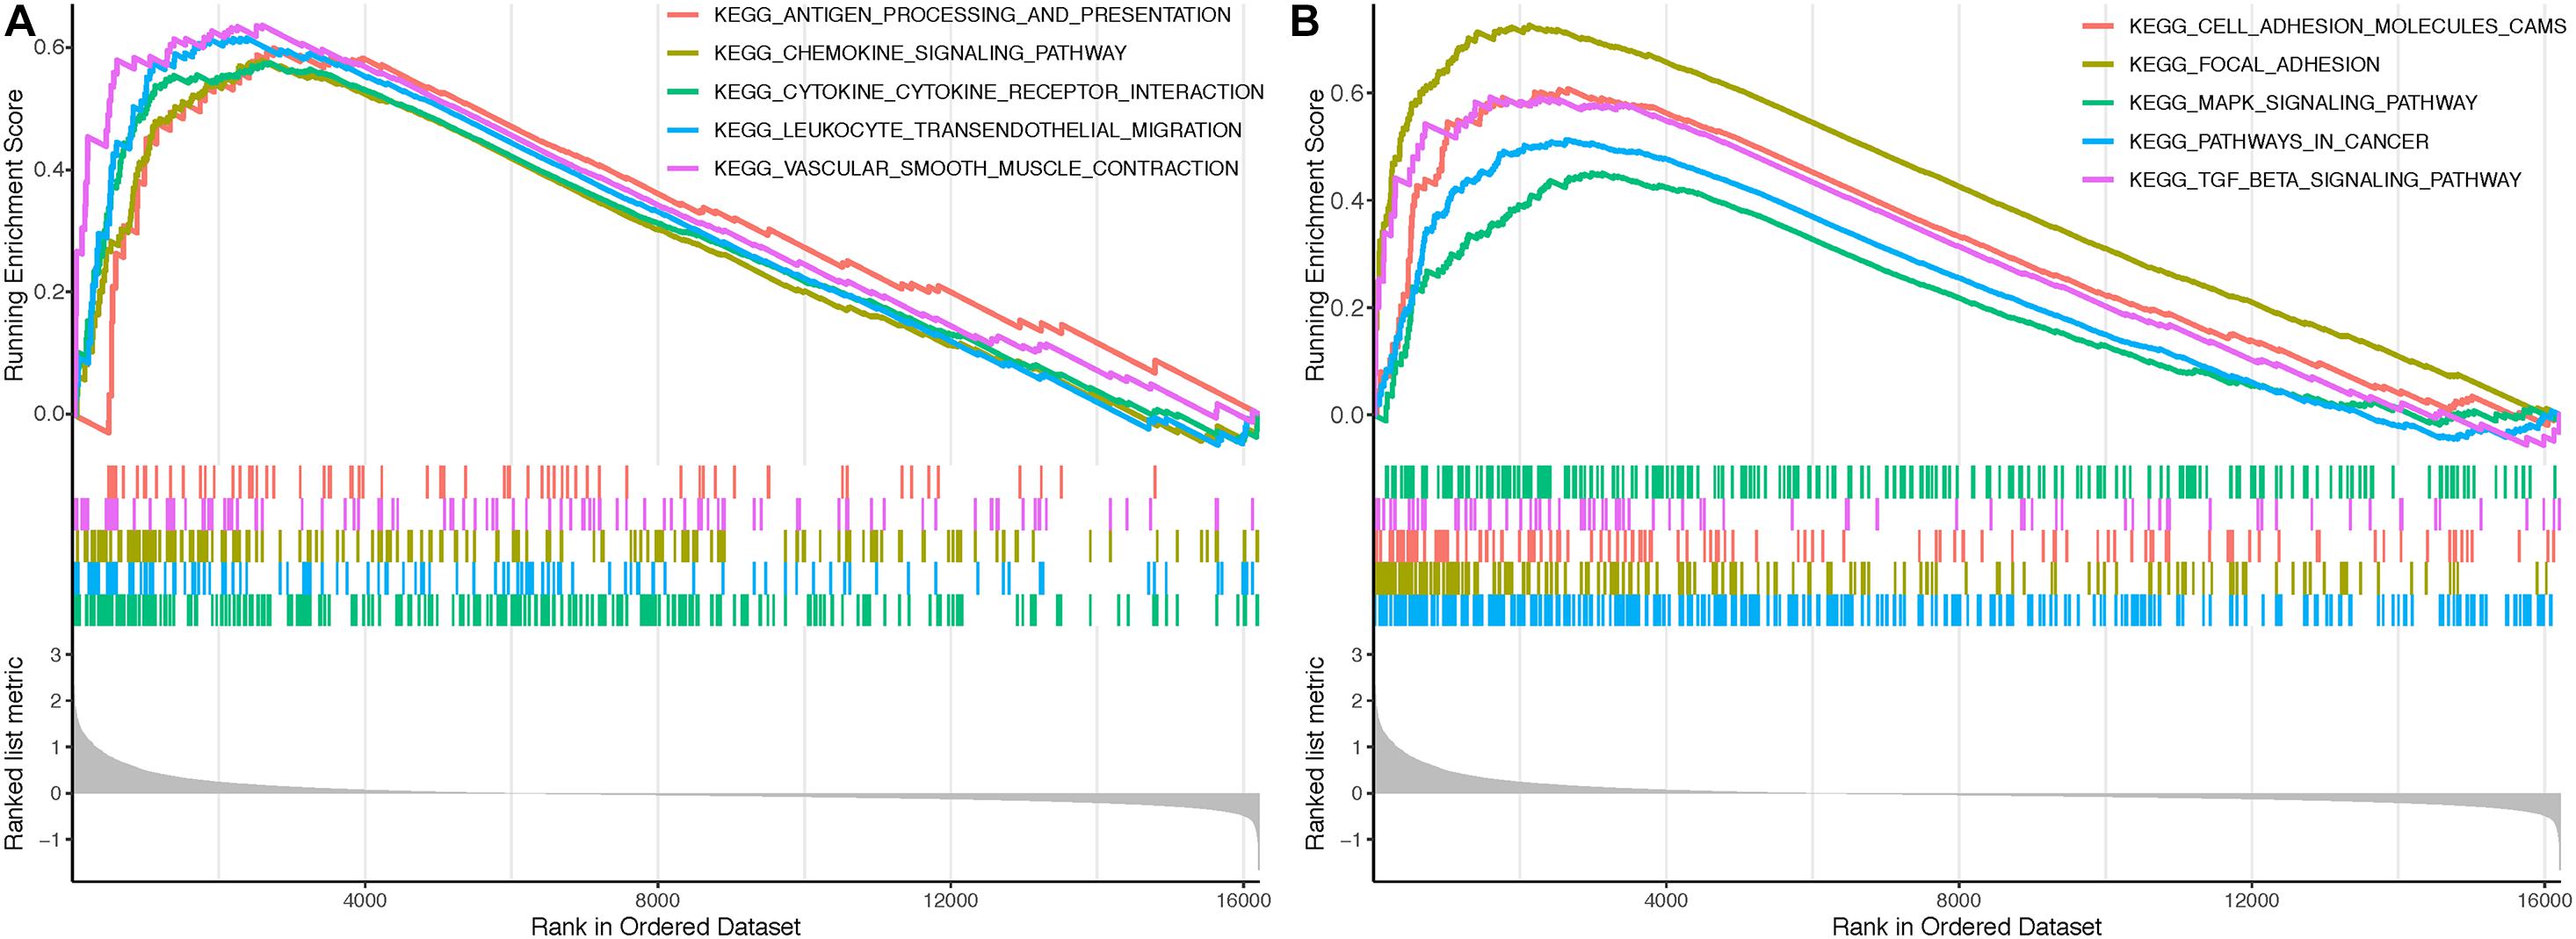
Figure 7. Gene Sets Enrichment Analysis (GSEA) revealed that several immune-related (A) and tumor-related (B) pathways were highly enriched in the high CALD1 expression group.
Downregulation of CALD1 Weakened the Proliferation, Migration, and Invasion in CRC Cells
To gain a better insight into the value of CALD1 as a prognostic marker, si-CALD1 transfection was performed to transiently decrease CALD1 expression in high-CALD1 expressed SW620 and SW480 cells (Figure 8A), and its efficiency was verified by Western blotting (Figures 8B,C). CCK8 assay revealed that the viability of CRC cells was markedly restrained when CALD1 was downregulated (Figures 8E,G). Furthermore, silencing CALD1 conspicuously inhibited the invasion and migration capacities in CRC cells (Figures 8D,F). These findings suggested that CALD1 could facilitate tumor progression of CRC.
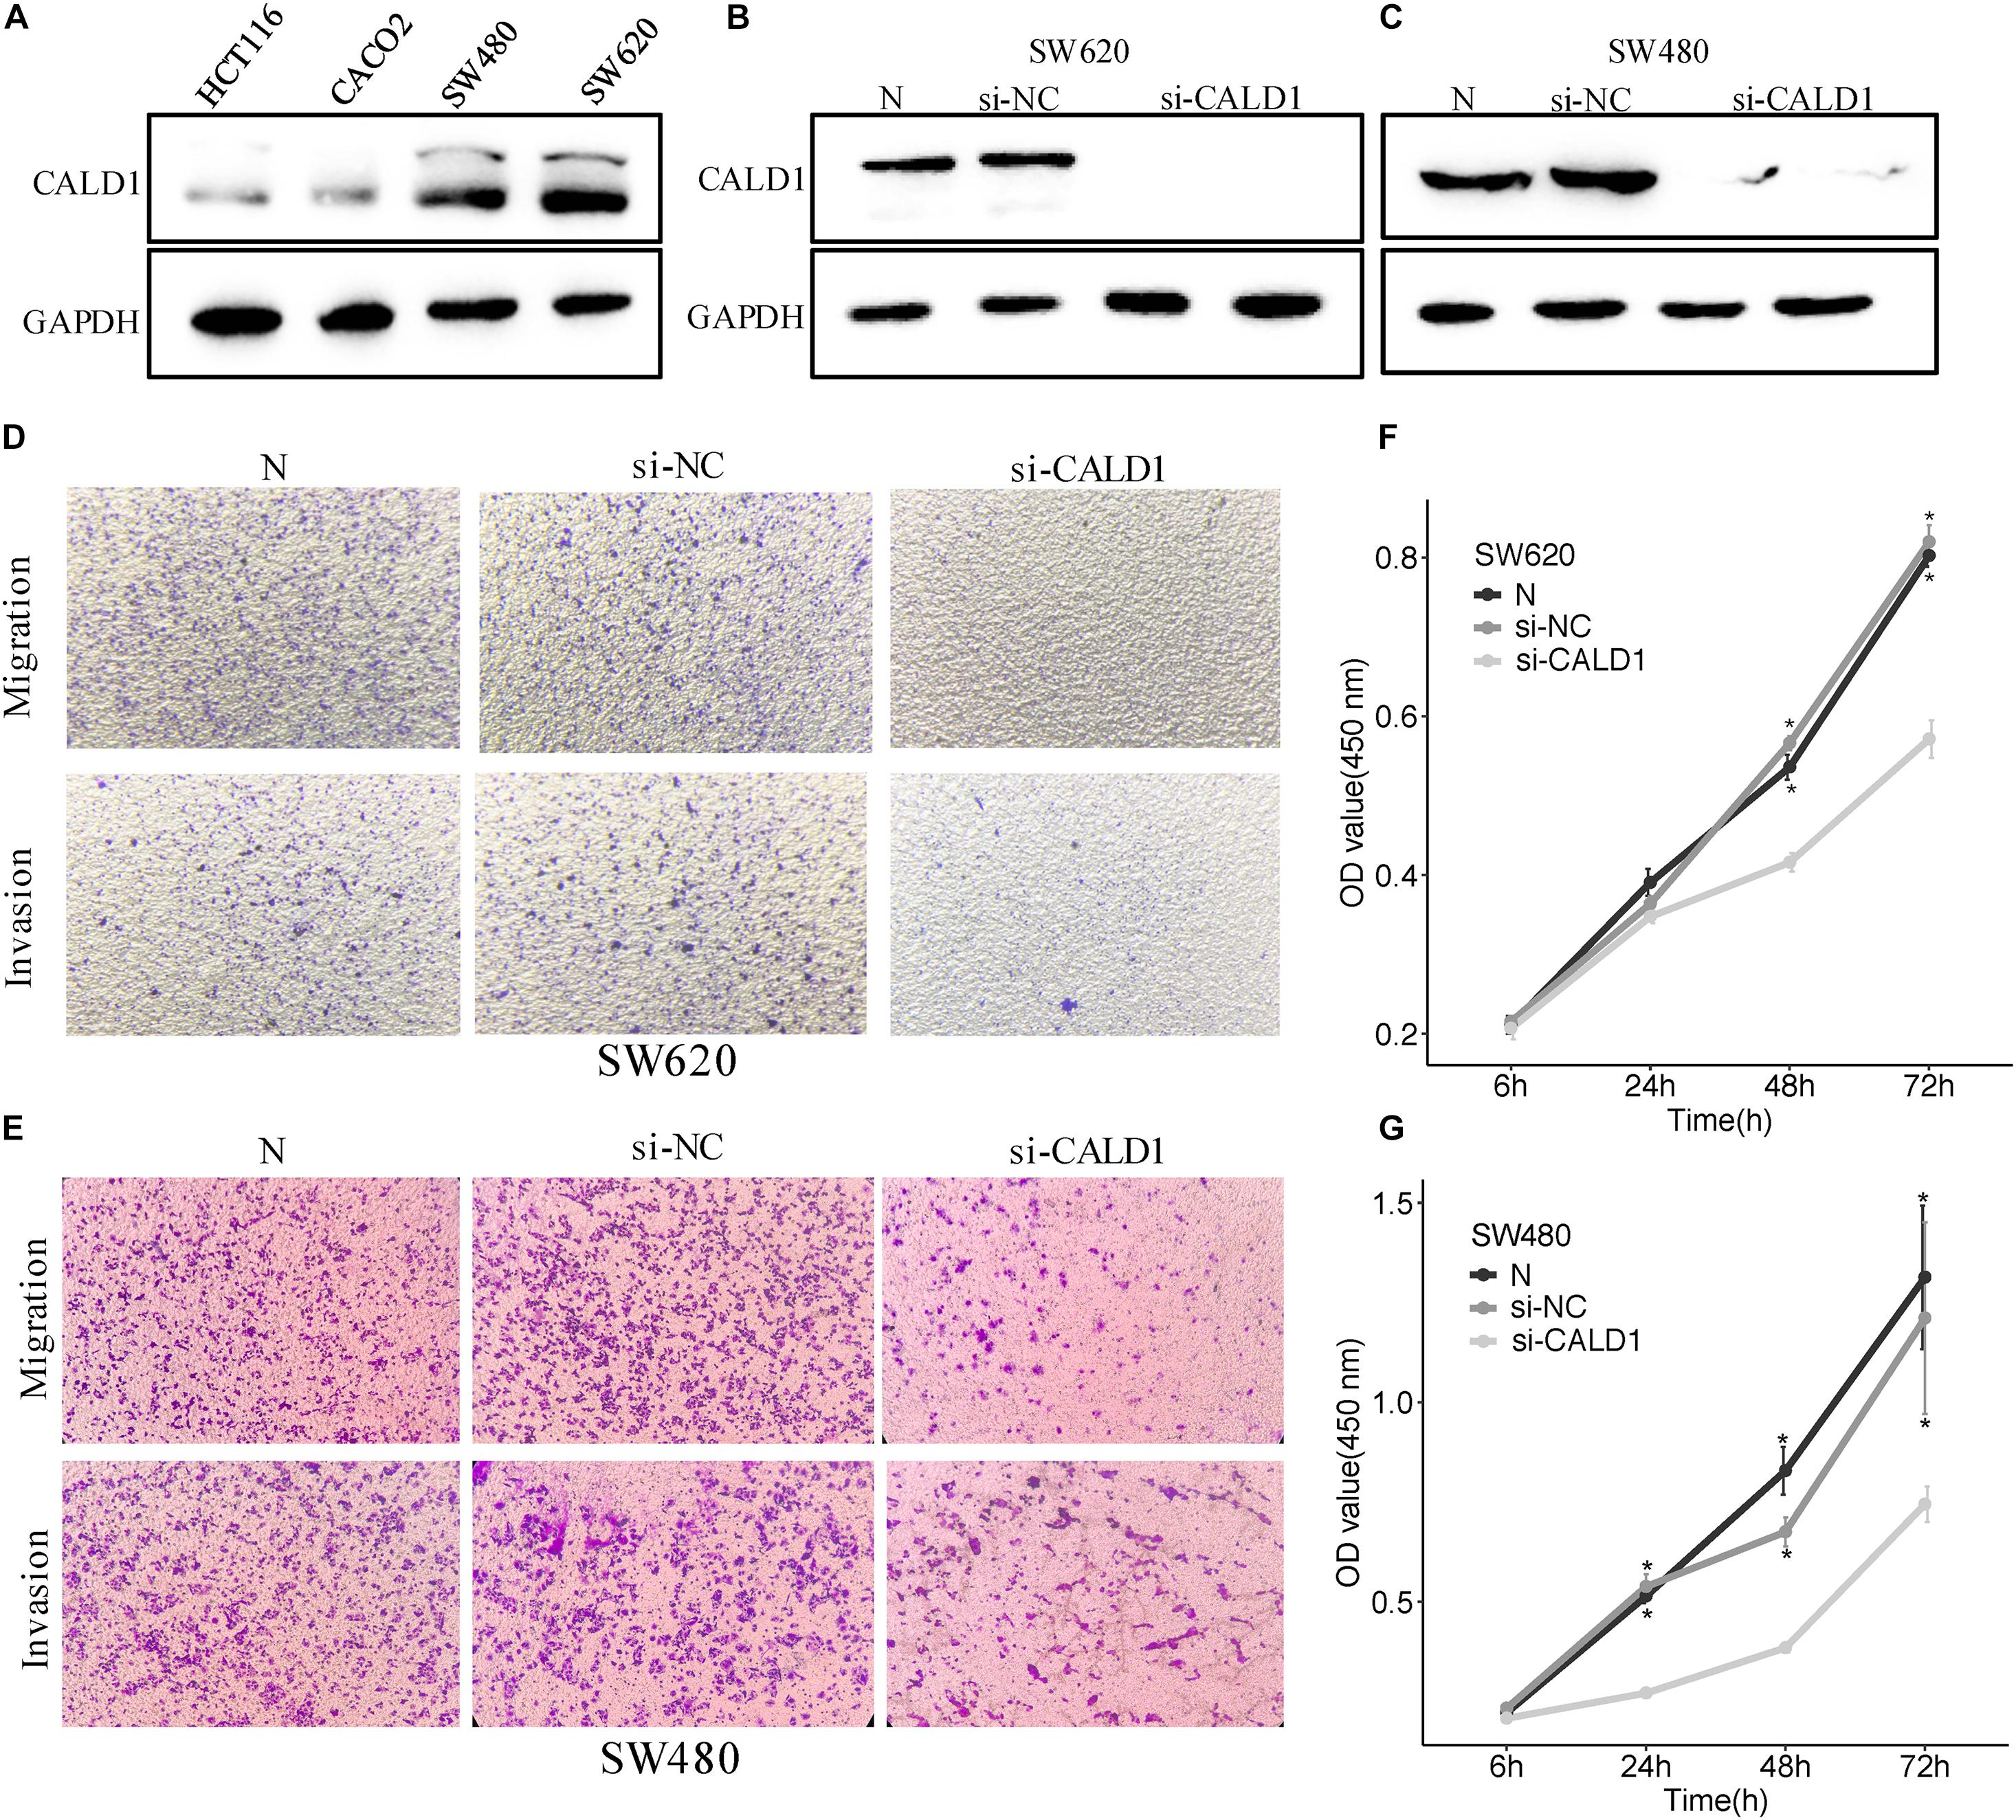
Figure 8. CALD1 promotes cell proliferation, migration, and invasion in CRC cells. (A) The protein levels of CALD1 in four kinds of CRC cell lines were measured by Western blot. (B,C) The protein levels of normal, si-NC, and si-CALD1 transfected SW620 (B) and SW480 (C) cells by Western blot; si-CALD1 transfections were performed in duplicate. (D,E) Transwell assays revealed that CALD1 knockdown attenuated SW620 (D) and SW480 (E) cell migration and invasion. (F,G) CCK8 assays were performed to assess cell viability in normal, si-NC, and si-CALD1 transfected SW620 (F) and SW480 (G) cells. *p < 0.05 in comparison with the si-CALD1 group using Kruskal–Wallis one-way analysis of variance (ANOVA). All assays were repeated at least three times.
Discussion
Microsatellite stability accounts for the majority of CRC patients and indicates unfavorable outcomes (Popat et al., 2005). Although immunotherapy has achieved responsiveness in many intractable tumors, no effective immune therapy has demonstrated any benefit for those patients (Le et al., 2015), which inspired us to prioritize the exploration of immune biomarkers to guide immunotherapy applications. As the principal immune subset in the TME, M2 macrophages induce angiogenesis, remodel the matrix, restrain the therapeutic response, and facilitate malignance (Najafi et al., 2019). Hence, approaches that restrain the activity of M2 macrophages would be a compelling area for oncologic research.
In this study, we firstly found significant differences in M2 macrophage distributions between pMMR and dMMR stage III/IV CRC patients, and increased M2 macrophage levels were associated with poorer prognosis for pMMR patients. Then, by applying integrated bioinformatics analysis, we successfully identified CALD1 as an independent prognostic biomarker closely correlated to M2 macrophage infiltrations. After that, we explored its relationship with diverse TME patterns and signaling pathway functions. In addition, by siRNA-mediated CALD1 depletion in CRC cell lines, we found that the proliferation and metastasis ability of tumor cells were repressed, which indicated that CALD1 played a dual role in immunosuppression and tumor metastasis.
Caldesmon (CaD), encoded by CALD1, is an actomyosin-binding and cytoskeleton-related protein. There are two major CaD isoforms that evolved through alternative splicing, including high-molecular weight CaD (h-CaD) and low-molecular weight CaD (l-CaD) (Hayashi et al., 1992; Huber, 1997). H-CaD exists uniquely in vascular and visceral smooth muscle cells (SMC) and acts as a cellular contraction regulator and biomarker for SMC-associated neoplasms (Watanabe et al., 1999). L-CaD is widely distributed in non-muscle cells (Sobue and Sellers, 1991; Dabrowska et al., 2004), and studies have shown that l-CaD promoted malignancy in several cancers (Kim et al., 2012; Chang et al., 2013; Lee et al., 2015; Lian et al., 2020). Lee et al. (2015) identified that overexpression of l-CaD in primary non-muscle-invasive bladder cancer is significantly correlated with large tumor size, lymphovascular invasion, advanced stage, higher grade, and adverse prognosis and elucidated that l-CaD-derived morphological changes of tumor cells were the underlying mechanism responsible for enhancing tumor cell motility. Chang et al. (2013) demonstrated that in oral cavity squamous cell carcinoma, the expression of l-CaD was higher in metastatic lymph nodes than in primary tumor cells, and higher l-CaD was associated with tumor metastasis. In CRC, Lian et al. (2020) proved that l-CaD was the isoform derived from alternative splicing of CALD1 and played a role in tumor metastasis. Kim et al. (2012) reported that the expression of l-CaD was higher in colon cancer than in normal colon mucosa and proposed that l-CaD could be a biomarker to predict neoadjuvant chemoradiotherapy susceptibility. In addition, Zhao et al. performed bioinformatics analysis and identified CALD1 as candidate genes for the early onset of CRC (Zhao B. et al., 2019). However, until now, the effect of CALD1 in CRC tumor microenvironment has rarely been addressed.
In the present study, we investigated the association between CALD1 and M2 macrophage infiltrations at the genomic level by using GEO datasets. As shown in Figure 6A, based on the CIBERSORT results, CALD1 was positively correlated with M0 and M2 macrophage fractions, whereas it was negatively correlated with CD8 T cell fractions, which were the principal components in antitumor immunity. Figures 6E,F revealed that the expression of CALD1 was positively correlated with TAM marker CCL2 and M2 macrophage markers (CD163, VSIG4, and MS4A4A). As for CCL2, studies have identified that CCL2 played a vital role in activating and recruiting TAMs, thereby deriving immunosuppressive effects (Mu et al., 2019; Xue et al., 2019). The blockage of CCL2 resulted in significantly elevated levels of M1 polarization-associated markers and cytokines, whereas M2-associated markers were diminished (Sierra-Filardi et al., 2014). The positive expression of CALD1 and CCL2 hinted that CALD1 might stimulate and polarize TAMs by upregulating CCL2 expression; however, further research is needed for confirmation.
Although CALD1 expression revealed no significant difference between dMMR and pMMR samples (Figure 6B), we observed that CALD1 was specifically upregulated in the CMS4 subtype compared with that in CMS1-3 (Figure 6D). CMS4 has been characterized by the notable upregulation of genes correlated with angiogenesis, TGF-β signaling activation, stromal infiltration, and worse prognosis (Guinney et al., 2015). Given the previous literature on the crosstalk between angiogenesis and TGF-β in macrophage recruitments and M2 polarizations (Allavena et al., 2008; Erreni et al., 2011; Najafi et al., 2019; Rahma and Hodi, 2019), we investigated if CALD1 correlated with the enrichments for the two gene sets in stage III/IV pMMR CRC samples. Indeed, CALD1 expression significantly correlated with ssGSEA scores for angiogenesis and TGF-β signaling gene lists (Figures 6E,F), suggesting the prospective synergistic roles of CALD1 in macrophage recruitments and polarizations as well as driving CRC progression and metastasis. In addition, accumulated evidence has revealed that the complex stromal medium is the core component of TME, and virtually every property of cancer-associated stroma plays a demonstrable role in sustaining hyperproliferation of tumor cells (Tsujino et al., 2007; Ueno et al., 2017; Liu et al., 2020) as well as therapy resistance in one condition or another (Gonçalves-Ribeiro et al., 2017). Our results revealed that stromal score was strongly and positively correlated with CALD1 (cor = 0.85 and 0.82, P < 0.001) and CCL2 (cor = 0.81 and 0.79, P < 0.001) expressions in the two datasets, indicating that signals from intricate CALD1, CCL2, and stromal interactions might drive M2 macrophage activation and polarization. Furthermore, GSEA disclosed that high expression of CALD1 was correlated with several immunoregulation pathways associated with M2 macrophage activation and recruitment, such as cytokine–cytokine receptor interaction, leukocyte transendothelial migration, vascular smooth muscle contraction, TGF-beta signaling pathway, and MAPK signaling pathway (Jiang et al., 2017; Wongchana et al., 2018).
Several limitations still exist in our study. Firstly, although functional and enrichment analyses were performed, the specific mechanisms of how CALD1 activated and recruited M2 macrophages require further clarification. In addition, the intratumoral immune and stromal compositions were estimated only through bioinformatics algorithms at molecular levels. The actual relationship between CALD1 and M2 macrophage infiltrations was not histologically verified in this study. If possible, we will perform additional biochemical and histological analyses to reevaluate the robustness of our findings in the future. Moreover, although our in vitro validation revealed that CALD1 was highly expressed in pMMR cell lines (SW480 and SW620), comparison between more CRC cell lines proficient and deficient in the MMR pathway will be necessary to clarify the specificity of CALD1 for pMMR CRC cells. Finally, as our study was based on public transcriptomic datasets, the application of CALD1 as a prognostic biomarker and potential target must be researched in prospective real-world pMMR CRC patients receiving immunotherapy.
Conclusion
In conclusion, this study is the first to reveal pMMR CRC patients possessed higher composition of M2 macrophages than dMMR tumors. We then identified CALD1 as an independent prognostic marker positively correlated with M2 macrophage infiltrations in stage III/IV pMMR CRC via WGCNA and Cox regression analyses. CALD1 was upregulated specifically in the CMS4 CRC subtype and was significantly correlated with angiogenesis and TGF-β signaling gene sets ssGSEA enrichment scores as well as immune and stromal ESTIMATE scores. In addition, CALD1 promoted proliferation, invasion, and migration of CRC cells. CALD1 could serve as an independent prognostic biomarker and a candidate M2 macrophage target for pMMR CRC patients. However, validation in large-scale genomics and functional and prospective clinical trials are still required.
Data Availability Statement
The original contributions presented in the study are included in the article/Supplementary Material, further inquiries can be directed to the corresponding author/s.
Author Contributions
HZ, SC, and XW contributed to the conception and design. YB, JW, and JLZ extracted the data from the databases. HZ, JZ, and SC contributed to the data analysis and interpretation. HZ drafted the manuscript. YL and XW revised the manuscript and supervised the entire study. All authors read and approved the final manuscript.
Conflict of Interest
The authors declare that the research was conducted in the absence of any commercial or financial relationships that could be construed as a potential conflict of interest.
Acknowledgments
We would like to thank the GEO database for the availability of the data.
Supplementary Material
The Supplementary Material for this article can be found online at: https://www.frontiersin.org/articles/10.3389/fmolb.2021.649363/full#supplementary-material
Footnotes
- ^ http://www.ncbinlm.nih.gov/geo/
- ^ https://string-db.org/
- ^ http://www.cytoscape.org/
- ^ https://www.gsea-msigdb.org
References
Allavena, P., Sica, A., Solinas, G., Porta, C., and Mantovani, A. (2008). The inflammatory micro-environment in tumor progression: the role of tumor-associated macrophages. Crit. Rev. Oncol. Hematol. 66, 1–9. doi: 10.1016/j.critrevonc.2007.07.004
Berg, K. C. G., Eide, P. W., Eilertsen, I. A., Johannessen, B., Bruun, J., Danielsen, S. A., et al. (2017). Multi-omics of 34 colorectal cancer cell lines - a resource for biomedical studies. Mol. Cancer 16:116. doi: 10.1186/s12943-017-0691-y
Bernal, M., Concha, A., Sáenz-López, P., Rodríguez, A. I., Cabrera, T., Garrido, F., et al. (2011). Leukocyte infiltrate in gastrointestinal adenocarcinomas is strongly associated with tumor microsatellite instability but not with tumor immunogenicity. Cancer Immunol. Immunother. 60, 869–882. doi: 10.1007/s00262-011-0999-1
Boland, C. R., Thibodeau, S. N., Hamilton, S. R., Sidransky, D., Eshleman, J. R., Burt, R. W., et al. (1998). A National Cancer Institute Workshop on microsatellite instability for cancer detection and familial predisposition: development of international criteria for the determination of microsatellite instability in colorectal cancer. Cancer Res. 58, 5248–5257.
Bray, F., Ferlay, J., Soerjomataram, I., Siegel, R. L., Torre, L. A., and Jemal, A. (2018). Global cancer statistics 2018: GLOBOCAN estimates of incidence and mortality worldwide for 36 cancers in 185 countries. CA Cancer J. Clin. 68, 394–424. doi: 10.3322/caac.21492
Chang, K.-P., Wang, C.-L. A., Kao, H.-K., Liang, Y., Liu, S.-C., Huang, L.-L., et al. (2013). Overexpression of caldesmon is associated with lymph node metastasis and poorer prognosis in patients with oral cavity squamous cell carcinoma. Cancer 119, 4003–4011. doi: 10.1002/cncr.28300
Chen, Y., Song, Y., Du, W., Gong, L., Chang, H., and Zou, Z. (2019). Tumor-associated macrophages: an accomplice in solid tumor progression. J. Biomed. Sci. 26:78. doi: 10.1186/s12929-019-0568-z
Chin, C.-H., Chen, S.-H., Wu, H.-H., Ho, C.-W., Ko, M.-T., and Lin, C.-Y. (2014). cytoHubba: identifying hub objects and sub-networks from complex interactome. BMC Syst. Biol. 8(Suppl. 4):S11. doi: 10.1186/1752-0509-8-S4-S11
Couzin-Frankel, J. (2013). Breakthrough of the year 2013. Cancer immunotherapy. Science 342, 1432–1433. doi: 10.1126/science.342.6165.1432
Dabrowska, R., Kulikova, N., and Gagola, M. (2004). Nonmuscle caldesmon: its distribution and involvement in various cellular processes. Review article. Protoplasma 224, 1–13. doi: 10.1007/s00709-004-0057-3
Diaz, L., Marabelle, A., Delord, J.-P., Shapira-Frommer, R., Geva, R., Peled, N., et al. (2017). Pembrolizumab therapy for microsatellite instability high (MSI-H) colorectal cancer (CRC) and non-CRC. J. Clin. Oncol. 35:3071. doi: 10.1200/JCO.2017.35.15_suppl.3071
Dolcetti, R., Viel, A., Doglioni, C., Russo, A., Guidoboni, M., Capozzi, E., et al. (1999). High prevalence of activated intraepithelial cytotoxic T lymphocytes and increased neoplastic cell apoptosis in colorectal carcinomas with microsatellite instability. Am. J. Pathol. 154, 1805–1813. doi: 10.1016/s0002-9440(10)65436-3
Eide, P. W., Bruun, J., Lothe, R. A., and Sveen, A. (2017). CMScaller: an R package for consensus molecular subtyping of colorectal cancer pre-clinical models. Sci. Rep. 7:16618. doi: 10.1038/s41598-017-16747-x
Erreni, M., Mantovani, A., and Allavena, P. (2011). Tumor-associated macrophages (TAM) and inflammation in colorectal cancer. Cancer Microenviron. 4, 141–154. doi: 10.1007/s12307-010-0052-5
Fernandes, E., Sores, J., Cotton, S., Peixoto, A., Ferreira, D., Freitas, R., et al. (2020). Esophageal, gastric and colorectal cancers: looking beyond classical serological biomarkers towards glycoproteomics-assisted precision oncology. Theranostics 10, 4903–4928. doi: 10.7150/thno.42480
Ganesh, K., Stadler, Z. K., Cercek, A., Mendelsohn, R. B., Shia, J., Segal, N. H., et al. (2019). Immunotherapy in colorectal cancer: rationale, challenges and potential. Nat. Rev. Gastroenterol. Hepatol. 16, 361–375. doi: 10.1038/s41575-019-0126-x
Gautier, L., Cope, L., Bolstad, B. M., and Irizarry, R. A. (2004). affy–analysis of Affymetrix GeneChip data at the probe level. Bioinformatics 20, 307–315.
Gonçalves-Ribeiro, S., Sanz-Pamplona, R., Vidal, A., Sanjuan, X., Guillen Díaz-Maroto, N., Soriano, A., et al. (2017). Prediction of pathological response to neoadjuvant treatment in rectal cancer with a two-protein immunohistochemical score derived from stromal gene-profiling. Ann. Oncol. 28, 2160–2168. doi: 10.1093/annonc/mdx293
Gryfe, R., Kim, H., Hsieh, E. T. K., Aronson, M. D., Holowaty, E. J., Bull, S. B., et al. (2000). Tumor microsatellite instability and clinical outcome in young patients with colorectal cancer. N. Engl. J. Med. 342, 69–77. doi: 10.1056/NEJM200001133420201
Guinney, J., Dienstmann, R., Wang, X., de Reyniès, A., Schlicker, A., Soneson, C., et al. (2015). The consensus molecular subtypes of colorectal cancer. Nat. Med. 21, 1350–1356. doi: 10.1038/nm.3967
Hanahan, D., and Coussens Lisa, M. (2012). Accessories to the crime: functions of cells recruited to the tumor microenvironment. Cancer Cell 21, 309–322. doi: 10.1016/j.ccr.2012.02.022
Hänzelmann, S., Castelo, R., and Guinney, J. (2013). GSVA: gene set variation analysis for microarray and RNA-Seq data. BMC Bioinformatics 14:7. doi: 10.1186/1471-2105-14-7
Hayashi, K., Yano, H., Hashida, T., Takeuchi, R., Takeda, O., Asada, K., et al. (1992). Genomic structure of the human caldesmon gene. Proc. Natl. Acad. Sci. U.S.A. 89, 12122–12126. doi: 10.1073/pnas.89.24.12122
Horvath, S., and Dong, J. (2008). Geometric interpretation of gene coexpression network analysis. PLoS Comput. Biol. 4:e1000117. doi: 10.1371/journal.pcbi.1000117
Huber, P. A. J. (1997). Caldesmon. Int. J. Biochem. Cell Biol. 29, 1047–1051. doi: 10.1016/S1357-2725(97)00004-6
Jiang, L., Li, X., Zhang, Y., Zhang, M., Tang, Z., and Lv, K. (2017). Microarray and bioinformatics analyses of gene expression profiles in BALB/c murine macrophage polarization. Mol. Med. Rep. 16, 7382–7390. doi: 10.3892/mmr.2017.7511
Kakati, T., Bhattacharyya, D. K., Barah, P., and Kalita, J. K. (2019). Comparison of methods for differential co-expression analysis for disease biomarker prediction. Comput. Biol. Med. 113:103380. doi: 10.1016/j.compbiomed.2019.103380
Kim, K.-H., Yeo, S.-G., Kim, W. K., Kim, D. Y., Yeo, H. Y., Hong, J. P., et al. (2012). Up-regulated expression of l-caldesmon associated with malignancy of colorectal cancer. BMC Cancer 12:601. doi: 10.1186/1471-2407-12-601
Langfelder, P., and Horvath, S. (2008). WGCNA: an R package for weighted correlation network analysis. BMC Bioinformatics 9:559. doi: 10.1186/1471-2105-9-559
Le, D. T., Durham, J. N., Smith, K. N., Wang, H., Bartlett, B. R., Aulakh, L. K., et al. (2017). Mismatch repair deficiency predicts response of solid tumors to PD-1 blockade. Science 357, 409–413. doi: 10.1126/science.aan6733
Le, D. T., Uram, J. N., Wang, H., Bartlett, B. R., Kemberling, H., Eyring, A. D., et al. (2015). PD-1 blockade in tumors with mismatch-repair deficiency. N. Engl. J. Med. 372, 2509–2520. doi: 10.1056/NEJMoa1500596
Lee, M.-S., Lee, J., Kim, J. H., Kim, W. T., Kim, W.-J., Ahn, H., et al. (2015). Overexpression of caldesmon is associated with tumor progression in patients with primary non-muscle-invasive bladder cancer. Oncotarget 6, 40370–40384. doi: 10.18632/oncotarget.5458
Lian, H., Wang, A., Shen, Y., Wang, Q., Zhou, Z., Zhang, R., et al. (2020). Identification of novel alternative splicing isoform biomarkers and their association with overall survival in colorectal cancer. BMC Gastroenterol. 20:171. doi: 10.1186/s12876-020-01288-x
Liu, J.-W., Yu, F., Tan, Y.-F., Huo, J.-P., Liu, Z., Wang, X.-J., et al. (2020). Profiling of tumor microenvironment components identifies five stroma-related genes with prognostic implications in colorectal cancer. Cancer Biother. Radiopharm. [Epub ahead of print]. doi: 10.1089/cbr.2020.4118
Malesci, A., Laghi, L., Bianchi, P., Delconte, G., Randolph, A., Torri, V., et al. (2007). Reduced likelihood of metastases in patients with microsatellite-unstable colorectal cancer. Clin. Cancer Res. 13, 3831–3839. doi: 10.1158/1078-0432.ccr-07-0366
Marisa, L., de Reyniès, A., Duval, A., Selves, J., Gaub, M. P., Vescovo, L., et al. (2013). Gene expression classification of colon cancer into molecular subtypes: characterization, validation, and prognostic value. PLoS Med. 10:e1001453. doi: 10.1371/journal.pmed.1001453
Morse, M. A., Overman, M. J., Hartman, L., Khoukaz, T., Brutcher, E., Lenz, H.-J., et al. (2019). Safety of nivolumab plus low-dose ipilimumab in previously treated microsatellite instability-high/mismatch repair-deficient metastatic colorectal cancer. Oncologist 24, 1453–1461. doi: 10.1634/theoncologist.2019-0129
Mu, J., Sun, P., Ma, Z., and Sun, P. (2019). BRD4 promotes tumor progression and NF-κB/CCL2-dependent tumor-associated macrophage recruitment in GIST. Cell Death Dis. 10:935. doi: 10.1038/s41419-019-2170-4
Najafi, M., Hashemi Goradel, N., Farhood, B., Salehi, E., Nashtaei, M. S., Khanlarkhani, N., et al. (2019). Macrophage polarity in cancer: a review. J. Cell. Biochem. 120, 2756–2765. doi: 10.1002/jcb.27646
Narayanan, S., Kawaguchi, T., Peng, X., Qi, Q., Liu, S., Yan, L., et al. (2019). Tumor infiltrating lymphocytes and macrophages improve survival in microsatellite unstable colorectal cancer. Sci. Rep. 9:13455. doi: 10.1038/s41598-019-49878-4
Newman, A. M., Liu, C. L., Green, M. R., Gentles, A. J., Feng, W., Xu, Y., et al. (2015). Robust enumeration of cell subsets from tissue expression profiles. Nat. Methods 12, 453–457. doi: 10.1038/nmeth.3337
Overman, M. J., McDermott, R., Leach, J. L., Lonardi, S., Lenz, H. J., Morse, M. A., et al. (2017). Nivolumab in patients with metastatic DNA mismatch repair-deficient or microsatellite instability-high colorectal cancer (CheckMate 142): an open-label, multicentre, phase 2 study. Lancet Oncol. 18, 1182–1191. doi: 10.1016/s1470-2045(17)30422-9
Peltomäki, P. (2003). Role of DNA mismatch repair defects in the pathogenesis of human cancer. J. Clin. Oncol. 21, 1174–1179. doi: 10.1200/JCO.2003.04.060
Popat, S., Hubner, R., and Houlston, R. S. (2005). Systematic review of microsatellite instability and colorectal cancer prognosis. J. Clin. Oncol. 23, 609–618. doi: 10.1200/JCO.2005.01.086
Prall, F., Dührkop, T., Weirich, V., Ostwald, C., Lenz, P., Nizze, H., et al. (2004). Prognostic role of CD8+ tumor-infiltrating lymphocytes in stage III colorectal cancer with and without microsatellite instability. Hum. Pathol. 35, 808–816. doi: 10.1016/j.humpath.2004.01.022
Rahma, O. E., and Hodi, F. S. (2019). The intersection between tumor angiogenesis and immune suppression. Clin. Cancer Res. 25, 5449–5457. doi: 10.1158/1078-0432.CCR-18-1543
Ritchie, M. E., Phipson, B., Wu, D., Hu, Y., Law, C. W., Shi, W., et al. (2015). limma powers differential expression analyses for RNA-sequencing and microarray studies. Nucleic Acids Res. 43:e47. doi: 10.1093/nar/gkv007
Scholkopf, B., Smola, A. J., Williamson, R. C., and Bartlett, P. L. (2000). New support vector algorithms. Neural Comput. 12, 1207–1245.
Shannon, P., Markiel, A., Ozier, O., Baliga, N. S., Wang, J. T., Ramage, D., et al. (2003). Cytoscape: a software environment for integrated models of biomolecular interaction networks. Genome Res. 13, 2498–2504.
Sheffer, M., Bacolod, M. D., Zuk, O., Giardina, S. F., Pincas, H., Barany, F., et al. (2009). Association of survival and disease progression with chromosomal instability: a genomic exploration of colorectal cancer. Proc. Natl. Acad. Sci. U.S.A. 106, 7131–7136. doi: 10.1073/pnas.0902232106
Siegel, R. L., Miller, K. D., Fedewa, S. A., Ahnen, D. J., Meester, R. G. S., Barzi, A., et al. (2017). Colorectal cancer statistics, 2017. CA Cancer J. Clin. 67, 177–193. doi: 10.3322/caac.21395
Sierra-Filardi, E., Nieto, C., Domínguez-Soto, Á, Barroso, R., Sánchez-Mateos, P., Puig-Kroger, A., et al. (2014). CCL2 shapes macrophage polarization by GM-CSF and M-CSF: identification of CCL2/CCR2-dependent gene expression profile. J. Immunol. 192, 3858–3867. doi: 10.4049/jimmunol.1302821
Smyrk, T. C., Watson, P., Kaul, K., and Lynch, H. T. (2001). Tumor-infiltrating lymphocytes are a marker for microsatellite instability in colorectal carcinoma. Cancer 91, 2417–2422.
Sobue, K., and Sellers, J. R. (1991). Caldesmon, a novel regulatory protein in smooth muscle and nonmuscle actomyosin systems. J. Biol. Chem. 266, 12115–12118.
Subramanian, A., Tamayo, P., Mootha, V. K., Mukherjee, S., Ebert, B. L., Gillette, M. A., et al. (2005). Gene set enrichment analysis: a knowledge-based approach for interpreting genome-wide expression profiles. Proc. Natl. Acad. Sci. U.S.A. 102, 15545–15550. doi: 10.1073/pnas.0506580102
Szklarczyk, D., Gable, A. L., Lyon, D., Junge, A., Wyder, S., Huerta-Cepas, J., et al. (2019). STRING v11: protein-protein association networks with increased coverage, supporting functional discovery in genome-wide experimental datasets. Nucleic Acids Res. 47, D607–D613. doi: 10.1093/nar/gky1131
Tan, B., Shi, X., Zhang, J., Qin, J., Zhang, N., Ren, H., et al. (2018). Inhibition of Rspo-Lgr4 facilitates checkpoint blockade therapy by switching macrophage polarization. Cancer Res. 78, 4929–4942. doi: 10.1158/0008-5472.can-18-0152
Tsujino, T., Seshimo, I., Yamamoto, H., Ngan, C. Y., Ezumi, K., Takemasa, I., et al. (2007). Stromal myofibroblasts predict disease recurrence for colorectal cancer. Clin. Cancer Res. 13, 2082–2090. doi: 10.1158/1078-0432.CCR-06-2191
Ubil, E., Caskey, L., Holtzhausen, A., Hunter, D., Story, C., and Earp, H. S. (2018). Tumor-secreted Pros1 inhibits macrophage M1 polarization to reduce antitumor immune response. J. Clin. Invest. 128, 2356–2369. doi: 10.1172/jci97354
Ueno, H., Kanemitsu, Y., Sekine, S., Ishiguro, M., Ito, E., Hashiguchi, Y., et al. (2017). Desmoplastic pattern at the tumor front defines poor-prognosis subtypes of colorectal cancer. Am. J. Surg. Pathol. 41, 1506–1512. doi: 10.1097/pas.0000000000000946
Watanabe, K., Kusakabe, T., Hoshi, N., Saito, A., and Suzuki, T. (1999). h-Caldesmon in leiomyosarcoma and tumors with smooth muscle cell-like differentiation: its specific expression in the smooth muscle cell tumor. Hum. Pathol. 30, 392–396. doi: 10.1016/S0046-8177(99)90113-2
Wongchana, W., Kongkavitoon, P., Tangtanatakul, P., Sittplangkoon, C., Butta, P., Chawalitpong, S., et al. (2018). Notch signaling regulates the responses of lipopolysaccharide-stimulated macrophages in the presence of immune complexes. PLoS One 13:e0198609. doi: 10.1371/journal.pone.0198609
Xiang, W., Shi, R., Kang, X., Zhang, X., Chen, P., Zhang, L., et al. (2018). Monoacylglycerol lipase regulates cannabinoid receptor 2-dependent macrophage activation and cancer progression. Nat. Commun. 9:2574. doi: 10.1038/s41467-018-04999-8
Xue, J., Ge, X., Zhao, W., Xue, L., Dai, C., Lin, F., et al. (2019). PIPKIγ regulates CCL2 expression in colorectal cancer by activating AKT-STAT3 signaling. J. Immunol. Res. 2019:3690561. doi: 10.1155/2019/3690561
Yip, A. M., and Horvath, S. (2007). Gene network interconnectedness and the generalized topological overlap measure. BMC Bioinformatics 8:22. doi: 10.1186/1471-2105-8-22
Yoshihara, K., Shahmoradgoli, M., Martínez, E., Vegesna, R., Kim, H., Torres-Garcia, W., et al. (2013). Inferring tumour purity and stromal and immune cell admixture from expression data. Nat. Commun. 4:2612. doi: 10.1038/ncomms3612
Yu, G., Wang, L.-G., Han, Y., and He, Q.-Y. (2012). clusterProfiler: an R package for comparing biological themes among gene clusters. OMICS 16, 284–287. doi: 10.1089/omi.2011.0118
Zeng, H., Ji, J., Song, X., Huang, Y., Li, H., Huang, J., et al. (2020). Stemness related genes revealed by network analysis associated with tumor immune microenvironment and the clinical outcome in lung adenocarcinoma. Front. Genet. 11:549213. doi: 10.3389/fgene.2020.549213
Zhang, J., Wang, L., Xu, X., Li, X., Guan, W., Meng, T., et al. (2020). Transcriptome-based network analysis unveils eight immune-related genes as molecular signatures in the immunomodulatory subtype of triple-negative breast cancer. Front. Oncol. 10:1787. doi: 10.3389/fonc.2020.01787
Zhao, B., Baloch, Z., Ma, Y., Wan, Z., Huo, Y., Li, F., et al. (2019). Identification of potential key genes and pathways in early-onset colorectal cancer through bioinformatics analysis. Cancer Control 26:1073274819831260. doi: 10.1177/1073274819831260
Zhao, Y., Ge, X., Xu, X., Yu, S., Wang, J., and Sun, L. (2019). Prognostic value and clinicopathological roles of phenotypes of tumour-associated macrophages in colorectal cancer. J. Cancer Res. Clin. Oncol. 145, 3005–3019. doi: 10.1007/s00432-019-03041-8
Keywords: colorectal cancer, microsatellite instability, M2 macrophages, tumor microenvironment, bioinformatics, prognosis
Citation: Zheng H, Bai Y, Wang J, Chen S, Zhang J, Zhu J, Liu Y and Wang X (2021) Weighted Gene Co-expression Network Analysis Identifies CALD1 as a Biomarker Related to M2 Macrophages Infiltration in Stage III and IV Mismatch Repair-Proficient Colorectal Carcinoma. Front. Mol. Biosci. 8:649363. doi: 10.3389/fmolb.2021.649363
Received: 04 January 2021; Accepted: 23 February 2021;
Published: 29 April 2021.
Edited by:
Na Luo, Nankai University, ChinaReviewed by:
Shalini Dimri, The Ruth and Bruce Rappaport Faculty of Medicine, Technion Israel Institute of Technology, IsraelPedro José Carlos Rondot Radío, University of Buenos Aires, Argentina
Copyright © 2021 Zheng, Bai, Wang, Chen, Zhang, Zhu, Liu and Wang. This is an open-access article distributed under the terms of the Creative Commons Attribution License (CC BY). The use, distribution or reproduction in other forums is permitted, provided the original author(s) and the copyright owner(s) are credited and that the original publication in this journal is cited, in accordance with accepted academic practice. No use, distribution or reproduction is permitted which does not comply with these terms.
*Correspondence: Xin Wang, d2FuZ3hpbl9ndW9AMTI2LmNvbQ==