 Lorenzo Di Rienzo
 Edoardo Milanetti
 Giancarlo Ruocco
 Rosalba Lepore
- 1Center for Life Nano and Neuro-Science, Istituto Italiano di Tecnologia, Rome, Italy
- 2Department of Physics, Sapienza University, Rome, Italy
- 3Department of Biomedicine, Basel University Hospital and University of Basel, Basel, Switzerland
Antibodies have the remarkable ability to recognise their cognate antigens with extraordinary affinity and specificity. Discerning the rules that define antibody-antigen recognition is a fundamental step in the rational design and engineering of functional antibodies with desired properties. In this study we apply the 3D Zernike formalism to the analysis of the surface properties of the antibody complementary determining regions (CDRs). Our results show that shape and electrostatic 3DZD descriptors of the surface of the CDRs are predictive of antigen specificity, with classification accuracy of 81% and area under the receiver operating characteristic curve (AUC) of 0.85. Additionally, while in terms of surface size, solvent accessibility and amino acid composition, antibody epitopes are typically not distinguishable from non-epitope, solvent-exposed regions of the antigen, the 3DZD descriptors detect significantly higher surface complementarity to the paratope, and are able to predict correct paratope-epitope interaction with an AUC = 0.75.
1 Introduction
Antibodies, also known as immunoglobulins, are multimeric Y-shaped proteins that the immune system uses to recognize and neutralize foreign targets, named antigens. The antigen binding site is located on the upper tip of the molecule, and is formed by the pairing of two variable domains, the VH and the VL, each contributing three hypervariable loops or complementary determining regions (CDR). The remarkable ability of the antibodies to recognize virtually any foreign antigen stems from the sequence and length variability of the CDR, while the framework of the molecule is largely conserved (Chothia and Lesk, 1987; Chothia et al., 1989; Tramontano et al., 1990).
Early studies, based on a handful of crystallographic structures, revealed that despite the large sequence variability of CDRs, five out of the six hypervariable loops only exhibit a limited number of main-chain conformations called “canonical structures” (Chothia and Lesk, 1987; Chothia et al., 1989), where most sequence variations only modify the surface generated by the side chains on a canonical main-chain structure. Over the years, with more experimentally determined structures of antibodies becoming available, an exhaustive repertoire of canonical structures has been compiled and their relationship with the chain isotypes (Tramontano et al., 1990; Chothia et al., 1992; Foote and Winter, 1992; Tomlinson et al., 1995; Martin and Thornton, 1996; Chothia et al., 1998; Decanniere et al., 2000; Vargas-Madrazo and Paz-García, 2002; Chailyan et al., 2011; North et al., 2011; Kuroda and Gray, 2016) and packing mode of the antibody was extensively analysed (Chothia et al., 1985; De Wildt et al., 1999; Abhinandan and Martin, 2010; Jayaram et al., 2012; Dunbar et al., 2013a). This led to the development of fully automated pipelines for the prediction of immunoglobulin structures given their amino acid sequences, with predictions reaching near-native accuracy both at the global and local CDR level (Whitelegg and Rees, 2000; Marcatili et al., 2014; Messih et al., 2014; Dunbar et al., 2016; Lepore et al., 2017; Weitzner et al., 2017). In parallel, a major focus has been in understanding the structural and molecular basis of antibody function and, in particular, of antigen recognition. The identification of the portion of the antigen that is recognized by an antibody, i.e. the epitope, is indeed of central relevance for the development of vaccines and immunodiagnostics, as well as for our understanding of protective immunity (Pollard and Bijker, 2020). As a consequence, in the past years, there have been several attempts in the direction of relating the sequence and structural properties of antibody binding sites to their function, and more specifically, to the type of recognised antigen. Early work by Webster et al. in 1994 first discovered a strong correlation between the topography of the CDRs and the broad nature of the antigen, proposing that antibodies binding protein antigens are characterised by flat combining sites, while those recognising smaller antigens, like haptens and peptides, show the most concave interfaces (Webster et al., 1994). Subsequent work confirmed and extended these findings to the length and sequence composition of the CDRs based on increased availability of sequence and structural data of antibody-antigen complexes (MacCallum et al., 1996; Collis et al., 2003; Lee et al., 2006; Raghunathan et al., 2012).
The study of molecular interactions in proteins, and antibodies in particular, poses well known challenges. Existing experimental methods, such as Xray crystallography, mass spectrometry, phage display and mutagenesis analysis are intrinsically expensive, laborious, and time consuming (Sela-Culang et al., 2013). Hence, computational methods have established themselves as a valuable complement to experimental biology efforts for the analysis and characterization of the vast repertoire of molecular interactions at the atomic level. Early studies by Lee and Richards (1971) proposed the first description of protein solvent-accessible surface, which was later refined by Connolly (1983), allowing to distinguish surface atoms from buried atoms and opening the way to efficient graphical representation and comparison of molecular surface properties. Subsequent methods relied on the application of spherical harmonics descriptors (Leicester et al., 1988; Max and Getzoff, 1988) and Fourier correlation theory to shape complementarity and electrostatic interaction analysis (Gabb et al., 1997). Additionally, approaches based on tessellation (Walls and Sternberg, 1992; Li et al., 2007), void volume (Jones and Thornton, 1996) and surface density (Norel et al., 1995) provided an efficient way for representation and matching of protein surfaces, including protein-protein interaction sites, ligand binding sites and functional sites (Via et al., 2000; Mitra and Pal, 2010).
In this study we rely on a surface representation of antibodies and their cognate antigens based on the 3D Zernike Descriptors (3DZD). The Zernike polynomials were first described by Fritz Zernike in 1934 (Zernike and Stratton, 1934) as a framework for the analysis of aberrations in optical systems and subsequently generalized to three-dimensions (Ming-Kuei Hu, 1962; Canterakis, 1999; Novotni and Klein, 2004). One of the convenient features of Zernike polynomials is that their rotational symmetry allows the polynomials to be expressed as products of radial terms and functions of angle, where the coordinate system can be rotated without changing the form of the polynomial. Hence, they allow a concise, roto-translationally invariant characterization of 3D objects, comparing favourably to other moment-based descriptors in terms of shape retrieval and robustness to topological and geometrical artifacts (Novotni and Klein, 2004). When applied to molecular surfaces, the 3DZD have been shown to capture both global and local protein surface properties and to adequately represent their physico-chemical properties (Venkatraman et al., 2009a; Venkatraman et al., 2009b; Kihara et al., 2011; Di Rienzo et al., 2017; Daberdaku and Ferrari, 2018; Daberdaku and Ferrari, 2019; Alba et al., 2020; Di Rienzo et al., 2020). Here we apply the 3DZD to provide a quantitative description of the shape and electrostatic properties of Ab–Ag interfaces, leading to an accurate classification of the antibodies according to the type of their cognate antigens solely based on the information of the CDR surface, with overall AUC = 0.85 and accuracy of 81%.
Additionally, we show that while in terms of surface size, solvent accessibility and amino acid composition, antibody epitopes are not distinguishable from non-epitope, solvent-exposed regions of the antigen, they display significantly higher surface complementarity to the antibody paratope, both in terms of shape and electrostatic 3DZD, leading to a prediction performance in terms of ROC AUC of 0.75 and 0.61 respectively.
2 Materials and Methods
2.1 Dataset
We selected 326 antibodies with redundancy lower than 90% and resolution <3.0 Å using the SabDab database (Dunbar et al., 2013b). 229 antibodies were solved in complex with protein antigens, 71 with haptens, 19 with carbohydrates and 7 with nucleic acids. The sequence of each antibody was renumbered according to the Chothia numbering scheme (Chothia and Lesk, 1987; Chothia et al., 1989) using an in-house python script.
2.2 Solvent Accessible Surface and Electrostatics Surface
For each antibody and protein antigen 3D structure, atomic partial charges and radii were assigned using PDB2PQR with default parameters (Dolinsky et al., 2004). Solvent Accessible Surface (SAS) was computed using GROMACS (Abraham et al., 2015). Electrostatic surface (ES) potential was computed using the Bluues software (options -srf and -srfpot) (Fogolari et al., 2012). Each molecular surface point was assigned to the electrostatic potential of the corresponding residue. The “geometry” (Habel et al., 2019) and “Bio3D” (Grant et al., 2006) packages available in R were used for PDB structure processing and analysis.
2.3 Voxelization Procedure
The set of selected molecular surface points was scaled to the unit sphere and placed into a 3D grid of dimension 1283. To avoid boundary effects, the size of the bounding box of the point cloud was set so as to be contained within 80% of the unit sphere (Grandison et al., 2009). Voxelization was performed separately for SAS and ES. In SAS voxelization, each voxel was assigned a value of 1 if the center of the voxel was closer than 1.7 to any SAS point, 0 otherwise. In ES voxelization, each voxel was assigned the mean ES value of the enclosed points, 0 otherwise.
Since the Zernike formalism does not differentiate positive and negative values (Chikhi et al., 2010; Daberdaku and Ferrari, 2018), but only patterns of non-zero values in the 3D space, voxels were initialized for positive and negative patterns separately using a similar approach as done in (Chikhi et al., 2010), as follows:
In summary, voxels with positive electrostatics values were initialized to 1 and all other voxels with negative electrostatics values were set to zero, and vice versa. The resulting voxels, one for SAS values, and two for positive and negative ES values, respectively, were considered as three different 3D functions, f(x), each expanded into the 3DZD as described in the next section.
2.4 3D Zernike Descriptors
For the quantitative description of the binding sites, we rely on a representation based on the Zernike polynomials and their corresponding moments. Moment-based representations are a class of mathematical descriptors of shape, originally developed for pattern recognition and subsequently generalized to three-dimensions (Ming-Kuei Hu, 1962; Canterakis, 1999; Novotni and Klein, 2004).
A surface described by a function f (r, θ, ϕ) in polar coordinates can be represented by a series expansion in an orthonormal sequence of polynomials (Canterakis, 1999):
where the indices n, m and l are the order, degree and repetition, respectively.
The Zernike polynomials can be written as:
where the Y functions are complex spherical harmonics depending on both θ and ϕ while R only depends on the radius r, which is given by
where N is a normalization factor.
The 3D Zernike moments of a surface described by a function f (r, θ, ϕ) are defined as the coefficients of the expansion of f(r) in the Zernike polynomial basis, i.e.:
where
Their rotation invariant norms, i.e. the 3DZD, are defined as:
The Zernike formalism can be as detailed as desired by modulating the order of the expansion n. In our implementation, the function f represents the geometric or the (positive or negative) electrostatic potential of the molecular surface, and the maximum order of expansion was set to 20, giving a total of 121 invariants.
2.5 Generation of Native Epitopes and Surface Decoys
Given the dataset of Antibody-Antigen complexes containing protein antigens, the native geometric epitope was defined as the set of residues of the antigen having a distance lower than 6 Å to any residue of the antibody. The pivot residue was defined as the residue with the lowest mean distance to any residue of the native geometric epitope. The native electrostatic epitope was defined as the set of residues of the antigen having a distance shorter than 15 Å to any residue of the antibody. For the set of native geometric epitope residues, the Solvent Accessible Surface Area (SASA) was computed using GROMACS. The mean and standard deviation values of the computed global and residue-based SASA were used to generate an alternative set of surface patches, i.e. decoy epitopes. The algorithm first selects a decoy pivot residue, i.e. by randomly selecting any solvent exposed residue having a value of SASA within half standard deviation of the mean SASA value measured over all pivot residues of the native epitopes, i.e. SASA = 0.48 ± 0.33 nm2 (Supplementary Figure S1). The algorithm proceeds by adding neighboring solvent accessible residues, i.e. having relative SASA >0.2 (Tien et al., 2013), until the decoy geometric epitope reaches a similar global SASA to that of the native epitope. To ensures continuous coverage of the antigen protein surface (Supplementary Figure S2) and diversity of the generated patches, a maximum 50% surface patch overlap was allowed between native and decoy epitopes. Electrostatic decoy epitopes were defined by calculating the electrostatic potential over the region defined by a geometric decoy epitope considering all the charged residues within 15
2.6 Comparison of the 3DZD Descriptors
Given a pair of ordered set of 3DZD, x and y, their cosine distance is measured as:
where Sc (x, y) is the cosine similarity as measured by the “proxy” R package (Meyer and Buchta, 2019).
Given two patches A and B, the similarity between their 3DZD is computed as:
where Xshape,
The surface complementarity between A and B is defined as follows:
3 Results
In this work we aim at providing a quantitative description of the geometric and electrostatic properties of antibody-antigen interaction through a mathematical representation of the interacting surfaces. To this aim, we rely on a dataset of experimentally determined 3D structures of antibody-antigen complexes and a moment-based representation of the interacting surface using the 3D Zernike descriptors (3DZD) (Novotni and Klein, 2004; Venkatraman et al., 2009b; Daberdaku and Ferrari, 2018).
The 3DZD descriptors provide a compact, roto-translationally invariant representation of 3D objects, thus enabling effective comparison of both global and local properties of molecular surfaces by standard pairwise similarity metrics. The order n of the series expansion determines the resolution of the descriptor. In this study, 3DZD were computed at different levels of truncation of the expansion, with n ranging from 10 to 20, which correspond to vectors of 36 and 121 invariants, respectively. The overall scheme of the procedure used in this work is shown in Figure 1.
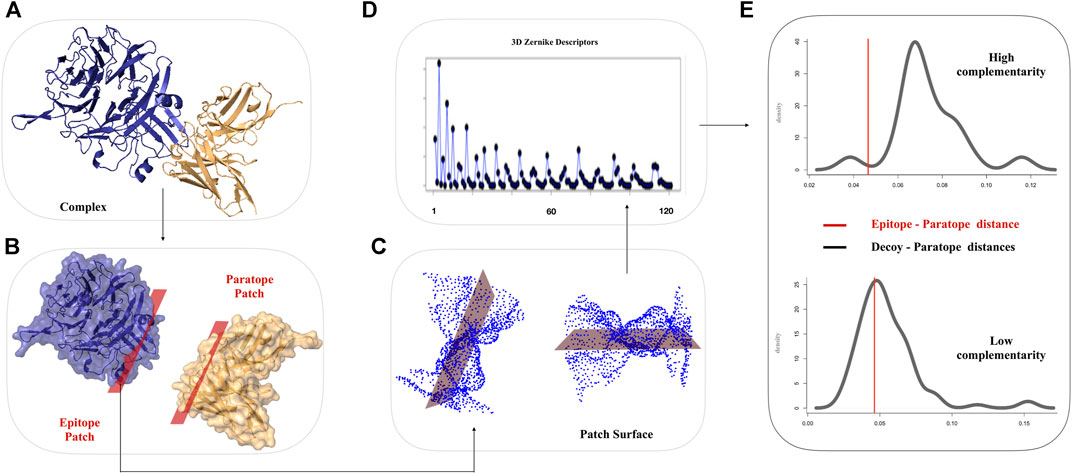
FIGURE 1. Schematic workflow for the comparison of Ab-Ag interfaces based on 3DZD. (A) Molecular representation of a given Ab-Ag complex. Antibody and antigen are shown in gold and blue, respectively. (B) The interacting surfaces are selected according to inter-molecular atomic distance threshold. (C) Solvent accessible and electrostatic surfaces are computed on the selected regions (D) 3DZD Zernike descriptors are computed for each molecular surface. (E) Distribution of 3DZD surface complementary complementarity between paratope and non-epitope surface decoys. The red line denotes 3DZD surface complementarity between the antibody paratope and their cognate epitope.
3.1 Antibody Classification Based on Surface Shape and Electrostatic 3DZD Descriptors of CDRs
We have previously shown that a 3DZD-based description of the surface of the antibody CDRs provides an effective metric for antibody classification according to their specificity towards protein and non-protein antigens (Di Rienzo et al., 2017). Here we extend this approach to the analysis of both the shape and electrostatic properties of the CDRs and analyze the classification performance of both descriptors at different orders of the Zernike expansion. For each CDR we generated two sets of 121-dimensional vectors, representing the 3DZD of the shape and the electrostatic surface, similar to what done in (Chikhi et al., 2010; Di Rienzo et al., 2020). The similarity between each set of descriptors is then computed to perform an all-against-all comparison of CDRs, according to Eq. 9, 10 in Methods section. For each CDR, we then selected the nearest neighbors set as the 5% most similar CDRs in terms of shape and electrostatic surface and analyse the number of protein binding antibodies (Npb) in the neighbours set. As it is shown in Figures 2A,B, protein-binding antibodies (green curve) are typically characterized by an higher number of Npb (
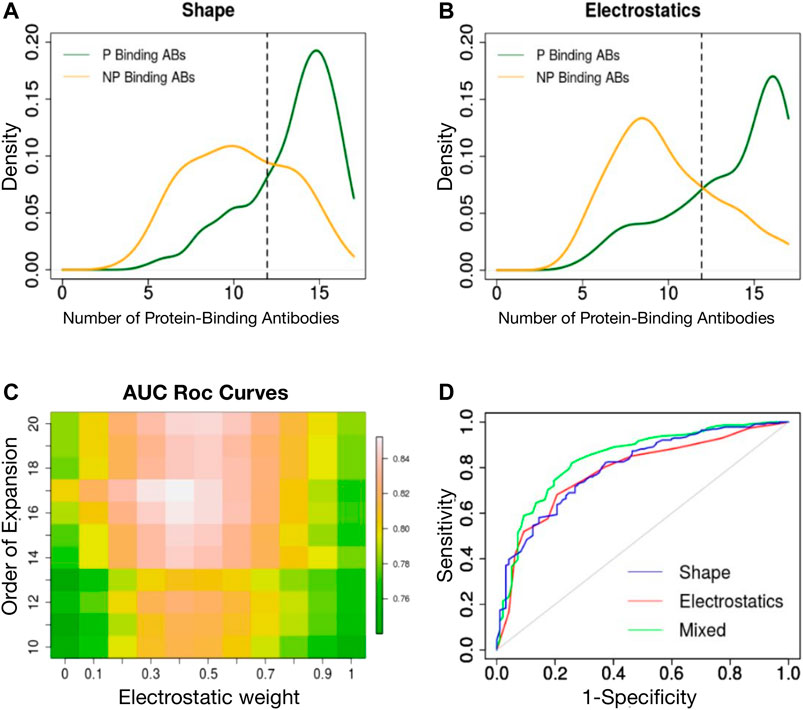
FIGURE 2. (A) Density distribution of protein binding antibodies (Npb) in the neighbours set of protein binding (green curve) and non-protein binding antibodies (orange curve) based on surface shape similarity. (B) Density distribution of protein binding antibodies (Npb) in the neighbours set of protein binding (green curve) and non-protein binding antibodies (orange curve) based on electrostatic surface similarity. (C) Classification performance (ROC AUC) is reported as a function of the order n of the Zernike expansion and weight of the average. (D) ROC curve of the best classifier based on shape 3DZD (blue curve), electrostatic 3DZD (red curve) and weighted average Npb (green curve).
We next analyzed the performance of each descriptor in classifying the CDRs as a function of the antigen type, using a leave-one-out approach. In summary, for each CDR, if the Npb was greater than Ex (Npb) the CDR was labeled as protein-binding, non protein-binding otherwise. The obtained classification accuracy for the shape and electrostatic descriptors at order n = 20 is 75 and 73%, respectively. Using a Receiver Operating Curve (ROC) analysis, both descriptors achieved an Area Under the Curve (AUC) of 0.78. We next analyzed the classification performance when assigning the class label based on the weighted contribution of shape and electrostatics, as follows:
where
3.2 CDRs vs. Antibody Paratope
The sequence and structure analysis of antibodies, as well as antibody engineering experiments, crucially rely on the precise identification of the CDRs from the antibody sequence (Chothia and Lesk, 1987; Chothia et al., 1989; Kabat et al., 1992; MacCallum et al., 1996; Lefranc, 2011). On the other hand, it is well known that the CDRs only provide a proxy of the actual antigen-binding site, i.e. the antibody paratope (Kunik et al., 2012; Olimpieri et al., 2013). Indeed, early studies showed that only 20–30% of residues within the CDRs are directly involved in the interaction with the antigen (Padlan, 1994; Sela-Culang et al., 2013). To quantify to what extent this approximation affects our predictions, we analyzed the classification performance as a function of distance from the center of the antibody-antigen interface. For each Antibody-Antigen complex, we defined a centerpoint, b, as the centroid of the 10 interface atoms of the antibody closer to the antigen and computed the 3DZD for increasing concentric shells around b.
We then applied the same classification procedure as described previously, by fixing the order n = 20 for both shape and electrostatic 3DZD. The results are shown in Figure 3 where the ROC AUC of the individual classifiers are reported as a function of the percentage of the CDR surface included in the analysis.
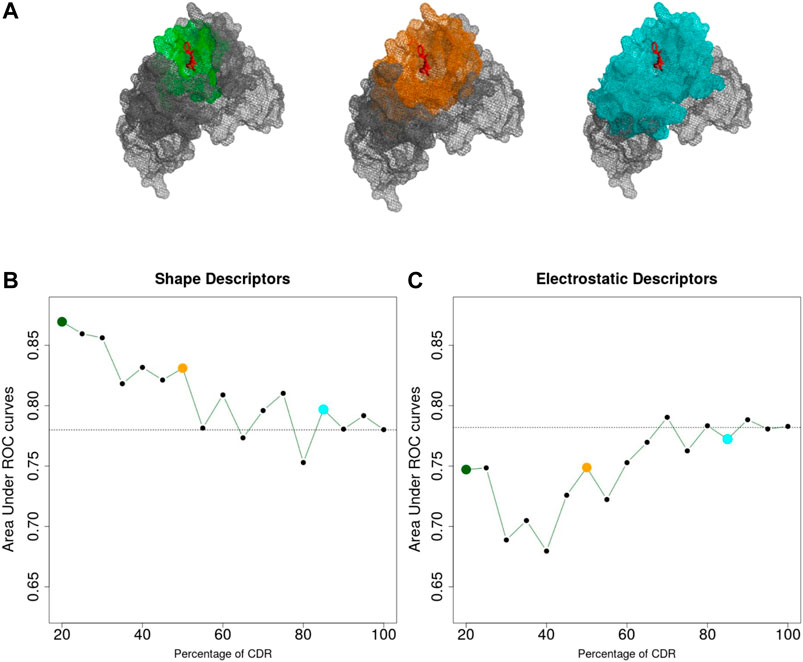
FIGURE 3. (A) Portion of the CDR surface used for classification. (B,C) Area Under the ROC Curve achieved considering different portions of the CDR, based on shape (B) and electrostatics (C) 3DZD descriptors. Dashed lines indicate the performances obtained considering the entire CDR surface (AUC = 0.78 for both descriptors).
As it can be noticed in Figure 3B, the performance of the shape-based classifier shows a maximum when the selected surface region around b extends up to including 20% of the CDRs (ROC AUC = 0.88) followed by a linear decrease when larger surfaces are considered. These results are consistent with the previous notion that shape recognition of the antigen is largely mediated by smaller interacting surfaces contained within the CDR, i.e. the antibody paratope. In summary, while the overall CDR surface can inform about the function of the antibody, this analysis highlights that the information of the paratope can significantly increase our ability to predict antibody specificity. On the other hand, in Figure 3C, the classification performance based on the electrostatic descriptor shows a different trend. Indeed, while the classifier shows an overall lower performance compared to the shape-based classifier, performance increases when larger CDR surfaces are considered, reaching a maximum when almost the entire CDR surface is included in the analysis.
3.3 Geometric and Electrostatic Complementarity of Antibody-Antigen Interfaces
A key feature of the 3DZD description is that it is invariant under rotation and translation of the represented surface. This implies that two interacting protein regions with perfect surface complementarity yield identical sets of 3DZD descriptors (Venkatraman et al., 2009a). In line with this principle, here we focus on the application of 3DZD to the analysis of surface complementarity between antibody CDRs and their cognate protein antigens (Details in Methods). The results are shown in Figure 4, where the average surface shape and electrostatic complementarity computed on 229 antibody-antigen complexes are reported as a function of the interaction cutoff distance between the antibody and the antigen, and the order n of the series expansion. As expected, shape complementarity decreases at higher values of the cutoff distance, i.e. as regions of the antibody/antigen that are distant from the interaction interface are progressively included in the analysis. On the other hand, electrostatic complementarity increases at higher distances, reaching a maximum when the distance cutoff is
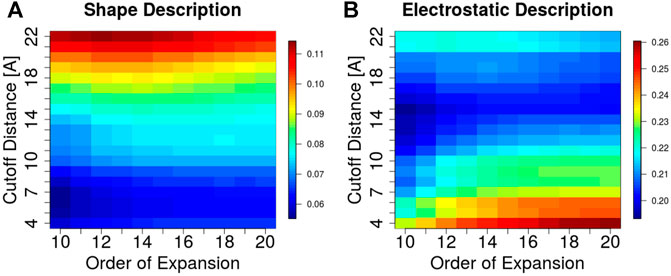
FIGURE 4. Surface complementarity of antibody-antigen interacting surfaces based on shape (A) and electrostatic (B) 3DZD descriptors as a function of the interaction cutoff distance (y-axis) and order n of the series expansion (x-axis).
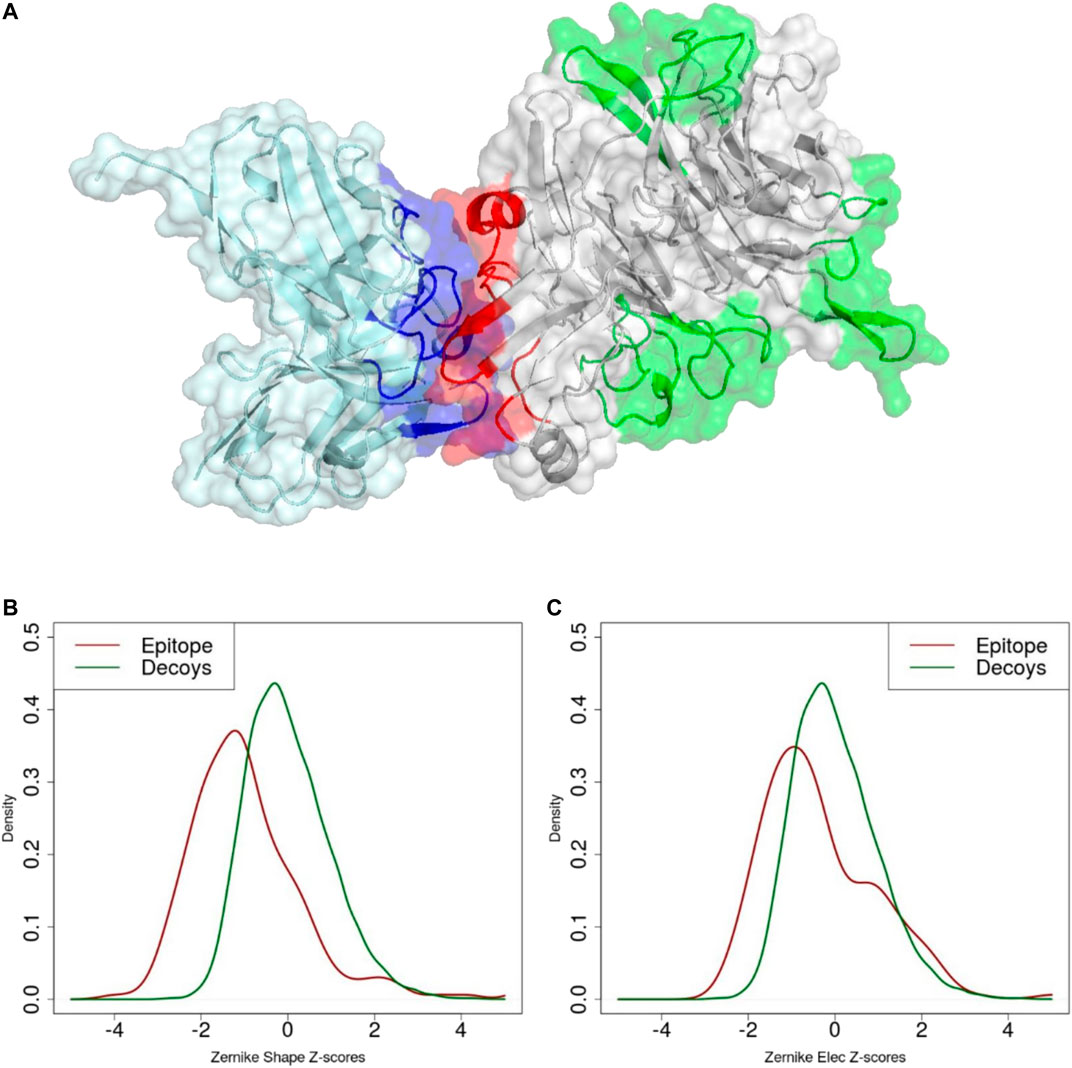
FIGURE 5. (A) Molecular representation of experimental paratope (blue), experimental epitope (red) and decoys (green). Z-score distribution of (B) shape and (C) electrostatic surface complementarity based on the 3DZD descriptors between paratope-epitope (red) and paratope-decoy surfaces (green).
4 Discussions
In this work we describe a computational protocol based on the 3D Zernike descriptors formalism, which allows a fast, superposition-free comparison of molecular surfaces, and has been applied here to the study of the interacting regions of the antibodies and their cognate antigens. The method represents a significant upgrade compared to our previous implementation (Di Rienzo et al., 2017) as it includes two relevant modifications found to improve its performance, namely, the selection of the molecular patch of interest and the description of its electrostatic properties. Using this new version of the method we are able to classify the antibodies according to the nature of their recognized antigens with a classification performance of 81%. Notably, the method only takes as input the information of the antibody CDR surface. However, when the analysis is restricted to the CDR surface that is in direct contact with the antigen, i.e. the antibody paratope, the classifier based on the shape 3DZD descriptor alone reaches a maximum performance of AUC = 0.88.
As 3DZD descriptors are roto-translation invariant, they are also adept at capturing and quantifying surface complementarity at protein-protein interfaces (Venkatraman et al., 2009a). Here we exploit this property to study the surface shape and electrostatic complementarity between antibody CDRs and their bound protein antigens. Our results indicate that maximum surface shape complementarity is achieved at the docking interface, i.e. at 4 to 8 Angstrom distance cutoff between antibody and antigen residues, and decreases when larger distance cutoffs are considered. In contrast, electrostatic complementarity increases at larger distance cutoffs, reaching a maximum between 14 and 17 Å. For both descriptors, results are consistent at different orders n of the series expansion. Hence, we tested the ability of the surface complementarity metric in recognising antigenic surface epitopes among a set of non-epitope, solvent exposed regions of the antigen, i.e. surface decoys. Notably, while in terms of surface size, solvent accessibility and amino acid composition the selected surface decoys are not distinguishable from true epitopes, they display significantly lower surface complementarity to the paratope. Indeed, when the 3DZD-based complementarity metric is used to select the correct paratope-epitope pair among a set of surface decoys, we show that shape complementarity alone can lead to a prediction performance of ROC AUC = 0.75. These results show that 3DZD provide a valid quantitative metric for the analysis of surface complementarity at the antibody-antigen interface, which is expected to find applications in many areas, including the identification and design of optimal antibody-antigen interfaces.
Data Availability Statement
The original contributions presented in the study are included in the article/Supplementary Material, further inquiries can be directed to the corresponding author.
Author Contributions
RL contributed to conception and design of the study. LDR collected the datasets, wrote the software and performed the analyses. EM and GR contributed to analysis and interpretation of the results. RL and LDR wrote the first draft of the manuscript. All authors contributed to manuscript revision, read, and approved the submitted version.
Conflict of Interest
The authors declare that the research was conducted in the absence of any commercial or financial relationships that could be construed as a potential conflict of interest.
Publisher’s Note
All claims expressed in this article are solely those of the authors and do not necessarily represent those of their affiliated organizations, or those of the publisher, the editors and the reviewers. Any product that may be evaluated in this article, or claim that may be made by its manufacturer, is not guaranteed or endorsed by the publisher.
Supplementary Material
The Supplementary Material for this article can be found online at: https://www.frontiersin.org/articles/10.3389/fmolb.2021.749784/full#supplementary-material
References
Abhinandan, K. R., and Martin, A. C. R. (2010). Analysis and Prediction of VH/VL Packing in Antibodies. Protein Eng. Des. Selection 23 (9), 689–697. doi:10.1093/protein/gzq043
Abraham, M. J., Murtola, T., Schulz, R., Páll, S., Smith, J. C., Hess, B., et al. (2015). Gromacs: High Performance Molecular Simulations through Multi-Level Parallelism from Laptops to Supercomputers. SoftwareX 1-2, 19–25. doi:10.1016/j.softx.2015.06.001
Alba, J., Di Rienzo, L., Milanetti, E., Acuto, O., and D’Abramo, M. (2020). Molecular Dynamics Simulations Reveal Canonical Conformations in Different Pmhc/tcr Interactions. Cells 9 (4), 942. doi:10.3390/cells9040942
Canterakis, N. (1999).3d Zernike Moments and Zernike Affine Invariants for 3d Image Analysis and Recognition. In Proceedings of the 11th Scandinavian Conference on Image Analysis, Kangerlusssuaq, Greenland, June 7–11, 1999. Pattern Recognition Society of Denmark.
Chailyan, A., Marcatili, P., Cirillo, D., and Tramontano, A. (2011). Structural Repertoire of Immunoglobulin λ Light Chains. Proteins 79 (5), 1513–1524. doi:10.1002/prot.22979
Chikhi, R., Sael, L., and Kihara, D. (2010). Real-time Ligand Binding Pocket Database Search Using Local Surface Descriptors. Proteins 78 (9), 2007–2028. doi:10.1002/prot.22715
Chothia, C., Gelfand, I., and Kister, A. (1998). Structural Determinants in the Sequences of Immunoglobulin Variable Domain 1 1Edited by A. R. Fersht. J. Mol. Biol. 278 (2), 457–479. doi:10.1006/jmbi.1998.1653
Chothia, C., and Lesk, A. M. (1987). Canonical Structures for the Hypervariable Regions of Immunoglobulins. J. Mol. Biol. 196 (4), 901–917. doi:10.1016/0022-2836(87)90412-8
Chothia, C., Lesk, A. M., Gherardi, E., Tomlinson, I. M., Walter, G., Marks, J. D., et al. (1992). Structural Repertoire of the Human Vh Segments. J. Mol. Biol. 227 (3), 799–817. doi:10.1016/0022-2836(92)90224-8
Chothia, C., Lesk, A. M., Tramontano, A., Levitt, M., Smith-Gill, S. J., Air, G., et al. (1989). Conformations of Immunoglobulin Hypervariable Regions. Nature 342 (6252), 877–883. doi:10.1038/342877a0
Chothia, C., Novotný, J., Bruccoleri, R., and Karplus, M. (1985). Domain Association in Immunoglobulin Molecules. J. Mol. Biol. 186 (3), 651–663. doi:10.1016/0022-2836(85)90137-8
Collis, A. V. J., Brouwer, A. P., and Martin, A. C. R. (2003). Analysis of the Antigen Combining Site: Correlations between Length and Sequence Composition of the Hypervariable Loops and the Nature of the Antigen. J. Mol. Biol. 325 (2), 337–354. doi:10.1016/s0022-2836(02)01222-6
Connolly, M. L. (1983). Analytical Molecular Surface Calculation. J. Appl. Cryst. 16 (5), 548–558. doi:10.1107/s0021889883010985
Daberdaku, S., and Ferrari, C. (2019). Antibody Interface Prediction with 3d Zernike Descriptors and Svm. Bioinformatics 35 (11), 1870–1876. doi:10.1093/bioinformatics/bty918
Daberdaku, S., and Ferrari, C. (2018). Exploring the Potential of 3D Zernike Descriptors and SVM for Protein-Protein Interface Prediction. BMC bioinformatics 19 (1), 35. doi:10.1186/s12859-018-2043-3
De Wildt, R. M. T., Hoet, R. M. A., van Venrooij, W. J., Tomlinson, I. M., and Winter, G. (1999). Analysis of Heavy and Light Chain Pairings Indicates that Receptor Editing Shapes the Human Antibody Repertoire. J. Mol. Biol. 285 (3), 895–901. doi:10.1006/jmbi.1998.2396
Decanniere, K., Muyldermans, S., and Wyns, L. (2000). Canonical Antigen-Binding Loop Structures in Immunoglobulins: More Structures, More Canonical Classes. J. Mol. Biol. 300 (1), 83–91. doi:10.1006/jmbi.2000.3839
Di Rienzo, L., Milanetti, E., Alba, J., and D’Abramo, M. (2020). Quantitative Characterization of Binding Pockets and Binding Complementarity by Means of Zernike Descriptors. J. Chem. Inf. Model. 60 (3), 1390–1398. doi:10.1021/acs.jcim.9b01066
Di Rienzo, L., Milanetti, E., Lepore, R., Olimpieri, P. P., and Tramontano, A. (2017). Superposition-free Comparison and Clustering of Antibody Binding Sites: Implications for the Prediction of the Nature of Their Antigen. Sci. Rep. 7, 45053. doi:10.1038/srep45053
Dolinsky, T. J., Nielsen, J. E., McCammon, J. A., and Baker, N. A. (2004). PDB2PQR: an Automated Pipeline for the Setup of Poisson-Boltzmann Electrostatics Calculations. Nucleic Acids Res. 32 (Suppl. l_2), W665–W667. doi:10.1093/nar/gkh381
Dunbar, J., Fuchs, A., Shi, J., and Deane, C. M. (2013). ABangle: Characterising the VH-VL Orientation in Antibodies. Protein Eng. Des. Selection 26 (10), 611–620. doi:10.1093/protein/gzt020
Dunbar, J., Krawczyk, K., Leem, J., Baker, T., Fuchs, A., Georges, G., et al. (2013). Sabdab: the Structural Antibody Database. Nucl. Acids Res. 42 (D1), D1140–D1146. doi:10.1093/nar/gkt1043
Dunbar, J., Krawczyk, K., Leem, J., Marks, C., Nowak, J., Regep, C., et al. (2016). Sabpred: a Structure-Based Antibody Prediction Server. Nucleic Acids Res. 44 (W1), W474–W478. doi:10.1093/nar/gkw361
Fogolari, F., Corazza, A., Yarra, V., Jalaru, A., Viglino, P., and Esposito, G. (2012). Bluues: a Program for the Analysis of the Electrostatic Properties of Proteins Based on Generalized Born Radii. BMC bioinformatics 13 Suppl. 4 (4), S18. doi:10.1186/1471-2105-13-S4-S18
Foote, J., and Winter, G. (1992). Antibody Framework Residues Affecting the Conformation of the Hypervariable Loops. J. Mol. Biol. 224 (2), 487–499. doi:10.1016/0022-2836(92)91010-m
Gabb, H. A., Jackson, R. M., and Sternberg, M. J. E. (1997). Modelling Protein Docking Using Shape Complementarity, Electrostatics and Biochemical Information 1 1Edited by J. Thornton. J. Mol. Biol. 272 (1), 106–120. doi:10.1006/jmbi.1997.1203
Grandison, S., Roberts, C., and Morris, R. J. (2009). The Application of 3D Zernike Moments for the Description of "Model-free" Molecular Structure, Functional Motion, and Structural Reliability. J. Comput. Biol. 16 (3), 487–500. doi:10.1089/cmb.2008.0083
Grant, B. J., Rodrigues, A. P. C., ElSawy, K. M., McCammon, J. A., and Caves, L. S. D. (2006). Bio3d: an R Package for the Comparative Analysis of Protein Structures. Bioinformatics 22 (21), 2695–2696. doi:10.1093/bioinformatics/btl461
Habel, K., Grasman, R., Gramacy, R. B., Mozharovskyi, P., and Sterratt, D. C. (2019). Geometry: Mesh Generation and Surface Tessellation, R Package. Available at: https://CRAN.R-project.org/package=geometry.
Jayaram, N., Bhowmick, P., and Martin, A. C. R. (2012). Germline VH/VL Pairing in Antibodies. Protein Eng. Des. Selection 25 (10), 523–530. doi:10.1093/protein/gzs043
Jones, S., and Thornton, J. M. (1996). Principles of Protein-Protein Interactions. Proc. Natl. Acad. Sci. 93 (1), 13–20. doi:10.1073/pnas.93.1.13
Kabat, E. A., Te Wu, T., Perry, H. M., Foeller, C., and Gottesman, K. S. (1992). Sequences of Proteins of Immunological Interest. Darby, PA: DIANE publishing Co.
Kihara, D., Sael, L., Chikhi, R., and Esquivel-Rodriguez, J. (2011). Molecular Surface Representation Using 3d Zernike Descriptors for Protein Shape Comparison and Docking. Cpps 12 (6), 520–530. doi:10.2174/138920311796957612
Kunik, V., Ashkenazi, S., and Ofran, Y. (2012). Paratome: an Online Tool for Systematic Identification of Antigen-Binding Regions in Antibodies Based on Sequence or Structure. Nucleic Acids Res. 40 (W1), W521–W524. doi:10.1093/nar/gks480
Kuroda, D., and Gray, J. J. (2016). Shape Complementarity and Hydrogen Bond Preferences in Protein-Protein Interfaces: Implications for Antibody Modeling and Protein-Protein Docking. Bioinformatics 32 (16), 2451–2456. doi:10.1093/bioinformatics/btw197
Lee, B., and Richards, F. M. (1971). The Interpretation of Protein Structures: Estimation of Static Accessibility. J. Mol. Biol. 55 (3), 379–IN4. doi:10.1016/0022-2836(71)90324-x
Lee, M., Lloyd, P., Zhang, X., Schallhorn, J. M., Sugimoto, K., Leach, A. G., et al. (2006). Shapes of Antibody Binding Sites: Qualitative and Quantitative Analyses Based on a Geomorphic Classification Scheme. J. Org. Chem. 71 (14), 5082–5092. doi:10.1021/jo052659z
Leicester, S. E., Finney, J. L., and Bywater, R. P. (1988). Description of Molecular Surface Shape Using Fourier Descriptors. J. Mol. Graphics 6 (2), 104–108. doi:10.1016/0263-7855(88)85008-2
Lepore, R., Olimpieri, P. P., Messih, M. A., and Tramontano, A. (2017). Pigspro: Prediction of Immunoglobulin Structures V2. Nucleic Acids Res. 45 (W1), W17–W23. doi:10.1093/nar/gkx334
Li, N., Sun, Z., and Jiang, F. (2007). SOFTDOCK Application to Protein-Protein Interaction Benchmark and CAPRI. Proteins 69 (4), 801–808. doi:10.1002/prot.21728
MacCallum, R. M., Martin, A. C. R., and Thornton, J. M. (1996). Antibody-antigen Interactions: Contact Analysis and Binding Site Topography. J. Mol. Biol. 262 (5), 732–745. doi:10.1006/jmbi.1996.0548
Marcatili, P., Olimpieri, P. P., Chailyan, A., and Tramontano, A. (2014). Antibody Modeling Using the Prediction of ImmunoGlobulin Structure (PIGS) Web Server. Nat. Protoc. 9 (12), 2771–2783. doi:10.1038/nprot.2014.189
Martin, A. C. R., and Thornton, J. M. (1996). Structural Families in Loops of Homologous Proteins: Automatic Classification, Modelling and Application to Antibodies. J. Mol. Biol. 263 (5), 800–815. doi:10.1006/jmbi.1996.0617
Max, N. L., and Getzoff, E. D. (1988). Spherical Harmonic Molecular Surfaces. IEEE Comput. Grap. Appl. 8 (4), 42–50. doi:10.1109/38.7748
Messih, M. A., Lepore, R., Marcatili, P., and Tramontano, A. (2014). Improving the Accuracy of the Structure Prediction of the Third Hypervariable Loop of the Heavy Chains of Antibodies. Bioinformatics 30 (19), 2733–2740. doi:10.1093/bioinformatics/btu194
Meyer, D., and Buchta, C. (2019). Proxy: Distance and Similarity Measures, R Package Version 0, 4–23. Available at: https://CRAN.R-project.org/package=proxy.
Ming-Kuei Hu, M.-K. (1962). Visual Pattern Recognition by Moment Invariants. IEEE Trans. Inform. Theor. 8 (2), 179–187. doi:10.1109/tit.1962.1057692
Mitra, P., and Pal, D. (2010). New Measures for Estimating Surface Complementarity and Packing at Protein-Protein Interfaces. FEBS Lett. 584 (6), 1163–1168. doi:10.1016/j.febslet.2010.02.021
Norel, R., Lin, S. L., Wolfson, H. J., and Nussinov, R. (1995). Molecular Surface Complementarity at Protein-Protein Interfaces: the Critical Role Played by Surface Normals at Well Placed, Sparse, Points in Docking. J. Mol. Biol. 252 (2), 263–273. doi:10.1006/jmbi.1995.0493
North, B., Lehmann, A., and Dunbrack, R. L. (2011). A New Clustering of Antibody Cdr Loop Conformations. J. Mol. Biol. 406 (2), 228–256. doi:10.1016/j.jmb.2010.10.030
Novotni, M., and Klein, R. (2004). Shape Retrieval Using 3d Zernike Descriptors. Computer-Aided Des. 36 (11), 1047–1062. doi:10.1016/j.cad.2004.01.005
Olimpieri, P. P., Chailyan, A., Tramontano, A., and Marcatili, P. (2013). Prediction of Site-specific Interactions in Antibody-Antigen Complexes: the Proabc Method and Server. Bioinformatics 29 (18), 2285–2291. doi:10.1093/bioinformatics/btt369
Padlan, E. A. (1994). Anatomy of the Antibody Molecule. Mol. Immunol. 31 (3), 169–217. doi:10.1016/0161-5890(94)90001-9
Pollard, A. J., and Bijker, E. M. (2020). A Guide to Vaccinology: from Basic Principles to New Developments. Nat. Rev. Immunol., 1–18. doi:10.1038/s41577-020-00479-7
Raghunathan, G., Smart, J., Williams, J., and Almagro, J. C. (2012). Antigen-binding Site Anatomy and Somatic Mutations in Antibodies that Recognize Different Types of Antigens. J. Mol. Recognit. 25 (3), 103–113. doi:10.1002/jmr.2158
Sela-Culang, I., Kunik, V., and Ofran, Y. (2013). The Structural Basis of Antibody-Antigen Recognition. Front. Immunol. 4, 302. doi:10.3389/fimmu.2013.00302
Tien, M. Z., Meyer, A. G., Sydykova, D. K., Spielman, S. J., and Wilke, C. O. (2013). Maximum Allowed Solvent Accessibilites of Residues in Proteins. PloS one 8 (11), e80635. doi:10.1371/journal.pone.0080635
Tomlinson, I. M., Cox, J. P., Gherardi, E., Lesk, A. M., and Chothia, C. (1995). The Structural Repertoire of the Human V Kappa Domain. EMBO J. 14 (18), 4628–4638. doi:10.1002/j.1460-2075.1995.tb00142.x
Tramontano, A., Chothia, C., and Lesk, A. M. (1990). Framework Residue 71 Is a Major Determinant of the Position and Conformation of the Second Hypervariable Region in the Vh Domains of Immunoglobulins. J. Mol. Biol. 215 (1), 175–182. doi:10.1016/s0022-2836(05)80102-0
Vargas-Madrazo, E., and Paz-García, E. (2002). Modifications to Canonical Structure Sequence Patterns: Analysis for L1 and L3. Proteins 47 (2), 250–254. doi:10.1002/prot.10187
Venkatraman, V., Sael, L., and Kihara, D. (2009). Potential for Protein Surface Shape Analysis Using Spherical Harmonics and 3d Zernike Descriptors. Cell Biochem Biophys 54 (1-3), 23–32. doi:10.1007/s12013-009-9051-x
Venkatraman, V., Yang, Y. D., Sael, L., and Kihara, D. (2009). Protein-protein Docking Using Region-Based 3d Zernike Descriptors. BMC bioinformatics 10 (1), 407. doi:10.1186/1471-2105-10-407
Via, A., Ferrè, F., Brannetti, B., and Helmer-Citterich*, M. (2000). Protein Surface Similarities: a Survey of Methods to Describe and Compare Protein Surfaces. Cmls, Cel. Mol. Life Sci. 57 (13), 1970–1977. doi:10.1007/pl00000677
Walls, P. H., and Sternberg, M. J. E. (1992). New Algorithm to Model Protein-Protein Recognition Based on Surface Complementarity. J. Mol. Biol. 228 (1), 277–297. doi:10.1016/0022-2836(92)90506-f
Webster, D. M., Henry, A. H., and Rees, A. R. (1994). Antibody-antigen Interactions. Curr. Opin. Struct. Biol. 4 (1), 123–129. doi:10.1016/s0959-440x(94)90070-1
Weitzner, B. D., Jeliazkov, J. R., Lyskov, S., Marze, N., Kuroda, D., Frick, R., et al. (2017). Modeling and Docking of Antibody Structures with Rosetta. Nat. Protoc. 12 (2), 401–416. doi:10.1038/nprot.2016.180
Whitelegg, N. R. J., and Rees, A. R. (2000). Wam: an Improved Algorithm for Modelling Antibodies on the Web. Protein Eng. 13 (12), 819–824. doi:10.1093/protein/13.12.819
Keywords: surface complementarity, antibody complementarity determining regions, antibody—antigen complex, antigen recognition, zernike polynomials
Citation: Di Rienzo L, Milanetti E, Ruocco G and Lepore R (2021) Quantitative Description of Surface Complementarity of Antibody-Antigen Interfaces. Front. Mol. Biosci. 8:749784. doi: 10.3389/fmolb.2021.749784
Received: 29 July 2021; Accepted: 14 September 2021;
Published: 30 September 2021.
Edited by:
Yong Wang, Zhejiang University, ChinaCopyright © 2021 Di Rienzo, Milanetti, Ruocco and Lepore. This is an open-access article distributed under the terms of the Creative Commons Attribution License (CC BY). The use, distribution or reproduction in other forums is permitted, provided the original author(s) and the copyright owner(s) are credited and that the original publication in this journal is cited, in accordance with accepted academic practice. No use, distribution or reproduction is permitted which does not comply with these terms.
*Correspondence: Rosalba Lepore, cm9zYWxiYS5sZXBvcmVAdW5pYmFzLmNo