 Sonja Langthaler1
 Christian Zumpf1
 Theresa Rienmüller1
 Niroj Shrestha1,2
 Julia Fuchs1,3
 Rui Zhou1
 Brigitte Pelzmann2
 Klaus Zorn-Pauly2
 Eleonore Fröhlich4
 Seth H. Weinberg5,6
 Christian Baumgartner1*
- 1Institute of Health Care Engineering with European Testing Center for Medical Devices, Graz University of Technology, Graz, Austria
- 2Gottfried Schatz Research Center for Cell Signaling, Metabolism and Aging, Medical University of Graz, Graz, Austria
- 3Research Unit on Cell Biology, Histology and Embryology, Gottfried Schatz Research Center for Cell Signaling, Metabolism and Aging, Medical University of Graz, Graz, Austria
- 4Center for Medical Research, Medical University of Graz, Graz, Austria
- 5Department of Biomedical Engineering, The Ohio State University, Columbus, OH, United States
- 6Davis Heart and Lung Research Institute, The Ohio State University Wexner Medical Center, Columbus, OH, United States
Introduction: Advances in molecular targeting of ion channels may open up new avenues for therapeutic approaches in cancer based on the cells’ bioelectric properties. In addition to in-vitro or in-vivo models, in silico models can provide deeper insight into the complex role of electrophysiology in cancer and reveal the impact of altered ion channel expression and the membrane potential on malignant processes. The A549 in silico model is the first computational cancer whole-cell ion current model that simulates the bioelectric mechanisms of the human non-small cell lung cancer cell line A549 during the different phases of the cell cycle. This work extends the existing model with a detailed mathematical description of the store-operated Ca2+ entry (SOCE) and the complex local intracellular calcium dynamics, which significantly affect the entire electrophysiological properties of the cell and regulate cell cycle progression.
Methods: The initial model was extended by a multicompartmental approach, addressing the heterogenous calcium profile and dynamics in the ER-PM junction provoked by local calcium entry of store-operated calcium channels (SOCs) and uptake by SERCA pumps. Changes of cytosolic calcium levels due to diffusion from the ER-PM junction, release from the ER by RyR channels and IP3 receptors, as well as corresponding PM channels were simulated and the dynamics evaluated based on calcium imaging data. The model parameters were fitted to available data from two published experimental studies, showing the function of CRAC channels and indirectly of IP3R, RyR and PMCA via changes of the cytosolic calcium levels.
Results: The proposed calcium description accurately reproduces the dynamics of calcium imaging data and simulates the SOCE mechanisms. In addition, simulations of the combined A549-SOCE model in distinct phases of the cell cycle demonstrate how Ca2+ - dynamics influence responding channels such as KCa, and consequently modulate the membrane potential accordingly.
Discussion: Local calcium distribution and time evolution in microdomains of the cell significantly impact the overall electrophysiological properties and exert control over cell cycle progression. By providing a more profound description, the extended A549-SOCE model represents an important step on the route towards a valid model for oncological research and in silico supported development of novel therapeutic strategies.
1 Introduction
Ion transport across the cell and intracellular membranes through channels and carriers is involved in the regulation of survival, proliferation, death, and motility of cancer cells. Ca2+ ions play a fundamental role in a variety of intracellular signaling pathways that regulate cell proliferation, metabolism, excitability and contractability, exocytosis, gene transcription and expression. At rest, the cytosolic Ca2+ concentration [Ca2+]Cyt is typically maintained low at around 100 nM, compared with the extracellular space with [Ca2+]Ext > 1 mM and intracellular Ca2+ stores, such as the endoplasmic reticulum (ER) with [Ca2+]ER > 100 µM (Bong and Monteith, 2018). A significant portion of intracellular Ca2+ is not free but is bound to numerous calcium binding proteins that can function as Ca2+ sensors, Ca2+ buffers or both. Some of the important Ca2+ buffers include calmodulin (CaM) in the cytosol, and calsequestrin (CSQ) and calreticulin in the ER (Islam, 2020).
In the context of the cell cycle, Ca2+ is crucial for regulating important steps such as DNA synthesis, cell cycle checkpoints, and phase transitions. During the G1 phase, for example, it modulates the transcription of immediate early genes necessary for cell proliferation and activates the cyclin-dependent protein kinases (CDKs) in association with their regulators, the cyclins, which, after a series of intermediate reactions, allow the transition from cell cycle phase G1 to S (Humeau et al., 2018). Therefore, maintaining balanced Ca2+ levels within intracellular compartments is crucial for the proper cell function and life cycle (Roderick and Cook, 2008). To enable controlled Ca2+ entry and release, each cell has a unique expression pattern of calcium regulating agents that determine its calcium homeostasis (Islam, 2020). The main players in calcium signaling include ion channels, which act as gatekeepers for Ca2+ entry into cells and regulate calcium exchange in different compartments. While voltage-gated calcium channels are a characteristic feature of excitable cells, ligand-gated calcium channels occur predominantly in non-excitable cells (Kozak and Putney, 2018). Store-operated calcium entry (SOCE) is one of the most important calcium entry pathways in non-excitable cells, and shows distinct behavior throughout the cell cycle. Exemplarily it is upregulated in G1/S transition and downregulated from S to G2/M phase (Chen et al., 2016; Hodeify et al., 2018). Although the molecular mechanism is not yet fully understood in detail (Islam, 2020), Ca2+ depletion from the endoplasmic reticulum (ER), induced by inositol 1,4,5 trisphosphate receptor (IP3R) and ryanodine receptor (RyR), triggers the SOCE mechanism to replenish the ER with Ca2+ and maintain Ca2+ signaling in the cytoplasm (Hogan, 2015). The two major SOCE proteins are the calcium-sensitive Stromal Interaction Molecule 1 (STIM1) on the ER membrane and the ORAI1 channel pore on the plasma membrane (PM) (Zheng et al., 2015), which together form the calcium release activated calcium (CRAC) channels that regulate Ca2+ influx across the PM into the cytosol. Incoming Ca2+ via CRAC channels binds to calmodulin to regulate downstream expression of cytokines, transcription factors, and enzymes, which in turn govern proliferation, differentiation, metabolism, mast cell degranulation or cytotoxicity (Hodeify et al., 2018; Vaeth and Feske, 2018). Other imported channels in Ca2+ exchange are the sarco/endoplasmic reticulum Ca2+ ATPase (SERCA) and the plasma membrane Ca2+ ATPase (PMCA), which pump Ca2+ from the cytoplasm into the ER and the extracellular space respectively (Liu, 2012; Liu, 2012).
Cancer cells exhibit altered ion channel expression or activity, which is closely linked to tumor development and progression (Kunzelmann, 2005; Schönherr, 2005; Fiske et al., 2006; Litan and Langhans, 2015; Brackenbury, 2016; Leanza et al., 2016). In particular, calcium channels involving ORAI and STIM, transient receptor potential (TRP) channels, as well as voltage-gated calcium (CaV) channels are reported to promote proliferation in various cancer types, for example the upregulated expression of ORAI3 and TRPV6 channels are known to enhance proliferation rates in prostate or breast cancer (Pinto et al., 2015; Dubois et al., 2014; Lehen’Kyi et al., 2007). Furthermore, cancer hallmarks such as self-sufficiency in growth signals is highly associated with calcium signaling and upregulation of various calcium channels, whereas reduction of calcium influx by downregulation of calcium channels has been shown to result in insensitivity to antigrowth signals and some resistance to apoptosis (Brackenbury, 2016; Lehen’Kyi et al., 2007; Prevarskaya et al., 2010; Raphaël et al., 2014; Thebault et al., 2006). Changes in ion channel expression consequently affect the membrane potential of the cell, which represents an important bioelectric signal for cell proliferation. In general, proliferating cells often have a more depolarized membrane potential Vm than quiescent cells. As reported in several studies, cells can be induced to enter or exit the cell cycle by external hyper- or depolarization of the membrane, respectively. For example, lowering the membrane potential of proliferating CHO cells has been shown to induce mitotic blockade, while depolarization of quiescent CHO cells can trigger mitosis. Similarly, sustained depolarization initiates DNA synthesis and mitosis in mature neurons, emphasizing Vm as a crucial regulator for the mitotic ability of cells (Cone and Tongier, 1971; Stillwell et al., 1973; Cone and Cone, 1976; Yang and Brackenbury, 2013; Rao et al., 2015). In fact, compared with normal cells, cancer cells typically tend to be more depolarized, which is assumed to trigger DNA-synthesis and mitosis, leading to increased proliferation. Furthermore, during cell cycle progression, the membrane potential undergoes rhythmic oscillations from hyperpolarized to depolarized states, which can trigger the transition and drive cells through the different cell cycle phases, thus serving as a putative bioelectric signal for cell proliferation (Yang and Brackenbury, 2013).
Recent advances in the field of cancer research have focused on targeting specific ion channels involved in tumor development and progression, which opens up promising therapeutic opportunities based on the unique electric properties of cancer cells. However, the intricate and multifaceted nature of the underlying mechanisms, ion channel activation and interactions, and its consequences for membrane potential necessitates a comprehensive and holistic perspective to effectively identify and explore potential key targets. To gain deeper insights into the complex relationship between electrophysiological properties and cancer, in silico models can be a valuable tool to study and understand the impact of altered ion channel expression and abnormal changes in membrane potentials on malignant processes (Langthaler et al., 2021; Baumgartner, 2022). In 2021 we developed the first in silico cell model in cancer electrophysiology using A549 human lung adenocarcinoma cells (Langthaler et al., 2021). This first hidden Markov-based model simulates the rhythmic oscillation of the membrane potential during the cell cycle, allowing a deeper understanding of the electrophysiological mechanisms during cell proliferation. Currently, the model incorporates 11 functionally expressed ion channels of the PM with the respective calcium and voltage dependencies of the individual ion channels. As far as calcium modeling is concerned, the estimation of the calcium concentration in the initial model is based on a simplified approach that assumes a certain steady-state concentration of the cytosol, without taking into account the complex local calcium dynamics within the cell. However, the local calcium distribution and time evolution in the different compartments of the cell are of great importance for the activity of certain types of ion channels and subsequently affect the overall electrical properties of the cell membrane.
In this work, building upon the initial model, we propose an extension that takes into account the complex dynamics of intracellular calcium. For this purpose, the initial model is extended by a multicompartmental approach that addresses the heterogenous calcium profile and dynamics in the ER-PM junction caused by local Ca2+ entry via SOCE and uptake by SERCA pumps. Changes in cytosolic calcium levels due to diffusion from the ER-PM junction, release from the ER by RyR channels and IP3 receptors, and responding PM channels are implemented and the dynamics are assessed using literature and experimental data published elsewhere. The aim of this extension is to establish a comprehensive framework that elucidates the complex interplay between ion channels, intracellular calcium dynamics and electrophysiological processes in non-excitable cancer cells in order to gain a deeper understanding of cell proliferation mechanisms and potentially contribute to the discovery of new therapeutic strategies for cancer treatment.
2 Materials and Methods
The initial A549 in silico model involves three ligand-gated Ca2+ channels of the plasma membrane, the CRACM1, TRPV3 and TRPC6 (Langthaler et al., 2021). These channels enable the Ca2+ influx from the extracellular space into the cytosol. However, there are additional important channels and ion pumps including the sarco/endoplasmic reticulum Ca2+ ATPase (SERCA), which pumps Ca2+ ions from the cytosol into the ER, the plasma membrane Ca2+ ATPase (PMCA), which pumps Ca2+ out of the cell to the extracellular space, the inositol 1,4,5 trisphosphate receptor (IP3R) and the ryanodine receptor (RyR), both releasing Ca2+ from the ER into the cytosol (Liu, 2012), which have not yet been considered in the model. A summary of reported ion channels in the human lung cancer cell line A549, the role and function of the individual ion channels and their impact on electrophysiological properties, and relevance on cell proliferation and tumor progression in A549 cells are provided in the Supplementary Material Part A.
There is a large variety of published models that describe the store-operated calcium entry (SOCE) and calcium dynamics of the ER-PM junction (Kowalewski et al., 2006; Means et al., 2006; Marhl et al., 2008; Liu, 2012; Schmeitz et al., 2013; Eichinger et al., 2018; McIvor et al., 2018), all following the same basic principle of the law of mass balance. The Ca2+-submodel added to the A549 cell model is largely based on the SOCE model described in Liu, 2012.
2.1 The SOCE model
A depiction of the cell and corresponding calcium levels is given in Figure 1. The gating of the CRAC channels and to some extent the pump rate of the SERCA pumps depend on the calcium concentration inside the ER (Liu et al., 2010). The ER in turn is influenced by calcium entry through SERCA pumps, with which the cytosolic calcium concentration changes dynamically and which thus needs a separate description (Schmeitz et al., 2013). Taking the ER-PM junction into account, this results in three necessary calcium domains for a reliable model description. However, a real cell also contains additional important calcium pools such as the mitochondria or lysosomes, which are not considered at this level of abstraction. Additionally, the CRAC current in the SOCE model is assumed to be the only calcium influx into the cell, which however leaves out other calcium channels such as the TRP channels. The calcium pools are designed by the law of mass balance (Liu, 2012) which defines them by the sum of the calcium in- and outflows. All included calcium pools and flows as considered in this modeling approach are summarized in Figure 2.
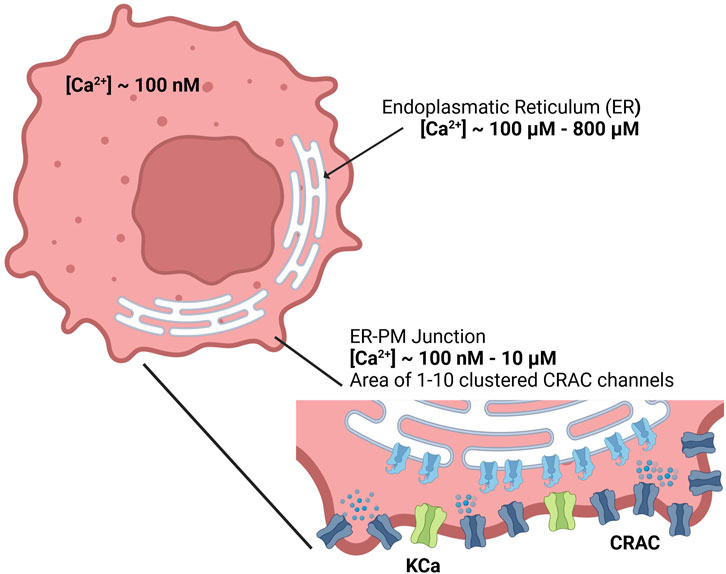
Figure 1. Calcium concentrations of the cytosol, endoplasmic reticulum and the ER-PM junction inside the cell.
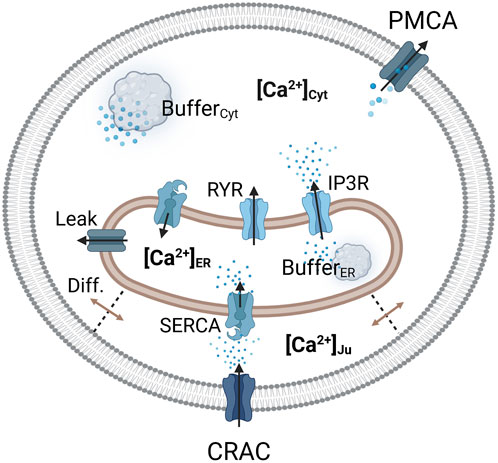
Figure 2. Visualization of the considered Ca2+ compartments and their connections in the SOCE model concept. The CRAC channel is formed by the ORAI1 channel on the PM and STIM1 on the ER membrane.
Calcium enters the cytosol by diffusion from the junction, from the ER via the RyR and IP3R channels, and through an ER calcium leakage. The cytosol is cleared of calcium via the PMCA and the SERCA pumps, which are located in the plasma and ER membrane, respectively. The ER is filled with calcium via SERCA pumps, which are active in the junction and the cytosol, depending on the dynamics of local calcium concentrations. Therefore, two separate SERCA flows for the junction and the cytosol were implemented. The outflow from the ER is facilitated by IP3R channels, RyR channels and the ER leak. The majority of intracellular calcium is bound to calcium storage or buffer proteins (Liu et al., 2010; Islam, 2020). To account for buffered calcium, buffer terms were included for the cytosol and the ER, but not for the junction.
2.1.1 Calcium dynamics in the ER-PM junction
Since detailed knowledge of the ER-PM junction is lacking accurate spatial modeling of the junctional calcium distribution requires certain assumptions. In general, the ER-PM junction is defined as the space between the PM and the ER. Following calcium depletion from the ER via RyR and IP3R channels, ER resident STIM1 proteins undergo conformational change, oligomerize, and translocate to ER-PM junctions, where they cluster to bind and activate the PM-resident ORAI1 channels and form the CRAC channels (see Figure 3A). During this process the STIM1 proteins remain anchored in the ER and cannot fully leave it, which implies that the thickness of the junction is partially limited by the length of the cytosolic STIM1, estimates for which vary between 10 nm to 20 nm (Islam, 2020). The ER does not have a smooth elliptical shape with a single large contact plane to the PM, but has a lamellar structure (Plattner and Hentschel, 2017) that comes into close contact with the PM in many small gaps. The small gaps are referred to as the ER-PM junctions in this work, whereas the sum of all junctions is called the ER-PM micro domain. Based on a detailed spatial approach of the junctional calcium [Ca2+]Jun introduced by McIvor et al., 2018, it can be assumed that [Ca2+]Jun near the PM is roughly at a constantly high level with a spike in the direct vicinity of the CRAC channels and then declines in a linear manner towards the edge of the junction, where it aligns with [Ca2+]Cyt. This is in line with the predictions from Hogan, 2015. Both approaches consider the junction as a single entity directly bounded by the cytosol or cytosolic calcium concentration. In this work, however, it is assumed that the junction is located within the microdomain and is surrounded by other junctions, which reduces the influence of the cytosol. As a consequence, we designed the ER-PM junction as a cylinder with a uniformly distributed calcium concentration inside and the ring surface acting as a diffusion layer with a linear diffusion profile towards Ca2+ cytosol, as shown in Figure 3B.
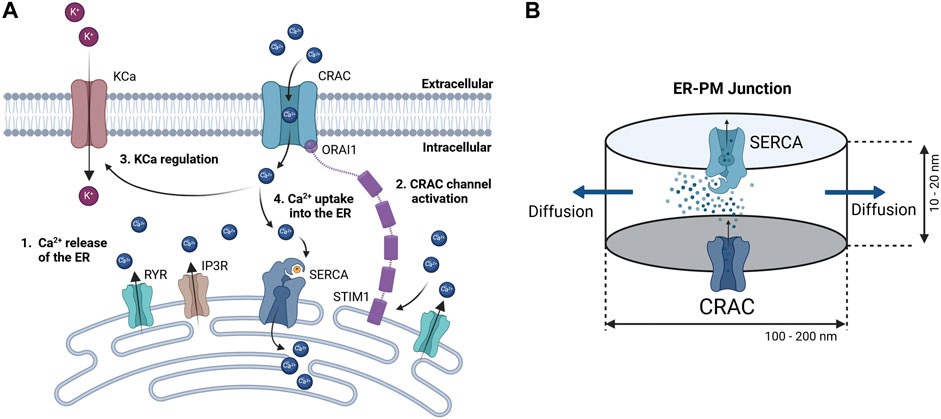
Figure 3. Concept of calcium dynamics in the (A) ER-PM junction and (B) single junction geometry and calcium flows for modeling. The junction is assumed to be a cylinder with CRAC channels at the PM (bottom) side, SERCA pumps at the ER (top) side, and a diffusion flow to the cytosol (lateral area).
Inside the junction only the SERCA pump, the CRAC channels and the diffusion to the cytosol are considered to influence [Ca2+]Jun. All other possible ion channels or calcium binding proteins are not taken into account. With the current available knowledge (Hogan, 2015; McIvor et al., 2018), it is more feasible to directly model the calcium concentration of an individual junction rather than that of the microdomain, as this allows to circumvent the influence of other proteins and the irregularities of the ER surface. There are only estimations of how these junctions are actually shaped or sized. As there are no reports or measures for the junction dimensions of the A549 cell line, the measures are taken from other non-excitable cells instead (Hogan, 2015). The junctions are assumed to have a cylindrical shape, with a height between 10 nm and 20 nm and a diameter of 100 nm–300 nm. In other cell types, the micro domain is estimated to contain roughly 200 to 400 junctions (Hogan, 2015), which serves as a guiding value for this model.
2.1.2 Mathematical description for the SOCE mechanism
The calcium concentrations of the three different compartments, cytosol
The terms Jx denote the calcium flow through the specified channel x, with calcium inflows having a positive sign and calcium outflows having a negative sign. The constants VCyt, VER and VJu are the volumes of the cytosol, ER and junctions respectively, used to scale the ion flux between the domains and nju represents the number of assumed ER-PM junctions. The last terms at the end of Eqs 1, 2 describe the influence of the calcium buffers of the cytosol
Additionally, based on the concept provided by Liu et al. (Liu et al., 2010; Liu, 2012), a Ca2+ leak current Jleak between the ER and the cytosol, with constant flow rate Rleak, driven by the concentration gradient between the ER and the cytosol, is included into the SOCE model:
CRAC channels play a critical role in mediating store-operated calcium entry and are key channels in this process. What distinguishes CRAC channels from others is their property of being both calcium- and voltage-dependent. While many studies tend to focus only on either calcium or voltage dependence, here we consider both aspects in its mathematical description.
with
where R is the universal gas constant, F the Faraday constant, z the elementary charge of Ca2+, T the temperature and [Ca2+]Ext the extracellular calcium concentration.
It is known that CRAC channels are strongly inwardly rectifying under physiological conditions and therefore only allow calcium influx into the cell. To prevent a possible Ca2+ efflux under certain experimental conditions, the driving force is set to zero if an outward CRAC current is to be forced.
If the potential difference is used as driving force in conjunction with the electrical conductance gCRAC, an electric current is obtained according to Eq. 5. This current is then converted into an “ion flux” - using the constant vcccj, which is defined as follows:
where F is the Faraday constant, z the charge of calcium and VJu the volume of the target compartment, which in this case is the junction volume.
The formation of CRAC channels involves the interaction between the STIM1 protein in the endoplasmic reticulum and ORAI pore in the plasma membrane. According to Lui et al. (Liu et al., 2010; Liu, 2012), the activation process can be described in two steps. In the first step, when the endoplasmic concentration of calcium ions decreases, Ca2+ dissociates from STIM1, which leads to the activation of STIM1 (Liu, 2012).
where [STIM1] describes the activated form and [CansSTIM1] the inactivated calcium bound molecule. To simplify the computation, the following relation is used (Liu et al., 2010):
Therefore, the reaction mechanism can be written as follows:
where fs is the binding rate, bs the dissociation rate and ns a positive exponent (Liu et al., 2010). The activated STIM1 then spreads across the ER-PM junction, where it binds to the ORAI pore to form the CRAC channel, which is formulated as follows:
The differential equation for the CRAC channels can be derived similarly to the STIM1 equation.
Since, to our knowledge, no data are available for the total STIM1 and ORAI1 concentration, the initial values for [TotalSTIM1] and [TotalORAI1] are both set to 1. With this setting, the values for STIM1 and CRAC vary from 0 to 1 and can be interpreted as the relative amount of bound or unbound proteins, with the calculated CRAC value corresponding to the dimensionless relative amount of CRAC channels formed. Once the CRAC channels are formed, they are considered to be immediately open, so the CRAC variable indicates the relative number of open CRAC channels (Liu et al., 2010), i.e. the open probability for calculation of the CRAC current according to Eq. 14:
2.1.3 Model parameterization
The parameterization of the model is based on literature data and experimental data published elsewhere. In detail, the gating parameters for the CRAC, IP3R and RyR channel models were taken as stated in the original models (Sneyd and Dufour, 2002; Lee and Keener, 2008; Liu, 2012), with channel conductances or maximum flow rates varied to achieve a proper fit to the available experimental data. For the CRAC channel, the conductance was chosen to be the same as in the initial A549 in silico model (Zweifach and Lewis, 1993; Langthaler et al., 2021). The amount of CRAC channels per junction and the total number of junctions nju are based on literature data (Hogan, 2015; McIvor et al., 2018) and were adjusted to fit the experimental data in Padar et al., 2004; Hou et al., 2011. The parameters for the generic cytosolic buffer term and for the IP3 concentration were taken directly from Liu, 2012. For the calsequestrin buffer, parameters from Shannon et al., 2004 were used and the amount of calsequestrin was adjusted.
Conversion of electrical ion currents to particle flow rates requires the consideration of target volumes. A detailed report on the structure of A549 cells is provided by Jiang et al., 2010, according to which the cell diameter is 10.59–14.93 µm and the cell volume can be estimated to be 1670 μm3. The cellular volume can be divided into 28% nucleus and 72% cytoplasm, which can be roughly further subdivided into 4.6% mitochondria, 2.5% lamellar bodies, 1.39% lysosomes and the remaining cytoplasm. Since there are currently no estimates on the structure or size of the endoplasmic reticulum of the A549 cell, it is assumed that it occupies 5% of the cell volume. Typically, the junction dimensions are a height between 10 nm and 20 nm and a diameter of 100 nm–300 nm. In other cell types the micro domain is estimated to contain roughly 200 to 400 junctions, which serves as a guide value for this model, with 150 junctions selected to fit the experimental data. Assuming the junction to be a cylinder, the volume was calculated with a height of 20 nm and a diameter of 100 nm, as outlined in Table 2. The cytosolic volume is calculated by subtracting all listed sub volumes from the reported cell volume. The scaling factors were assessed based on the geometrical assumptions as described. The initial values for the differential equations were either assumed based on expected values or based on their original sources. The parameters and initial values used are summarized in Table 1 and Table 2.
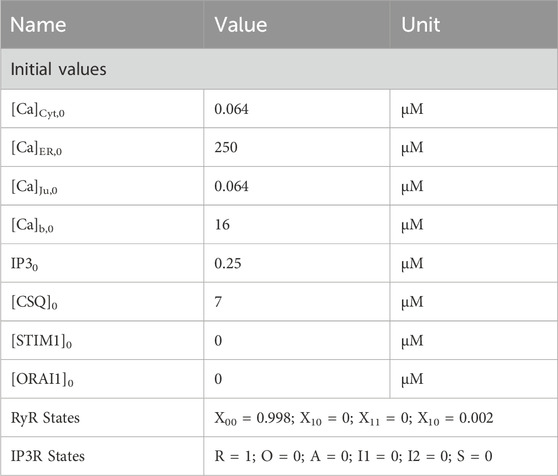
Table 1. Initial values for calcium simulations.
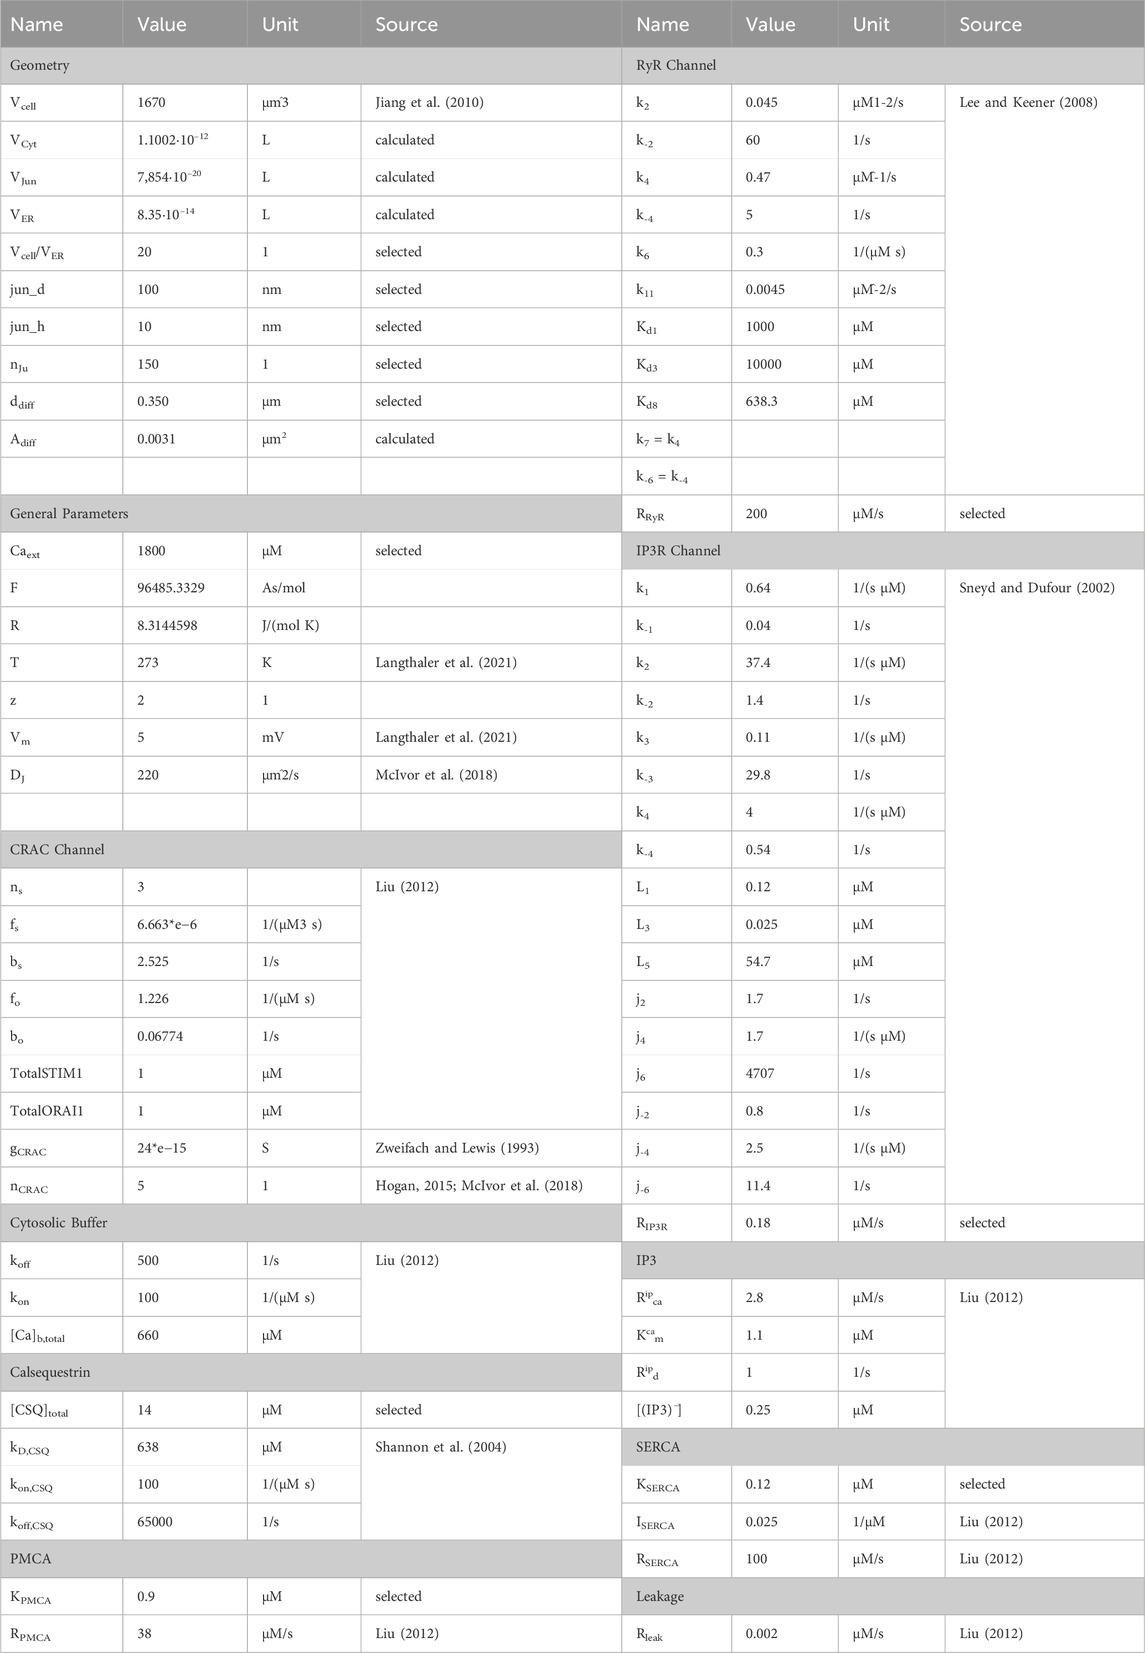
Table 2. Summary of model parameters.
2.2 Available experimental data for verification of the SOCE model
To verify whether the SOCE model actually describes and reproduces the calcium dynamics in A549 cancer cells, the model is compared with calcium measurements reported in the literature. Two studies were found that conducted suitable experiments on calcium channels important for this model (Hou et al., 2011; Shin et al., 2018). The experiment by Hou et al., 2011 was chosen as a reference since it directly shows the function of the CRAC channels and indirectly the function of IP3R channels, RyR channels and PMCA pumps. (see Figure 5C in Hou et al., 2011). The measurement depicts the relative fluorescence, which allows for conversion to the calcium levels (Padar et al., 2004). However, as the fluorescence parameters are not clearly defined in this work, a direct relationship and thus a quantitative comparison with the calcium levels is not possible. In detail, the measurement starts in a calcium-free environment, with a constant fluorescence intensity, indicating equilibrium of the cytosolic calcium level. Approximately 1 minute later, 2 µM Thapsigargin (TG) is added in order to block the SERCA pumps. This causes a net calcium efflux from the ER via IP3R and RyR channels as well as the ER leak, that raises the cytosolic calcium. The outflow continues until the ER is depleted within 2 minutes. At this point all STIM1 proteins should be bound to ORAI1, resulting in the opening of all available CRAC channels. In a next step, the cells are perfused with 2 mM Ca2+, which leads to a rapid and large rise of the calcium level as calcium flows into the cytosol, predominantely via CRAC channels. The steep rise is followed by a plateau phase, indicating the maximum calcium inflow in the cytosol through the fully activated CRAC channels. As the SERCA channels remain blocked, the ER is further depleted of calcium and the CRAC channels stay open. The calcium influx is then terminated by the addition of 100 µM 2-APB, a store-operated calcium channel blocker, causing the calcium levels to decline to the resting level, probably mediated by calcium extrusion pumps such as PMCA. To reproduce this experiment, the developed model was set to an arbitrary starting point with an external calcium concentration of zero. Depending on the parameter setting, the calcium concentration lasts some seconds to minutes until a steady state is reached. Addition of drugs and external calcium is assumed to occur at time points 66s for the TG, 231s for the perfusion with calcium and 429s for the CRAC channel blockage (Hou et al., 2011). The modulation of the corresponding channels depending on the effect of the drugs administered is then simulated by adjusting the model parameters accordingly.
Another suitable experiment is reported by Shin et al., 2018, where compound K was used to trigger ER Ca2+ release in A549 cells, showing the effect of the drug on cytosolic calcium levels, the results of which are depicted in Figure 4A in Shin et al., 2018. In the first experiment, compound K is added to the cell in order to trigger ER Ca2+ release, which is indicated by a quick and permanent increase in the cytosolic calcium concentration. In a second experiment the cells are incubated before addition of the channel blocker dantrolene and BAPTA-AM, an intracellular Ca2+ chelator, to block RyR and IP3R channels, which reduces the apoptotic effect and prevents increase of cytosolic Ca2+. While it is not possible to simulate the effect of compound K, it is possible to compute a forced calcium release through RyR channels by increasing the channels' flow rate in order to reproduce the measured data by model simulations (Shin et al., 2018).
2.3 Implementation of the SOCE model and the combined A549-SOCE model
Implementation of the SOCE sub-model and the combined A549-SOCE model using MATLAB/Simulink (R2019b, MathWorks Inc.) is described in the Supplementary Material Part C. As in the initial A549 model, the equations are solved using the forward Euler method (ODE1 in Simulink), with a fixed step size of 5・10−7 s. The combined model is run on a workstation (2–4 × 256 GB RAM, CPU 2.20 GHz (Intel(R) Xeon(R) Fold 5220R), 48 cores, 96 logical processors), with a runtime of approximately 3–4 h for a 10 s simulation. The final A549-SOCE model approach is shown in Figure 4.
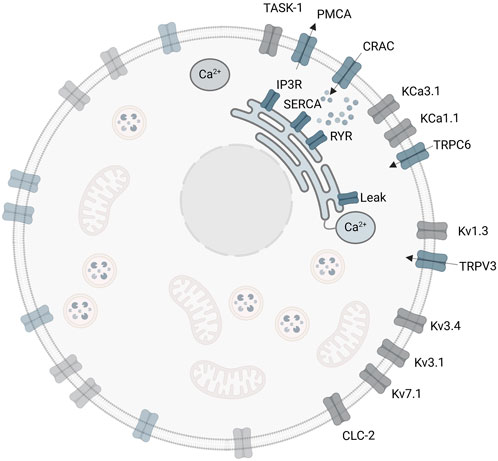
Figure 4. Extended A549-SOCE model by combining the initial plasma membrane channels with a detailed description of intracellular calcium channels and corresponding Ca2+ buffers in the endoplasmic reticulum and cytoplasm.
3 Results
3.1 SOCE model simulation and verification
Figures 5, 6 demonstrate the simulations for the settings of the SOCE concept (described in the Material and Methods section) based on the experiment by Hou et al., 2011 (cf. Figure 5C in Hou et al., 2011). Figure 5 shows a comparison of the cytosolic calcium concentration simulation versus the measured calcium fluorescence in the experiment. Note that the simulation yields an artificial steep calcium spike in the beginning, which reveals the transient response of the SOCE model setting to the calcium-free starting condition. Importantly, we emphasize that this transient response has no further impact on subsequent simulations. Once the initial phase is concluded, the simulation stabilizes, and the system reaches a physiologically relevant state. Despite all channels being active during this phase, the SERCA pumps are the most active, leading to a decrease of [Ca2+]Cyt to a baseline of about 13 nM, while [Ca2+]ER increases. The course of the buffered calcium inside the cytosol follows [Ca2+]Cyt in shape, but with higher scaling. After 66 s, the flow rate of the SERCA pumps in the model is set to zero to simulate blockage by 2 μM TG application, resulting in a net outflow from the ER, and thus in a rapid decrease of [Ca2+]ER and increase of [Ca2+]Cyt. During the ER efflux the IP3R and RyR channels open and increase calcium release. After reaching a temporal maximum of 128 nM, [Ca2+]Cyt declines as the PMCA responds to the rising calcium levels and clears the cell of the remaining calcium. In this phase, the CRAC channels are activated by the decreasing ER calcium and reach an open probability of 95%. The addition of extracellular calcium causes an immediate transient current through the open CRAC channels, which settles at 0.87 fA after a short settling phase. The influx is followed by PMCA outflow, resulting in an almost constant calcium concentration of 334 nM. The calcium concentration of the junctions follows the course of [Ca2+]Cyt with roughly the same values up to this point. The CRAC channel influx causes [Ca2+]Jun to reach 15 µM during the plateau phase. The endoplasmic calcium and the CRAC channel open probability remain unchanged. The subsequent blocking of the CRAC channels is achieved by setting the number of CRAC channels per junction to 0.001, causing [Ca2+]Cyt and [Ca2+]Jun to decrease rapidly. Figures 5D–F summarize the simulations of the relevant SOCE parameters [Ca2+]ER, [Ca2+]Jun, CRAC channel open probability, buffered Ca2+ inside the cytosol, and Ca2+ unbound calsequestrin.
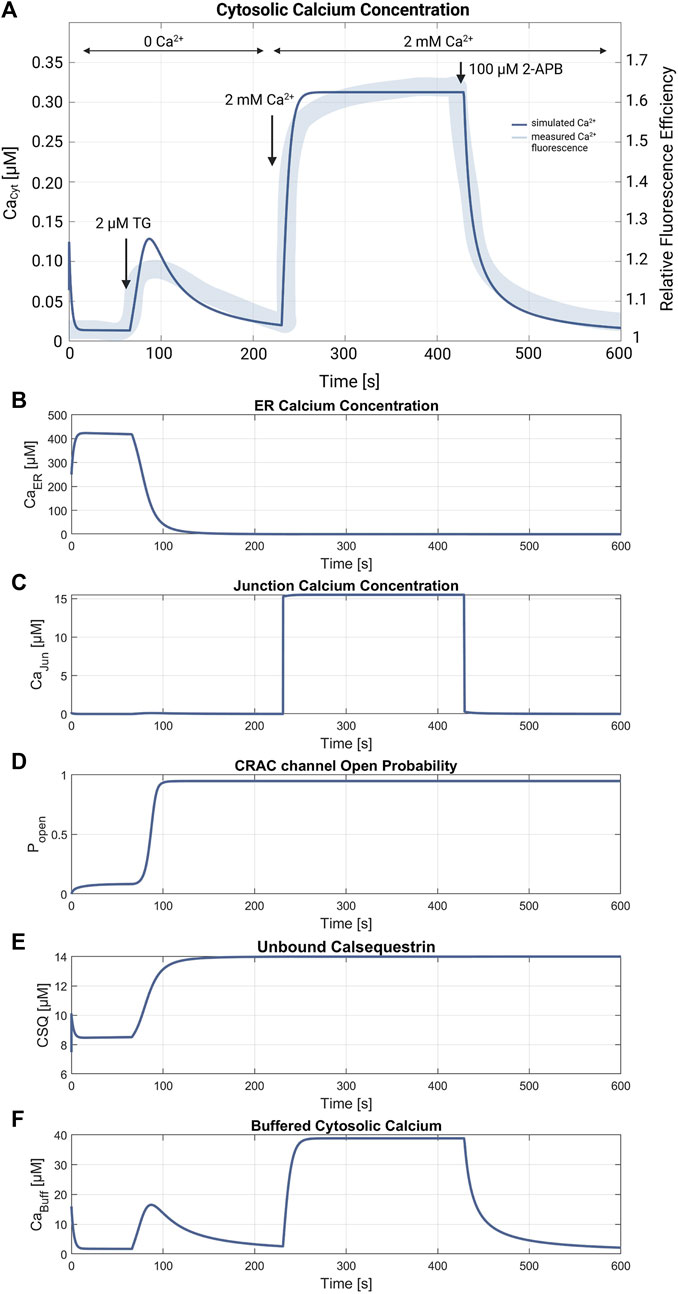
Figure 5. SOCE model verification. (A) Cytosolic calcium concentration simulation using the SOCE model (thin line in blue) superimposed with the measured calcium fluorescence from the experiment by Hou et al., 2011 (cf. Figure 5C in Hou et al., 2011) (thick line in blue). The arrows mark the addition of 2 µM Thapsigargin (TG) to block the SERCA pumps, start of perfusion of the cells with 2 mM Ca2+, and addition of 100 µM 2-APB, a store-operated calcium channel blocker. Simulation of the relevant SOCE parameters (B) [Ca2+]ER; (C) [Ca2+]Jun; (D) CRAC channel open probability; (E) Ca2+ unbound calsequestrin; and (F) buffered Ca2+ in the cytosol.
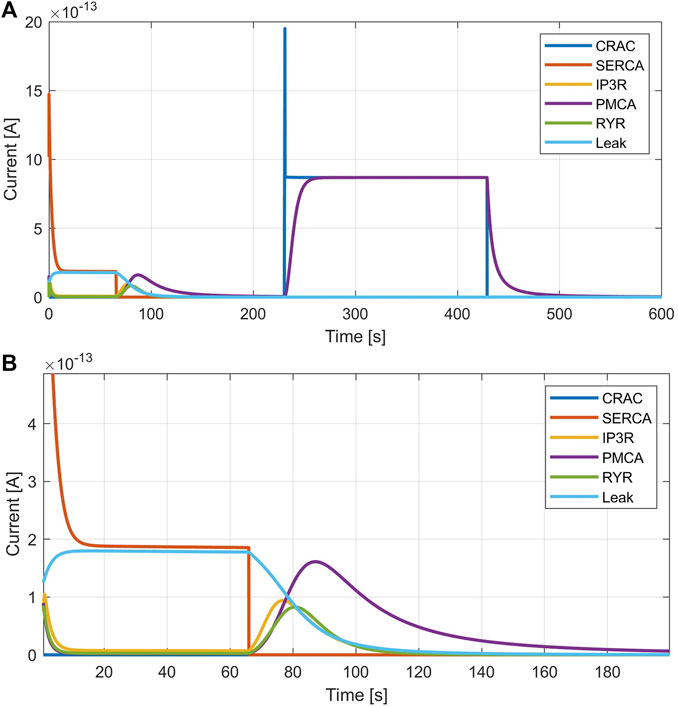
Figure 6. Calcium currents simulated with the SOCE model. (A) Currents throughout the entire simulation. (B) Zoom of SERCA pump inhibition.
Figure 6 shows the currents of the ion channels in the simulated SOCE experiment. During the initial resting phase, ER efflux provoked by IP3R and RyR currents is almost zero and calcium leaves the ER mainly through the implemented leakage current. During the SERCA inhibition after 66 s, the leakage decreases, but both, the IP3R and RyR currents, increase in a bell-shaped fashion. While these channels are active, the ER is completely emptied of calcium, as illustrated by the decrease of [Ca2+]ER and increase in unbound calsequestrin in Figures 5B,E. The calcium-free calsequestrin is capped at 14 μM, which is assumed to be the total amount of protein and means that no more calcium is buffered in the ER. The PMCA current starts at about the same time as the ER depletion, but is larger and decays much slower, similar to [Ca2+]Cyt. The addition of calcium leads to the opening of the CRAC and PMCA channels. Neglecting the spikes, i.e. the simulation artifacts caused by the direct supply of extracellular calcium, the CRAC and PMCA currents reach peak values of 0.9 pA. After CRAC blocking by 2-APB, only the PMCA current remains, which decreases rapidly. At the end of the simulation, all calcium compartments and buffers are almost empty and all calcium fluxes end.
3.2 Variation of model parameters
To evaluate how different parameter settings affect the model’s behavior, various simulations were carried out (see Supplementary Materia Part D). The simulations in Supplementary Figures SD1, A–C are shown for the cytosolic calcium concentration, as this parameter can be measured experimentally. Each sub plot in the figure yields a variation of a single parameter, while one graph (in blue) serves as the reference simulation with the basic settings used for Figure 5. These simulations support the basic functionality of the proposed model description, as the mechanism of the CRAC channels and the junction model work properly.
3.3 Simulation of RyR channel mediated ER calcium release
The simulation of the compound K experiment by Shin et al., 2018 as shown in Figure 8, starts in a steady state configuration. Hereto the SOCE model is run with an external calcium concentration of 1.8 mM for about 100 s, until steady state is reached. The resulting calcium concentrations with [Ca2+]Cyt of 69 nM, [Ca2+]ER at 660 μM, [Ca2+]Jun at 0.9 µM and an open probability of the CRAC channels of 3% are shown in Figure 7. Note that the calcium concentrations depend on the parameter settings and thus result from the selected model parameterization. After reaching the baseline, the conductance of the RyR channel is increased by a factor of 10 at s 130, resulting in a steep increase of [Ca2+]Cyt with a small overshoot that settles to a plateau after 20 s. The activation of RyR channels, rapidly depletes the ER of calcium and [Ca2+]ER drops to 139 µM, as shown in Figure 8B. This, in turn, leads to an increased open probability of CRAC channels, which rises to 69% and lifts the junction calcium concentration [Ca2+]Jun to 12 µM.
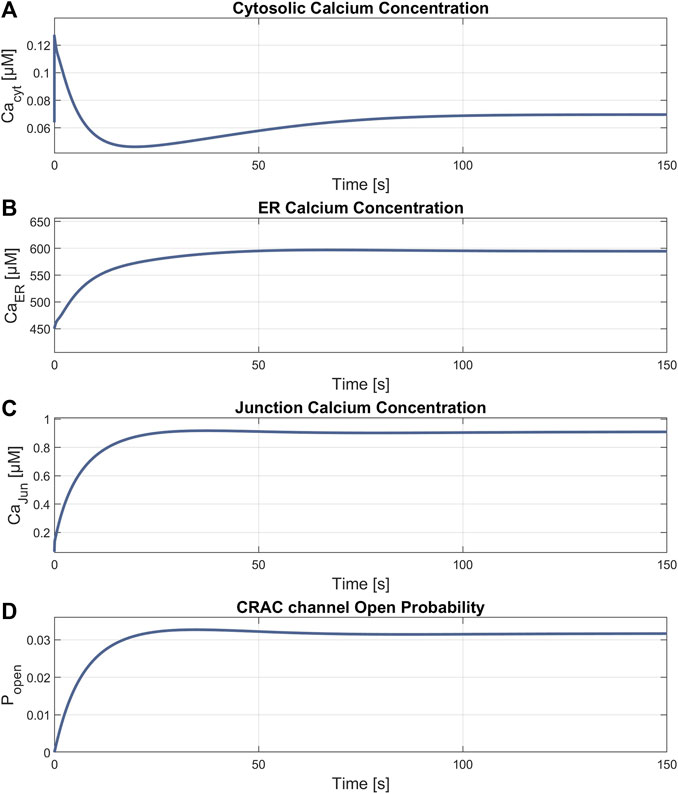
Figure 7. Results of the steady state simulation. Parameters with final values for (A)
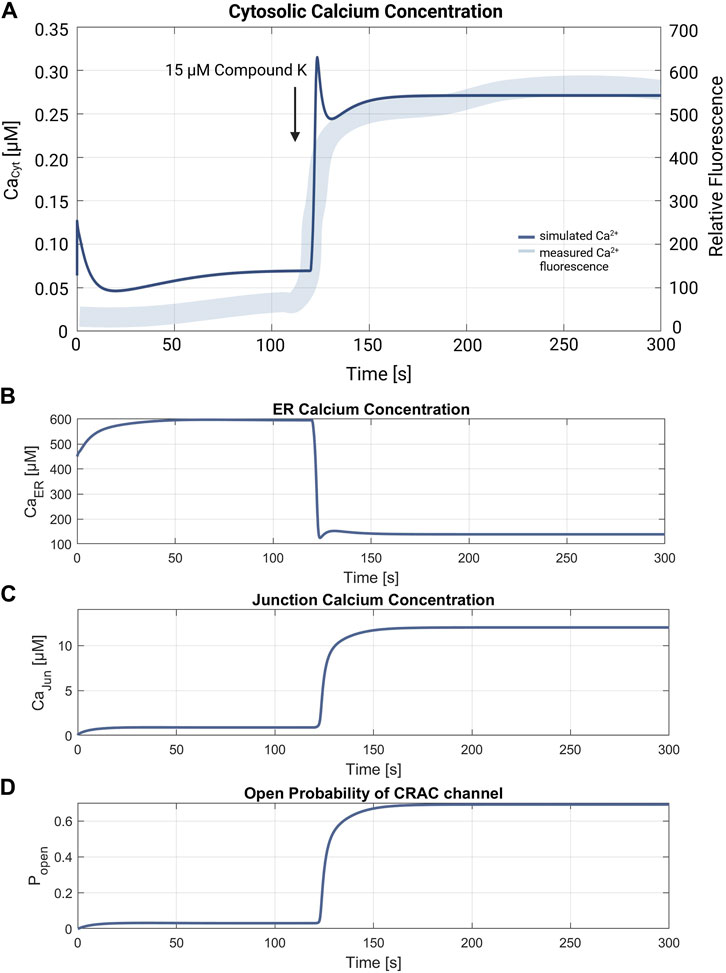
Figure 8. Verification of the compound K experiment by Shin et al., 2018. (A) Superimposition of the simulation of the cytosolic calcium concentration (thin line in blue) with the measured compound K concentration (thick line in blue). The arrow marks the addition of 15 µM compound K, leading to the RyR channel activation. The resulting cytosolic calcium level is
3.4 The combined A549-SOCE in silico model
To compare simulations of the combined A549-SOCE model with the original A549 simulations, the combined model was run in steady state configuration for the cell cycle phases G0, G1, S and G2-M. Therefore, the membrane potential Vm was simulated by numerically solving Eq. 15 for Vm, starting at +5 mV until steady state was reached (t = 40 s, dt = 5.10–7):
Figures 9A–D show the calculated membrane potentials of the combined A549-SOCE model and of the original A549 in silico model for the cell cycle phases G0, G1, S and G2-M with the plasma membrane ion channel composition as denoted in the original A549 model version (Langthaler et al., 2021) for comparison, without taking into account potential alterations in ion channel expression within the ER or Ca2+ depletion from the ER during distinct phases of the cell cycle. Since the open probability of the CRAC channels is lower with the new Ca2+ formalism, the number of CRAC channels was set to 1500 instead of 200 in the original A549 model in order to achieve comparable CRAC currents. In addition, [Ca2+]Cyt and [Ca2+]Jun are also shown to examine the state of the SOCE model.
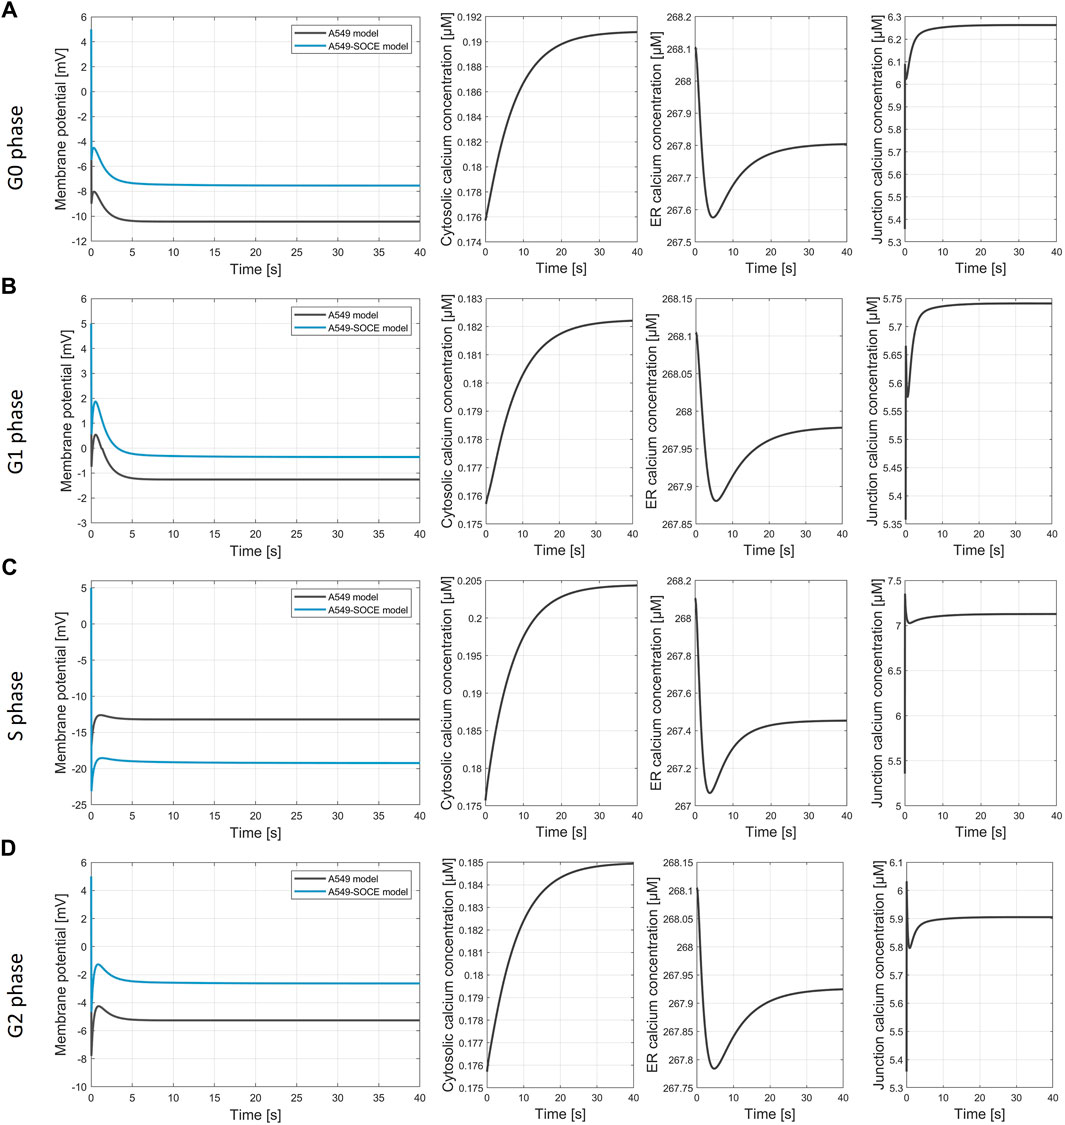
Figure 9. Simulation of the membrane potential during the cell cycle phases. (A) G0 phase, final values of the simulation Vm, A549 = −10.4 mV; Vm.A549-SOCE = −7.5 mV; [Ca2+]cyt = 0.191 µM; [Ca2+]ER = 267.8 µM; [Ca2+]jun = 6.263 µM; (B) G1 phase, final values of the simulation Vm, A549 = −1.21 mV; Vm.A549-SOCE = −0.25 mV; [Ca2+]cyt = 0.182 µM; [Ca2+]ER = 267.98 µM; [Ca2+]jun = 5.74 µM; (C) S phase, final values of the simulation Vm, A549 = −13.2 mV; Vm.A549-SOCE = −19.1 mV; [Ca2+]cyt = 0.204 µM; [Ca2+]ER = 267.45 µM; [Ca2+]jun = 7.13 µM; (D) G2 phase, final values of the simulation Vm, A549 = −2.6 mV; Vm.A549-SOCE = −5.3 mV; [Ca2+]cyt = 0.185 µM; [Ca2+]ER = 267.92 µM; [Ca2+]jun = 5.91 µM.
The membrane potentials as well as the response times of the combined model are roughly the same as those of the initial A549 model, as can be seen from the comparison of the membrane potential curves. For instance, the membrane potentials in G0 phase differ by less than 2 mV (Vm.original = −10.4 mV vs. Vm.calcium = −8.6 mV). A larger difference is seen in the S phase with VS.diff = 5.9 mV (cf. Figure 9C). The combined model thus well reflects the oscillating characteristics of the membrane potential Vm during cell cycle progression (G0 phase: hyperpolarization, G1 phase: depolarization, S phase hyperpolarization, and G2-M phase depolarization)). Figure 10 outlines the rhythmic membrane potential change during cell cycle progression simulated with the initial and combined A549-SOCE model and relative changes of the calcium levels to the resting G0 phase. During the cell cycle phases, the cytosolic calcium levels fluctuate slightly between 0.182 and 0.204 µM and [Ca2+]ER between 267.45 and 267.98 µM with the set parameters. The calcium levels of the junction are within 5.74 µM and 7.13 µM, which is higher than previously estimated by the initial A549 model. These high calcium levels result from increasing the maximum flow rate of the IP3R channels to 1.8 μM/s and the number of ER-PM junctions to 300, instead of the previously defined model parameters, to achieve currents in the expected sub nA range, as in the initial A549 model.
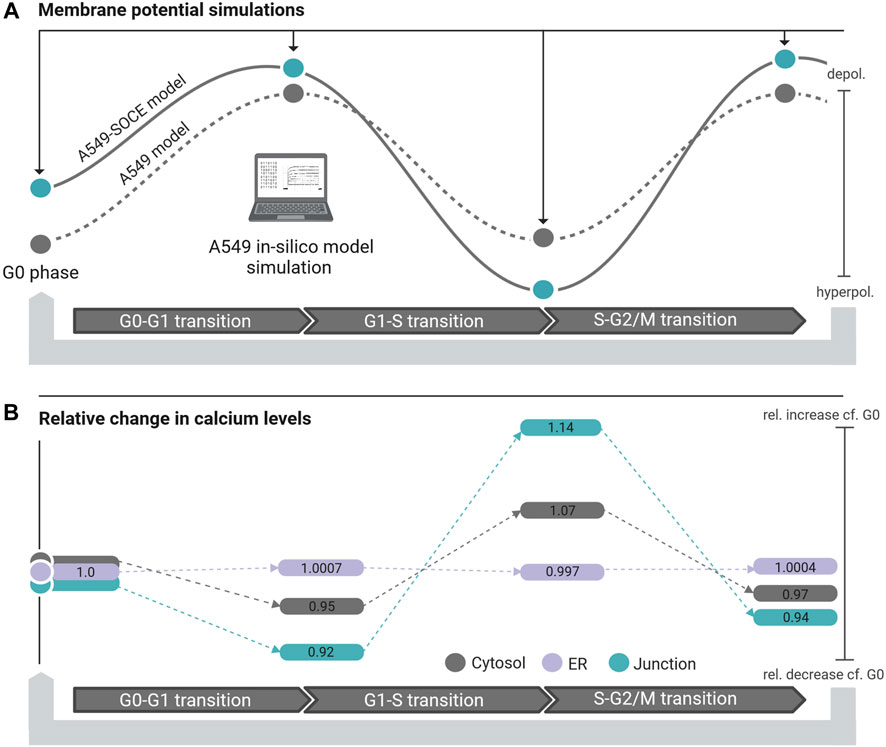
Figure 10. (A) Membrane potential simulation during cell cycle progression of the initial A549 model (dashed black line, grey dots simulated steady state potentials) and the A549-SOCE model (black line, blue dots simulated steady state potentials) showing the influence of calcium dynamics on the membrane potential in different phases of the cell cycle. (B) Relative change of the calcium concentration of the cytosol (grey bars), ER (purple bars) and junction (blue bars) in the different cell cycle phases normalized to the calcium concentrations in the resting G0 phase.
4 Discussion
4.1 The SOCE model
The SOCE model presented in this work allows the simulation and reproduction of the experimental data obtained by Hou et al., 2011 (cf. Figure 5C in Hou et al., 2011). However, the simulated calcium concentrations, in particular the initial cytosolic calcium concentration of [Ca2+]Cyt = 13 nM could not yet be verified, as no experimental data in the absence of external calcium are available. In Padar et al. (2004) the baseline [Ca2+]Cyt value of A549 cells is reported as 65 nM, presumably at an external calcium concentration of 1.2 mM. The [Ca2+]Cyt levels reveal a relatively large difference but are in the same magnitude range, which indicates a reasonable model parameterization. The simulated ER calcium release matches the shape of SERCA blockage in the experiment in rise time and duration, but seems to have a steeper calcium decline. Since experimental values are missing, only a vague comparison of the simulated calcium plateau during the store-operated calcium entry is possible. Additionally, the ER Ca2+ release was compared with results of similar experiments of Padar et al., 2004, showing that the simulated data is consistent in terms of shape and time. However, using the stated relation and parameters for assessing the calcium concentration from the fluorescence response, the peak value of [Ca2+]Cyt during ER depletion can be estimated to be about 360 nM, which is about three times the simulated peak value of 128 nM (Hou et al., 2011). This could indicate a higher calcium storage capacity of the ER in the real cell than assumed in the model simulations. The addition of external calcium leads to the activation of the store-operated calcium entry. The resulting [Ca2+]Cyt during the SOCE plateau is 334 nM and thus very close to the expected [Ca2+]Cyt of 300 nM determined by Hou et al., 2011. The other calcium compartments and the Ca2+ buffers equally demonstrate the expected behavior, but in contrast to [Ca2+]Cyt cannot be further verified due to a lack of experimental data. The free calcium concentration of the ER is estimated to be in the range between 100 μM and 1 mM (Bong and Monteith, 2018; Rossi and Taylor, 2020), which matches the simulated values of almost 400 µM. However, the ER is completely emptied of free and bound Ca2+ during the ER depletion phase, which is reasonable from the simulation point of view, but may not be the case in a real cell considering the complex ER Ca2+ storage mechanisms (Islam, 2020). For [Ca2+]Jun, estimates and simulations assume values of 1 μM–7 µM for the overall junction and up to 60 µM in the immediate vicinity of the plasma membrane (McIvor et al., 2018). Thus, the resulting [Ca2+]Jun of 15 µM in the simulation is higher, but within the realm of possibility. By contrast, the values for the Ca2+ buffers cannot be substantiated as data on CSQ inside A549 cells is lacking and the cytosolic buffer is a simplified construct that only describes the combined response of several intracellular proteins and organelles. Overall, however, as could be shown, the model reliably simulates the effects of SERCA blockage by Thapsigargin and thus aligns well with known effects on calcium dynamics in cells from an electrophysiological point of view.
Steady state simulations, as shown in Figure 7, settle at [Ca2+]Cyt of 69 nM under 1.8 mM extracellular calcium, which agrees well to the 64 nM at 1.2 mM extracellular calcium reported by Padar et al., 2004. With less extracellular Ca2+, the intracellular Ca2+ also becomes smaller, so it can be assumed that the model parameters used slightly underestimate [Ca2+]Cyt. Nevertheless, the values are within the desired range, as [Ca2+]ER settles at a high level of 594 μM, which indicates full Ca2+ stores.
The basic functionality of the model is underlined by additional parameter modulation shown in Supplementary Figures SD1, A–C (Supplementary Material Part D), as all parameter variations lead to the expected changes in simulated calcium concentrations. For example, increased IP3R and RyR conductivities in the simulation depict a faster Ca2+ efflux with a higher calcium peak, which is reasonable as these channels facilitate the ER efflux and more channels should result in a faster ion flux. Provided that no additional gating factors interfere, selective overexpression of these channels in a real cell should have a comparable effect which can therefore be simulated by the model approach. The number of junctions, ER leakage and diffusion distance constitute descriptions of cellular properties that are reasonable in a modeling context, but may not be directly applicable to a single feature in real cells due to abstraction. A valuable observation from these simulations is the relationship between [Ca2+]Cyt and [Ca2+]Jun, which can be seen by comparing Supplementary Figures SD1, A and Supplementary Figures SD1, B. The number of junctions and the PMCA rate variations have approximately the same effect on the junction and the cytosol. The diffusion distance, on the other hand, has a much greater effect on [Ca2+]Jun than on [Ca2+]Cyt and can therefore be used to adjust [Ca2+]Jun independently of its environment. In addition, the ER simulation results are an important output of the model. Starting with the IP3R channels, it appears that they do not change the resting state of [Ca2+]ER, but do affect the rate of ER efflux. Thus, the IP3R channel differs from RyR, which affects both the resting state [Ca2+]ER and the rate of ER depletion. The leakage term has an unexpectedly large influence on the overall behavior, with too large leakage removing the Ca2+ from the ER and too small leakage significantly delaying the efflux. This shows that the ER leakage is an essential assumption for the model and is therefore probably also present in real cells. The increase of [Ca2+]ER and the slower ER depletion with increasing amount of CSQ also represents a plausible simulation (see Supplementary Figures SD1, C) as CSQ represents a Ca2+ storage protein. The results of this variation suggests that the initial estimate of 14 µM CSQ was probably underestimated, as its influence on the model at concentrations below 140 µM appears to be small compared with other variables such as the cytosolic buffer capacity. A higher cytosolic buffer capacity, in turn, increases [Ca2+]ER, which could be explained by the higher total Ca2+ available in the cell. Finally, since the SERCA pumps are blocked at the beginning of the experiment, the effect of SERCA variation can only be investigated in the initial resting phase. Here, an increased pump rate leads to an increase in [Ca2+]ER, which also corresponds to the initial expectation.
Simulation of the experiment by Shin et al., closely matches the measured fluorescence response in time and shape, time and shape, thus reproducing the expected Ca2+ signaling chain for the CRAC channels. According to the experimental work, the simulation causes a permanent increase of [Ca2+]Cyt due to the opening of RyR channels, as shown in Figure 8. Controlled Ca2+ depletion of the ER leads to the opening of CRAC channels and an increase of [Ca2+]Jun, which subsequently influences the corresponding ion channels until a steady state is reached. While the calcium overshoot at the beginning, which is caused by the fast current through the RyR channels, could indicate a too pronounced opening rate in the model, all other simulation components behave as expected.
Considering that the presented model was not fitted to quality-assured experimental data, the simulated absolute calcium concentrations of the SOCE experiment are within physiologically reasonable ranges. Since the shape and scale of the simulation results can be widely varied via its parameters, as shown in the simulations, it is to be expected that the model can be fitted to suitable experimental data and thus a better agreement with the experiments can be achieved. The model obtains a reliable simulation of the [Ca2+] course in the junction and it also reproduces the forced ER Ca2+ release through RyR channels, providing a realistic estimate for the Ca2+ environment in the resting state of the cell. Overall, it can be concluded that at this stage the model can simulate the necessary calcium handling pathways that influence Ca2+ distribution of the ER-PM junction. The actual Ca2+ levels within the junction are consistent with estimates reported in the literature and can be easily adapted to the needs of the simulation. Therefore, the model can be used to make a reliable estimate of the Ca2+ concentration within the ER-PM junction.
4.2 The combined A549—SOCE model
The initial A549 model was designed assuming fixed values of [Ca2+]Cyt = 64 nM and [Ca2+]Jun = 4.68 µM. The cytosolic Ca2+ is important for the driving force of Ca2+ permeable channels, and Ca2+ within the junction is assumed to regulate the opening of KCa channels. In the combined A549-SOCE model these two Ca2+ parameters are dynamically calculated. Integration of the of the SOCE model into the A549 model required further adjustments in order to fulfil the initial assumptions, which are described below.
Simulation of the SOCE model resulted in a [Ca2+]Cyt of 69 nM in the resting state and a much lower [Ca2+]Jun of 0.9 µM. This makes sense from the Ca2+ perspective, as a low [Ca2+]Cyt with non-zero external calcium suggests full Ca2+ stores and therefore low CRAC activation and [Ca2+]Jun. However, the [Ca2+]Jun proved to be too low to fully open the KCa channels, as assumed in the initial model, which requires [Ca2+]Jun values above 5 µM. As a result, the current through the KCa channels was strongly reduced and the membrane potential depolarized considerably during first simulation trials. Hence, to ensure proper activation of KCa channels, the total calcium levels were increased by enhancing the maximum flow rate of IP3R channels. This has the dual effect of releasing more Ca2+ from the ER into the cytosol and increasing the influx of CRAC channels. As a second measure, the diffusion distance was adjusted to 350 nm for all simulations, increasing [Ca2+]Jun independently of [Ca2+]Cyt. The resulting calcium levels of [Ca2+]Jun and [Ca2+]Cyt allowed a better simulation of KCa channel gating, according to original model assumptions.
Figures 9A–D demonstrate the simulation of the membrane potential of the extendend model. By integrating the SOCE model, the membrane potentials Vm during the G0 phase differ by 2.9 mV and those during the G1 phase by 0.96 mV from the original A549 model. The ion currents of the displayed channels also have comparable values to the original simulations (data not shown), so that no significant change in channel functions can be observed. Only the CRAC current is slightly below the original range, which results from the lower opening probability of the CRAC channels with the new Ca2+ formalism, despite the increased channel number from 200 to 1500. The Ca2+ levels both in the junction and in the cytosol are significantly higher in both cell cycle phases, but are within the normal range. The Ca2+ transients take about 20 s to reach a steady state, which is slower than the voltage dynamics and expected compared with the general Ca2+ and SOCE dynamics in cancer cells.
Similar observations to the results of the G0 and G1 phases can also be made for the S phase and G2/M phase, which is shown in Figures 9C,D. The deviation in Vm for S phase of 5.9 mV is larger and thus slightly greater than expected, but could certainly be improved by using advanced computational optimization methods.
In summary, the simulation confirms that the SOCE model is compatible with the initial A549 ion current model and leads to an appropriate response of the calcium dependent ion channels to simulated Ca2+ levels. In contrast to the variation of Vm, the increasing cytosolic calcium concentration and the dynamic adaptation of the Ca2+ Nernst potential for the cytosol does not lead to a significant change in the driving force.
The new description of the CRAC channel provides a more profound model of CRAC gating, but its direct contribution to the whole-cell current is still small compared with the other Ca2+ channels. The important role of the CRAC channels for the model is regulation of the KCa channels. The initial model was designed with a high junctional calcium concentration, and thus, with almost fully open KCa3.1 channels, which was necessary to fit the experimental data. Although the high Ca2+ levels required for the simulation are within an acceptable range for cells, permanent activation of the CRAC channels is required to achieve the necessary calcium concentration for the KCa channels. However, the SOCE mechanism is only a temporary process limited to the time required to replenish the ER with Ca2+, and typical [Ca2+] levels in cells are much lower (Padar et al., 2004). In the case of lowering KCa3.1 activity, for example by reducing [Ca2+]Jun due to the reduction of the diffusion barrierer, would lead to a depolarization of Vm above +10 mV. The problem could be explained by an insufficient KCa3.1 model that demonstrates a too low calcium dependence for the cell type. Another reason could be the data fitting of the initial model, as all cell cycle phases were fitted with the same [Ca2+] concentration. Similarly, the original assumption that the KCa channels are in close proximity to the CRAC channels may be incorrect. The KCa channels could instead be located near other calcium entry channels such as the TRP channels, which have a much higher conductance and could therefore generate higher local concentrations in their vicinity independent of the time limited SOCE mechanism. Nevertheless, more detailed data on the Ca2+ homeostasis are needed to allow adequate modeling of the actual KCa gating.
4.3 Model design and limitations
The entire SOCE concept of the developed model is based on several other model approaches. The regulatory mechanisms of the CRAC, SERCA, PMCA and IP3R channels are well known and have already been implemented with varying degrees of abstraction (Kowalewski et al., 2006; Means et al., 2006; Liu, 2012; Schmeitz et al., 2013; Eichinger et al., 2018). The novelty of this model lies in the unique combination of existing concepts and a higher level of detail. The most significant feature is the introduction of the ER-PM junction as a separate calcium domain, which has not been reported before in a similar form. Another sophisticated part is the addition of a kinetic state model for both the IP3R and RyR channels. While the IP3R channel has already been implemented as a kinetic state model (Means et al., 2006), this is typically an exception, and the RyR channel is generally neglected in SOCE models. Another notable sub-step is the Ca2+ and voltage dependency of the CRAC current. Although Ca2+ and voltage dependent CRAC current formalisms have been reported (Schmeitz et al., 2013; Eichinger et al., 2018), to the best of our knowledge, no model with the same level of detail was found in the literature reviewed.
An important geometric design decision is the diffusion barrier. It is generally assumed that the junction is directly surrounded by the cytosol on its side (Hogan, 2015; McIvor et al., 2018). However, the ER-PM junction is located in a microdomain with over 100 junctions, which means that the junctions that are not on the edge of the microdomain are not in direct contact with the cytosol. This would greatly enlarge the distance for the Ca2+ diffusion from the CRAC channels to the cytosol. If it is assumed that there is at least one junction with a diameter of 100 nm between the observed junction and the cytosol, the junctions are a few nm apart and the steady [Ca2+] decrease within the junction towards the edges is taken into account, then the diffusion distance for the junction would be around 120 nm–180 nm. This would mean that junctions in the center of the microdomain could have much larger diffusion distances and are almost isolated from the cytosol. With this assumption, a variable diffusion distance can be justified in the model, which can be set to determine [Ca2+]Jun. The diffusion area, i.e., the lateral surface of the cylindrical junction, also influences the diffusion, but it depends on the size of the junction and therefore cannot be varied as easily. The other variables of the basic diffusion relationship are the dynamic calcium domains and the fixed diffusion constant, making the diffusion distance the parameter of choice for adjusting the ion flux between the junction and the cytosol.
The main Ca2+ influx into the junction occurs via the CRAC channels. The number of CRAC channels per junction could be varied to modulate [Ca2+]Jun, but five channels is a number reported in the literature (McIvor et al., 2018) and was therefore retained for modeling. The gating formalism of the CRAC channels under the assumed simplification that the total amount of STIM1 and ORAI1 is simply 1 (µM) works as intended. The electrical driving force of the CRAC channels is regulated by the Ca2+ Nernst potential between the extracellular space and the junction. Simulation experiments during the development yielded much better results for a junction-based Nernst potential than for the [Ca2+]Cyt -based one, as the rapid Ca2+ increase at the junction reduces the driving force and regulates the ion influx.
The chosen modeling approach for the SERCA is rather simple compared to other junction components, but it is sufficient to balance the calcium concentrations of the junction and cytosol and to fill the ER. No advanced kinetic state model has been found for the SERCA pump, and even the more detailed alternatives focus more on additional aspects such as the leakage (Means et al., 2006) or ATP dependency (Diederichs, 2008) rather than on the actual gating itself. The transport or reaction rate of the published SERCA models is typically only controlled by a single dissociation constant. The dissociation constant in this model does not represent real protein affinities, but was determined empirically and set to a value that yielded good results. Deviations from the real SERCA can be explained by the fact that there are different isoforms of SERCA pumps present in the cells (EMBL-EBI, 2023) and the formalism used represents an approximation of the combined behavior of different pumps with different Ca2+ affinities. Almost exactly the same observations and restrictions are made for the PMCA pump, with the difference that it only affects the cytosol. These pumps have the same basic functionality, are modeled by the same basic concept and give similarly satisfying results.
In contrast to SERCA and PMCA pumps, IP3R channels have already been described by various kinetic state models (De Young and Keizer, 1992; Sneyd and Dufour, 2002; Means et al., 2006). The modeling approach used provides expected results that fit well with the supposed SOCE mechanism. One limitation in modeling this channel is its dependence on the second messenger IP3. The highly simplified mathematical description of the IP3 dynamics used in this work does not reflect the biological processes that lead, for example, to an instant activation of the IP3R channel, but does allow a basic simulation of IP3R activation. Although such functionalities are beyond the scope of this first modeling approach, it must be considered a limitation. Similar model limitations also apply to the RyR channels, which are usually neglected in computational approaches. Although RyR channels play a minor role in ER Ca2+ release compared with IP3R, they are functionally expressed in A549 cells and can cause a significant ER Ca2+ efflux independently of IP3R (Shin et al., 2018). The addition of RyR channels therefore expands the possible simulation scenarios and represents the SOCE mechanism in more detail. These advantages justify the comparatively minor disadvantage of the additional computational effort in this stage.
The gating of the RyR model requires a description of the Ca2+ buffer CSQ, which leads to a further structural limitation of the model due to the introduction of buffer equations. The formalism for CSQ is appropriate and sufficient for RyR channel gating, but does not represent the buffered Ca2+ in the ER. Based on the results discussed it can be assumed that the initial amount of CSQ is probably too low and thus insufficient Ca2+ binds. It is also important to note that CSQ is not the major Ca2+ binding protein in the ER, and probably attributed to calreticulin (Means et al., 2006; Schmeitz et al., 2013), as a result of which the model does not simulate the buffered Ca2+ in the ER. In addition, the dimensioning of the entire ER is based on an assumption and the actual size of the ER could differ. Although the results for the Ca2+ inside the ER appear to be in the correct range and follow reasonable trends, these have to be interpreted with caution as they may deviate strongly from the actual Ca2+ environment of the real cell. The description of the buffer dynamics of the cytosol, on the other hand, represents a subsumption of the different Ca2+ binding proteins, which fulfills its purpose of shaping the Ca2+ dynamics to fit the reported experimental data but, like the CSQ description, does not accurately represent the amount of buffered Ca2+ of a real cell.
The TRP channels in the original A549 version are modeled as constant conductivities and therefore constantly open. The high conductivity causes large Ca2+ fluxes, which lead to a permanent overfilling of the SOCE model with Ca2+. For this reason, although the TRP channels significantly modulate the calcium concentration of the cells, they were excluded from the current SOCE model.
The main important limitation is the lack of experimental data for parameter fitting. Although the presented model can reproduce the SOCE mechanisms of the A549 cell line quite accurately in terms of time and shape of fluorescence intensity measurements, the calcium concentrations cannot be verified, which limits its predictive ability and reliability.
4.4 Outlook
To overcome existing limitations and improve accuracy, parameter fitting through computational optimization and a reparameterization of the A549-SOCE model is an essential next step, provided that data are available that allow quantitative simulations of the SOCE mechanism. For instance, recent studies have yielded valuable insights and successfully measured the free calcium concentration inside the ER lumen (Rossi and Taylor, 2020), which can serve as a reference for refining the ER description. In general, incorporating additional data concerning the Ca2+ homeostasis of A549 cells, such as resting [Ca2+] levels at different stages of the cell cycle, would certainly improve the model’s performance. Moreover, there’s a need to gain deeper knowledge of cell specific ion channel dynamics, such as TRP6, TRPV3, CRAC, and KCa channels. Developing new hidden Markov models or kinetic state models for these channels could significantly refine the SOCE model, potentially improving its accuracy in predicting parameters such as membrane potential (Vm) and [Ca2+]Jun.
The presented SOCE model simulates the dynamics of the CRAC channel and the Ca2+ concentration specifically within the ER-PM junction. However, despite considering other Ca2+ domains, it is not intended as a general exhaustive representation of calcium dynamics encompassing all facets within the cell. Developing a comprehensive calcium model would necessitate a more profound description of the major Ca2+ buffer proteins in the ER and cytosol as implemented, e.g. in Means et al., 2006. The addition of other Ca2+ permeable channels or pumps, such as the Na+/Ca2+ exchanger would equally improve the accuracy of the model. A more sophisticated model should also include the mitochondria, which are the second largest intracellular Ca2+ store and, particularly important for the Ca2+ homeostasis. In addition, a detailed description of the IP3 cycle for IP3 mediated Ca2+ release in the ER or the possibility of simulating Ca2+ oscillations could be implemented. Some of these examples have already been described and implemented elsewhere and should be compatible with the developed SOCE model (Marhl et al., 2008; Liu, 2012; Schmeitz et al., 2013).
The presented model focusing only on electrophysiological processes, sets the stage for future explorations. The path toward enhancing the A549-SOCE model is multi-layered and involves optimizing the parameters, incorporating experimental data and validation, and, ultimately, extending the model to the downstream signaling pathways. This iterative process of refinement is fundamental in bridging the gap between theoretical modeling and biological reality, thereby laying the basis for novel, comprehensive tools in cancer research.
5 Conclusion
The developed model reliably describes the Ca2+ dynamics of the microdomain around the CRAC channels. It allows the simulation of store-operated calcium entry through the CRAC channels and shows the involvement of other Ca2+ channels and pumps during that process. The design of the ER-PM junction allows the user to customize the simulation to the needs of the application. The new SOCE model is compatible with the A549 in silico model and the new description of the Ca2+ concentration within the ER-PM junction can be used as a gating parameter for the KCa1.1 and KCa3.1 channels. The results of the combined A549-SOCE model indicate that the original assumption for the calcium concentration may have been too high, as evidenced by the results regarding the dynamics of the KCa3.1 channel. Despite these findings, it is now possible to make reasonable estimates for the Ca2+ environment of these ion channels, which may increase the accuracy of the whole-cell current model and its overall predictive capabilities. This work is partly limited by the fact that its parameters were not determined by optimizing experimental data, as these are only available to a limited extent. Future developments on the combined A549-SOCE in silico model should therefore include the parameterization of the SOCE model based on appropriate data and a general reparameterization of the ion current model with the new results presented in this work. Regardless of this, the model extension is an important step towards a profound and valid in silico model for oncological research and the development of novel therapeutic strategies supported by model simulations of digital cell twins.
Data availability statement
The original contributions presented in the study are included in the article/Supplementary Material, further inquiries can be directed to the corresponding author.
Ethics statement
Ethical approval was not required for the studies on humans in accordance with the local legislation and institutional requirements because only commercially available established cell lines were used. Ethical approval was not required for the studies on animals in accordance with the local legislation and institutional requirements because only commercially available established cell lines were used.
Author contributions
SL: Conceptualization, Methodology, Project administration, Visualization, Writing–original draft, Writing–review and editing. CZ: Conceptualization, Investigation, Methodology, Visualization, Writing–original draft, Writing–review and editing. TR: Validation, Writing–review and editing. NS: Validation, Writing–review and editing. JF: Writing–review and editing. RZ: Writing–review and editing. BP: Validation, Writing–review and editing. KZ-P: Validation, Writing–review and editing. EF: Writing–review and editing. SW: Validation, Writing–review and editing. CB: Conceptualization, Supervision, Writing–original draft, Writing–review and editing.
Funding
The author(s) declare that financial support was received for the research, authorship, and/or publication of this article. This study was supported by the “Austrian Cancer Aid/Styria—RESEARCHFORUM” (Project-Nr. FF 2/2023). This work has been supported by TU Graz Open Access Publishing Fund.
Conflict of interest
The authors declare that the research was conducted in the absence of any commercial or financial relationships that could be construed as a potential conflict of interest.
The author(s) declared that they were an editorial board member of Frontiers, at the time of submission. This had no impact on the peer review process and the final decision.
Publisher’s note
All claims expressed in this article are solely those of the authors and do not necessarily represent those of their affiliated organizations, or those of the publisher, the editors and the reviewers. Any product that may be evaluated in this article, or claim that may be made by its manufacturer, is not guaranteed or endorsed by the publisher.
Supplementary material
The Supplementary Material for this article can be found online at: https://www.frontiersin.org/articles/10.3389/fmolb.2024.1394398/full#supplementary-material
References
Baumgartner, C. (2022). The world's first digital cell twin in cancer electrophysiology: a digital revolution in cancer research? J. Exp. Clin. Cancer. Res. 11 (1), 298. doi:10.1186/s13046-022-02507-x
Bong, A. H. L., and Monteith, G. R. (2018). Calcium signaling and the therapeutic targeting of cancer cells. Biochim. Biophys. Acta. Mol. Cell. Res. 1865 (11 Pt B), 1786–1794. doi:10.1016/j.bbamcr.2018.05.015
Brackenbury, W. J. (2016). “Ion channels in cancer,” in Ion channels in health and disease (Boston: G.S. Pitt Academic Press), 131–163. doi:10.1016/B978-0-12-802002-9.00006-6
Chen, Y. W., Chen, Y. F., Chen, Y. T., Chiu, W. T., and Shen, M. R. (2016). The STIM1-Orai1 pathway of store-operated Ca2+ entry controls the checkpoint in cell cycle G1/S transition. Sci. Rep. 6, 22142. doi:10.1038/srep22142
Cone, C. D., and Cone, C. M. (1976). Induction of mitosis in mature neurons in central nervous system by sustained depolarization. Science 192 (4235), 155–158. doi:10.1126/science.56781
Cone, C. D., and Tongier, M. (1971). Control of somatic cell mitosis by simulated changes in the transmembrane potential level. Oncology 25 (2), 168–182. doi:10.1159/000224567
De Young, G. W., and Keizer, J. (1992). A single-pool inositol 1,4,5-trisphosphate-receptor-based model for agonist-stimulated oscillations in Ca2+ concentration. Proc. Natl. Acad. Sci. U. S. A. 89 (20), 9895–9899. doi:10.1073/pnas.89.20.9895
Diederichs, F. (2008). Ion homeostasis and the functional roles of SERCA reactions in stimulus-secretion coupling of the pancreatic beta-cell: a mathematical simulation. Biophys. Chem. 134 (3), 119–143. doi:10.1016/j.bpc.2008.02.001
Dubois, C., Vanden Abeele, F., Lehen’kyi, V., Gkika, D., Guarmit, B., Lepage, G., et al. (2014). Remodeling of channel-forming ORAI proteins determines an oncogenic switch in prostate cancer. Cancer Cell 26 (1), 19–32. doi:10.1016/j.ccr.2014.04.025
Eichinger, P., Herrmann, A. M., Ruck, T., Herty, M., Gola, L., Kovac, S., et al. (2018). Human T cells in silico: modelling dynamic intracellular calcium and its influence on cellular electrophysiology. J. Immunol. Methods. 461, 78–84. doi:10.1016/j.jim.2018.06.020
EMBL-EBI (2023). Expression atlas. Available at: https://www.ebi.ac.uk/gxa/search?geneQuery=%5B%7B%22value%22%3A%22STIM1%22%7D%5D&species=homo%20sapiens&conditionQuery=%5B%7B%22value%22%3A%22A549%22%7D%5D&bs=%7B%22homo%20sapiens%22%3A%5B%22CELL_LINE%22%5D%7D&ds=%7B%22kingdom%22%3A%5B%22animals%22%5D%7D#baseline.
Fiske, J. L., Fomin, V. P., Brown, M. L., Duncan, R. L., and Sikes, R. A. (2006). Voltage-sensitive ion channels and cancer. Cancer Metastasis Rev. 25 (3), 493–500. doi:10.1007/s10555-006-9017-z
Hodeify, R., Nandakumar, M., Own, M., Courjaret, R. J., Graumann, J., Hubrack, S. Z., et al. (2018). The CCT chaperonin is a novel regulator of Ca2+ signaling through modulation of Orai1 trafficking. Sci. Adv. 4 (9), eaau1935. PMID: 30263962; PMCID: PMC6157965. doi:10.1126/sciadv.aau1935
Hogan, P. G. (2015). The STIM1-ORAI1 microdomain. Cell Calcium 58 (4), 357–367. doi:10.1016/j.ceca.2015.07.001
Hou, M. F., Kuo, H. C., Li, J. H., Wang, Y. S., Chang, C. C., Chen, K. C., et al. (2011). Orai1/CRACM1 overexpression suppresses cell proliferation via attenuation of the store-operated calcium influx-mediated signalling pathway in A549 lung cancer cells. Biochim. Biophys. Acta. 1810 (12), 1278–1284. doi:10.1016/j.bbagen.2011.07.001
Humeau, J., Bravo-San Pedro, J. M., Vitale, I., Nuñez, L., Villalobos, C., Kroemer, G., et al. (2018). Calcium signaling and cell cycle: progression or death. Cell Calcium 70, 3–15. doi:10.1016/j.ceca.2017.07.006
Jiang, R. de, Shen, H., and Piao, Y. J. (2010). The morphometrical analysis on the ultrastructure of A549 cells. Rom. J. Morphol. Embryol. 51 (4), 663–667.
Kowalewski, J. M., Uhlén, P., Kitano, H., and Brismar, H. (2006). Modeling the impact of store-operated Ca2+ entry on intracellular Ca2+ oscillations. Math. Biosci. 204 (2), 232–249. doi:10.1016/j.mbs.2006.03.001
Kozak, J. A., and Putney, J. W. (2018). Calcium entry channels in non-excitable cells. Boca Raton (FL): CRC Press/Taylor and Francis. doi:10.1201/9781315152592
Kunzelmann, K. (2005). Ion channels and cancer. J. Membr. Biol. 205 (3), 159–173. doi:10.1007/s00232-005-0781-4
Langthaler, S., Rienmüller, T., Scheruebel, S., Pelzmann, B., Shrestha, N., Zorn-Pauly, K., et al. (2021). A549 in-silico 1.0: a first computational model to simulate cell cycle dependent ion current modulation in the human lung adenocarcinoma. PLoS. Comput. Biol. 17 (6), e1009091. doi:10.1371/journal.pcbi.1009091
Leanza, L., Managò, A., Zoratti, M., Gulbins, E., and Szabo, I. (2016). Pharmacological targeting of ion channels for cancer therapy: in vivo evidences. Biochim. Biophys. Acta 1863 (6), 1385–1397. doi:10.1016/j.bbamcr.2015.11.032
Lee, Y. S., and Keener, J. P. (2008). A calcium-induced calcium release mechanism mediated by calsequestrin. J. Theor. Biol. 253 (4), 668–679. doi:10.1016/j.jtbi.2008.04.027
Lehen’Kyi, V., Flourakis, M., Skryma, R., and Prevarskaya, N. (2007). TRPV6 channel controls prostate cancer cell proliferation via Ca2+/NFAT-dependent pathways. Oncogene 26 (52), 7380–7385. doi:10.1038/sj.onc.1210545
Litan, A., and Langhans, S. A. (2015). Cancer as a channelopathy: ion channels and pumps in tumor development and progression. Front. Cell Neurosci. 9, 86. doi:10.3389/fncel.2015.00086
Liu, W. (2012). Introduction to modeling biological cellular control systems. Milano: Springer. doi:10.1007/978-88-470-2490-8
Liu, W. (2012). “Store-operated calcium entry,” in Introduction to modeling biological cellular control systems. Editor W. Lui (Milano: Springer), 189–206. doi:10.1007/978-88-470-2490-8_8
Liu, W., Tang, F., and Chen, J. (2010). Designing dynamical output feedback controllers for store-operated Ca2+ entry. Math. Biosci. 228 (1), 110–118. doi:10.1016/j.mbs.2010.08.013
Marhl, M., Gosak, M., Perc, M., Jane Dixon, C., and Green, A. K. (2008). Spatio-temporal modelling explains the effect of reduced plasma membrane Ca2+ efflux on intracellular Ca2+ oscillations in hepatocytes. J. Theor. Biol. 252 (3), 419–426. doi:10.1016/j.jtbi.2007.11.006
McIvor, E., Coombes, S., and Thul, R. (2018). Three-dimensional spatio-temporal modelling of store operated Ca2+ entry: insights into ER refilling and the spatial signature of Ca2+ signals. Cell. Calcium. 73, 11–24. doi:10.1016/j.ceca.2018.03.006
Means, S., Smith, A. J., Shepherd, J., Shadid, J., Fowler, J., Wojcikiewicz, R. J. H., et al. (2006). Reaction diffusion modeling of calcium dynamics with realistic ER geometry. Biophys. J. 91 (2), 537–557. doi:10.1529/biophysj.105.075036
Padar, S., van Breemen, C., Thomas, D. W., Uchizono, J. A., Livesey, J. C., and Rahimian, R. (2004). Differential regulation of calcium homeostasis in adenocarcinoma cell line A549 and its Taxol-resistant subclone. Br. J. Pharmacol. 142 (2), 305–316. doi:10.1038/sj.bjp.0705755
Pinto, M. C. X., Kihara, A. H., Goulart, V. A. M., Tonelli, F. M. P., Gomes, K. N., Ulrich, H., et al. (2015). Calcium signaling and cell proliferation. Cell. Signal. 27 (11), 2139–2149. doi:10.1016/j.cellsig.2015.08.006
Prevarskaya, N., Skryma, R., and Shuba, Y. (2010). Ion channels and the hallmarks of cancer. Trends Mol. Med. 16 (3), 107–121. doi:10.1016/j.molmed.2010.01.005
Rao, V. R., Perez-Neut, M., Kaja, S., and Gentile, S. (2015). Voltage-gated ion channels in cancer cell proliferation. Cancers (Basel) 7 (2), 849–875. doi:10.3390/cancers7020813
Raphaël, M., Lehen’kyi, V., Vandenberghe, M., Beck, B., Khalimonchyk, S., Vanden Abeele, F., et al. (2014). TRPV6 calcium channel translocates to the plasma membrane via Orai1-mediated mechanism and controls cancer cell survival. Proc. Natl. Acad. Sci. U. S. A. 111 (37), E3870–E3879. doi:10.1073/pnas.1413409111
Roderick, H. L., and Cook, S. J. (2008). Ca2+ signalling checkpoints in cancer: remodelling Ca2+ for cancer cell proliferation and survival. Nat. Rev. Cancer. 8 (5), 361–375. doi:10.1038/nrc2374
Rossi, A. M., and Taylor, C. W. (2020). Reliable measurement of free Ca2+ concentrations in the ER lumen using Mag-Fluo-4. Cell Calcium 87, 102188. doi:10.1016/j.ceca.2020.102188
Schmeitz, C., Hernandez-Vargas, E. A., Fliegert, R., Guse, A. H., and Meyer-Hermann, M. (2013). A mathematical model of T lymphocyte calcium dynamics derived from single transmembrane protein properties. Front. Immunol. 4, 277. doi:10.3389/fimmu.2013.00277
Schönherr, R. (2005). Clinical relevance of ion channels for diagnosis and therapy of cancer. J. Membr. Biol. 205 (3), 175–184. doi:10.1007/s00232-005-0782-3
Shannon, T. R., Wang, F., Puglisi, J., Weber, C., and Bers, D. M. (2004). A mathematical treatment of integrated Ca dynamics within the ventricular myocyte. Biophys. J. 87 (5), 3351–3371. doi:10.1529/biophysj.104.047449
Shin, D. H., Leem, D. G., Shin, J. S., Kim, J. I., Kim, K. T., Choi, S. Y., et al. (2018). Compound K induced apoptosis via endoplasmic reticulum Ca2+ release through ryanodine receptor in human lung cancer cells. J. Ginseng. Res. 42 (2), 165–174. doi:10.1016/j.jgr.2017.01.015
Sneyd, J., and Dufour, J. F. (2002). A dynamic model of the type-2 inositol trisphosphate receptor. Proc. Natl. Acad. Sci. U. S. A. 99 (4), 2398–2403. doi:10.1073/pnas.032281999
Stillwell, E. F., Cone, C. M., and Cone, C. D. (1973). Stimulation of DNA synthesis in CNS neurones by sustained depolarisation. Nat. New. Biol. 246 (152), 110–111. doi:10.1038/newbio246110a0
Thebault, S., Flourakis, M., Vanoverberghe, K., Vandermoere, F., Roudbaraki, M., Lehen’kyi, V., et al. (2006). Differential role of transient receptor potential channels in Ca2+ entry and proliferation of prostate cancer epithelial cells. Cancer Res. 66 (4), 2038–2047. doi:10.1158/0008-5472.CAN-05-0376
Vaeth, M., and Feske, S. (2018). Ion channelopathies of the immune system. Curr. Opin. Immunol. 52, 39–50. Epub 2018 Apr 7. PMID: 29635109; PMCID: PMC6004246. doi:10.1016/j.coi.2018.03.021
Yang, M., and Brackenbury, W. J. (2013). Membrane potential and cancer progression. Front. Physiol. 4, 185. doi:10.3389/fphys.2013.00185
Zheng, J., Trudeau, M., Armstrong, C., Hille, B., Zagotta, W., Jan, L., et al. (2015). Handbook of ion channels. Boca Raton: CRC Press. doi:10.1201/b18027
Keywords: in silico models, electrophysiology, calcium dynamics, A549 cell line, cancer
Citation: Langthaler S, Zumpf C, Rienmüller T, Shrestha N, Fuchs J, Zhou R, Pelzmann B, Zorn-Pauly K, Fröhlich E, Weinberg SH and Baumgartner C (2024) The bioelectric mechanisms of local calcium dynamics in cancer cell proliferation: an extension of the A549 in silico cell model. Front. Mol. Biosci. 11:1394398. doi: 10.3389/fmolb.2024.1394398
Received: 01 March 2024; Accepted: 09 April 2024;
Published: 06 May 2024.
Edited by:
Vikram Dalal, Washington University in St. Louis, United StatesReviewed by:
Prince Anand, Cedars Sinai Medical Center, United StatesYusra Rahman, The University of Iowa, United States
Gourav Choudhir, JMI University, India
Gunjan Saini, Purdue University, United States
Copyright © 2024 Langthaler, Zumpf, Rienmüller, Shrestha, Fuchs, Zhou, Pelzmann, Zorn-Pauly, Fröhlich, Weinberg and Baumgartner. This is an open-access article distributed under the terms of the Creative Commons Attribution License (CC BY). The use, distribution or reproduction in other forums is permitted, provided the original author(s) and the copyright owner(s) are credited and that the original publication in this journal is cited, in accordance with accepted academic practice. No use, distribution or reproduction is permitted which does not comply with these terms.
*Correspondence: Christian Baumgartner, Y2hyaXN0aWFuLmJhdW1nYXJ0bmVyQHR1Z3Jhei5hdA==