 Tsai-Chu Yeh
 Chun-Tung Kuo
 Yu-Bai Chou
- 1Department of Ophthalmology, Taipei Veterans General Hospital, Taipei, Taiwan
- 2School of Medicine, National Yang Ming Chiao Tung University, Taipei, Taiwan
- 3Institute of Health Behaviors and Community Sciences, College of Public Health, National Taiwan University, Taipei, Taiwan
- 4School of Public Health, National Defense Medical Center, Taipei, Taiwan
Background: The remarkable increase in prevalence and significant morbidity of neurodegenerative diseases pose a tremendous burden for the health care system. Changes in retinal microvasculature metrics associated with Alzheimer's disease (AD) and mild cognitive impairment (MCI) may provide opportunities for early diagnosis and intervention. However, the role of retinal vascular biomarkers remains controversial. We aim to perform a systematic review, meta-analysis and meta-regression to evaluate the comprehensive retinal microvasculature changes in patients with AD and MCI.
Methods: We conducted a literature search on PubMed, MEDLINE, and EMBASE to identify studies published before May 2021 which assessed the measurements of optical coherence tomography angiography (OCTA) between AD, MCI with healthy control eyes, including foveal avascular zone (FAZ), vessel density (VD) of peripapillary, superficial and deep capillary plexus, and choroidal thickness using a random-effect model. We also performed meta-regression and subgroup analysis and assessed heterogeneity and publication bias to evaluate potential sources of bias.
Results: Compared with control eyes, VD of superficial capillary plexus was significantly lower in AD [standardized mean difference (SMD): −0.48; 95% CI (−0.70 to −0.27); p = 0.04] and MCI eyes [SMD: −0.42; 95% CI (−0.81 to −0.03); p = 0.03], as well as reduced VD of deep capillary plexus [SMD: −1.19; 95% CI (−2.00 to −0.38]; p < 0.001], [SMD: −0.53; 95% CI (−0.85 to −0.22); p < 0.001]. FAZ was significantly enlarged in AD eyes [SMD: 0.54; 95% CI (0.09 to 0.99); p = 0.02]. The meta-regression analysis showed that the OCTA machine type and macular scan size significantly influenced the variation of VD and FAZ between AD and control eyes (p < 0.05).
Conclusion: Our results highlight the potential of OCTA as a biomarker to detect early microvasculature deficits in AD and MCI. Notably, the macular scan size and different OCTA machine type could explain the heterogeneity observed in literatures. This information might be useful for future longitudinal study design to evaluate the role of OCTA in monitoring disease progression and treatment efficacy.
Highlights
- Compared with control eyes, vessel density of superficial capillary plexus and deep capillary plexus were significantly lower in both Alzheimer's disease (AD) and mild cognitive impairment (MCI) subjects.
- Despite the strong correlation observed, the results of our meta-regression showed that the macular scan area and OCTA machine type had a significant impact on the effect sizes regarding the differences of vessel density (VD) and foveal avascular zone area in AD and MCI subjects.
- Although a lower VD of the deep capillary plexus (DCP) of AD compared to MCI did not reach the significant level, a strong correlation was seen in the forest plot and may likely present significance with more longitudinal studies in the future.
Introduction
Alzheimer's Disease (AD) is the most common subtype of dementia, clinically characterized by progressive cognitive deficits, with an estimated 24 million individuals affected worldwide (Mayeux and Stern, 2012; Hebert et al., 2013). Mild cognitive impairment (MCI) is considered a transitional stage between normal aging and dementia and is associated with a high risk of progression to AD (Gauthier et al., 2006). Although its pathological changes precede the onset of dementia, early detection remains challenging. Because the AD diagnosis mainly relies on examinations such as cerebrospinal fluid (CSF) and Positron emission tomography (PET) scan, which are expensive and invasive procedures that are not applicable as large-scale screening tools. Currently available therapies for AD aim to initiate early intervention and maximize the remaining activity of the neurons to prevent memory decline (Fish et al., 2019). Hence, it is imperative to discover new biomarkers that can identify individuals with earlier stages of AD who would more likely benefit from potential treatments.
Due to its embryologic origin and cellular resemblances with the brain, the retina has long been viewed as a window to the central nervous system (CNS; London et al., 2013; Madeira et al., 2015; Trost et al., 2016). Changes in retinal microvascular condition may provide information on various neurodegenerative diseases, including AD, and serve as disease-related biomarkers. Moreover, compared to other CNS structures, the retina can be easily visualized using non-invasive retinal imaging tools.
Over the past decade, there have been enormous advances in ophthalmic imaging techniques with enhanced contrast, resolution, and accessibility. Among all the latest technologies, optical coherence tomography angiography (OCTA) has been a landmark discovery in ophthalmology. OCTA enables the characterization of vasculatures in layered retinal structure at the micrometer level within seconds, providing a quantitative and qualitative assessment of the microvascular structure in the retina (Spaide et al., 2018). With these ability, OCTA is a powerful tool to detect neurodegenerative process of AD in the CNS.
Since then, studies have reported abnormalities on OCTA of AD and MCI patients, suggesting the association of retinal microvascular dysfunction and neurodegenerative changes (Bulut et al., 2018; Jiang et al., 2018a; Lahme et al., 2018; Yoon et al., 2019; Zabel et al., 2019; Zhang et al., 2019; Chua et al., 2020; Criscuolo et al., 2020; van de Kreeke et al., 2020; Wu et al., 2020; Shin et al., 2021; Wang et al., 2021). Bulut et al. (2018) were the first to use OCTA to demonstrate retinal vascular changes in AD. They found that decreased vessel density (VD) in superficial capillary plexus (SCP) significantly correlates with Mini-Mental State Examination (MMSE) scores in AD patients, and foveal avascular zone (FAZ) is enlarged compared to healthy controls (Bulut et al., 2018). Although the underlying mechanisms in this association remain unknown, one proposed hypothesis regards the deposition of β-amyloid (Aβ) plaques, which have been found to accumulate in cerebral blood vessels and the retina, mainly in the ganglion cell layer (GCL) and retinal nerve fiber layer (RNFL; Koronyo-Hamaoui et al., 2011; Gupta et al., 2016; Mirzaei et al., 2019). While there is evidence reporting changes in VD and FAZ areas in early AD, studies carried out by some other groups failed to detect a significant difference in these measurements (Querques et al., 2019; Wu et al., 2020). Given the inconsistent results regarding OCTA characteristics in AD and MCI, the role of retinal vascular biomarkers remains inconclusive.
In view of the controversies and limitations in previous studies, we aim to conduct a systematic review and meta-analysis to evaluate retinal microvascular changes on OCTA in AD and MCI patients. In addition, we evaluated the effect of potential confounders, including MMSE score, age, gender, OCT model, and macular scan size using meta-regression.
Methods
Eligibility Criteria
We conducted a systemic review and meta-analysis to assess the OCTA measurements in AD and MCI, in accordance with the guidelines presented by the Cochrane Collaboration TC (2011) and Meta-analysis Of Observational Studies in Epidemiology (MOOSE) guideline (Stroup et al., 2000).
We included studies that fulfilled all the inclusion criteria listed below:
1. Original study with case-control design.
2. Primary aim of evaluating the measurements of OCTA in subjects with AD, MCI in addition to controls.
3. AD, MCI subjects diagnosed according to established diagnostic criteria [e.g., Diagnostic and Statistical Manual of Mental Disorders (DSM)-III, DSM-IV, National Institute on Aging and Alzheimer's Association (NIA-AA), National Institute of Neuro- logical, Communicative Disorders and Stroke-Alzheimer Disease and Related Disorders Association (NINDS-ADRDA), Petersen Criteria, The modified Telephone Interview for Cognitive Status (TICS-M), and Clinical Dementia Rating (CDR)].
4. OCTA measurements reported in mean and standard deviation (SD).
5. Studies on human subjects.
The exclusion criteria were as follows:
1. Studies reported only TD-OCT or SD-OCT data.
2. Review articles, case reports, conference abstracts, letters to the editor, and all other study types that did not add original data.
3. Studies that failed to exclude poor-quality OCTA images.
4. Studies diagnosed AD or MCI with unestablished diagnostic criteria.
5. Studies including individuals with cardiovascular disease, cerebrovascular disease or diabetes mellitus were excluded.
Search Strategy
Two independent reviewers (TCY and CTK) conducted a systematic and comprehensive search in PubMed and EMBASE database from 1 January 2014 to 1 May 2021. We used the medical subject headings (MeSH) for the PubMed query with the following (Tomography, Optical Coherence [MeSH] AND (Retinal Diseases[MeSH Terms]) OR (Retinal Vessels[MeSH Terms])) AND (((((Dementia[MeSH Terms]) OR (Alzheimer's Disease[MeSH Terms])) OR (Cognitive Dysfunction[MeSH Terms])) OR (“Cognitive Impairment”)) OR (“Cognitive Decline”)). The literature search was limited to English-written full-text manuscripts that were published in peer-reviewed journals. The list of the detailed search strategy is presented in Figure 1 in accordance with the Preferred Reporting Items for Systematic Reviews and Meta- Analysis (PRISMA). To reduce the chance of missing relevant articles, we also manually searched the reference lists of all gray literature, including relevant articles and reviews. No ethical approval was required for this review study.
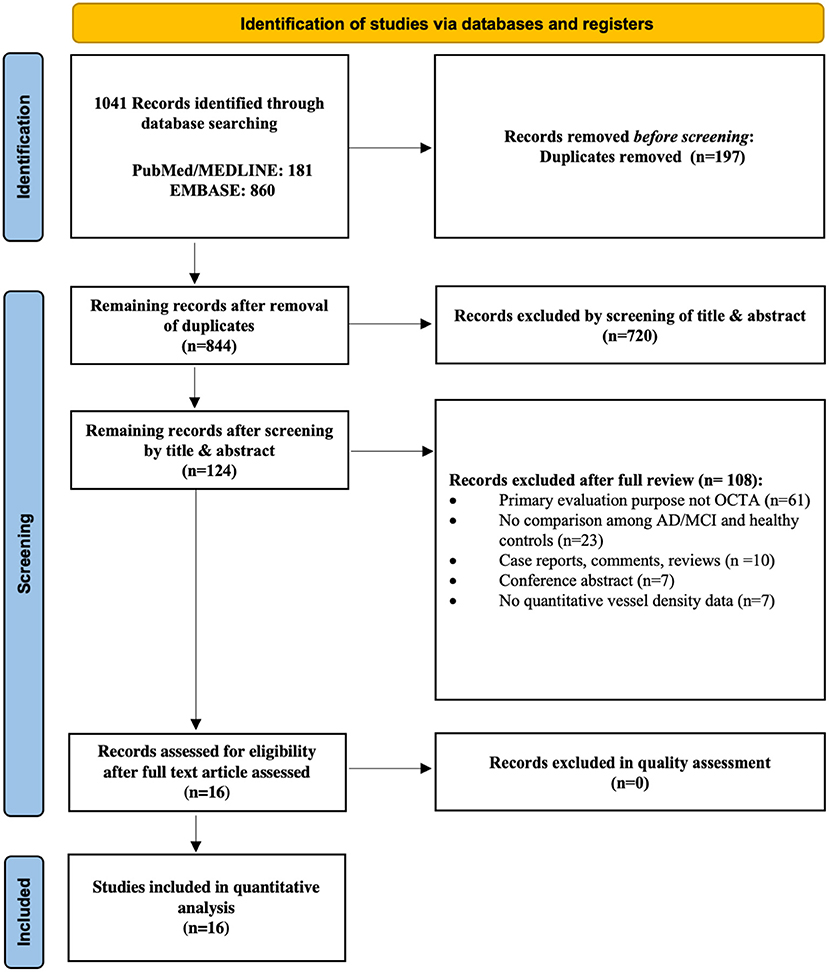
Figure 1. Flow chart of search strategy. The flow chart illustrates the search strategy according to the guidelines of the Preferred Reporting Items for Systematic reviews and Meta-Analyses (PRISMA) 2020 statement.
Data Extraction
Two reviewers (TCY and CTK) independently read each article to ascertain its eligibility and extracted data. Disagreements were resolved by discussions with a senior reviewer (CYB). Extracted information included authors, the title of the study, publication year, country, method of eye selection (i.e., analysis including one eye or both eyes of each subject), number of subjects in each population, mean age, gender ratio, mean MMSE score, OCT model, macular scan size (3x3 or 6x6 mm2), method of VD assessment (whether provided by the device or calculated by software or manually), and minimum SSI accepted for a quality scan. The Newcastle-Ottawa Scale criteria were used to assess the quality of the included case-control studies, with a scale range of 0–9 points (Table 1; Stang, 2010; Wells et al., 2016).
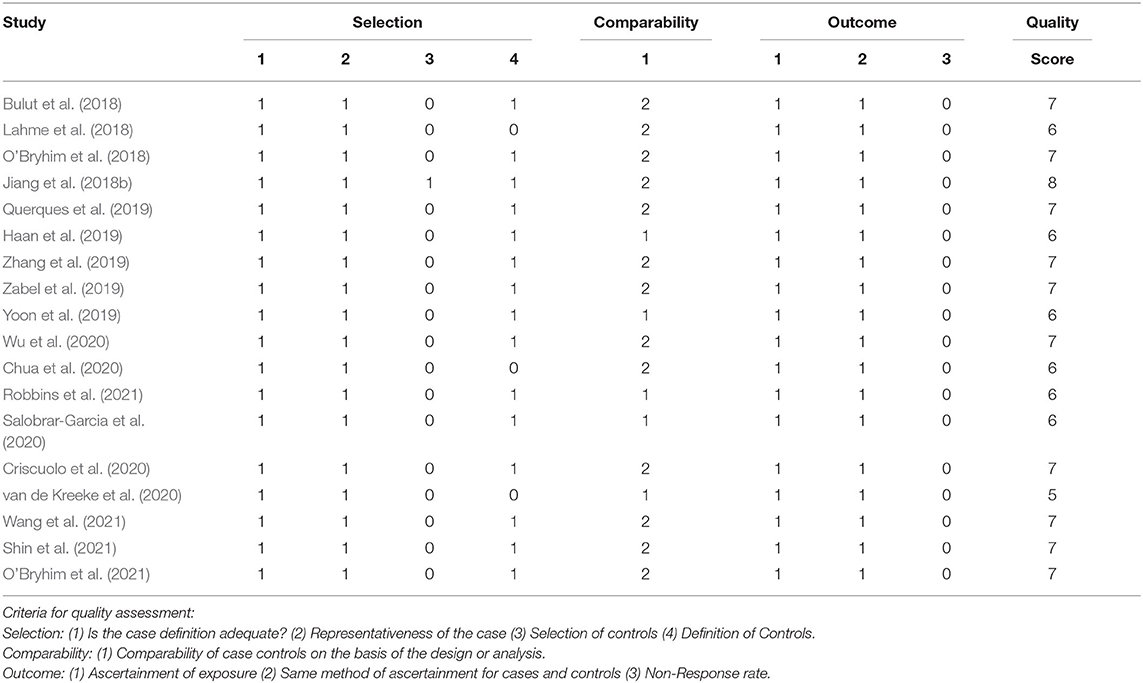
Table 1. Newcastle-Ottawa Quality Assessment Scale of case control studies.
The primary outcome variables of OCTA measurements (in mean and SD) include FAZ, VD in SCP, DCP, and peripapillary. The value of each sub-sector of the measured area, if any, was also extracted. We calculated the average values of multiple subsectors using Review Manager Software (version 5.3; Cochrane Collaboration, Oxford, United Kingdom).
Statistical Analysis
We performed meta-analyses, heterogeneity analysis, subgroup analyses, assessment of publication bias, and meta-regression by Stata software (StataCorp, Texas; version 16.0). Means and standard deviations were used to calculate the standard mean difference (SMD) with respective 95% confidence interval (CI) for continuous variables. We applied random-effect models in all meta-analyses with the restricted maximum likelihood (REML) method. The REML estimation has previously been advocated for continuous outcomes (Veroniki et al., 2016). We tested between-group heterogeneity using the I2 test. The I2 statistic ranges from 0 to 100%, with 25, 50, and 75% indicating low, moderate, and high between-study heterogeneity. In addition, we assessed potential publication bias using Egger's Tests.
Random-effects meta-regression was performed to assess the potential confounders on the effect sizes. The included variables were mean MMSE scores, mean age differences between study groups, gender ratio differences, OCT model, and macular scan size. We performed subgroup analyses according to the types of OCTA model and macular scan size. Additionally, we performed sensitivity analyses to account for unmeasured confounding, as random-effects meta-analyses of observational studies can result in biased estimates if the synthesized studies contain unmeasured confounding (Mathur and VanderWeele, 2020). We determined the minimum strength for an unmeasured confounder on the risk ratio scale (E-value) required to eliminate the SMDs between case and control groups. The E-value was defined as the minimal magnitude of association that an unmeasured confounder needs to have with both the exposure and the outcome to fully explain a specific exposure-outcome association (Mathur and VanderWeele, 2020). P-values < 0.05 were indicated as statistically significant, and all statistical analyses were two-tailed.
Risk of Bias Assessment
A risk of bias assessment for each study was performed by applying a standardized QUADAS-2 assessment (Figure 2). TCY and CTK independently assessed the risk of bias, and disagreements were resolved by discussions with a senior reviewer (CYB). Egger's test was used to evaluate publication bias.

Figure 2. Risk of bias summary using the QUADAS-2 assessment. We assessed study quality using the QUADAS-2, which evaluates risk of bias and applicability issues in patient selection, index test, reference standard, and flow and timing.
Results
Study Selection
Figure 1 illustrates the selection process for the 16 studies included in the meta-analysis. A total of 1041 relevant articles were initially identified across all databases. After removal of duplicates, the remaining 844 studies were screened based on their titles and abstracts. A total of 828 studies were then excluded for various reasons including those not related to AD, MCI, and OCTA, yielding 16 case-control studies involving 444 AD subjects, 391 MCI subjects and 770 controls ultimately eligible for the quantitative analysis. The study by van de Kreeke et al. (2020) was not included in the meta-analysis as it did not report average vessel density between groups. In addition, although Jiang et al. (2018b) measured SCP and DCP in both AD and MCI patients, the original data was not provided to conduct meta-analyses. Despite the possible duplicate populations of authors such as O'Bryhim et al. (2018, 2021), we extracted different outcome variables in these studies. The relevant studies excluded due to insufficient data to perform meta-analyses were still included in the systemic review, and the main characteristics of all studies are presented in Table 2.
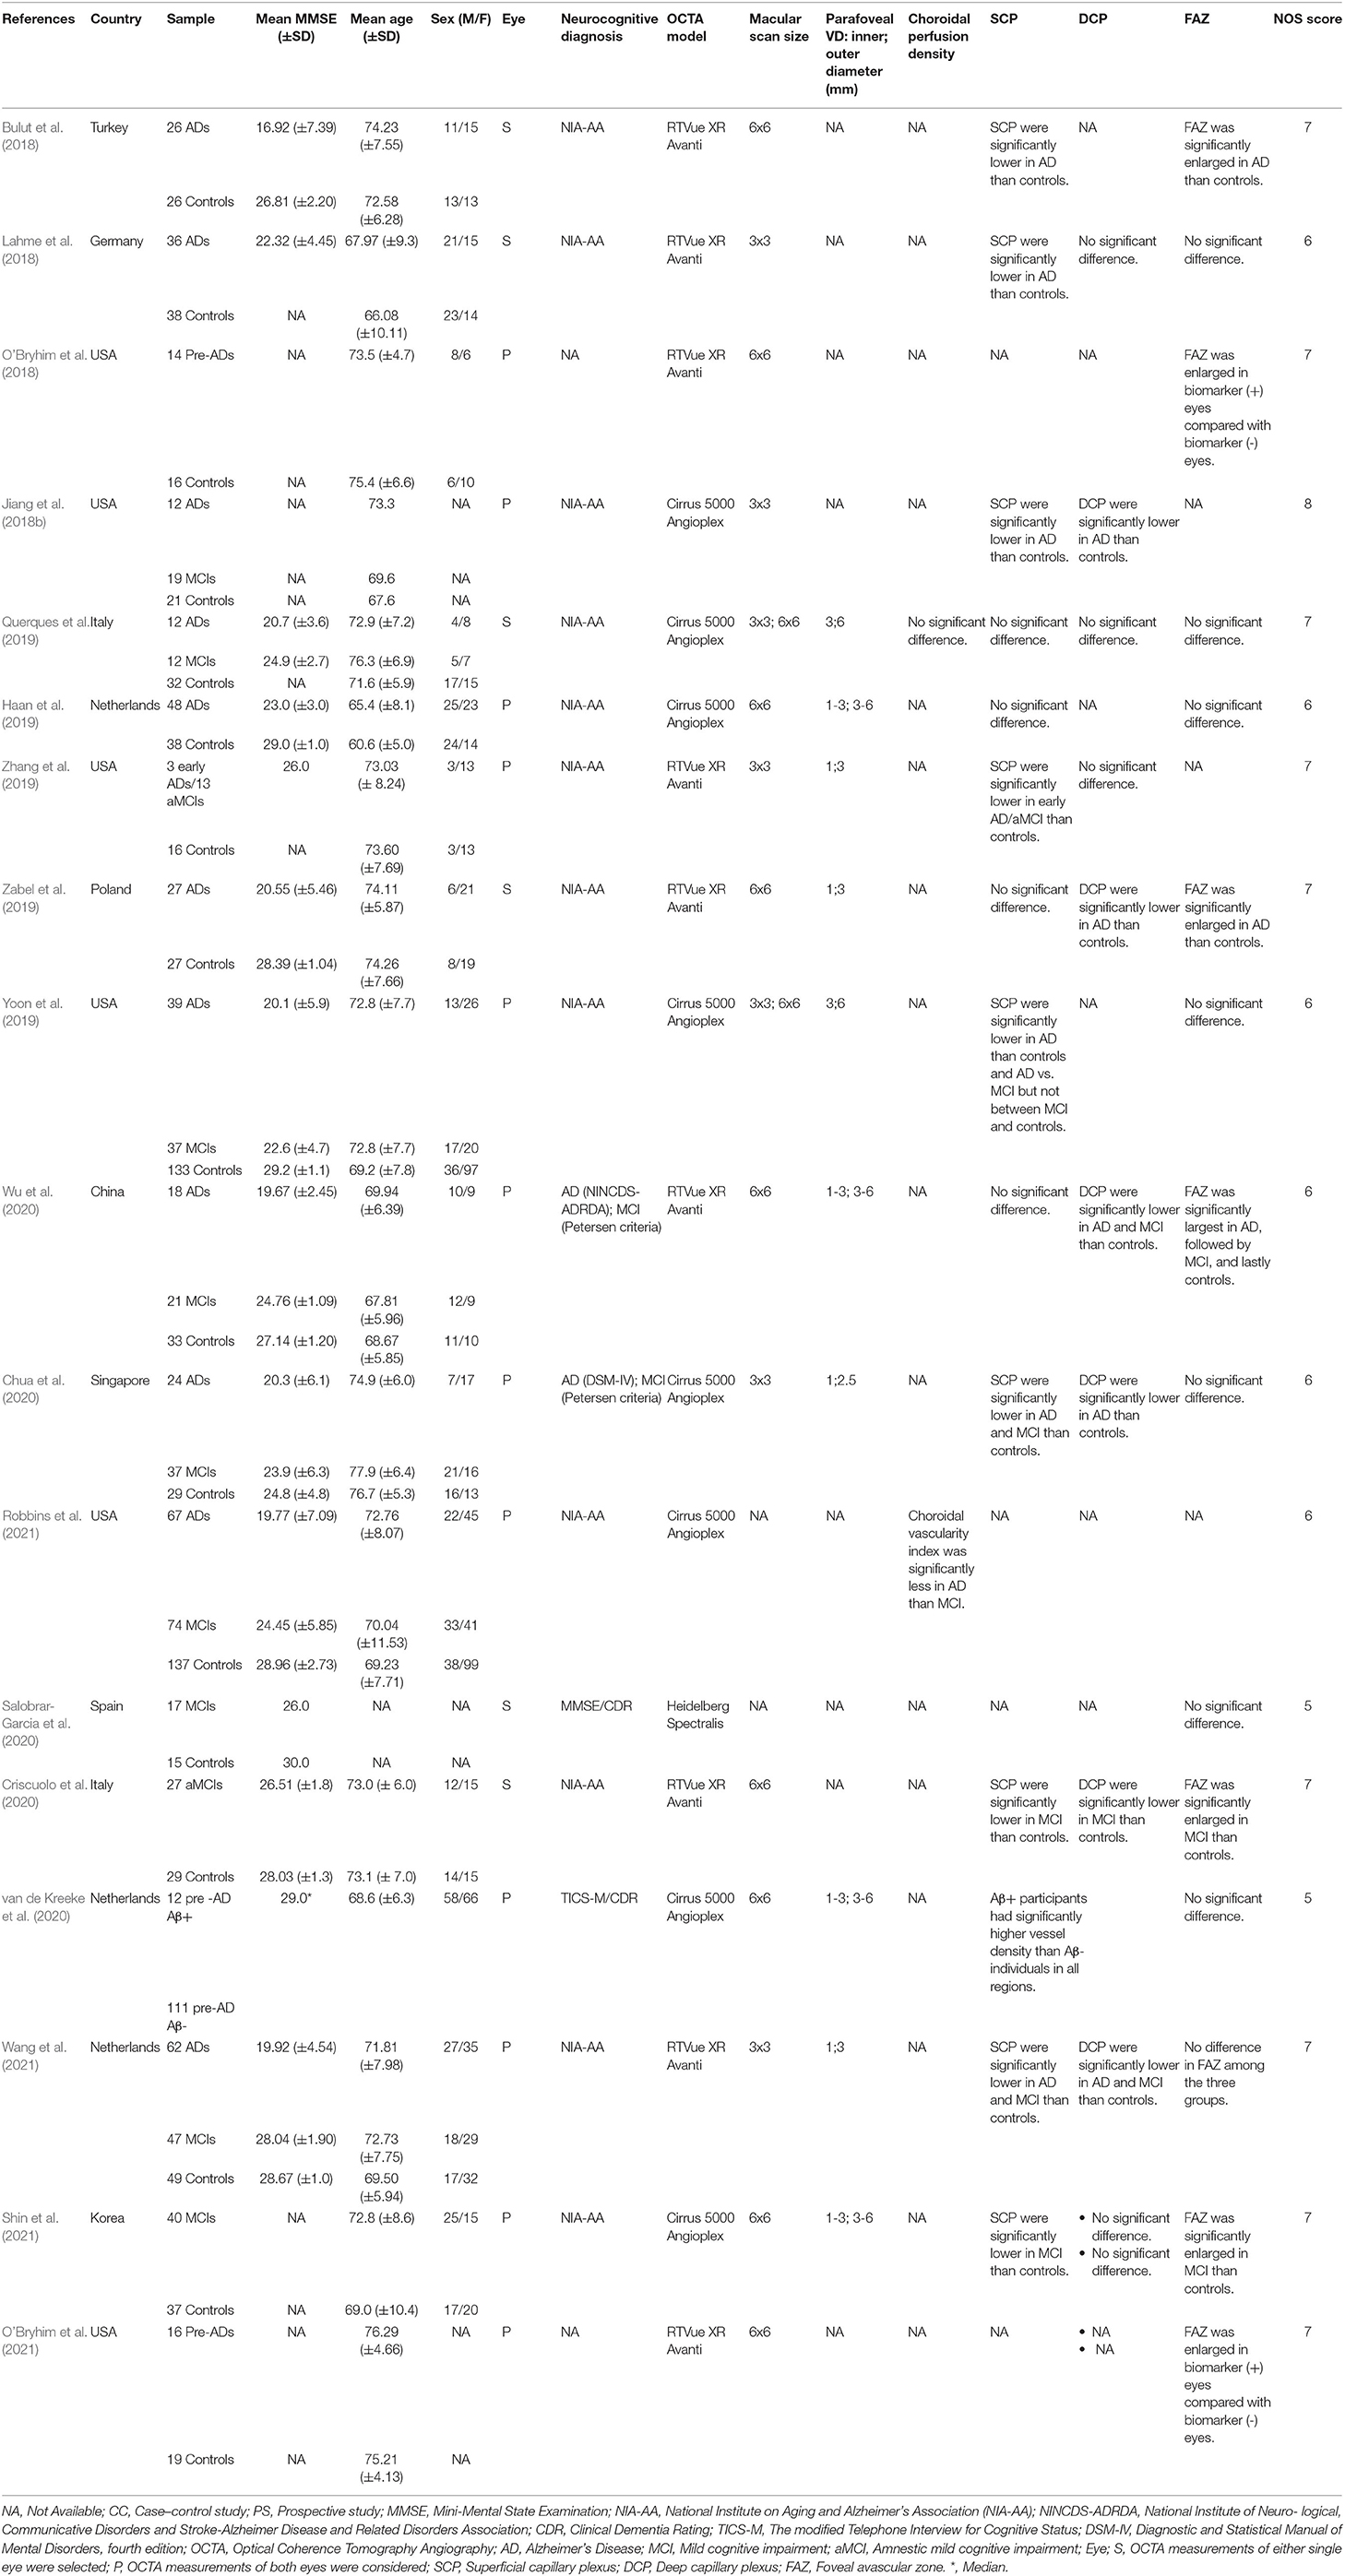
Table 2. Summary of included case control studies on individuals with Alzheimer's disease and mild cognitive impairment.
In all studies, there were no significant differences in mean age between the AD, MCI, and control groups. The mean MMSE scores in the control group ranged from 24.8 to 30.0, whereas scores in the MCI group ranged from 22.6 to 28.0, and scores in the AD group ranged from 16.9 to 23.0. Regarding the OCTA models, nine studies used the RTVue XR Avanti (Optovue, Inc., Fremont, CA, USA; Lahme et al., 2018; O'Bryhim et al., 2018, 2021; Zabel et al., 2019; Zhang et al., 2019; Criscuolo et al., 2020; Wu et al., 2020; Wang et al., 2021), six studies used the Zeiss Cirrus HD-5000 with AngioPlex (Carl Zeiss Meditec, Dublin, CA; Haan et al., 2019; Querques et al., 2019; Yoon et al., 2019; Chua et al., 2020; Robbins et al., 2021; Shin et al., 2021), and one study used Heidelberg Spectralis (Salobrar-Garcia et al., 2020).
Superficial Capillary Plexus VD
Vessel density of SCP significantly lower in the AD and MCI groups compared to controls (Figures 3, 4). Microvascular densities of SCP were significantly lower in AD vs. controls (SMD, −0.48; 95% CI, −0.70 to −0.27; p = 0.04; I2 = 48.21%), and MCI vs. controls (SMD, −0.42; 95% CI, −0.81 to −0.03; p = 0.03; I2 = 79.29%). To nullify the above pooled SMD estimates of vessel density in SCP, an unmeasured confounder would need to be associated with a risk ratio of 2.47 and 2.29 for AD or MCI risk and OCTA retinal measurements, respectively.
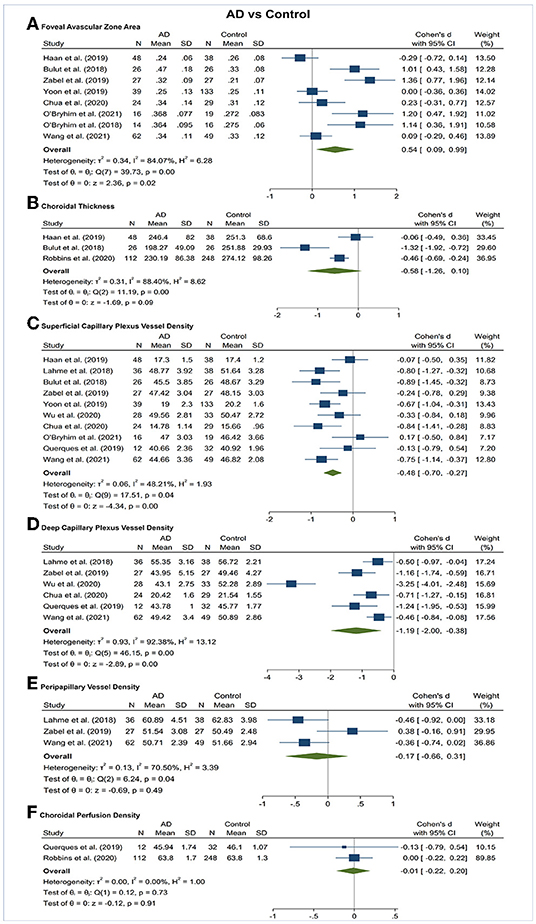
Figure 3. Forest plot of OCTA measurements between subjects with Alzheimer's Disease (AD) and healthy controls. The meta-analyses were conducted with a random-effects model. Horizontal bar indicates 95% confidence intervals (CI), and the size of the squares denotes the weight attributed to each article. The diamonds represent the standardized mean differences with the width showing the 95% CI. (A) Foveal avascular zone area. (B) Choroidal thickness. (C) Superficial capillary plexus vessel density. (D) Deep capillary plexus vessel density. (E) Peripapillary vessel density. (F) Choroidal perfusion density.
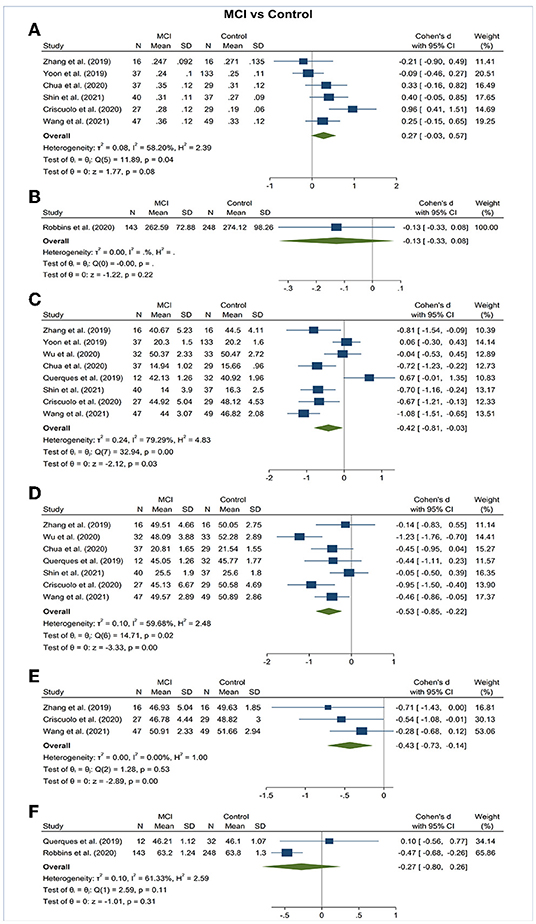
Figure 4. Forest plot of OCTA measurements between subjects with mild cognitive impairment (MCI) and healthy controls. The meta-analyses were conducted with a random-effects model. Horizontal bar indicates 95% confidence intervals (CI), and the size of the squares denotes the weight attributed to each article. The diamonds represent the standardized mean differences with the width showing the 95% CI. (A) Foveal avascular zone area. (B) Choroidal thickness. (C) Superficial capillary plexus vessel density. (D) Deep capillary plexus vessel density. (E) Peripapillary vessel density. (F) Choroidal perfusion density.
The results of subsector and quadrantal analyses revealed a significantly superficial microvascular loss between AD and healthy controls in the fovea (<1 mm from the fovea; SMD, −0.38; 95% CI, −0.66 to −0.10; p = 0.01; I2 = 36.57%), and the parafovea region (1.0–3.0 mm from the fovea; SMD, −0.48; 95% CI, −0.71 to −0.25; p < 0.001; I2 = 41.55%) (Supplementary Figures 1–3). The E-values would be 2.18 and 2.47 for AD risk and OCTA measurements to nullify the above pooled SMDs. There was no significant difference in superficial microvascular density in other regions, including superior, inferior, nasal, and temporal.
Deep Capillary Plexus VD
Vessel density of DCP was significantly decreased in the AD and MCI groups compared to controls (Figures 3, 4). Microvascular densities of DCP were significantly decreased in AD vs. controls (SMD, −1.19; 95% CI, −2.00 to −0.38; p < 0.001; I2 = 92.38%), and MCI vs. controls (SMD, −0.53; 95% CI, −0.85 to −0.22; p < 0.001; I2 = 59.68%). To nullify the above pooled SMD estimates of vessel density in DCP, an unmeasured confounder would need to be associated with a risk ratio of 5.35 and 2.62 for AD or MCI risk and OCTA measurements, respectively. The results of subsector and quadrantal analyses did not show significant differences in deep microvascular loss between AD and healthy controls, which may be due to the limited numbers of studies reporting the subsector DCP in subjects with AD or MCI.
Radial Peripapillary Capillary (RPC) VD
Vessel density of RPC revealed no significant difference in the AD and MCI groups compared to controls (Figures 3, 4).
Foveal Avascular Zone (FAZ) Area
The area of the FAZ was significantly larger in AD subjects compared to controls (SMD, 0.54; 95% CI, 0.09 to 0.99; p = 0.02; I2 = 84.07%) (Figure 3). To nullify the pooled SMD estimates of FAZ, an unmeasured confounder would need to be associated with a risk ratio of 2.65 for AD risk and OCTA measurements. There was no statistical difference in the FAZ area between either AD subjects and MCI subjects or MCI subjects and controls (Figures 4, 5).
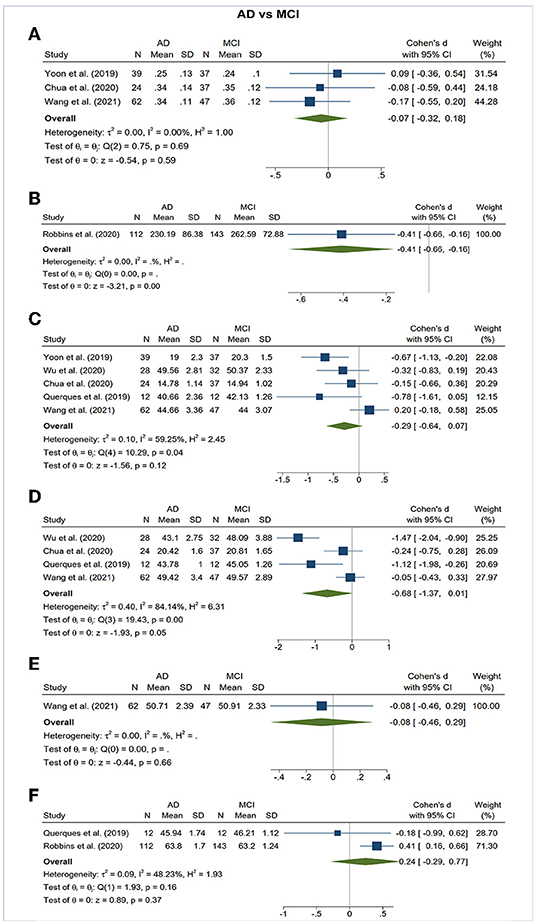
Figure 5. Forest plot of OCTA measurements between subjects with Alzheimer's Disease (AD) and mild cognitive impairment (MCI). The meta-analyses were conducted with a random-effects model. Horizontal bar indicates 95% confidence intervals (CI), and the size of the squares denotes the weight attributed to each article. The diamonds represent the standardized mean differences with the width showing the 95% CI. (A) Foveal avascular zone area. (B) Choroidal thickness. (C) Superficial capillary plexus vessel density. (D) Deep capillary plexus vessel density. (E) Peripapillary vessel density. (F) Choroidal perfusion density.
Choroidal Thickness
There was no statistical difference in choroidal thickness between either AD subjects and MCI subjects compared to controls (Figures 3, 4).
Meta-Regression
We performed meta-regression on studies comparing mean MMSE scores, mean age, gender ratio, OCT model, and macular scan size macular thickness between AD, MCI, and controls (Table 3). Our results showed significant associations between the type of OCTA model and the effect sizes of the foveal avascular zone between AD and controls (β = 0.923; p = 0.008; r2 = 53.72%). Furthermore, there were also significant associations between the macular scan size and the effect sizes of the area of foveal avascular zone between MCI and controls (β = 0.543, p = 0.030; r2 = 71.57%), the effect sizes of the SCP differences between AD and controls (β = 0.422, p = 0.008; r2 = 100%), and effect sizes of the DCP differences between AD and controls (β = −1.438, p = 0.031; r2 = 47.34%). All other factors had no significant impact (p > 0.05) on the effect sizes of the differences of VD in SCP and DCP or FAZ in AD, MCI groups.
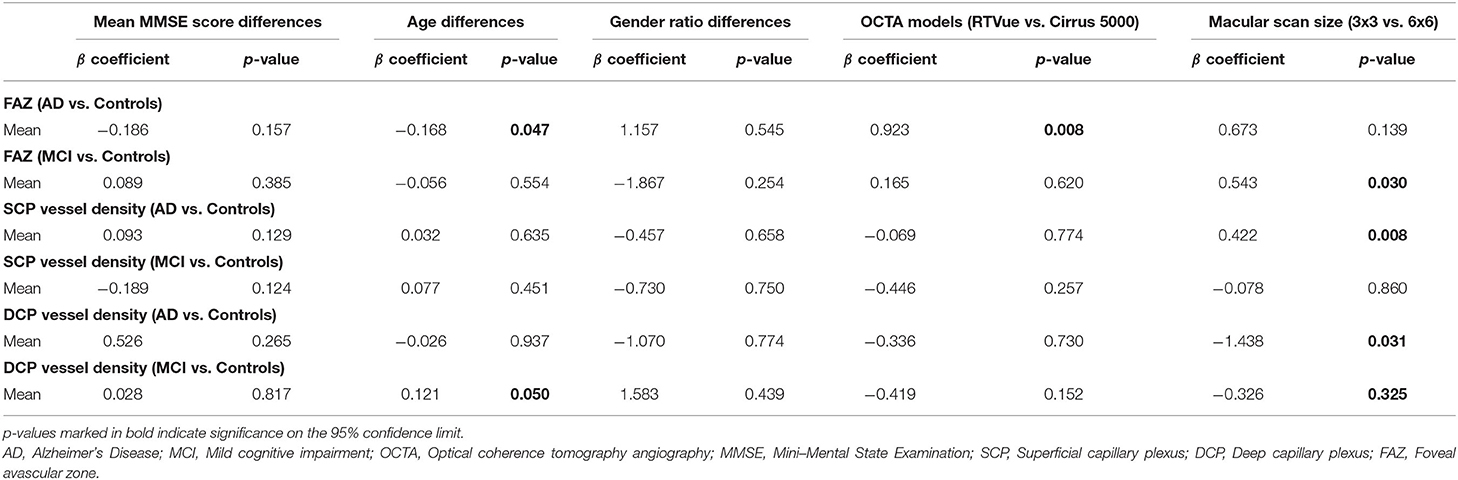
Table 3. Results of meta-regression analysis: we performed random-effects meta-regression to assess the impact of study characteristics and potential confounders on the effect sizes of OCTA measurements, using SMD as the outcome variable.
Subgroup Analysis
Subgroup analyses were performed to compare the effect sizes between studies using RTVue XR Avanti and Cirrus 5000 Angioplex, and studies with a macular scan size of 3x3 and 6x6 mm. We observed that the differences of FAZ area between AD and controls were only statistically significant (p < 0.05) among studies using RTVue XR Avanti and a macular scan size of 6x6 mm. Likewise, the differences in FAZ area between MCI and controls were only statistically significant among studies with a macular scan size of 6x6 mm.
Regarding VD, the differences of SCP between MCI and controls was only statistically significant among studies with a macular scan size of 6x6 mm (Supplementary Figures 4, 5).
Publication Bias and Risk of Bias
Egger's tests showed no publication bias in most of the analyses (P ≥ 0.05) (Table 4), except for the analyses of the FAZ area and DCP vessel density between AD and healthy controls. Most of the eligible studies were of low risk of bias (Table 5, Figure 2).
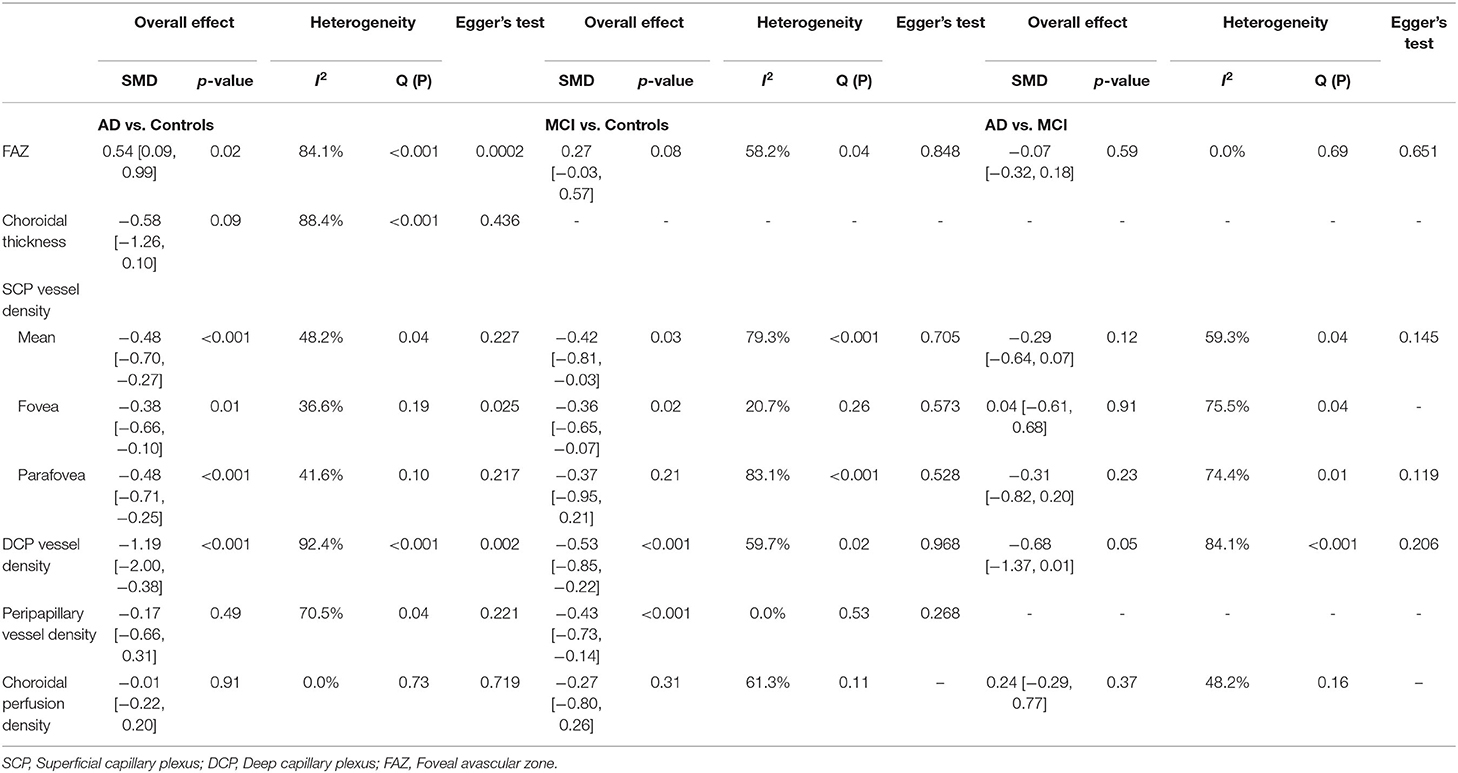
Table 4. Summary of differences of OCTA measurements and risk of publication bias using Egger's test.
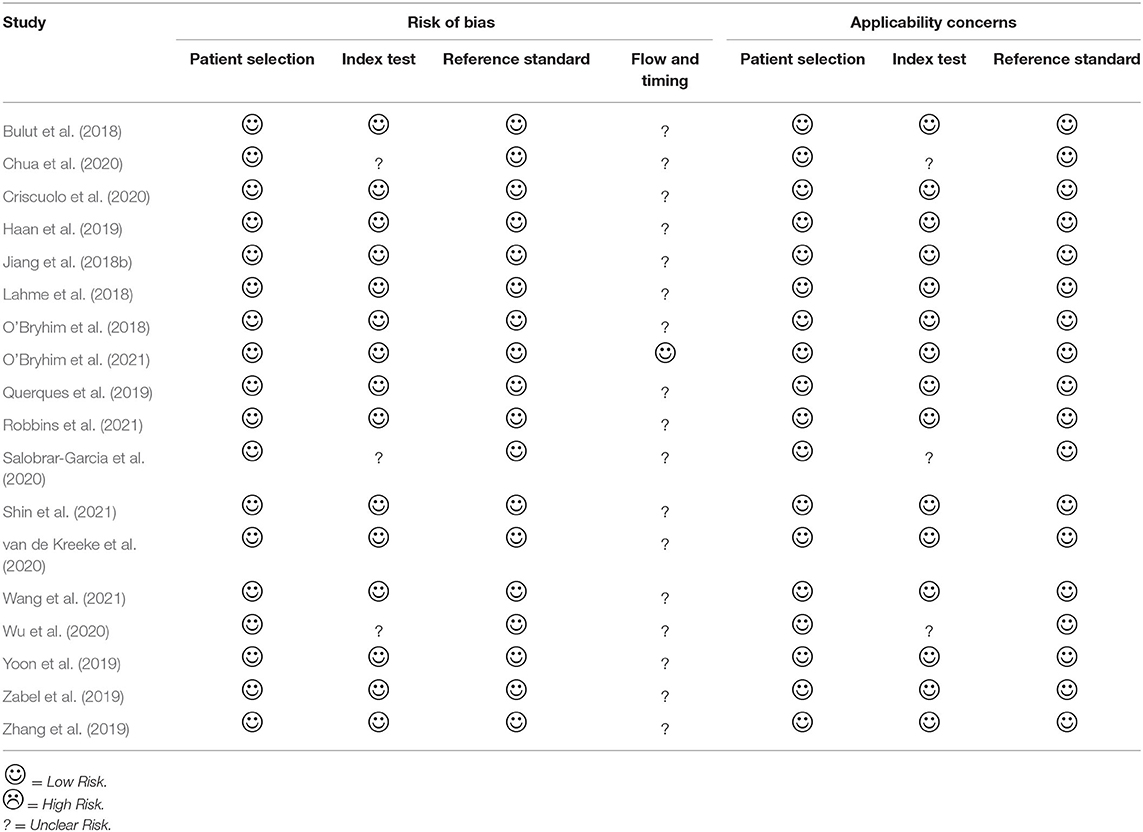
Table 5. Risk of bias summary using the QUADAS-2 assessment.
Discussions
With vast improvement in imaging technique, the OCTA have enabled researchers to explore neurodegenerative changes of the retina as an extension of the CNS. To our knowledge, this is the first meta-analysis that analyzes all the available OCTA data to evaluate microvascular impairment in the eyes of AD and MCI patients. Our study demonstrated that AD and MCI patients exhibited enlarged FAZ areas, and decreased microvascular density of SCP and DCP. We also observed a choroidal thinning trend among patients with AD and MCI, although this relationship did not reach statistical significance. Our findings contributed additional knowledge about the differences of OCTA measurements between AD and MCI and found a trend of progressively lower VD in both SCP and DCP in AD relative to MCI. These observations suggest that VD and FAZ may be potential biomarkers in screening for AD and may be used to distinguish between MCI and AD.
Patients with AD in our study demonstrated enlarged FAZ size than healthy controls. In the central macula, the superficial and deep vascular plexuses form a capillary-free region named FAZ (Snodderly et al., 1992; Yu et al., 2005). The FAZ size reflects the status of the microcapillary perfusion in the macular area, and previous studies have documented a strong correlation with the severity of capillary non-perfusion (Bresnick et al., 1984; Zeffren et al., 1990; de Carlo et al., 2015; Spaide et al., 2018). Additionally, some studies have found a close relationship between aging and FAZ size (Yu et al., 2005; Gómez-Ulla et al., 2019). Bulut et al. was the first group to identify significantly enlarged FAZ in AD patients. Although there is controversy over the changes in FAZ, enlarged FAZ in AD is consistent with the hypothesis that the decreased angiogenesis due to the Aβ binding to VEGF and the accumulation of Aβ deposits in the internal vessel walls will lead to progressive capillary dropout (Berisha et al., 2007; Dorr et al., 2012).
Our analysis also showed that VD of the SCP is generally lower in both AD and MCI patients when compared to controls group, which supports most of the previous OCTA studies. Although the magnitude failed to reach a statistical significance in MCI, which may be partly due to a small number of eligible studies, the observed trend of retinal microvascular loss from MCI to AD may indicate paralleled retinal vascular impairment during disease progression. The SCP is supplied by the central retinal artery and located primarily in the retinal nerve fiber layer (RNFL) and ganglion cell layer (GCL; Campbell et al., 2017). Notably, a meta-analysis of 30 studies that included 1,257 AD, 305 MCI, and 1,460 control cases concluded significant macular changes, including GCL deficits in AD and MCI (Chan et al., 2019). Reduced number of retinal ganglion cells and axons has also been observed in post-mortem AD retina, possibly due to the impairment of microvascular structure responsible for the metabolic supply of these regions or vice versa (Hinton et al., 1986; Blanks et al., 1996). In agreement with this hypothesis, GCL abnormalities were also reported with other neurodegenerative diseases, including multiple sclerosis, neuromyelitis optica, and cerebral atrophy (Fisher et al., 2006; Frohman et al., 2008; Monteiro et al., 2012; Ong et al., 2015). Although the mechanism underlying reduced retinal VD remains elusive, one basic assumption is that Aβ protein deposits around vascular walls and disrupts the basement membrane of small vessels. Recent studies also identified substantial early pericyte loss together with significant Aβ deposition in retinal microvasculature, marking blood-brain barrier breakdown in AD (Halliday et al., 2016; Shi et al., 2020). Interestingly, in our subgroup analyses, we observed that the differences of VD in SCP were only statistically significant in the fovea and parafoveal region (Jiang et al., 2018b). Such density changes may be vulnerable to an earlier attack by pathophysiologic stress associated with retinal vascular damage.
Changes in the DCP seen in AD patients are further complementary to the findings in SCP and the structural thinning of the inner nuclear layer (INL; Santos et al., 2018; Jáñez-Escalada et al., 2019). The DCP is important for nurturing INL, which is principally composed of cell bodies involved in the vertical transmission of information from photoreceptors via their dendrites and axonal connections (Strettoi and Masland, 1995; Gupta et al., 2020). Noteworthily, Aβ deposits have also been detected in the INL in transgenic AD mouse models (Ning et al., 2008). Although the decreased VD of the DCP between AD and MCI, or even between MCI and control, did not reach the significant level, a strong correlation was seen in the forest plot and may likely present significance with more longitudinal studies in the future.
In addition to decreased VD in the retina, we observed choroidal thinning measured by OCTA in AD. This finding did not reach statistical significance due to the limited eligible studies, but it is consistent with previous studies using OCT for choroidal measurement (Gharbiya et al., 2014; Bayhan et al., 2015; Bulut et al., 2016; Cunha et al., 2017). The choroid is primarily a vascular structure providing nutrients and oxygen to the outer retina (Nickla and Wallman, 2010). Impairment of the oxygen flow from choroid to retina may cause degenerative change and neovascularization in diseases such as age-related macular degeneration (Pauleikhoff et al., 1999; Farazdaghi and Ebrahimi, 2019). Studies have reported the accumulation of Aβ protein within choroidal vessels in a normal aging mouse model and a transgenic AD mouse model (Miao et al., 2005; Cheung et al., 2014). Local Aβ deposits in choroid may induce inflammatory response and complements activation which inevitably lead to neurodegeneration and vasoregression of choroidal vasculature through a pathological cascade previously described in CNS in the patients with AD (Marchesi, 2011; Golzan et al., 2017; Salobrar-Garcia et al., 2020).
Subgroup analyses and meta-regression were performed to evaluate the heterogeneity across different studies and explore potential sources of bias. It is noteworthy that heterogeneity is to be expected in meta-analyses of diagnostic testing, and for this reason, a random-effects model was adopted in our study. Regarding the scan area of macula, previous studies suggested that retinal microvasculature is more vulnerable to an earlier attack in the para-macular area, and loss of macular microvasculature is more likely to originate from the parafoveal annular zone (Jiang et al., 2018b). Similarly, the results of our meta-regression showed that the scan area had a significant impact on the effect sizes regarding the differences of VD in SCP and DCP and the differences of FAZ. Macular scan size of 6x6 mm2 appeared to be more sensitive in detecting early change of microvasculature especially in DCP. Likewise, RTVue XR Avanti demonstrated a more consistent finding in FAZ changes between AD and controls, which is likely a reason for the heterogeneity observed in the meta-analysis. This may be explained by differences in the integrated projection artifact removal software between Optovue RTVue XR Avanti and Zeiss Cirrus 5000 Angioplex, and the split spectrum amplitude decorrelation angiography (SSADA) algorithm employed on the Optovue system. A prior study comparing these two OCTA systems found vessel discontinuity at the FAZ border in eyes imaged by the Zeiss but not by the Optovue (Chung et al., 2018). Similarly, a study compared four OCTA systems and found that the FAZ borders were best discernable on the Optovue followed by three other modules (Heidelberg, Topcon, and Zeiss; Munk et al., 2017). The SSADA algorithm employed on the Optovue uses a four-fold spectrum split, which may have enhanced the signal to noise ratio and provide a clean and continuous microvascular network inside the FAZ (Huang et al., 2016).
Strengths and Limitations
The strengths of this meta-analysis lie in the comprehensive search and review, including the latest related studies, which helped us strengthen the findings of each study and obtain stronger evidence. Furthermore, this is to date the largest meta-analysis evaluating the role of OCTA in detecting early retinal microvasculature changes, including not only AD but MCI individuals. As recent studies suggest a critical window to early initiation of therapy, including MCI subjects may be essential to identify early pathologic biomarkers (Chalermpalanupap et al., 2013). Our study also provides a more precise estimate of the effect size and increases the generalizability of individual studies by performing stringent meta-regression and subgroup analyses. Even though heterogeneity remains among the eligible studies, we attempted to adjust for possible confounding bias in the meta-regression analysis to address the heterogeneity.
Our study has some limitations, and we have highlighted several knowledge gaps and priority needs for future research. First, there was a limited number of prospective studies included in our study. More prospective and longitudinal studies are required to provide comprehensive insights into the disease mechanism. Second, the number of studies may not be sufficient to achieve adequate statistical power in some sub-sector analyses, although the consistent trend of microvascular changes observed in AD and MCI subjects was still evident. Third, as previously discussed, pre-clinical AD and MCI subjects in different studies were not well-defined due to lack of disease-specific biomarkers and uniformed diagnostic criteria. Finally, parameters for image acquisition among different OCTA models should be documented in a standard format to compare these data across institutions reliably.
The retina provides a unique opportunity and correlation with AD. With the rise of OCTA, the potential biomarkers for early detection of AD are brighter than ever. Our findings in this meta-analysis further emphasize the role, contribution, and importance of the retinal microvasculature in the pathogenesis of AD, and may provide a roadmap for other neurodegenerative diseases.
Conclusion
In summary, our study confirmed the retinal and choroidal microvasculature deficits from OCTA measurements in AD and MCI when compared to controls, highlighting the potential role of OCTA biomarkers in AD screening, diagnosis, and disease management. As the population ages rapidly and the prevalence of neurodegenerative diseases continues to rise, we anticipate that retinal biomarkers will play a major role in detecting and monitoring disease progression.
Data Availability Statement
The original contributions presented in the study are included in the article/Supplementary Material, further inquiries can be directed to the corresponding author.
Author Contributions
T-CY and C-TK conceived and designed the study, extracted the data, and wrote the manuscript. T-CY, C-TK, and Y-BC analyzed the data, verified the data, and revised the manuscript. All authors read and approved the final manuscript.
Conflict of Interest
The authors declare that the research was conducted in the absence of any commercial or financial relationships that could be construed as a potential conflict of interest.
Publisher's Note
All claims expressed in this article are solely those of the authors and do not necessarily represent those of their affiliated organizations, or those of the publisher, the editors and the reviewers. Any product that may be evaluated in this article, or claim that may be made by its manufacturer, is not guaranteed or endorsed by the publisher.
Supplementary Material
The Supplementary Material for this article can be found online at: https://www.frontiersin.org/articles/10.3389/fnagi.2022.860759/full#supplementary-material
Abbreviations
AD, Alzheimer's disease; MCI, Mild cognitive impairment; aMCI, Amnestic mild cognitive impairment; VD, vessel density; OR, Odds ratio; CI, Confidence interval; SMD, Standardized mean difference; CC, Case–control study; PS, Prospective study; MMSE, Mini-Mental State Examination; NIA-AA, National Institute on Aging and Alzheimer's Association; NINCDS-ADRDA, National Institute of Neurological, Communicative Disorders and Stroke-Alzheimer Disease and Related Disorders Association; CDR, Clinical Dementia Rating; TICS-M, The modified Telephone Interview for Cognitive Status; DSM-IV, Diagnostic and Statistical Manual of Mental Disorders, fourth edition; OCTA, Optical Coherence Tomography Angiography; Eye, ; S, OCTA measurements of either single eye were selected; P, OCTA measurements of both eyes were considered; SCP, Superficial capillary plexus; DCP, Deep capillary plexus; FAZ, Foveal avascular zone.
References
Bayhan, H. A., Aslan Bayhan, S., Celikbilek, A., Tanik, N., and Gürdal, C. (2015). Evaluation of the chorioretinal thickness changes in Alzheimer's disease using spectral-domain optical coherence tomography. Clin. Exp. Ophthalmol. 43, 145–151. doi: 10.1111/ceo.12386
Berisha, F., Feke, G. T., Trempe, C. L., McMeel, J. W., and Schepens, C. L. (2007). Retinal abnormalities in early Alzheimer's disease. Invest. Ophthalmol. Vis. Sci. 48, 2285–2289. doi: 10.1167/iovs.06-1029
Blanks, J. C., Torigoe, Y., Hinton, D. R., and Blanks, R. H. (1996). Retinal pathology in Alzheimer's disease. I. Ganglion cell loss in foveal/parafoveal retina. Neurobiol. Aging 17, 377–384. doi: 10.1016/0197-4580(96)00010-3
Bresnick, G. H., Condit, R., Syrjala, S., Palta, M., Groo, A., and Korth, K. (1984). Abnormalities of the foveal avascular zone in diabetic retinopathy. Archiv. Ophthalmol. 102, 1286–1293. doi: 10.1001/archopht.1984.01040031036019
Bulut, M., Kurtuluş, F., Gözkaya, O., Erol, M. K., Cengiz, A., Akidan, M., et al. (2018). Evaluation of optical coherence tomography angiographic findings in Alzheimer's type dementia. Br. J. Ophthalmol. 102, 233–237. doi: 10.1136/bjophthalmol-2017-310476
Bulut, M., Yaman, A., Erol, M. K., Kurtuluş, F., Toslak, D., Dogan, B., et al. (2016). Choroidal thickness in patients with mild cognitive impairment and Alzheimer's type dementia. J. Ophthalmol. 2016:7291257. doi: 10.1155/2016/7291257
Campbell, J. P., Zhang, M., Hwang, T. S., Bailey, S. T., Wilson, D. J., Jia, Y., et al. (2017). Detailed vascular anatomy of the human retina by projection-resolved optical coherence tomography angiography. Sci. Rep. 7:srep42201. doi: 10.1038/srep42201
Chalermpalanupap, T., Kinkead, B., Hu, W. T., Kummer, M. P., Hammerschmidt, T., Heneka, M. T., et al. (2013). Targeting norepinephrine in mild cognitive impairment and Alzheimer's disease. Alz. Res. Ther. 5:21. doi: 10.1186/alzrt175
Chan, V. T. T., Sun, Z., Tang, S., Chen, L. J., Wong, A., Tham, C. C., et al. (2019). Spectral-domain OCT measurements in Alzheimer's disease: a systematic review and meta-analysis. Ophthalmology 126, 497–510. doi: 10.1016/j.ophtha.2018.08.009
Cheung, C. Y.-L., Ong, Y.-T., Ikram, M. K., Chen, C., and Wong, T. Y. (2014). Retinal microvasculature in Alzheimer's disease. J. Alzheimers Dis. 42(Suppl.4), S339–352. doi: 10.3233/JAD-141596
Chua, J., Hu, Q., Ke, M., Tan, B., Hong, J., Yao, X., et al. (2020). Retinal microvasculature dysfunction is associated with Alzheimer's disease and mild cognitive impairment. Alz. Res. Ther. 12:161. doi: 10.1186/s13195-020-00724-0
Chung, C. S., Nesper, P. L., Park, J. J., and Fawzi, A. A. (2018). Comparison of zeiss cirrus and optovue RTVue OCT angiography systems: a quantitative and qualitative approach examining the three capillary networks in diabetic retinopathy. Ophthalmic Surg. Lasers Imaging Retina 49, e198–e205. doi: 10.3928/23258160-20181101-18
Collaboration TC (2011). Cochrane Handbook for Systematic Reviews of Interventions Version 5.1.0. Available online at: /handbook/current (accessed May 28, 2021).
Criscuolo, C., Cennamo, G., Montorio, D., Carotenuto, A., Strianese, A., Salvatore, E., et al. (2020). Assessment of retinal vascular network in amnestic mild cognitive impairment by optical coherence tomography angiography. PLoS ONE 15:e0233975. doi: 10.1371/journal.pone.0233975
Cunha, J. P., Proença, R., Dias-Santos, A., Melancia, D., Almeida, R., Águas, H., et al. (2017). Choroidal thinning: Alzheimer's disease and aging. Alzheimers Dement. 8, 11–17. doi: 10.1016/j.dadm.2017.03.004
de Carlo, T. E., Chin, A. T., Bonini Filho, M. A., Adhi, M., Branchini, L., Salz, D. A., et al. (2015). Detection of microvascular changes in eyes of patients with diabetes but not clinical diabetic retinopathy using optical coherence tomography angiography. Retina 35, 2364–2370. doi: 10.1097/IAE.0000000000000882
Dorr, A., Sahota, B., Chinta, L. V., Brown, M. E., Lai, A. Y., Ma, K., et al. (2012). Amyloid-β-dependent compromise of microvascular structure and function in a model of Alzheimer's disease. Brain 135, 3039–3050. doi: 10.1093/brain/aws243
Farazdaghi, M. K., and Ebrahimi, K. B. (2019). Role of the choroid in age-related macular degeneration: a current review. J. Ophthalmic. Vis. Res. 14, 78–87. doi: 10.4103/jovr.jovr_125_18
Fish, P. V., Steadman, D., Bayle, E. D., and Whiting, P. (2019). New approaches for the treatment of Alzheimer's disease. Bioorgan. Medicinal Chem. Lett. 29, 125–133. doi: 10.1016/j.bmcl.2018.11.034
Fisher, J. B., Jacobs, D. A., Markowitz, C. E., Galetta, S. L., Volpe, N. J., Nano-Schiavi, M. L., et al. (2006). Relation of visual function to retinal nerve fiber layer thickness in multiple sclerosis. Ophthalmology 113, 324–332. doi: 10.1016/j.ophtha.2005.10.040
Frohman, E. M., Fujimoto, J. G., Frohman, T. C., Calabresi, P. A., Cutter, G., and Balcer, L. J. (2008). Optical coherence tomography: a window into the mechanisms of multiple sclerosis. Nat. Clin. Pract. Neurol. 4, 664–675. doi: 10.1038/ncpneuro0950
Gauthier, S., Reisberg, B., Zaudig, M., Petersen, R. C., Ritchie, K., Broich, K., et al. (2006). Mild cognitive impairment. Lancet 367, 1262–1270. doi: 10.1016/S0140-6736(06)68542-5
Gharbiya, M., Trebbastoni, A., Parisi, F., Manganiello, S., Cruciani, F., D'Antonio, F., et al. (2014). Choroidal thinning as a new finding in Alzheimer's disease: evidence from enhanced depth imaging spectral domain optical coherence tomography. J. Alzheimers Dis. 40, 907–917. doi: 10.3233/JAD-132039
Golzan, S. M., Goozee, K., Georgevsky, D., Avolio, A., Chatterjee, P., Shen, K., et al. (2017). Retinal vascular and structural changes are associated with amyloid burden in the elderly: ophthalmic biomarkers of preclinical Alzheimer's disease. Alzheimers Res. Ther. 9:13. doi: 10.1186/s13195-017-0239-9
Gómez-Ulla, F., Cutrin, P., Santos, P., Fernandez, M., Abraldes, M., Abalo-Lojo, J. M., et al. (2019). Age and gender influence on foveal avascular zone in healthy eyes. Exp. Eye Res. 189:107856. doi: 10.1016/j.exer.2019.107856
Gupta, V. B., Chitranshi, N., den Haan, J., Mirzaei, M., You, Y., Lim, J. K., et al. (2020). Retinal changes in Alzheimer's disease- integrated prospects of imaging, functional and molecular advances. Prog. Retin. Eye Res. 2020:100899. doi: 10.1016/j.preteyeres.2020.100899
Gupta, V. K., Chitranshi, N., Gupta, V. B., Golzan, M., Dheer, Y., Wall, R. V., et al. (2016). Amyloid β accumulation and inner retinal degenerative changes in Alzheimer's disease transgenic mouse. Neurosci. Lett. 623, 52–56. doi: 10.1016/j.neulet.2016.04.059
Haan, J., Kreeke, J. A., Berckel, B. N., Barkhof, F., Teunissen, C. E., Scheltens, P., et al. (2019). Is retinal vasculature a biomarker in amyloid proven Alzheimer's disease? Alzheimer's Dement. 11, 383–391. doi: 10.1016/j.dadm.2019.03.006
Halliday, M. R., Rege, S. V., Ma, Q., Zhao, Z., Miller, C. A., Winkler, E. A., et al. (2016). Accelerated pericyte degeneration and blood–brain barrier breakdown in apolipoprotein E4 carriers with Alzheimer's disease. J. Cereb. Blood Flow Metab. 36, 216–227. doi: 10.1038/jcbfm.2015.44
Hebert, L. E., Weuve, J., Scherr, P. A., and Evans, D. A. (2013). Alzheimer disease in the United States (2010-2050) estimated using the 2010 census. Neurology 80, 1778–1783. doi: 10.1212/WNL.0b013e31828726f5
Hinton, D. R., Sadun, A. A., Blanks, J. C., and Miller, C. A. (1986). Optic-nerve degeneration in Alzheimer's disease. N. Engl. J. Med. 315, 485–487. doi: 10.1056/NEJM198608213150804
Huang, D., Jia, Y., Gao, S. S., Lumbroso, B., and Rispoli, M. (2016). Optical coherence tomography angiography using the optovue device. Dev. Ophthalmol. 56, 6–12. doi: 10.1159/000442770
Jáñez-Escalada, L., Jáñez-García, L., Salobrar-García, E., Santos-Mayo, A., de Hoz, R., Yubero, R., et al. (2019). Spatial analysis of thickness changes in 10 retinal layers of Alzheimer's disease patients based on optical coherence tomography. Sci. Rep. 9:13000. doi: 10.1038/s41598-019-49353-0
Jiang, H., Liu, Y., Wei, Y., Shi, Y., Wright, C. B., Sun, X., et al. (2018a). Impaired retinal microcirculation in patients with Alzheimer's disease. PLoS ONE 13:e0192154. doi: 10.1371/journal.pone.0192154
Jiang, H., Wei, Y., Shi, Y., Wright, C. B., Sun, X., Gregori, G., et al. (2018b). Altered macular microvasculature in mild cognitive impairment and Alzheimer's disease. J. Neuro-Ophthalmol. 38, 292–298. doi: 10.1097/WNO.0000000000000580
Koronyo-Hamaoui, M., Koronyo, Y., Ljubimov, A. V., Miller, C. A., Ko, M. K., Black, K. L., et al. (2011). Identification of amyloid plaques in retinas from Alzheimer's patients and noninvasive in vivo optical imaging of retinal plaques in a mouse model. Neuroimage 54(Suppl.1), S204–S217. doi: 10.1016/j.neuroimage.2010.06.020
Lahme, L., Esser, E. L., Mihailovic, N., Schubert, F., Lauermann, J., Johnen, A., et al. (2018). Evaluation of ocular perfusion in Alzheimer's disease using optical coherence tomography angiography. J. Alzheimers Dis. 66, 1745–1752. doi: 10.3233/JAD-180738
London, A., Benhar, I., and Schwartz, M. (2013). The retina as a window to the brain-from eye research to CNS disorders. Nat. Rev. Neurol. 9, 44–53. doi: 10.1038/nrneurol.2012.227
Madeira, M. H., Ambrósio, A. F., and Santiago, A. R. (2015). Glia-mediated retinal neuroinflammation as a biomarker in Alzheimer's disease. Ophthalmic Res. 54, 204–211. doi: 10.1159/000440887
Marchesi, V. T. (2011). Alzheimer's dementia begins as a disease of small blood vessels, damaged by oxidative-induced inflammation and dysregulated amyloid metabolism: implications for early detection and therapy. FASEB J. 25, 5–13. doi: 10.1096/fj.11-0102ufm
Mathur, M. B., and VanderWeele, T. J. (2020). Sensitivity analysis for unmeasured confounding in meta-analyses. J. Am. Stat. Assoc. 115, 163–172. doi: 10.1080/01621459.2018.1529598
Mayeux, R., and Stern, Y. (2012). Epidemiology of Alzheimer's disease. Cold Spring Harb. Perspect. Med. 2:a006239. doi: 10.1101/cshperspect.a006239
Miao, J., Xu, F., Davis, J., Otte-Höller, I., Verbeek, M. M., and Van Nostrand, W. E. (2005). Cerebral microvascular amyloid beta protein deposition induces vascular degeneration and neuroinflammation in transgenic mice expressing human vasculotropic mutant amyloid beta precursor protein. Am. J. Pathol. 167, 505–515. doi: 10.1016/S0002-9440(10)62993-8
Mirzaei, M., Pushpitha, K., Deng, L., Chitranshi, N., Gupta, V., Rajput, R., et al. (2019). Upregulation of proteolytic pathways and altered protein biosynthesis underlie retinal pathology in a mouse model of Alzheimer's disease. Mol. Neurobiol. 56, 6017–6034. doi: 10.1007/s12035-019-1479-4
Monteiro, M. L. R., Fernandes, D. B., Apóstolos-Pereira, S. L., and Callegaro, D. (2012). Quantification of retinal neural loss in patients with neuromyelitis optica and multiple sclerosis with or without optic neuritis using fourier-domain optical coherence tomography. Invest. Ophthalmol. Vis. Sci. 53, 3959–3966. doi: 10.1167/iovs.11-9324
Munk, M. R., Giannakaki-Zimmermann, H., Berger, L., Huf, W., Ebneter, A., Wolf, S., et al. (2017). OCT-angiography: a qualitative and quantitative comparison of 4 OCT-A devices. PLoS ONE 12:e0177059. doi: 10.1371/journal.pone.0177059
Nickla, D. L., and Wallman, J. (2010). The multifunctional choroid. Progr. Retin. Eye Res. 29, 144–168. doi: 10.1016/j.preteyeres.2009.12.002
Ning, A., Cui, J., To, E., Ashe, K. H., and Matsubara, J. (2008). Amyloid-beta deposits lead to retinal degeneration in a mouse model of Alzheimer disease. Invest. Ophthalmol. Vis. Sci. 49, 5136–5143. doi: 10.1167/iovs.08-1849
O'Bryhim, B. E., Apte, R. S., Kung, N., Coble, D., and Van Stavern, G. P. (2018). Association of preclinical Alzheimer's disease with optical coherence tomographic angiography findings. J. Am. Med. Assoc. Ophthalmol. 136:1242. doi: 10.1001/jamaophthalmol.2018.3556
O'Bryhim, B. E., Lin, J. B., Van Stavern, G. P., and Apte, R. S. (2021). OCT angiography findings in preclinical Alzheimer's disease: 3-year follow-up. Ophthalmol. 128, 1489–1491. doi: 10.1016/j.ophtha.2021.02.016
Ong, Y.-T., Hilal, S., Cheung, C. Y., Venketasubramanian, N., Niessen, W. J., Vrooman, H., et al. (2015). Retinal neurodegeneration on optical coherence tomography and cerebral atrophy. Neurosci. Lett. 584, 12–16. doi: 10.1016/j.neulet.2014.10.010
Pauleikhoff, D., Spital, G., Radermacher, M., Brumm, G. A., Lommatzsch, A., and Bird, A. C. (1999). A fluorescein and indocyanine green angiographic study of choriocapillaris in age-related macular disease. Arch. Ophthalmol. 117, 1353–1358. doi: 10.1001/archopht.117.10.1353
Querques, G., Borrelli, E., Sacconi, R., De Vitis, L., Leocani, L., Santangelo, R., et al. (2019). Functional and morphological changes of the retinal vessels in Alzheimer's disease and mild cognitive impairment. Sci. Rep. 9:63. doi: 10.1038/s41598-018-37271-6
Robbins, C. B., Thompson, A. C., Bhullar, P. K., Koo, H. Y., Agrawal, R., Soundararajan, S., et al. (2021). Characterization of retinal microvascular and choroidal structural changes in Parkinson disease. J. Am. Med. Assoc. Ophthalmol. 139:182. doi: 10.1001/jamaophthalmol.2020.5730
Salobrar-Garcia, E., Méndez-Hernández, C., Hoz, R., de Ramírez, A. I., López-Cuenca, I., Fernández-Albarral, J. A., et al. (2020). Ocular vascular changes in mild Alzheimer's disease patients: foveal avascular zone, choroidal thickness, and ONH hemoglobin analysis. J. Pers. Med. 10:231. doi: 10.3390/jpm10040231
Santos, C. Y., Johnson, L. N., Sinoff, S. E., Festa, E. K., Heindel, W. C., and Snyder, P. J. (2018). Change in retinal structural anatomy during the preclinical stage of Alzheimer's disease. Alzheimer's Dement. 10, 196–209. doi: 10.1016/j.dadm.2018.01.003
Shi, H., Koronyo, Y., Rentsendorj, A., Regis, G. C., Sheyn, J., Fuchs, D.-T., et al. (2020). Identification of early pericyte loss and vascular amyloidosis in Alzheimer's disease retina. Acta Neuropathol. 139, 813–836. doi: 10.1007/s00401-020-02134-w
Shin, J. Y., Choi, E. Y., Kim, M., Lee, H. K., and Byeon, S. H. (2021). Changes in retinal microvasculature and retinal layer thickness in association with apolipoprotein E genotype in Alzheimer's disease. Sci. Rep. 11:1847. doi: 10.1038/s41598-020-80892-z
Snodderly, D. M., Weinhaus, R. S., and Choi, J. C. (1992). Neural-vascular relationships in central retina of macaque monkeys (Macaca fascicularis). J. Neurosci. 12, 1169–1193. doi: 10.1523/JNEUROSCI.12-04-01169.1992
Spaide, R. F., Fujimoto, J. G., Waheed, N. K., Sadda, S. R., and Staurenghi, G. (2018). Optical coherence tomography angiography. Progr. Retin. Eye Res. 64, 1–55. doi: 10.1016/j.preteyeres.2017.11.003
Stang, A. (2010). Critical evaluation of the Newcastle-Ottawa scale for the assessment of the quality of nonrandomized studies in meta-analyses. Eur. J. Epidemiol. 25, 603–605. doi: 10.1007/s10654-010-9491-z
Strettoi, E., and Masland, R. H. (1995). The organization of the inner nuclear layer of the rabbit retina. J. Neurosci. 15, 875–888. doi: 10.1523/JNEUROSCI.15-01-00875.1995
Stroup, D. F., Berlin, J. A., Morton, S. C., Olkin, I., Williamson, G. D., Rennie, D., et al. (2000). Meta-analysis of observational studies in epidemiology: a proposal for reporting. Meta-analysis Of Observational Studies in Epidemiology (MOOSE) group. J. Am. Med. Assoc. 283, 2008–2012. doi: 10.1001/jama.283.15.2008
Trost, A., Lange, S., Schroedl, F., Bruckner, D., Motloch, K. A., Bogner, B., et al. (2016). Brain and retinal pericytes: origin, function and role. Front. Cell Neurosci. 10:20. doi: 10.3389/fncel.2016.00020
van de Kreeke, J. A., Nguyen, H.-T., Konijnenberg, E., Tomassen, J., den Braber, A., ten Kate, M., et al. (2020). Optical coherence tomography angiography in preclinical Alzheimer's disease. Br. J. Ophthalmol. 104, 157–161. doi: 10.1136/bjophthalmol-2019-314127
Veroniki, A. A., Jackson, D., Viechtbauer, W., Bender, R., Bowden, J., Knapp, G., et al. (2016). Methods to estimate the between-study variance and its uncertainty in meta-analysis. Res. Synth. Methods. 7, 55–79. doi: 10.1002/jrsm.1164
Wang, X., Zhao, Q., Tao, R., Lu, H., Xiao, Z., Zheng, L., et al. (2021). Decreased retinal vascular density in Alzheimer's disease (AD) and mild cognitive impairment (MCI): an optical coherence tomography angiography (OCTA) study. Front. Aging Neurosci. 12:572484. doi: 10.3389/fnagi.2020.572484
Wells, G., Shea, B., O'Connell, D., Peterson, J., Welch, V., Losos, M., et al. (2016). The Newcastle-Ottawa Scale (NOS) for Assessing the Quality of Nonrandomised Studies in Meta-Analyses. Ottawa, ON: Ottawa Hospital Research Institute. Available online at: http://www.ohri.ca/programs/clinical_epidemiology/oxford.asp
Wu, J., Zhang, X., Azhati, G., Li, T., Xu, G., and Liu, F. (2020). Retinal microvascular attenuation in mental cognitive impairment and Alzheimer's disease by optical coherence tomography angiography. Acta Ophthalmol. 98:aos.14381. doi: 10.1111/aos.14381
Yoon, S. P., Grewal, D. S., Thompson, A. C., Polascik, B. W., Dunn, C., Burke, J. R., et al. (2019). Retinal microvascular and neurodegenerative changes in Alzheimer's disease and mild cognitive impairment compared with control participants. Ophthalmol. Retin. 3, 489–499. doi: 10.1016/j.oret.2019.02.002
Yu, D.-Y., Cringle, S. J., and Su, E.-N. (2005). Intraretinal oxygen distribution in the monkey retina and the response to systemic hyperoxia. Invest. Ophthalmol. Vis. Sci. 46, 4728–4733. doi: 10.1167/iovs.05-0694
Zabel, P., Kaluzny, J. J., Wilkosc-Debczynska, M., Gebska-Toloczko, M., Suwala, K., Zabel, K., et al. (2019). Comparison of retinal microvasculature in patients with Alzheimer's disease and primary open-angle glaucoma by optical coherence tomography angiography. Invest. Ophthalmol. Vis. Sci. 60:3447. doi: 10.1167/iovs.19-27028
Zeffren, B. S., Applegate, R. A., Bradley, A., and Heuven, W. A. van (1990). Retinal fixation point location in the foveal avascular zone. Invest. Ophthalmol. Vis. Sci. 31, 2099–2105.
Zhang, Y. S., Zhou, N., Knoll, B. M., Samra, S., Ward, M. R., Weintraub, S., et al. (2019). Parafoveal vessel loss and correlation between peripapillary vessel density and cognitive performance in amnestic mild cognitive impairment and early Alzheimer's Disease on optical coherence tomography angiography. PLoS ONE. 14:e0214685. doi: 10.1371/journal.pone.0214685
Keywords: Alzheimer's disease, mild cognitive impairment, retinal microvasculature, retina, optical coherence tomography angiography (OCTA)
Citation: Yeh T-C, Kuo C-T and Chou Y-B (2022) Retinal Microvascular Changes in Mild Cognitive Impairment and Alzheimer's Disease: A Systematic Review, Meta-Analysis, and Meta-Regression. Front. Aging Neurosci. 14:860759. doi: 10.3389/fnagi.2022.860759
Received: 23 January 2022; Accepted: 14 March 2022;
Published: 28 April 2022.
Edited by:
Boon-Seng Wong, Singapore Institute of Technology, SingaporeReviewed by:
Rodolfo Mastropasqua, University of Modena and Reggio Emilia, ItalyZijing Li, Sun Yat-sen Memorial Hospital, China
Copyright © 2022 Yeh, Kuo and Chou. This is an open-access article distributed under the terms of the Creative Commons Attribution License (CC BY). The use, distribution or reproduction in other forums is permitted, provided the original author(s) and the copyright owner(s) are credited and that the original publication in this journal is cited, in accordance with accepted academic practice. No use, distribution or reproduction is permitted which does not comply with these terms.
*Correspondence: Yu-Bai Chou, c3VkZGVub25zZXRAZ21haWwuY29t