 Weibing Song1†Hongyu Lu2†Wenlong Zhao3
 Xiaofei Cao1Lei Yan4Jingxin Zhao5*
 Neng Li6
 Yuxin Tang3*
 Jun Hu1*
- 1School of Chemical Engineering, Northwest University, Xi’an, China
- 2Key Laboratory of Nanomaterials and Nanotechnology, Qinghai Nationalities University, Xining, China
- 3College of Chemical Engineering, Fuzhou University, Fuzhou, China
- 4Xi’an Institude of Electromechanical Information Technology, Xi’an, China
- 5Joint Key Laboratory of the Ministry of Education, Institute of Applied Physics and Materials Engineering, University of Macau, Avenida da Universidade, Taipa, China
- 6State Key Laboratory of Silicate Materials for Architectures, Wuhan University of Technology, Wuhan, China
Iron-based fluorides are promising alternates for advanced sodium-free battery cathodes due to their large theoretical capacity. However, the rational structural control on the iron-based fluorides toward high-performance batteries is still challenging. To this end, a controllable porous structure on FeF3·0.33H2O sub-microspheres is achieved by a polyethylene glycol (PEG)-assisted hydrothermal method via adjusting the volume of PEG-400. Experimental and molecular dynamic results verify that the formation of small amethyst-like sub-microspheres is mainly ascribed to the steric hindrance reaction of PEG-400, which makes it difficult for F− to combine with Fe3+ to form coordination bonds, and partially hinders the nucleation and growth of FeF3·0.33H2O nanospheres. As a sodium-free battery cathode, the FeF3·0.33H2O sub-microspheres with porous structure and smaller particle size exhibit excellent electrochemical performance with regard to cycle capacity and rate capability (a remaining capacity of 328 mAh g−1 and up to 95.3% retention rate when backs to 0.1 C after 60 cycles).
Introduction
With the development of lithium-ion batteries in various fields, abundant disadvantages such as insufficient resources, high costs, and safety issues have gradually emerged, prompting people to explore sustainable alternative energy sources to meet energy storage needs (Kundu et al., 2015; Kim et al., 2016; Li et al., 2017). The low cost, high natural abundance, and storage mechanism of sodium-ion batteries (NIBs), similar to lithium-ion batteries (LIBs), have made them an ideal choice for energy storage applications (Ong et al., 2011; Dai et al., 2017; Xue et al., 2019). Furthermore, sodium and lithium metals have many similarities in physical and chemical properties (Jian et al., 2013; Liu et al., 2016). Hence, people have rekindled interest in the use of NIBs in energy systems (Liu et al., 2015; Chen et al., 2020).
In the past few years, considerable research efforts have been made to improve the electrochemical property of NIBs. However, the use of NIBs is still limited for practical applications. One of the main obstacles is the lack of high-performance cathode materials to store and transfer the energy (Wang et al., 2013). Recently, iron-based fluorides have attracted much attention as alternative materials for battery cathodes. For example, FeF3·0.33H2O and FeF3 materials with high theoretical capacity have been studied in NIBs (Nishijima et al., 2009; Li et al., 2013; Han et al., 2016; Wu and Yushin, 2017; Luo et al., 2019). Particularly, FeF3·0.33H2O nanomaterials possess the unique tunnel structure, which provides significant contribution to enhance the transport of sodium ions (Li et al., 2013). Unfortunately, the band gap of FeF3·0.33H2O will become larger due to the high electronegativity of fluorine, which leads to poor conductivity and capacity decay (Chu et al., 2013). Furthermore, the volume of cathode materials will be expanded and contracted during the cycle, thus restricting the development of FeF3·0.33H2O cathode materials in the storage field (Rao et al., 2016).
To overcome these issues, significant efforts have been devoted, such as mixing with conductive carbon-based materials (CB, SWNTs, or rGO) to increase electronic conductivity (Li et al., 2011; Shen et al., 2015; Jiang et al., 2016) and doping with some metal ions (Cr3+ or Co3+) to reduce the band gap (Bai et al., 2015; Liu et al., 2018). To a certain extent, the above strategies have improved specific capacity of iron-based fluorides, but they will decrease the energy density of NIBs and induce large volume changes (Li et al., 2017). In general, the shape and size of cathode materials have an important influence on the electrochemical property of NIBs. Appropriate morphology and particle size can effectively shorten the ion/electrode diffusion path and provide enough space to greatly reduce the volume effect (Trogadas et al., 2016; Gao et al., 2019). Therefore, improving the synthesis technology and optimizing the shape of the nanomaterials is another effective and reliable method to enhance their properties (Kim et al., 2010). At present, for the synthesis of iron-based fluorides with various geometric forms, the assistance of surfactants has been considered to be an important factor (Fu et al., 2015; Thorkelsson et al., 2015). However, the role of surfactant during the formation of iron-based fluorides is not clear, which is important for the rational structural control for iron fluoride cathodes toward high-performance battery devices.
In this study, PEG-400 was utilized as the dispersant to control the formation and growth of sub-microspheres, thus forming an ideal particle size and morphology. In addition, the formation mechanism of steric hindrance effect and the influence of reaction time and HF concentration on the shape and size of FeF3·0.33H2O products are explored by experimental and molecular dynamic (MD) simulations. It has been found that the amethyst-like FeF3·0.33H2O sub-microspheres with porous structure and smaller size embrace excellent electrochemical properties in NIBs with regard to cycle capacity (a residual reversible capacity of 195 mAh g−1 at 0.1 C after 100 cycles) and rate capability (a remaining capacity of 328 mAh g−1 and up to 95.3% retention rate when backs to 0.1 C after 60 cycles).
Experimental Details and Simulation
Synthesis of FeF3·0.33H2O
A variety of FeF3·0.33H2O sub-microspheres with controllable shape and size were prepared by a PEG-assisted hydrothermal method. Here, iron (III) nitrate nonahydrate (Tianjin Damao, 98.5%), hydrogen fluoride (Comeo, 40 wt%), anhydrous ethanol (Tianjin Fuyu, AR), and polyethylene glycol (Tianjin Damao, AR) were used as the iron source, fluorine source, solvent, and dispersant, respectively. First, ethanol and PEG-400 were mixed in teflon-lined autoclaves with a volume ratio of 40:0, 30:10, 20:20, and 10:30, respectively (the total solvent volume was maintained at 40 ml) and then stirred vigorously for 30 min. Second, Fe(NO3)3·9H2O (2.02 g) was added to the above four different proportions of solvents, respectively, and stirred for 1 h. Afterward, 1 ml HF was dissolved into the solution with continuous stirring for 1 h. Then, the mixed solution was transferred to teflon-lined stainless steel autoclaves and heated at 150°C for 12 h, yielding the products. Finally, the products were repeatedly washed with ethanol solution, followed by drying at 80°C for 12 h to remove un-reacted HF and water. Subsequently, FeF3·0.33H2O samples were obtained by drying in a tube furnace under argon atmosphere at 300°C for 3 h. Besides, these samples with PEG volumes of 0, 10, 20, and 30 ml are marked as P-0, P-10, P-20, and P-30, respectively. The synthesis of FeF3·0.33H2O sub-microspheres is shown in Scheme 1.
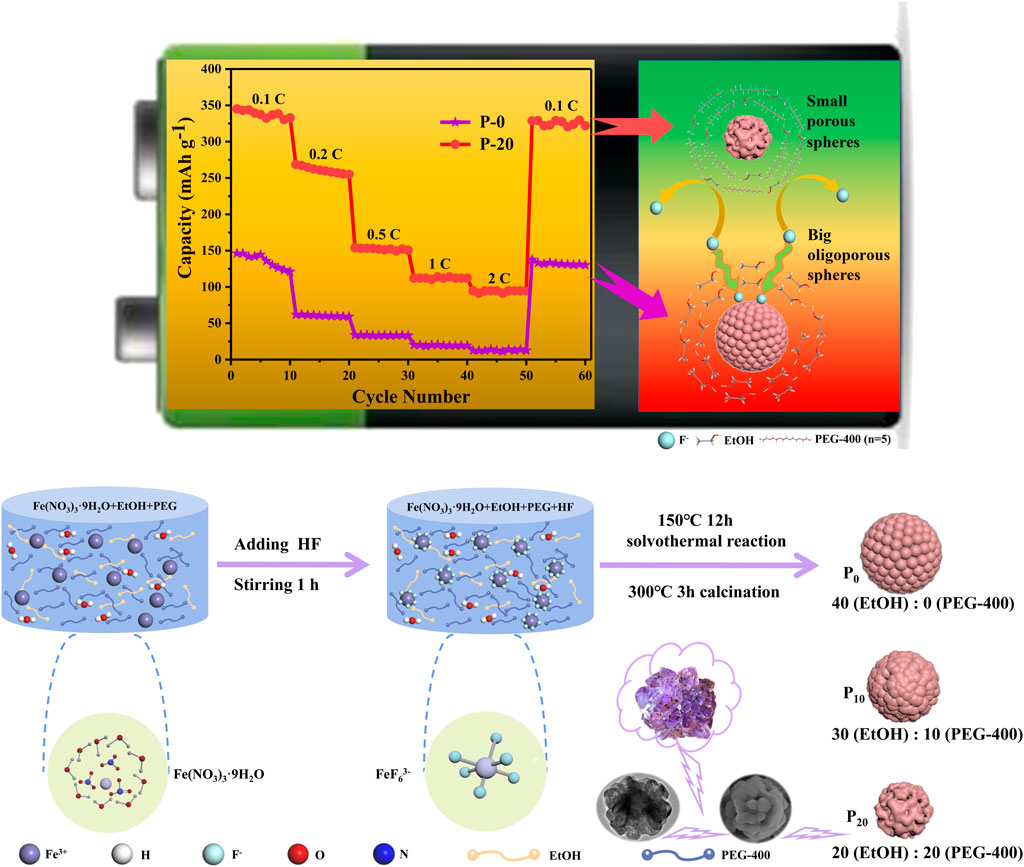
SCHEME 1. Synthetic route and model of FeF3·0.33H2O sub-microspheres. Left: the picture inside is the crystalline structure of Fe (NO3)3·9H2O. Middle: the complex anion FeF63−, which is formed by the reaction of Fe3+ and F−. Right: three kinds of FeF3·0.33H2O sub-microspheres, whose shapes and sizes can be adjusted by the volume ratio of PEG-400.
Influencing Factors on the Growth
To analyze the impacts of HF concentration on the shape and size of the products, the volume of HF was set as 1, 2, 4, 6, 8, and 10 ml when other conditions were not changed. Accordingly, these products were named H-1, H-2, H-4, H-6, H-8, and H-10, respectively. Furthermore, the growth process of FeF3·0.33H2O sub-microspheres is discussed by the above-mentioned methods. These products were named T-1, T-2, T-4, and T-12 under different reaction times (1, 2, 4, and 12 h), respectively.
Molecules Dynamic Simulation
Based on the experiment, two solution boxes were constructed and optimized initially in MD simulation (see Supplementary Information 1.1 for details).
Characterization
Detailed information of the instrument used for structural characterization (X-ray diffraction (XRD, SmartLab SE), thermogravimetric analysis (TG-DTG, NETZSCH STA 449F3), scanning electron microscopy (SEM, Gemini 300), transmission electron microscopy (TEM, FEI Tecnai F20), high-resolution transmission electron microscopy (HRTEM, FEI Tecnai F20), electron diffraction (SAED, FEI Tecnai F20), X-ray photoelectron spectroscopy (XPS, KAlpha 1,063), and Brunauer–Emmett–Teller (BET, Micro Active of ASAP 2460, United States) model, and electrochemical properties of the products are explained in Supplementary Information S1.2.
Results and Discussion
Morphology Characterization
As shown in SEM photographs, the original products (P-0; Figures 1A,B) without PEG-400 exhibit uniform spheres (∼1.2 μm) with a relatively smooth surface. The surface of spheres turns rough and the size is slightly reduced (∼1 μm) (P-10; Figures 1C,D), when the volume of PEG-400 reaches 10 ml. When the volume of PEG-400 reaches 20 ml, the shape of the products turns into amethyst-like sub-microspheres (∼300 nm) with porous structure (P-20, Figures 1E,F). The reason is that when the nanoparticles are mixed in the solution (EtOH-PEG), the probability of collision between the particles is reduced, which makes it difficult for the particles to connect together and presents a better dispersion state. Due to different solvents, the modification and structural orientation of nanoparticles are different, resulting in different shapes and sizes of products. Moreover, the element mapping confirms that Fe, O, and F elements uniformly exist in the entire crystal, thus concluding that these elements co-precipitate in any particle, instead of gradually separating in different particles. However, the particle size of FeF3·0.33H2O sub-microspheres (P-30; Supplementary Figures S1A,B) does not further decrease when the volume of PEG-400 reaches to 30 ml, which is related to chain entanglement and particle agglomeration caused by longer molecular chains of PEG-400 and excessive viscosity in the solvent (Niu and Li, 2014).
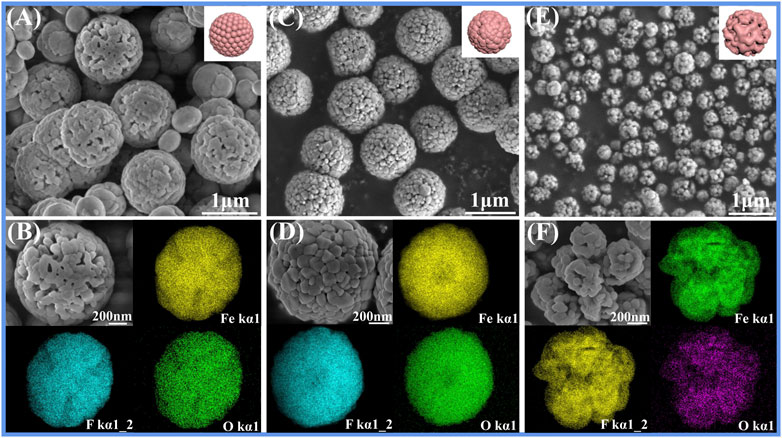
FIGURE 1. SEM photographs of FeF3·0.33H2O: (A,B) P-0, (C,D) P-10, (E,F) P-20, and the corresponding mapping images.
The shape and size changes of FeF3·0.33H2O sub-microspheres are further studied with TEM and HRTEM. As displayed in Figures 2G,H, P-20 is indeed different from P-0 (Figures 2A,B) and P-10 (Figures 2D,E), which is connected with the center of amethyst-like sub-microspheres with porous structure. The shell thickness of the prepared FeF3·0.33H2O sub-microspheres largely depends on the Ostwald ripening time of nanomaterials (discussed later). In the HRTEM images (Figures 2C,F,I), the lattice fringes at distances (0.37 and 0.32 nm) match the (0 0 2) and (2 2 0) planes of the standard FeF3·0.33H2O (PDF # 76-1,262), respectively. In addition, the corresponding SAED (inset of Figures 2C,F,I) also verifies the above viewpoint. The above phenomenon shows that the amethyst-like porous FeF3·0.33H2O sub-microspheres (∼300 nm) can be successfully synthesized by adjusting the volume ratio of PEG-400.
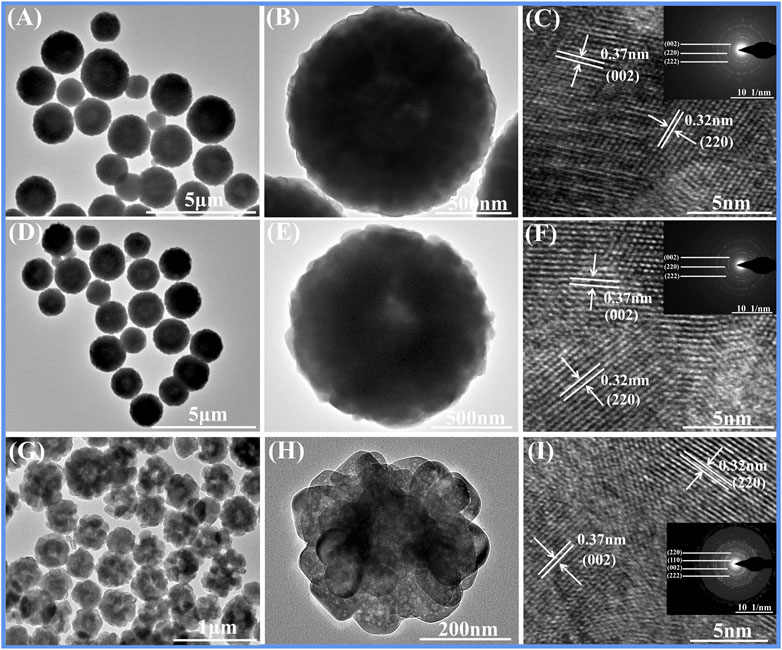
FIGURE 2. TEM, HRTEM, and SAED characterizations of FeF3·0.33H2O: (A–C) P-0, (D–F) P-10, and (G–I) P-20.
Structure Characterization and Analysis
The XRD patterns of FeF3·0.33H2O products are presented in Figure 3A. The diffraction peaks of products perfectly match the standard FeF3·0.33H2O (PDF # 76-1,262) at 2θ = 13.8°, 23.6°, and 27.8°. Furthermore, the diffraction peaks of products gradually weaken along with the increase of the volume of PEG-400, which is caused by the residual organic matters on the surface of the products (Bai et al., 2017). As shown in Figure 3B and Supplementary Figure S2, the weight loss of products is usually ascribed to the removal of surface water of products and the volatilization of PEG-400 (Tang et al., 2018). It can be seen that the ideal temperature for preparing FeF3·0.33H2O sub-microspheres (P-20) is 300°C. As expected, the crystal structure of products changes completely after 400°C and the main component is transformed into FeF3, which can be explained by Eq. 1 and the appearance of FeF2 also means that Eq. 2 is happening. When the temperature reaches at 500°C, the main component of products is still FeF3, and few FeF2 is detected. Hence, all products are heated for 3 h under argon atmosphere without changing the structure of the products.
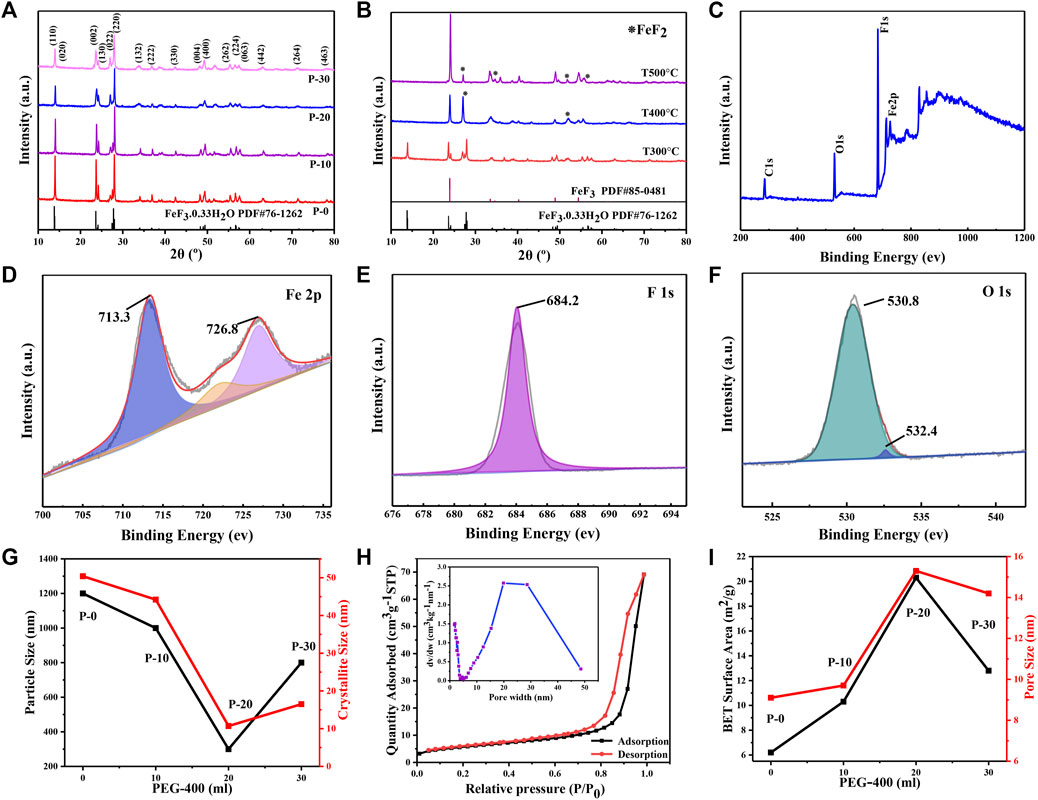
FIGURE 3. (A) XRD patterns of FeF3·0.33H2O. (B) XRD patterns of FeF3·0.33H2O (P-20) at various temperatures. XPS spectra of FeF3·0.33H2O (P-20): (C) the full-spectrum, (D) Fe2p, (E) F1s, and (F) O1s. (G) The variations of particle and crystallite size of FeF3·0.33H2O under different PEG volumes. (H) Nitrogen sorption isotherms of FeF3·0.33H2O (P-20); inset: the corresponding pore diameter distribution curves. (I) The variations of BET surface area and pore size of FeF3·0.33H2O under different PEG volumes.
Considering the analysis of crystallographic parameters, the (0 0 2) crystallographic plane is chosen to calculate the influence of dislocation and lattice strain caused by different PEG content on the shape and size of FeF3·0.33H2O products. According to the Bragg equation (λ = 2dsinθ), the lattice parameters (the value of d, crystal plane distance (h k l)) were calculated. The lattice constants, a, b, and c, were derived from the lattice geometry (Parra and Haque, 2014) as follows:
The average crystallite size of FeF3·0.33H2O particles was obtained by the Scherrer formula:
where D is the average size of the crystal grains, k is the shape factor (for CuKα1 radiation, λ = 1.5406 Å), θ is the scattering angle, and β (0 0 2) is the half-peak width, which is equal to FWHM in radians. Choose (0 0 2) plane to calculate the crystallite size of products (other planes can also use this method). Compared with the d value of the standard FeF3·0.33H2O (PDF # 72-1262), the interplanar spacing d value of prepared samples (P-10, P-20, and P-30) is lower, which indicated that these prepared products have a compressive strain. The broadening of diffraction peaks is caused by crystal distortion and defects, which is called the lattice strain. These parameters can be calculated as follows:
As shown in Table 1, the effect of dislocation and lattice strain for the shape and size of FeF3·0.33H2O products are analyzed by XRD data. It can be seen that as the volume of PEG-400 increases from 0 to 20 ml, the crystallite size of products decreases from 50 to 10 nm with the increase from 3 to 15 in lattice strain (corresponding to P-0, P-10, and P-20), indicating that the proper content of PEG-400 can control the crystallite size by changing the internal strain of products, and then affect the actual particle size. In addition, the strain of P-30 does not continue to increase, which also confirms the view that the actual size of P-30 nanoparticles has not been further reduced.
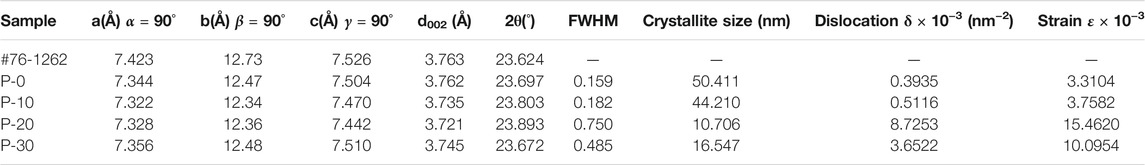
TABLE 1. Crystallographic parameter of FeF3·0.33H2O products with PEG-400 content ranging from 0 to 30 ml were analyzed from the X-ray diffraction patterns.
The composition and valence state of FeF3·0.33H2O sub-microspheres are verified by XPS. The XPS spectrum in Figure 3C exhibits that P-20 contains Fe, F, and O elements. As shown in Figure 3D, the electron binding energies at 713.3 and 726.8 eV correspond to the 2p3/2 and 2p1/2 orbitals of Fe (III), respectively, and a satellite peaks at 722.8 eV (Jiang et al., 2015; Graat and Somers, 1996). In Figure 3E, the binding energy of F1s peaks at about 684.2 eV, which corresponds well to the Fe-F bonding (Li et al., 2013). In addition, as shown in Figure 3F, the O1s peaks drive from the water molecules in the tunnel and the hydroxyl groups in the hydrated water of the product involved in the formation of crystal structure, which are located at 530.8 and 532.4 eV, respectively. Generally speaking, the reduction of the particle size in the system will increase the specific surface area of the nanomaterials, and the dispersion will be better. The variations of crystallite and particle size of all FeF3·0.33H2O sub-microspheres under different PEG volumes are shown in Figure 3G. It can be seen that FeF3·0.33H2O (P-20) exhibits the smallest crystallite size (∼10 nm) and particle size (∼300 nm), which corresponds well to the above point of view. The variations of specific surface area and pore size of all FeF3·0.33H2O sub-microspheres under different PEG volumes (Figure 3I) can be obtained from the BET data in Figure 3H (P-20) and Supplementary Figures S3A–C (P-0, P-10, and P-30). The pore size can be calculated with the desorption isotherm (inset of Figure 3H and Supplementary Figures S3A–C), and the textural properties of all FeF3·0.33H2O sub-microspheres are presented in Supplementary Table S1. It is obvious that P-20 possesses the highest specific surface area (20.3 m2 g−1) and pore size (15.3 nm), which can facilitate intimate contact between the electrolyte solution and cathode materials, and effectively adapt to the volume changes caused by cathode materials during the cycle, thereby improving the cycle stability and rate property of FeF3·0.33H2O sub-microspheres (Wang et al., 2016).
Molecular Analysis Through Simulation
To further analyze the inhibition behavior of steric hindrance reaction of PEG-400 on the molecular scale, the mean square displacement (MSD) analysis in the EtOH solution and EtOH-PEG (n = 5) mixed solution (modeled as Figure 4A) is shown in Figure 4B (inset: the diffusion of 100 μL ink in the EtOH (40 ml) solution and EtOH (20 ml)-PEG (20 ml) mixed solution after 10 s). Combined with the diffusibility of molecules and F− in the EtOH solution and EtOH-PEG mixed solution (Figure 4C), the self-diffusion coefficient of molecules in the EtOH-PEG mixed solution is greatly reduced than that of EtOH solution alone. It is interesting to note that the diffusion coefficient of F− in the EtOH-PEG mixed solution is almost five times lower than that of the EtOH solution, which means that F− is much difficult to diffuse in the mixed solution. In addition, the diffusion of 100 μL ink in the EtOH solution and EtOH-PEG mixed solution after 10 s also verifies the above point of view. The steric hindrance reaction of the long chain of PEG-400 to the reaction becomes larger, and the effective molecular/ion collisions will be reduced, making it difficult for F− to combine with Fe3+ to form coordination bonds, thus affecting the formation of FeF3·0.33H2O sub-microspheres.
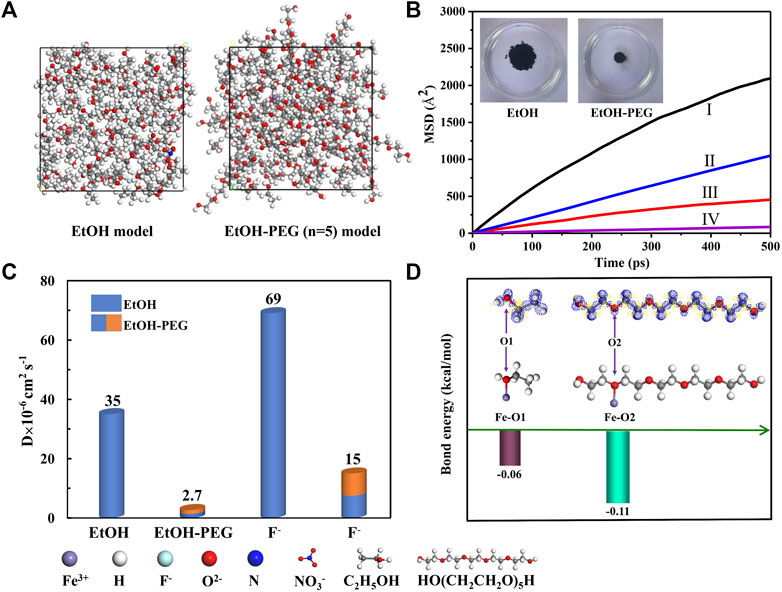
FIGURE 4. (A) The calculated models for EtOH (40 ml) and EtOH (20 ml)-PEG (20 ml) (n = 5). (B) The MSD analysis of molecules and F− in the EtOH solution and EtOH-PEG mixed solution (I and III represent the mean square displacement (MSD) of F− in the EtOH solution and EtOH-PEG mixed solution, II and IV represent the mean square displacement (MSD) of molecules in the EtOH solution and EtOH-PEG mixed solution); inset: the diffusion of 100 μL ink in the EtOH (40 ml) solution and EtOH (20 ml)-PEG (20 ml) mixed solution after 10 s. (C) The corresponding diffusion coefficient of molecules and F− in the EtOH solution and EtOH-PEG mixed solution. (D) The bond energy between Fe and O atoms in different position (inset: the upper part of the picture is the electron density difference map, in which the blue area is the position where the electron density has been enriched relative to the debris, and the yellow area is the position where the density has been exhausted).
Furthermore, Figure 4D shows the bond energy between iron and oxygen atoms in EtOH and PEG. As indicated, the bond energy of Fe−O2 is stable than that of Fe-O1, which makes it easier for iron atoms to combine with oxygen atoms in the EtOH-PEG mixed solution. Meanwhile, this makes it more difficult for fluorine atoms to replace oxygen atoms to combine with Fe3+ to form FeF63− complex, which partly hinders the nucleation and growth of FeF3·0.33H2O nanospheres from the perspective of steric hindrance. The great difference for the bond energy is mainly due to the effect of neighbor atoms, where oxygen atoms are connected in the form of C-O-H in EtOH while in the PEG solution, oxygen atoms are connected in the form of C-O-C in PEG. This will result in different electron density distribution and electronegativity.
Steric Hindrance and Formation Mechanism
The reason for the formation of amethyst-like FeF3·0.33H2O sub-microspheres (P-20) with porous structure is explained in Figure 5A. According to the route (I) of Figure 5A, the high valence state Fe3+ coordinates with the oxygen atoms in the ethanol molecule without PEG-400. With the addition of the strong electronegative F−, they will combine with Fe3+ to form a coordination bond by substituting the oxygen atoms in the steric position, resulting in the complex anion FeF63- (based on Eq. 6), which is the growth primitive. Then, these complexes grow into FeF3·0.33H2O sub-microspheres under the simultaneous combination of water molecules (based on Eq. 7) (Burbano et al., 2015). The FeF3·0.33H2O nanospheres (P-0; Figures 1A,B) grow uniformly in morphology owing to the lack of the potential barrier caused by the electrostatic interaction of surfactants. Compared with the route (I) of Figure 5A, due to the stronger bond energy of iron and oxygen atoms (Fe-O2 of Figure 4D) in the EtOH-PEG mixed solution, the reaction direction mainly proceeds according to the route (Ⅱ) of Figure 5A. PEG-400 exhibits the high viscosity and the low-speed fluidity, which is equivalent to the steric hindrance during the growth process of FeF3·0.33H2O sub-microspheres (Li et al., 2003). The steric hindrance reaction limits the nucleation process and crystal growth of FeF3·0.33H2O by slowing down thermal motions to reduce the number of effective collisions between molecules and ions (Fe3+/F−), resulting in uneven shapes and reduced sizes of sub-microspheres (P-20; Figures 1E,F). Furthermore, the larger bond energy of iron and oxygen atoms (Fe-O2 of Figure 4D) in the mixed solution makes it more difficult for fluorine atoms to replace oxygen atoms to coordinate with Fe3+ and form FeF63- complex, which also hinders the nucleation and growth of FeF3·0.33H2O nanospheres. Thus, adding an appropriate volume of PEG-400 can effectively hinder the overgrowth of FeF3·0.33H2O sub-microspheres, thereby obtaining the ideal shape and size (Figures 1E,F).
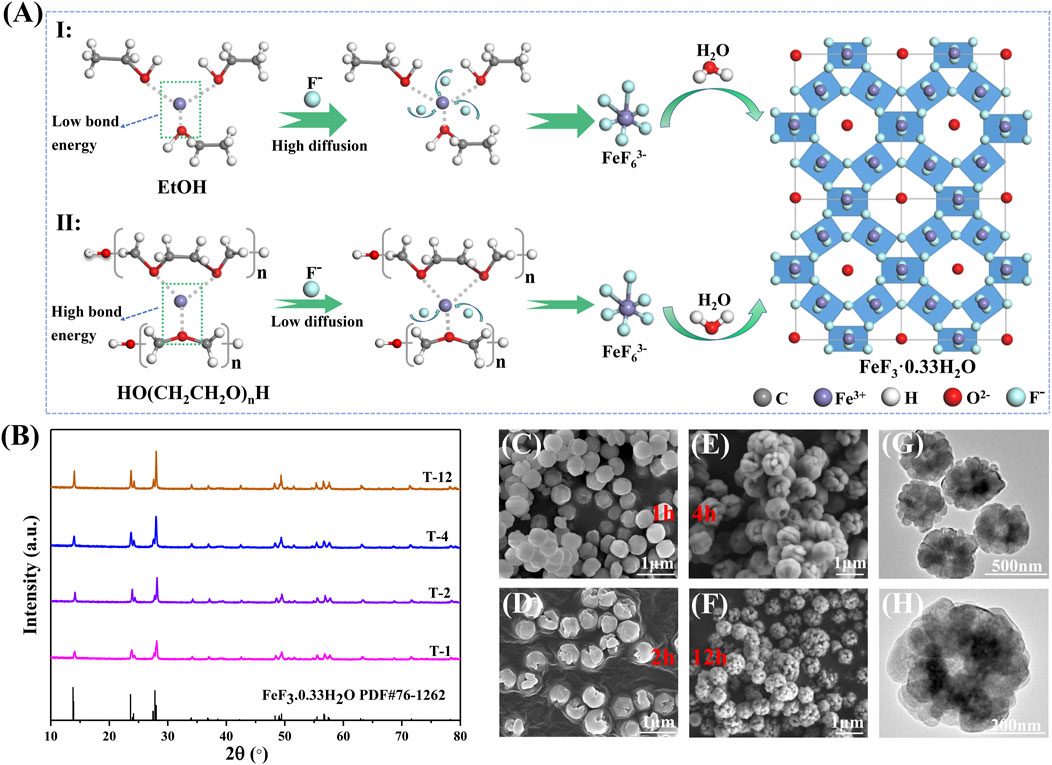
FIGURE 5. (A) The two reaction routes with different proportions of solvents; inset: the unit cell of FeF3 0.33H2O along the [100] direction. (B) XRD patterns of FeF3·0.33H2O (P-20) based on different growth times. SEM photographs of FeF3·0.33H2O (P-20) under different growth times (C) T-1, (D) T-2, (E) T-4, (F) T-12, and TEM photographs (G,H) T-12.
To explore the formation process of the amethyst-like FeF3·0.33H2O sub-microspheres (P-20), the shape and particle size of P-20 products are analyzed under different growth times. Figure 5B shows the XRD patterns of P-20 collected at different growth times at 150°C. As the growth time increases from 1 to 4 h, the diffraction peak of P-20 becomes stronger and the width becomes narrower, indicating that the crystallinity of products becomes stronger. As the growth time increases to 12 h, the characteristic peaks of P-20 hardly change. In addition, the SEM images of P-20 obtained under different growth times are shown in Figures 5C–F. The FeF3·0.33H2O spheres obtained after growth time of 1 h show a relatively smooth surface due to the relatively short growth time (Figure 5C). At the same time, the existence of cracked spheres indicates the continuous aggregation process of the growing FeF3·0.33H2O monomers (Figure 5D). With the growth time further increases from 4 to 12 h, the growth of nanoparticles is slow and the shape of spheres hardly change significantly (Figures 5E,F), thus forming the amethyst-like sub-microspheres with porous structure (T-12, Figures 5G,H), which also corresponds to the SEM and TEM images of FeF3·0.33H2O (P-20, Figures 1E,F and Figure 2 G, H). As demonstrated in the above growth process, the FeF63- complex forms stable FeF3·0.33H2O nucleus in the mixed solvent of ethanol and polyethylene glycol. Then, the growing FeF3·0.33H2O monomers transform into sub-microspheres by the aggregation process, making the outer shell of sub-microspheres continue to grow at the cost of the dissolution of the inner nucleus, which can be attributed to the rapid and thorough Ostwald ripening process at high temperature and crystal growth theory (Liu et al., 2018; Liu et al., 2020). Besides, this article also systematically studied the influence of HF concentration on FeF3·0.33H2O sub-microspheres, which is explained in detail in Supplementary Figure S4.
Sodium Storage Property of the Prepared Electrodes
The rate capability (Figure 6A) and the voltage curves for FeF3·0.33H2O cathodes from 0.1 to 2.0 C (1 C = 237 mAh g−1) between 1.0 and 4.0 V are shown in Figure 6B (P-20) and Supplementary Figures S5A–C (P-0, P-10, and P-30). As the current density increases, P-20 electrode exhibits the smallest capacity loss among all electrodes and shows the excellent rate capacities of 345 and 95 mAh g−1 at 0.1 and 2.0 C, respectively. In addition, P-0, P-10, P-20, and P-30 electrodes exhibit the capacities of 130, 162, 328, and 190 mAh g−1 after 60 cycles, with the retention rates of about 88.9, 92.3, 95.3, and 73.1%, respectively. Such excellent rate property of P-20 electrode is largely due to the unique porous structure and smaller size, which can shorten the transmission distance between ions and promote the rapid insertion/extraction process of Na+.
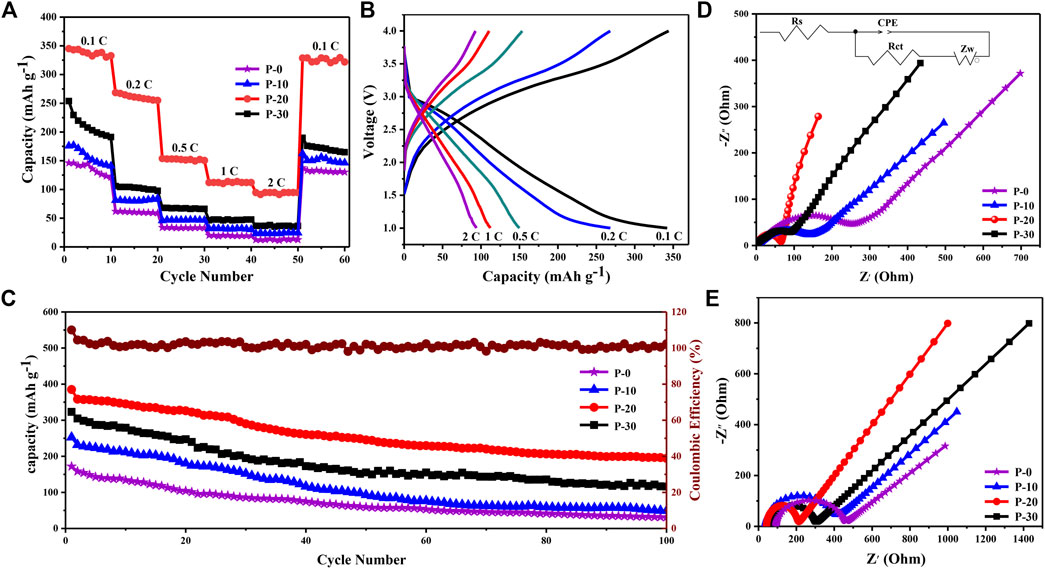
FIGURE 6. (A) Rate properties of all electrodes between 0.1 and 2 C. (B) The initial charge/discharge profiles of P-20 electrode between 0.1 and 2 C. (C) Cycling properties of all electrodes and the Coulombic efficiency of P-20 electrode at 0.1 C between 1.0 and 4.0 V. (D) Nyquist plots of all electrodes before cycling, inset: the equivalent circuit model. (E) Nyquist plots of all electrodes after 100 cycles.
As shown in Figure 6C, the cycle property of all FeF3·0.33H2O electrodes is tested at 0.1 C between 1.0 and 4.0 V. Since the solid electrolyte phase (SEI) is irreversibly formed in the first cycle of NIBs, all electrodes exhibit a large capacity decay during this period (Li et al., 2012). In the subsequent cycles, P-20 electrode can keep a steady battery capacity, which remains at 195 mAh g−1 after 100 cycles. Notably, according to previous reports on the iron fluoride cathode materials, the cycle property of FeF3·0.33H2O (P-20) sub-microspheres with porous structure is significantly better than other shapes and sizes of FeF3·0.33H2O materials (Supplementary Table S2). The corresponding voltage profiles of all FeF3·0.33H2O electrodes (P-0, P-10, P-20, and P-30) are presented in Supplementary Figures S6A–D. As the number of cycles increases, the voltage gradually decreases steadily, which indicates that all electrodes have undergone severe electrochemical polarization. The higher discharge voltage and lower charging voltage of P-20 indicate that its polarization is the smallest. Therefore, P-20 electrode exhibits the best cycle stability compared with the other three kinds of FeF3·0.33H2O electrodes. Besides, this article also systematically compared the battery performance with anhydrous ferric fluoride, which is explained in detail in Supplementary Figures S8, 9.
As shown in Supplementary Figures S7A–D, the CV analysis of all FeF3·0.33H2O electrodes is performed at 0.2 mV s−1 in the third cycle. Obviously, the shapes of all electrode curves are basically similar, and P-20 exhibits the largest capacity. During the cathodic process, there is a wide reduction peak between 1.8 and 2.6 V, which is the result of the insertion of Na+ into FeF3·0.33H2O crystal structure. During the anodic process, there are two continuous oxidation peaks, which are attributed to the extraction process of Na+.
The EIS tests and the equivalent circuit (inset of Figure 6D) of all FeF3·0.33H2O electrodes (P-0, P-10, P-20, and P-30) at 0.1 C before cycling and after 100 cycles are shown in Figures 6D,E, respectively. The values of Rct of all FeF3·0.33H2O electrodes are summarized in Supplementary Table S3. The Rct values for P-0, P-10, P-20, and P-30 before cycling are 253.1, 140.6, 65.7, and 87.1 Ω and increase to 462.8, 416.0, 213.9, and 305.8 Ω after 100 cycles, respectively. The result shows that the Rct value of P-20 electrode exhibits the smallest increase, indicating that its electrochemical polarization is the smallest. It may be related to the porous structure and smaller size of P-20 sub-microspheres, which can promote the rapid overall permeation of electrolytes, resulting in ideal cycle and rate property (Wang et al., 2017; Xiong et al., 2018).
Conclusion
The amethyst-like FeF3·0.33H2O sub-microspheres with porous structure are prepared via the steric hindrance interaction. PEG-400 can be used to precise control the shape and size of FeF3·0.33H2O sub-microspheres. The main reason is that the steric hindrance reaction of PEG-400 makes it difficult for F− to form coordination bonds with Fe3+, which hinders the nucleation and growth of FeF3·0.33H2O nanospheres to some extent. The electrochemical result shows that P-20 electrode possess the outstanding cycle and rate property (a remaining capacity of 328 mAh g−1 and up to 95.3% retention rate when the current density backs to 0.1 C after 60 cycles). The admirable electrochemical performances of P-20 sub-microspheres are mainly attributed to the unique porous structure and smaller particle size, which is beneficial to increase the surface area of cathode materials and reduce the diffusion distance of Na ions. Therefore, this study may lay the foundation for the formation and synthesis of NIB-free cathode materials.
Data Availability Statement
The original contributions presented in the study are included in the article/Supplementary Material, further inquiries can be directed to the corresponding authors.
Author Contributions
WS conducted experiments and wrote the article. HL and WZ tested the electrochemical properties. JZ, YT, and JH designed the experiments. XC, LY, and NL provided simulation test tools.
Funding
Financial support from the National Natural Science Foundation of China (No. 21676216), National Natural Science Foundation of Shaanxi (2019JM-294), Special project of Shaanxi Provincial Education Department (20JC034) are gratefully acknowledged. This research project was supported by Central for High Performance Computing of Northwestern Polytechnical University, China.
Conflict of Interest
The authors declare that the research was conducted in the absence of any commercial or financial relationships that could be construed as a potential conflict of interest.
Publisher’s Note
All claims expressed in this article are solely those of the authors and do not necessarily represent those of their affiliated organizations, or those of the publisher, the editors and the reviewers. Any product that may be evaluated in this article, or claim that may be made by its manufacturer, is not guaranteed or endorsed by the publisher.
Supplementary Material
The Supplementary Material for this article can be found online at: https://www.frontiersin.org/articles/10.3389/fnano.2021.710348/full#supplementary-material
References
Bai, Y., Zhou, X., Jia, Z., Wu, C., Yang, L., Chen, M., et al. (2015). Understanding the Combined Effects of Microcrystal Growth and Band gap Reduction for Fe(1−)Ti F3 Nanocomposites as Cathode Materials for Lithium-Ion Batteries. Nano Energy 17, 140–151. doi:10.1016/j.nanoen.2015.08.006
Bai, Y., Zhou, X., Zhan, C., Ma, L., Yuan, Y., Wu, C., et al. (2017). 3D Hierarchical Nano-Flake/micro-Flower Iron Fluoride with Hydration Water Induced Tunnels for Secondary Lithium Battery Cathodes. Nano Energy 32, 10–18. doi:10.1016/j.nanoen.2016.12.017
Burbano, M., Duttine, M., Borkiewicz, O., Wattiaux, A., Demourgues, A., Salanne, M., et al. (2015). Anionic Ordering and Thermal Properties of FeF3·3H2O. Inorg. Chem. 54, 9619–9625. doi:10.1021/acs.inorgchem.5b01705
Chen, Q., Liu, B., Zhang, L., Xie, Q., Zhang, Y., Lin, J., et al. (2021). Sodiophilic Zn/SnO2 Porous Scaffold to Stabilize Sodium Deposition for Sodium Metal Batteries. Chem. Eng. J. 404, 126469. doi:10.1016/j.cej.2020.126469
Chu, Q., Xing, Z., Tian, J., Ren, X., Asiri, A. M., Al-Youbi, A. O., et al. (2013). Facile Preparation of Porous FeF3 Nanospheres as Cathode Materials for Rechargeable Lithium-Ion Batteries. J. Power Sourc. 236, 188–191. doi:10.1016/j.jpowsour.2013.02.026
Dai, Z., Mani, U., Tan, H. T., and Yan, Q. (2017). Advanced Cathode Materials for Sodium-Ion Batteries: What Determines Our Choices? Small Methods 1, 1700098. doi:10.1002/smtd.201700098
Fu, G., Zhang, Q., Wu, J., Sun, D., Xu, L., Tang, Y., et al. (2015). Arginine-mediated Synthesis of Cube-like Platinum Nanoassemblies as Efficient Electrocatalysts. Nano Res. 8, 3963–3971. doi:10.1007/s12274-015-0899-3
Gao, B., Li, X., Ding, K., Huang, C., Li, Q., Chu, P. K., et al. (2019). Recent Progress in Nanostructured Transition Metal Nitrides for Advanced Electrochemical Energy Storage. J. Mater. Chem. A. 7, 14–37. doi:10.1039/C8TA05760E
Graat, P. C. J., and Somers, M. A. J. (1996). Simultaneous Determination of Composition and Thickness of Thin Iron-Oxide Films from XPS Fe 2p Spectra. Appl. Surf. Sci. 100-101, 36–40. doi:10.1016/0169-4332(96)00252-8
Han, Y., Hu, J., Yin, C., Zhang, Y., Xie, J., Yin, D., et al. (2016). Iron-based Fluorides of Tetragonal Tungsten Bronze Structure as Potential Cathodes for Na-Ion Batteries. J. Mater. Chem. A. 4, 7382–7389. doi:10.1039/C6TA02061E
Jian, Z., Han, W., Lu, X., Yang, H., Hu, Y.-S., Zhou, J., et al. (2013). Superior Electrochemical Performance and Storage Mechanism of Na3V2(PO4)3 Cathode for Room-Temperature Sodium-Ion Batteries. Adv. Energ. Mater. 3, 156–160. doi:10.1002/aenm.201200558
Jiang, M., Wang, X., Hu, H., Wei, S., Fu, Y., and Shen, Y. (2016). In Situ growth and Performance of Spherical Fe2F5·H2O Nanoparticles in Multi-Walled Carbon Nanotube Network Matrix as Cathode Material for Sodium Ion Batteries. J. Power Sourc. 316, 170–175. doi:10.1016/j.jpowsour.2016.03.007
Jiang, M., Wang, X., Shen, Y., Hu, H., Fu, Y., and Yang, X. (2015). New Iron-Based Fluoride Cathode Material Synthesized by Non-aqueous Ionic Liquid for Rechargeable Sodium Ion Batteries. Electrochimica Acta 186, 7–15. doi:10.1016/j.electacta.2015.10.159
Kim, H., Kim, H., Ding, Z., Lee, M. H., Lim, K., Yoon, G., et al. (2016). Recent Progress in Electrode Materials for Sodium-Ion Batteries. Adv. Energ. Mater. 6, 1600943. doi:10.1002/aenm.201600943
Kim, S.-W., Seo, D.-H., Gwon, H., Kim, J., and Kang, K. (2010). Fabrication of FeF3 Nanoflowers on CNT Branches and Their Application to High Power Lithium Rechargeable Batteries. Adv. Mater. 22, 5260–5264. doi:10.1002/adma.201002879
Kundu, D., Talaie, E., Duffort, V., and Nazar, L. F. (2015). The Emerging Chemistry of Sodium Ion Batteries for Electrochemical Energy Storage. Angew. Chem. Int. Ed. 54, 3431–3448. doi:10.1002/anie.201410376
Li, B., Rooney, D. W., Zhang, N., and Sun, K. (2013a). An In Situ Ionic-Liquid-Assisted Synthetic Approach to Iron Fluoride/Graphene Hybrid Nanostructures as Superior Cathode Materials for Lithium Ion Batteries. ACS Appl. Mater. Inter. 5, 5057–5063. doi:10.1021/am400873e
Li, C., Gu, L., Tong, J., and Maier, J. (2011). Carbon Nanotube Wiring of Electrodes for High-Rate Lithium Batteries Using an Imidazolium-Based Ionic Liquid Precursor as Dispersant and Binder: a Case Study on Iron Fluoride Nanoparticles. ACS Nano 5, 2930–2938. doi:10.1021/nn1035608
Li, C., Yin, C., Gu, L., Dinnebier, R. E., Mu, X., Van Aken, P. A., et al. (2013). An FeF3·0.5H2O Polytype: A Microporous Framework Compound with Intersecting Tunnels for Li and Na Batteries. J. Am. Chem. Soc. 135, 11425–11428. doi:10.1002/chin.20134600910.1021/ja402061q
Li, C., Yin, C., Mu, X., and Maier, J. (2013). Top-down Synthesis of Open Framework Fluoride for Lithium and Sodium Batteries. Chem. Mater. 25, 962–969. doi:10.1021/cm304127c
Li, J., Yan, D., Lu, T., Yao, Y., and Pan, L. (2017). An Advanced CoSe Embedded within Porous Carbon Polyhedra Hybrid for High Performance Lithium-Ion and Sodium-Ion Batteries. Chem. Eng. J. 325, 14–24. doi:10.1016/j.cej.2017.05.046
Li, L., Meng, F., and Jin, S. (2012). High-capacity Lithium-Ion Battery Conversion Cathodes Based on Iron Fluoride Nanowires and Insights into the Conversion Mechanism. Nano Lett. 12, 6030–6037. doi:10.1021/nl303630p
Li, Y., Zhou, X., Bai, Y., Chen, G., Wang, Z., Li, H., et al. (2017). Building an Electronic Bridge via Ag Decoration to Enhance Kinetics of Iron Fluoride Cathode in Lithium-Ion Batteries. ACS Appl. Mater. Inter. 9, 19852–19860. doi:10.1021/acsami.7b03980
Li, Z., Xiong, Y., and Xie, Y. (2003). Selected-control Synthesis of ZnO Nanowires and Nanorods via a PEG-Assisted Route. Inorg. Chem. 42, 8105–8109. doi:10.1021/ic034029q
Liu, M., Liu, L., Hu, H., Yang, L., Yang, Z., Wang, Y., et al. (2018). Flowerlike Mesoporous FeF3·0.33H2O with 3D Hierarchical Nanostructure: Size-Controlled Green-Synthesis and Application as Cathodes for Na-Ion Batteries. ACS Appl. Energ. Mater. 1, 7153–7163. doi:10.1021/acsaem.8b01585
Liu, M., Liu, L., Li, M., Chen, B., Lei, H., Hu, H., et al. (2020). Preparation and Li/Na Ion Storage Performance of Raspberry-like Hierarchical FeF3·0.33H2O Micro-sized Spheres with Controllable Morphology. J. Alloys Comp. 829, 154215. doi:10.1016/j.jallcom.2020.154215
Liu, M., Wang, X., Wei, S., Hu, H., Zhang, R., and Liu, L. (2018). Cr-doped Fe2F5·H2O with Open Framework Structure as a High Performance Cathode Material of Sodium-Ion Batteries. Electrochimica Acta 269, 479–489. doi:10.1016/j.electacta.2018.02.159
Liu, Y., Zhang, N., Jiao, L., Tao, Z., and Chen, J. (2015). Ultrasmall Sn Nanoparticles Embedded in Carbon as High-Performance Anode for Sodium-Ion Batteries. Adv. Funct. Mater. 25, 214–220. doi:10.1002/adfm.201402943
Liu, Y., Zhang, N., Yu, C., Jiao, L., and Chen, J. (2016). MnFe2O4@C Nanofibers as High-Performance Anode for Sodium-Ion Batteries. Nano Lett. 16, 3321–3328. doi:10.1021/acs.nanolett.6b00942
Luo, M., Yu, H., Hu, F., Liu, T., Cheng, X., Zheng, R., et al. (2020). Metal Selenides for High Performance Sodium Ion Batteries. Chem. Eng. J. 380, 122557. doi:10.1016/j.cej.2019.122557
Nishijima, M., Gocheva, I. D., Okada, S., Doi, T., Yamaki, J.-i., and Nishida, T. (2009). Cathode Properties of Metal Trifluorides in Li and Na Secondary Batteries. J. Power Sourc. 190, 558–562. doi:10.1016/j.jpowsour.2009.01.051
Niu, Z., and Li, Y. (2014). Removal and Utilization of Capping Agents in Nanocatalysis. Chem. Mater. 26, 72–83. doi:10.1021/cm4022479
Ong, S. P., Chevrier, V. L., Hautier, G., Jain, A., Moore, C., Kim, S., et al. (2011). Voltage, Stability and Diffusion Barrier Differences between Sodium-Ion and Lithium-Ion Intercalation Materials. Energy Environ. Sci. 4, 3680–3688. doi:10.1039/c1ee01782a
Ramzan Parra, M., and Haque, F. Z. (2014). Structural and Optical Properties of Poly-Vinylpyrrolidone Modified ZnO Nanorods Synthesized through Simple Hydrothermal Process. Optik 125, 4629–4632. doi:10.1016/j.ijleo.2014.05.030
Rao, R. S., Pralong, V., and Varadaraju, U. V. (2016). Facile Synthesis and Reversible Lithium Insertion Studies on Hydrated Iron Trifluoride FeF 3 ·0.33H 2 O. Solid State. Sci. 55, 77–82. doi:10.1016/j.solidstatesciences.2016.02.008
Shen, Y., Wang, X., Hu, H., Jiang, M., Yang, X., and Shu, H. (2015). A Graphene Loading Heterogeneous Hydrated Forms Iron Based Fluoride Nanocomposite as Novel and High-Capacity Cathode Material for Lithium/sodium Ion Batteries. J. Power Sourc. 283, 204–210. doi:10.1016/j.jpowsour.2015.02.097
Tang, Y., An, J., Xing, H., Wang, X., Zhai, B., Zhang, F., et al. (2018). Synthesis of Iron-Fluoride Materials with Controlled Nanostructures and Composition through a Template-free Solvothermal Route for Lithium Ion Batteries. New J. Chem. 42, 9091–9097. doi:10.1039/C8NJ00932E
Thorkelsson, K., Bai, P., and Xu, T. (2015). Self-assembly and Applications of Anisotropic Nanomaterials: a Review. Nano Today 10, 48–66. doi:10.1016/j.nantod.2014.12.005
Trogadas, P., Ramani, V., Strasser, P., Fuller, T. F., and Coppens, M.-O. (2016). Hierarchically Structured Nanomaterials for Electrochemical Energy Conversion. Angew. Chem. Int. Ed. 55, 122–148. doi:10.1002/anie.201506394
Wang, G., Wang, X., Yi, L., Yu, R., Liu, M., and Yang, X. (2016). Preparation and Performance of 0.5Li2MnO3·0.5LiNi1/3Co1/3Mn1/3O2 with a Fusiform Porous Micro-nano Structure. J. Mater. Chem. A. 4, 15929–15939. doi:10.1039/C6TA06435C
Wang, G., Yi, L., Yu, R., Wang, X., Wang, Y., Liu, Z., et al. (2017). Li1.2Ni0.13Co0.13Mn0.54O2 with Controllable Morphology and Size for High Performance Lithium-Ion Batteries. ACS Appl. Mater. Inter. 9, 25358–25368. doi:10.1021/acsami.7b07095
Wang, L., Lu, Y., Liu, J., Xu, M., Cheng, J., Zhang, D., et al. (2013). A Superior Low-Cost Cathode for a Na-Ion Battery. Angew. Chem. Int. Ed. 52, 1964–1967. doi:10.1002/anie.201206854
Wu, F., and Yushin, G. (2017). Conversion Cathodes for Rechargeable Lithium and Lithium-Ion Batteries. Energ. Environ. Sci. 10, 435–459. doi:10.1039/C6EE02326F
Xiong, D., Li, X., Bai, Z., and Lu, S. (2018). Recent Advances in Layered Ti3C2TxMXene for Electrochemical Energy Storage. Small 14, 1703419. doi:10.1002/smll.201703419
Keywords: iron-based fluoride, porous sub-microspheres, steric hindrance, formation mechanism, sodium ion batteries
Citation: Song W, Lu H, Zhao W, Cao X, Yan L, Zhao J, Li N, Tang Y and Hu J (2021) Control of Shape and Size in Iron Fluoride Porous Sub-Microspheres: Consequences for Steric Hindrance Interaction. Front. Nanotechnol. 3:710348. doi: 10.3389/fnano.2021.710348
Received: 16 May 2021; Accepted: 27 July 2021;
Published: 07 September 2021.
Edited by:
Jingjing Wan, East China Normal University, ChinaReviewed by:
Xiang Yang Kong, Shanghai Jiao Tong University, ChinaYong Chen, University of South China, China
Copyright © 2021 Song, Lu, Zhao, Cao, Yan, Zhao, Li, Tang and Hu. This is an open-access article distributed under the terms of the Creative Commons Attribution License (CC BY). The use, distribution or reproduction in other forums is permitted, provided the original author(s) and the copyright owner(s) are credited and that the original publication in this journal is cited, in accordance with accepted academic practice. No use, distribution or reproduction is permitted which does not comply with these terms.
*Correspondence: Jingxin Zhao, SmluZ3hpblpoYW9AdW0uZWR1Lm1v; Yuxin Tang, eXh0YW5nQGZ6dS5lZHUuY24=; Jun Hu, aHVqdW4zMjQ1NkAxNjMuY29t
†These authors have contributed equally to this work and share first authorship