 Andreina Urquiola Hernández
 Patrice Delarue1
 Adrien Nicolaï
 Patrick Senet
- 1Laboratoire Interdisciplinaire Carnot de Bourgogne, UMR 6303 CNRS, Université de Bourgogne, Dijon, France
- 2Institut FEMTO-ST, UMR 6174 CNRS, Université de Franche-Comté, Besançon, France
Proteins are essential biological molecules to use as biomarkers for early disease diagnosis. Therefore, their detection is crucial. In recent years, protein sequencing has become one of the most promising techniques. In particular, solid-state nanopores (SSNs) are powerful platforms for single biological molecule sensing without any labeling and with high sensitivity. Atomically thin two-dimensional (2D) materials with nanometer-sized pores, such as single-layer MoS2, represent the ideal SSN because of their ultimate thinness. Despite the benefits they offer, their use for protein sequencing applications remains very challenging since the fast translocation speed provides a short observation time per single molecule. In this work, we performed extensive molecular dynamics simulations of the translocation of the 20 proteinogenic amino acids through single-layer MoS2 nanopores. From ionic current traces, we characterized peptide-induced blockade levels of current and duration for each of the 20 natural amino acids. Using clustering techniques, we demonstrate that positively and negatively charged amino acids present singular fingerprints and can be visually distinguished from neutral amino acids. Furthermore, we demonstrate that this information would be sufficient to identify proteins using the coarse-grained sequencing technique made of only three amino acid categories depending on their charge. Therefore, single-layer MoS2 nanopores have great potential as sensors for the identification of biomarkers.
1 Introduction
Single-molecule protein sequencing has been very recently identified as one of the seven technologies “to watch” in the coming year (Eisenstein, 2023). It is due to the fact that the proteome, which represents the complete set of proteins made by a cell or organism, contains information about health and disease. However, it remains extremely challenging to characterize. Compared to DNA, single-molecule protein sequencing is crucial for early disease diagnosis due to the fact that DNA sequencing of living cells does not fully define human diseases (Cressiot et al., 2020). For instance, protein sequencing technologies could be used to identify tumor biomarkers, which can help to determine the presence, absence, or evolution of cancer (Borrebaeck, 2017). Still, the protein ensemble is by far more complex than the DNA ensemble. First, to sequence a protein, it necessitates the recognition of 20 naturally occurring (proteinogenic) amino acids, compared with the four nucleotides forming the building blocks of DNA molecules, which results in a much larger chemical diversity (charge, hydrophobicity, polarity, etc.). Moreover, the proteome includes proteins with post-translational modifications (Stierlen et al., 2023), e.g., phosphorylation, which may alter the location, the function, and even the folded state of a protein (Bah et al., 2015). Finally, in contrast to the negatively uniformly charged double strands of nucleotides, which are the common shared structure of DNA molecules, proteins occur in many different folded structures with various heterogeneous charge states. Nowadays, single-molecule sensors inspired by the techniques used for DNA that could sequence proteins in an electrolyte sample could be a major breakthrough on the horizon. Among existing technologies, nanopore sequencing has immense potential due to the fact that this technology presents a high sensitivity since single molecules can be detected. Nonetheless, there are still considerable challenges to overcome (Bandara et al., 2022; Nicolaï and Senet, 2022; Yang and Dekker, 2022).
Solid-state nanopores (SSNs), fabricated from stimuli-responsive materials, have been widely studied in the past decade for the detection and characterization of single proteins (Lee et al., 2018; Luo et al., 2020; Xue et al., 2020). The physical principle behind SSN sensing experiments is the measurement of the ionic current variations when charged molecules, initially immersed in an electrolyte, translocate through a nanometer-sized channel in response to an external voltage applied across the membrane (Figure 1A). Therefore, as the passage of the single molecule through the nanopore is driven by an electric field, an appropriate control of the total charge of the molecule of interest is required (Nicolaï and Senet, 2022). During that time, the ionic current is monitored to detect the passage of single molecules through the pore at a sub-microsecond temporal resolution. By analyzing the features of the ionic current trace, one can extract crucial structural information about the biological molecule, including its primary structure, i.e., its sequence. In comparison with biological nanopores, such as α-hemolysin (Song et al., 1996) or aerolysin (Strack, 2020), SSNs are mechanically robust and durable in time, with tunable pore sizes, geometries, and chemistry (Pérez-Mitta et al., 2019), and compatible with various electronic or optical measurement techniques. However, they particularly suffer from critical limitations, such as the high translocation speed (Fragasso et al., 2020), the low spatial resolution, and the stochastic motion of biological molecules, which remain as challenges for accuracy and sensitivity (Meyer et al., 2021) or the non-specific interaction between proteins and the walls of the SSN, which can clog the pore and block the translocation of other molecules (Eggenberger et al., 2019).
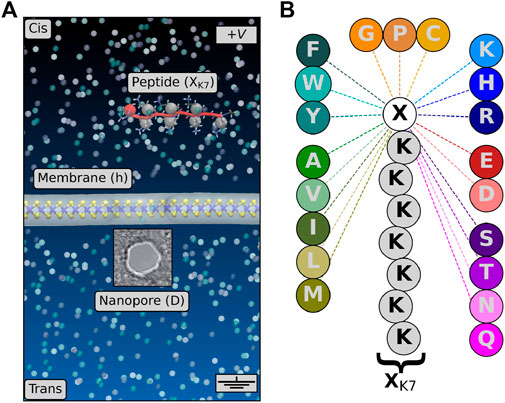
FIGURE 1. (A) Structure of the MoS2 nanopore sensor simulated in the present work. The membrane is shown in ball and stick (Mo, blue and S, yellow) plus surface (gray) representations. The peptide is shown in red (cartoon), with the positions of the center of mass of each amino acid represented by spheres. The electrolyte is represented by transparent spheres, the water molecules being not represented for more clarity. (B) Model peptide sequences XK7 studied in the present work. The 20 proteinogenic amino acids are grouped by family: positively (blue) and negatively charged (red), polar neutral (violet), hydrophobic aromatic (cyan) and non-aromatic (green), and special cases (orange).
Two-dimensional (2D) SSNs, such as graphene (Garaj et al., 2010; Merchant et al., 2010; Schneider et al., 2010), hexagonal boron nitride (Liu et al., 2013; Zhou et al., 2013), transition-metal dichalcogenides MoS2 and WS2 (Liu et al., 2014; Feng et al., 2015; Danda et al., 2017), or MXenes (Mojtabavi et al., 2019) nanopores, have been extensively studied experimentally for DNA sequencing (Arjmandi-Tash et al., 2016; Qiu et al., 2021). Nevertheless, protein sequencing using 2D SSNs is much less advanced, particularly compared with silicon nitride SSNs (Kennedy et al., 2016; Dong et al., 2017; Kolmogorov et al., 2017). To the best of our knowledge, only few theoretical and one experimental studies about MoS2 SSNs for protein sequencing applications have been reported (Barati Farimani et al., 2018; Chen et al., 2018; Nicolaï et al., 2020; Wang et al., 2023). Among those, a very recently published experimental work demonstrates the identification of amino acids with sub-1-Dalton resolution using MoS2 nanopores (Wang et al., 2023). The authors present the use of 41 different sub-nanometer-engineered pores, with effective diameters ranging from sub-nm to 1.6 nm to directly identify 16 out of 20 types of natural amino acids. Among the 20 natural amino acids, 18 were negatively charged by controlling the pH of the electrolyte. However, using such heterogeneous sub-nm pores and electrolyte properties might be an obstacle for protein sequencing applications, particularly for the threading of polypeptides through the nanopores. In this case, the use of larger pores (
In the present work, we performed extensive unbiased all-atom MD simulations for a total duration of 250 μs for the translocation of 20 proteinogenic amino acids through a single-layer MoS2 nanopore of an effective diameter of D = 1.3 nm (Figure 1A). Individual amino acids were chemically linked to a short polycationic charge carrier, lysine heptapeptide (Figure 1B), allowing transport of the peptide through the nanopore. This probe was designed to guide the target peptide toward MoS2 nanopores (Nicolaï et al., 2019). It allows us to control peptide translocation through solid-state nanopores and relate protein characteristics with nanopore readouts. Furthermore, this probe has also been used experimentally (arginine heptapeptide) using biological nanopores to distinguish among uniformly charged homopeptides and to assign signature ionic currents to the charged homopeptides. A transient current blockade is then induced by the passage of the peptide, whereby the characterizations of relative residual current and blockade duration are used to reveal the identity of the linked amino acid (Ouldali et al., 2020). Moreover, as performed in real-life experiments, the peptide is initially placed above the membrane in the cis compartment to simulate its complete translocation through the nanopore to the trans compartment using a transverse electric field (no other bias). From the ionic current time series extracted from MD, we show that each amino acid presents a large diversity of ionic current blockade levels and duration. Nevertheless, by applying unsupervised machine learning (clustering) to the segmentation of translocation events, specific fingerprints dependent on the charge of the amino acids were identified. Hereafter, we demonstrate that both positively and negatively charged amino acids present well-distinguishable distributions of blockade levels of ionic current and duration compared to all the other amino acids. Finally, ideal fingerprints associated with each of the 20 proteinogenic amino acids are presented, some of them being characteristic of more than one amino acid. These promising findings may offer a route toward protein sequencing using MoS2 solid-state nanopores via the identification of coarse-grained sequences of proteins, from the detection of the position of charged amino acids in the primary structure, the average coarse-grained sequence identity being around 10% only.
2 Materials and methods
2.1 Atomistic modeling of MoS2 SSNs
SSN sensors simulated in the present work are composed of three distinct elements: a single-layer MoS2 membrane and a biological peptide, both immersed in a KCl electrolyte solution (Figure 1A). The atomic structure of the full system comprised around 100,000 atoms in total. Initially, MoS2 membranes were constructed using 2H-MoS2 orthorhombic unit cell lattice vectors
Biological peptides were built using the AmberTools software. From the sequence of amino acids defining the peptide, the module leap creates the all-atom structure from a database. The initial structure of the peptide created that way does not exhibit a particular 3D shape and is linear (Figure 1A). During MD simulations, the structure of the peptide is fully relaxed and can adopt any conformation. However, during the translocation process, the peptide is elongated in the nanopore due to its small diameter. In this work, we study the translocation of 20 distinct peptide sequences made of a lysine heptapeptide plus one of the twenty natural amino acids (Figure 1B). This methodology, based on the number of charge carriers added, and its impact on the ionic current traces measured during MD simulations has been discussed in a previous work (Nicolaï et al., 2019). Other techniques have been tested theoretically, such as applying a hydrostatic pressure gradient (Chen et al., 2018) or modifying the chemical potential of the membrane (Luan and Zhou, 2018). The total charge of the peptide is +7 for neutral amino acids (A, G, I, L, P, V, F, W, Y, S, T, C, M, N, and Q), +8 for positively charged amino acids (R, K, and H), and +6 for negatively charged amino acids (E and D). Peptides are initially placed at a distance of 2.5 nm above the membrane to avoid a common biased threading when the peptide is originally placed inside the pore, and it allows us to simulate the complete translocation process (five steps) as shown in Supplementary Figure S2, i.e., i) diffusion in bulk electrolyte, ii) diffusion on the top surface, iii) passage through the pore, iv) diffusion on the bottom surface, and v) diffusion in bulk electrolyte. Finally, water molecules, potassium K+ and chloride Cl− ions (1 M) were added to the simulation box using GROMACS (Abraham et al., 2018).
2.2 Molecular dynamics simulations
All-atom classical MD simulations in explicit solvent were carried out using the GROMACS software package (Abraham et al., 2018) (version 2018.2 in double precision). Peptide translocation was enforced by imposing a uniform electric field directed normally to the nanoporous membrane (z-direction) to all atomic partial charges in the system. The corresponding applied voltage simulated is Vbias = −ELz, where Lz = 15 nm is the length of the simulation box in the z-direction. No other biases were applied in the present simulations, as done in other works (Barati Farimani et al., 2018), and we performed the simulation of the full translocation process of the peptide through the membrane, i.e., from the bulk solvent compartment above the membrane to the bulk solvent compartment below the membrane (Figure 1A). The MoS2 nanoporous membrane was modeled using the harmonic potential for Mo–S bonds plus S–Mo–S and Mo–S–Mo angles (Sresht et al., 2017). As mentioned earlier, atomic partial charges qi for Mo and S were computed from charge equilibration in vacuum using ReaxFF. Finally, LJ parameters (ϵi and σi) for Mo and S atoms were adapted from the work of Gu et al. (2017). Peptides were modeled using the AMBER99sb*-ILDN-q force field (Best et al., 2012). The water model used in the present work is TIP3P (Jorgensen et al., 1983). Potassium chloride K+ and Cl− ion non-bonded parameters (qi, ϵi, and σi) were taken from the work of Joung and Cheatham (2008), where specific parameters were developed for the TIP3P water model. Neighbor searching was performed with a pair list generated using the Verlet method (particle-based cut-offs) as implemented in GROMACS (Abraham et al., 2018). The neighbor list was updated every five steps (10 fs), with a cut-off distance for the short-range neighbor list of 1.0 nm. Moreover, electrostatic interactions were computed using a Coulomb potential and van der Waals interactions using the Lennard–Jones (LJ) potential plus arithmetic mixing rules. Technically, the particle–particle particle–mesh (PPPM) method (Isele-Holder et al., 2012) was used to describe long-range electrostatic interactions with a Fourier spacing of 0.16 nm and a PME order of 4. A cut-off of 1.0 nm was applied to both Coulomb and LJ potential for non-bonded interactions. Finally, a long-range analytical dispersion correction was applied to the energy and pressure. Similar MD parameters have been used in other works (Heiranian et al., 2015; Barati Farimani et al., 2018; Chen et al., 2018; Thiruraman et al., 2018; Nicolaï et al., 2019; Nicolaï et al., 2020; Barrios Pérez et al., 2019; Shankla and Aksimentiev, 2020; Zhao et al., 2021).
For each NEMD run, the simulation box built from the modeling procedure was first minimized using the steepest-descent algorithm with a force criterion of 1,000 kJ/mol/nm. Then, the minimized structure was equilibrated in the NVT ensemble for 100 ps (δt = 1 fs) using the V-rescale thermostat (Bussi et al., 2007) at T = 300 K (τT = 0.1 ps), and position restraints were applied to the membrane and the peptide. The NVT equilibrated structure was then equilibrated in the NPT ensemble for 500 ps (δt = 1 fs) using a Parrinello–Rahman barostat (Parrinello and Rahman, 1981; Nosé and Klein, 1983) at P = 1 bar (τP = 1.0 ps), and position restraints were applied to the peptide. Finally, the NPT equilibrated structure was simulated at Vbias = 1 V for 500 ns (production run) with a time step δt = 2 fs with constraints applied on chemical bonds involving H atoms using the LINCS algorithm (Hess et al., 1997). During production runs, xyz-coordinates of all the atoms of the simulation box were saved every 10 ps.
In total, 12.5 μs of MD simulations were performed for each of the 20 proteinogenic amino acids, i.e., 250 μs simulation time in total. It represents more than 10 million hours of CPU time, performed on AMD EPYC 7302@3 GHz (2 processors, 16 cores/processor) with a scaling of 150 ns per day on 256 cores.
2.3 Data analysis
2.3.1 Effective free-energy profiles and surfaces
From MD, we probed the position of the amino acid of interest X in peptides XK7 by computing the cylindrical coordinates (ρ, z) of the center of mass of the amino acid side chain at each time step, as performed in a previous work (Nicolaï et al., 2020). Effective free-energy profiles Vz and surfaces Vρ,z were computed by using the following formula:
where k is the Boltzmann constant, T is the temperature, Pz and Pρ,z are the 1D and 2D probability density functions (PDFs) of the normal z and both radial ρ and normal z-coordinates, respectively, and
2.3.2 Ionic current
Ionic current time series were computed from MD production runs using z-coordinates of K+ and Cl− ions as a function of time:
where Δt is the time between MD snapshots chosen for the calculations (1 ns), Lz is the dimension of the simulation box in the z-direction, which is the direction of the applied electric field, Nions is the total number of ions in the electrolyte, qi is the charge of the ion i (+1 or −1), and zi(t) is the z-coordinate of the ion i at time t. In addition, ionic current time series were filtered in order to remove high-frequency fluctuations by computing the moving mean of the ionic current over T = 1,000 samples.
2.3.3 Detection of peptide-induced blockade events
The detection of peptide-induced blockade events from ionic current time series was performed using a two-threshold method, as applied elsewhere (Ouldali et al., 2020). First, a threshold th1 is applied to identify possible blockade events. The threshold th1 was defined as th1 =< I0 > − 4σ0, where
2.3.4 Structural break detection and clustering analysis
Structural break detection was performed using the Chow test, an algorithm used when a potential structural break in the time series may be recognized a priori. The principle is to evaluate the parameter stability, namely, to determine if the underlying regression model parameters have remained unchanged. In this case, peptide-induced blockade event ionic current data were split by one point in time, getting two different datasets. The null hypothesis of the Chow test asserts that true coefficients in two linear regressions on these two datasets are equal. Structural changes take place in points where the null hypothesis is rejected (Aronov et al., 2019; Sun and Wang, 2022).
Clustering was performed using the Gaussian mixture model (Reynolds, 2009) (GMM) for which Gaussian free parameters (πk, μk, and Σk) representing the weight, the means, and the covariances, respectively, were estimated from the expectation–maximization (EM) algorithm (Dempster et al., 1977). To do so, we used scikit-learn, which is an open-source machine learning Python library. In addition, to estimate the number of sub-populations for each amino acid, we used the Bayesian Information Criterion (BIC) score to estimate the proper number of components K to GMM (Schwarz, 1978) (Supplementary Figure S13). In addition, full and tied covariances were set as a parameter of the model for 1D and 2D clustering, respectively. Finally, the convergence threshold used was 0.001, which means that when the lower bound average gain falls under this limit, EM iterations will end. From GMM clustering outputs, i.e., cluster means
3 Results and discussion
3.1 Translocation of the 20 proteinogenic amino acids through MoS2 nanopores
In translocation simulations, a nanoporous membrane made of single-layer MoS2 with a pore of diameter D = 1.3 nm separates the two compartments, cis and trans, which contain a 1M KCl electrolyte solution (Figure 1A). In the cis compartment, a biological peptide XK7, with X being one of the 20 proteinogenic amino acids (Figure 1B), is initially placed above the membrane at a vertical distance of around 2.5 nm. The translocation simulation starts by applying an external voltage of 1 V across the membrane. After diffusing in bulk electrolyte for a few ns, the peptide starts diffusing on the top surface of the membrane and then translocates through the nanopore (Supplementary Figure S2). Once the translocation happens, the peptide diffuses on the bottom surface of the membrane in the trans compartment and detaches at some point to go back to the bulk electrolyte. This latter step is not observed in all translocation simulations, and sometimes, only a partial translocation is achieved (Supplementary Figure S2).
From MD, we computed the sensing time TS of each amino acid X belonging to the peptide XK7. As shown in Figure 2A, negatively charged amino acids E and D present a TS one order of magnitude higher than that of the neutral amino acids and two orders of magnitude larger than that of the positively charged amino acids. It means that the charge property of the amino acids mainly dictates the sensing characteristics of the amino acids in MoS2 nanopores using MD. Within a family, sensing time TS are very similar, except for: i) K in the positively charged family, which presents a TS 3–4 times larger than H and R; ii) S and Q in the polar neutral family, which present a TS 3–4 times larger than T and N; and iii) C in the special cases family, which presents a TS 2–3 times larger than G and P. In addition, from the position of the center of mass of each amino acid side chain, we computed the effective free-energy profiles Vz along the normal coordinate z in order to estimate the barrier for the passage of each amino acid through the nanoporous membrane. Figure 2B shows the effective free-energy profiles Vz (FEPs) for R (positively charged), E (negatively charged), S (polar neutral), W (hydrophobic aromatic), V (hydrophobic non-aromatic), and G (special cases). The other FEPs are available in Supplementary Figure S3. From MD and independently of the amino acid characteristics, the FEPs along the normal coordinates present an asymmetry due to the presence of the electric field and share two similar features: i) a local minimum in the cis compartment (z ∼ 0.5 nm) corresponding to the diffusion of the peptide on the top surface of the membrane and ii) a global minimum in the trans compartment (z ∼ − 0.5 nm) corresponding to the diffusion of the peptide on the bottom surface of the membrane after translocation. However, the behavior of negatively charged amino acids (E and D) shows some differences compared to the others. In the cis compartment, there are two local minima centered around z ∼ 0.0 and z ∼ 1.0 nm. This happens because negatively charged amino acids interact with the electric field in the opposite direction of translocation, and even after the full translocation of the peptide, these amino acids can go back individually to the pore during the diffusion process. It means that the free-energy barriers for all amino acids except the negatively charged ones correspond to the full translocation, whereas for negatively charged amino acids, it corresponds mainly to the exit of the pore, for which the barrier of the entrance is much smaller (Figure 2B; Supplementary Figure S3A). For comparison, the profiles for cations K+ and anions Cl− are symmetrical and flat in the bulk region. The free-energy increases when approaching the MoS2 surface and being maximum (saddle point) at z ∼ 0 nm.
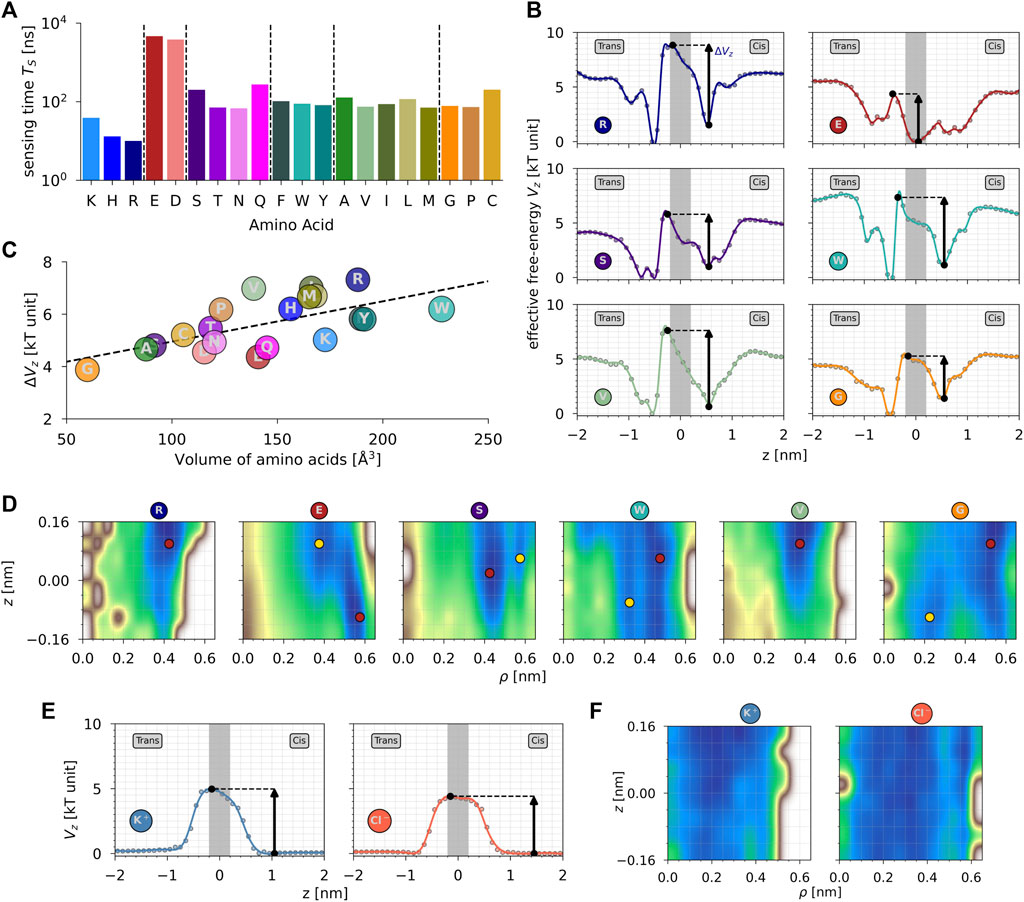
FIGURE 2. (A) Sensing time TS (in ns) as a function of amino acids. The color code is the same as in Figure 1. (B) Effective free-energy profiles Vz (in kT unit, T = 300 K) along the normal coordinate z of the amino acid side chain center of mass. Gray rectangles represent the position of the MoS2 nanoporous membrane. (C) Effective free-energy barriers ΔVz (in kT unit) as a function of the amino acid volume (in
From the 1D FEPs Vz, we estimated the effective free-energy barrier for the translocation of each amino acid X. As shown in Figure 2C, the free-energy barriers ΔVz are correlated with the volume of the amino acids (Pearson correlation
Finally, we computed the effective free-energy surfaces Vρ,z (FESs) of each amino acid during their passage inside the MoS2 nanopore. First, the FESs explored by the 20 proteinogenic amino acids are very heterogeneous (Figure 2D; Supplementary Figure S3C). However, some observations must be highlighted. For instance, all three positively charged amino acids, K, H, and R, translocate through the pore far away from the vertical edges located at ρ ∼ R. It is also the case even if it is less pronounced for hydrophobic non-aromatic amino acids, such as V, I, L, and M. The opposite behavior is observed for negatively charged amino acids E and D, which reside inside the nanopore closer to the vertical edges due to the presence of Mo atoms in the pore throat, with their global minimum being inside the pore, as explained earlier from FEPs Vz. It is also the case for serine (S), which is characterized by the presence of an oxygen atom at the extremity of its side chain, as it is the case for E and D. For comparison, free-energy surfaces of K+ and Cl− ions present the same behavior, i.e., cations translocate in a narrower channel than anions due to the presence of positively charged Mo atoms at the mouth of the pore. However, compared to the amino acids, the translocation landscape of ions is more flat and spread over the entire pore channel. Second, as shown in Figure 2D, some amino acids present a wide, extended basin in their FESs, such as H, N, W, and G, whereas some of them present a narrower translocation channel, such as R, Q, A, and P. It is not surprising for G since it is characterized by the smallest side chain, i.e., an H atom. Nevertheless, it is surprising for W amino acid, which is the largest amino acid in terms of volume. It comes from the different orientations of the aromatic rings observed during MD. Therefore, hydrophobic aromatic amino acids W and Y present multiple minima in the radial direction ρ during their passage inside the nanopore. In the wider translocation channel (H, N, W, and G), FESs are quite flat, with only small barriers between the existing multiple local minima. In the narrower channel, the barriers are much larger, with uphill profiles inside the pore to enter it (K and Q) or exit it (M, C, V, and T).
3.2 Detection of peptide-induced blockade events
Figure 3A shows ionic current variations monitored during MD and representing the translocation of the 20 different proteinogenic amino acids through MoS2 nanopores. The data are grouped according to the family to which amino acid X belongs, i.e., positively charged (blue), negatively charged (red), polar/neutral (violet), hydrophobic aromatic (cyan), hydrophobic non-aromatic (green), and a special case (orange). In the absence of peptide inside the nanopore, a steady ionic current of mean value I0 = 3.55 ± 0.25 nA flows through the pore. The threading of the peptide into the nanopore induces transient blockades of the ionic current, each ionic current blockade corresponding to the presence of an individual peptide in the nanopore (Nicolaï et al., 2020). From ionic current time series, peptide-induced blockade events were extracted using a two-threshold method (Supplementary Figure S4) in order to proceed in a very similar way as performed in experiments (Ouldali et al., 2020). Each peptide-induced blockade event is characterized by a blockade ionic current trace Ib(t) of duration τb (Figure 3B). The total sensing duration per amino acid, which corresponds to tens of translocations, varies from 10% (T) to 25% (V) of the total simulation time per amino acid (12.5 µs), with an average of around 17%. As shown in Figure 3B and as observed experimentally, there is a very large variability of blockade ionic current traces that can be visually observed for all amino acids (Supplementary Figures S5–S8). On the one hand, for a given amino acid, some events with similar duration τb are characterized by deep ionic current blockades, and some traces are characterized by slight ionic current blockades, as shown in Figure 3B for N and I amino acids. On the other hand, some events maintain fairly constant blockade current traces, and others show switching levels and bumps, as shown in Figure 3B for R and F amino acids, depending on the radial position of the peptide in the pore (Nicolaï and Senet, 2022). Finally, some blockade traces are characterized by very short duration (a few ns), whereas others are relatively long (a few hundred of ns), as shown in Figure 3B for D and C amino acids. To better characterize this variability of traces detected from translocation simulations, we computed probability densities of blockade ionic current P(Ib) and compared them between the 20 proteinogenic amino acids.
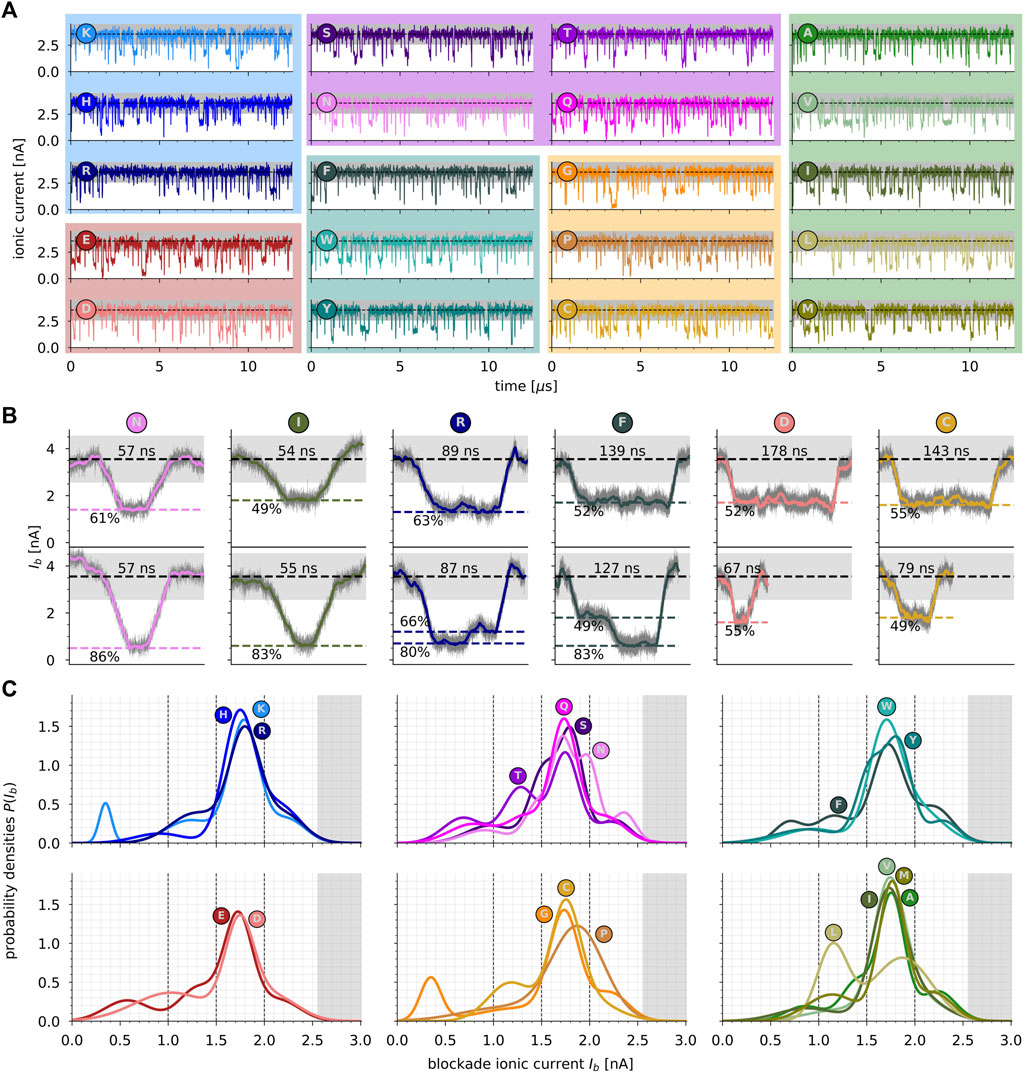
FIGURE 3. (A) Ionic current (in nA) as a function of time (in μs) recorded during MD simulations of the translocation of the 20 amino acids through MoS2 nanopore. Dashed lines represent the average open-pore value
3.3 Probability densities of blockade ionic current traces
Figure 3C shows the probability densities P(Ib) for each amino acid grouped per family. Overall, the superimposed densities do not exhibit well-separated populations between the amino acids within a family, as measured experimentally for biological nanopores (Ouldali et al., 2020). Nevertheless, some notable exceptions are observed and discussed in the following text. In the present work, P(Ib) densities present multiple peaks for each amino acid, i.e., sub-populations, which means that different fingerprints of blockade current exist during translocation simulations through MoS2 nanopores. Per amino acid, the number of sub-populations in the data was assessed by using the Gaussian mixture model (GMM) clustering technique associated with the Bayesian Information Criterion (BIC, see Materials and methods). In total, we identified two (P), three (H, R, D, W, V, I, L, M, C), four (K, E, S, T, Q, F, Y, A, G), or five (N) sub-populations per amino acid (Supplementary Table S1), corresponding to four ranges of blockade current Ib: first, the range (0, 1.0) nA, corresponding to depths ΔIb larger than around 70% of the open pore signal; second, the range (1.0, 1.5) nA, corresponding to depths ΔIb between around 60% and 70%; third, the range (1.5, 2.0) nA, corresponding to depths ΔIb between 40% and 60%; and fourth, the range (2.0, 2.5) nA, corresponding to depths ΔIb smaller than 40%. The two-threshold method imposed here does not permit the detection of depths ΔIb lower than 30% of the open-pore current.
For all 20 proteinogenic amino acids, the major sub-population of P(Ib) is between 1.7 nA (depth ΔIb of 50%) for W amino acid and 1.9 nA (depth ΔIb of 45%) for P amino acid, which is close to be easily distinguishable (Figure 3C). The associated weights of each sub-population (see Supplementary Table S1) range from 34% (N) to 80% (P). Per family, for positively charged amino acids, 3 (H and R) and 4 (K) fingerprints of blockade current are detected, with major sub-populations centered around 1.7–1.8 nA. The main differences between the three positively charged amino acids are observed for K, which presents a minor sub-population at 0.4 nA (depth ΔIb of 90%) compared to H and R, and for H, which presents a minor sub-population around 0.9 nA (depth ΔIb of 70%). For negatively charged amino acids, 4 (E) and 3 (D) fingerprints of blockade current are detected, with major sub-populations centered around 1.7 nA, these values being slightly smaller than the ones for positively charged amino acids. The main differences between E and D are observed for larger blockade ranges (depth ΔIb > 60%), with minor sub-populations centered around 1.3 and 0.6 nA for E and around 1.0 nA for D.
For polar/neutral amino acids, 4 (S, T, Q) and 5 (N) fingerprints of blockade current are detected, with major sub-populations centered between 1.7 and 1.8 nA. These values are comparable with charged amino acids, S and T closer to (K, H, and R) and (N and Q) closer to (E and D), as shown in Figure 3C. However, for minor sub-populations, polar/neutral amino acids present much more dissimilarities between them than charged amino acids. For instance, T amino acid shows a singular minor sub-population centered around 1.3 nA. In addition, singularities are also observed for N and S amino acids, which show a minor sub-population at 2.0 and 1.5 nA, respectively.
For hydrophobic/aromatic amino acids, 3 (W) and 4 (F and Y) fingerprints of blockade current are detected, with major sub-populations centered around 1.7 nA (F and W) and 1.8 nA (Y). For Y amino acid, a minor sub-population close to the major one at 1.5 nA is detected, which is not the case for F and W amino acids. Moreover, compared to W and Y, F amino acid presents a minor sub-population centered at 0.7 nA, which corresponds to a depth ΔIb of 80% (75% at maximum for W and Y). For hydrophobic/non-aromatic amino acids, 3 (V, I, L, and M) and 4 (A) fingerprints of blockade current are detected, with the major sub-population centered around 1.7 nA with values being extremely close. Among all the amino acid families, the hydrophobic/non-aromatic is the one showing the least differences between amino acids except for L, which shows a singular behavior with two major sub-populations of similar weight at 1.8 and 1.1 nA. To a lesser extent, M amino acid shows the same sub-population at 1.1 nA but with a smaller weight, 20% vs. 40% for L (Supplementary Table S1).
Finally, for the special case amino acids, 2 (P), 3 (C), and 4 (G) fingerprints of blockade current are detected, with the major sub-populations being centered around 1.7 nA for C and G, and 1.9 nA for P, which is the largest value detected. Visually, the special case family is the one that reveals the largest dissimilarities with a major sub-population for P amino acid that is very wide compared with not only G and C but also all the other amino acids. Moreover, C amino acid presents a second well-separated sub-population at 1.2 nA (depth ΔIb of 65%) compared to G and P. Last but not the least, surprisingly, G amino acid, which is the smallest amino acid with an H atom as a side chain, presents a sub-population at 0.4 nA (depth ΔIb of 90%) as observed for K amino acid. This confirms that the volume of the amino acids (Perkins, 1986) is not the only physical mechanism underlying the dependence of blockade ionic current on the amino acid type through MoS2 solid-state nanopores (Supplementary Figure S9). In fact, only tryptophan (W) amino acid, which is the largest amino acid in volume (228 Å3), presents the largest major sub-population of blockade ionic current among all the 20 proteinogenic amino acids. On the contrary, glycine (G), which is the smallest amino acid in volume (60 Å3), presents a minor sub-population in the same range as W (same weight), with a value centered at 0.35 nA for G compared to 0.94 nA for W.
Compared to the experimental work mentioned in the introduction (Wang et al., 2023), we identified more sub-populations per amino acid. For SSNs with diameters comparable to the size of the amino acids being detected (0.6 nm), the experimental distributions of the current trace are bimodal, whereas in the present work, it can vary from 2–5 sub-populations. It is due to the fact that we consider a single device here, compared to 41 experimental devices, with a pore diameter of 1.3 nm compared to sub-nm (0.6–0.8 nm) to 1.6 nm in experiments and the time scale of microseconds in MD compared to seconds in experimental measurements. However, the overlap between the probability distributions P(Ib) of the different amino acids is similar between our theoretical work and the experimental one, but the separation of the maximum peaks is more important in the latter than the ones presented in Figure 3C and in Supplementary Table S1. Finally, the correlation between the means of blockade current and the volume of the amino acid is well established experimentally for SSNs with diameters comparable to the size of the amino acids being detected, whereas in our simulations with larger pore diameters, other mechanisms, such as the orientation of the side chains, are important, as already demonstrated in a previous work (Nicolaï et al., 2020). This mechanism is also observed experimentally for positively charged amino acids (Wang et al., 2023).
To conclude, among the 20 proteinogenic amino acids studied here, peptides containing K, T, N, G, P, or L amino acids produced distinct minor blockade sub-populations of ionic current compared to the other amino acids, whereas the major blockade sub-populations of ionic current are very similar to be differentiated. Therefore, additional information from blockade traces of ionic current is required to improve their recognition using MoS2 SSNs. A first guess is to include, in the clustering analysis, a better description of the depth and duration of the blockade traces of ionic current detected from translocation simulations.
3.4 Clustering of blockade levels from ionic current traces
To quantify the depth ΔIb and duration τb of each level of ionic current observed during peptide-induced blockade events and extracted from the time series shown in Figure 3A, we applied a structural break detection algorithm (see Materials and methods). It allows us to convert raw signals of blockade current traces into simplified step-wise signals, as shown in Figure 4A. It leads to: i) a better characterization of blockade events compared to the traditional methodology, i.e., using the mean values of ionic current during the associated blockade event, considering the events to be constant as a function of time, and ii) an increase of the statistics of blockade event data. For instance, it reduces by a factor of 3 the mean-squared errors between the raw and the step-wise model signals compared to the constant model signal (Supplementary Figure S10). In addition, it increases by a factor of 6 the statistics of blockade event data, which is crucial for machine learning applications.
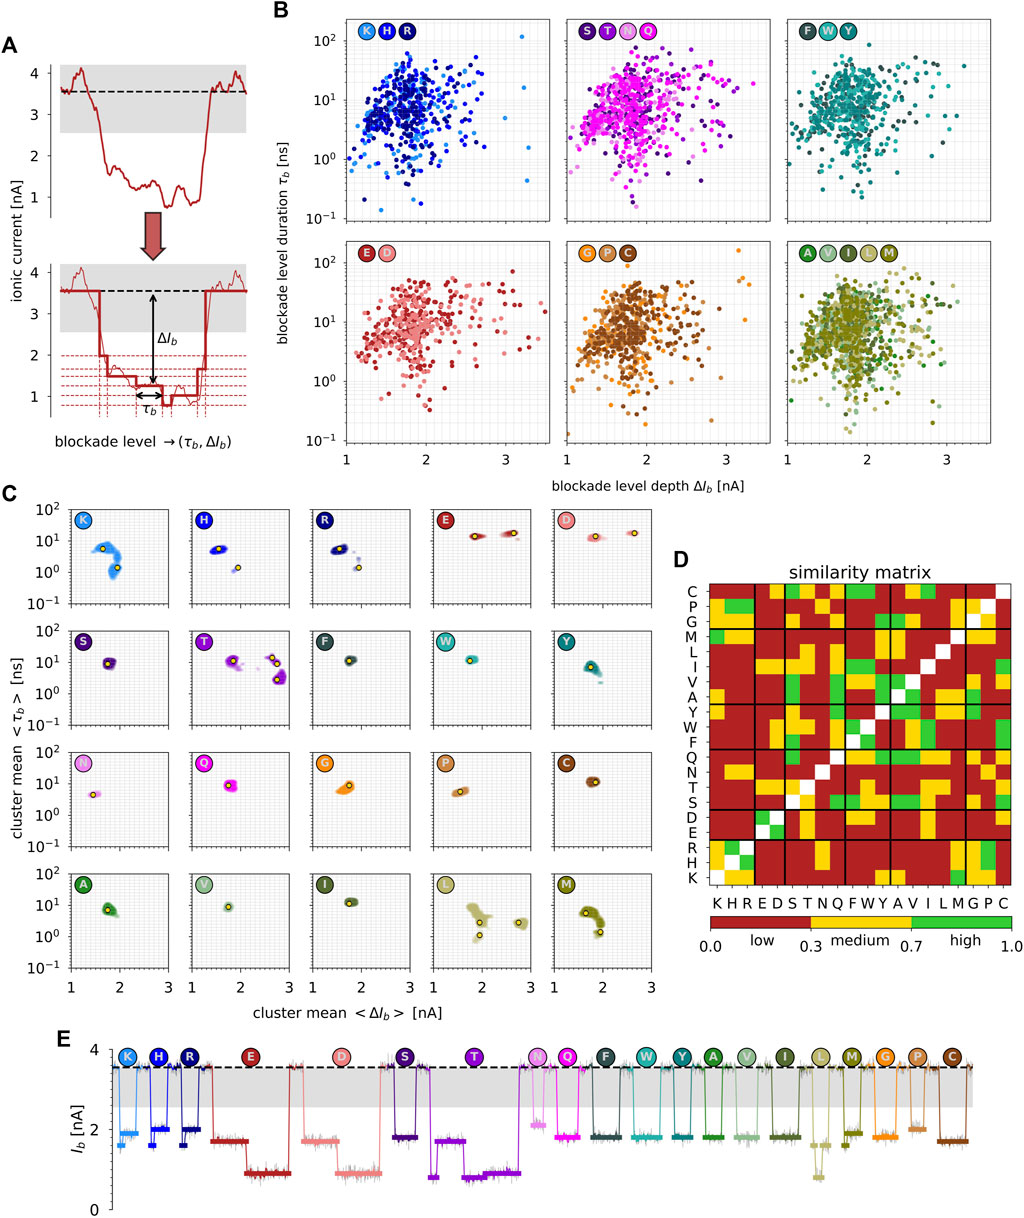
FIGURE 4. (A) Structural break detection applied to ionic current blockade traces. The raw signal is converted into a step-wise signal, and each level of blockade ionic current is characterized by its duration τb and depth ΔIb. (B) Blockade level duration τb (in ns) vs. blockade level depth ΔIb (in nA). The data are grouped by amino acid family using the same color code as in Figure 1. (C) 2D Probability density functions of cluster means
Figure 4B represents the duration τb vs. depth ΔIb of blockade levels of ionic current extracted from structural break detection. First, ΔIb is between 1.0 and 3.5 nA, which represents depths from 30% to 100% of the total open-pore conductance. Second, duration τb is between a few hundreds of picoseconds to a few hundreds of nanoseconds. The visual comparison of 2D maps (ΔIb, τb) per amino acid family is complex due to the existing overlap between blockade level characteristics. However, we can observe some major differences between positively and negatively charged amino acids. For example, E and D amino acids present blockade levels with larger depths, whereas K, H, and R present blockade levels with shorter durations. Moreover, the hydrophobic/non-aromatic amino acid family (A, V, I, L, and M) shows similarity with the positively charged amino acid family. Finally, for G amino acid, which presented a non-negligible sub-population of depth ΔIb 90% blockade in its probability density P(Ib) (Figure 3C), we can observe in its 2D map (ΔIb, τb) that only three very long blockade levels among the hundreds detected are, in fact, responsible for this behavior (Figure 4B).
To extract duration τb and depth ΔIb fingerprints of blockade events associated with the 20 proteinogenic amino acids for further sequencing applications, we applied unsupervised learning (clustering) to the 2D maps presented in Figure 4B. The GMM algorithm was employed repeatedly to detect a single cluster per amino acid by modifying the data taken into account to initialize each cluster mean (see Materials and methods). As input data of GMM algorithm, each blockade level k was characterized by the three following features
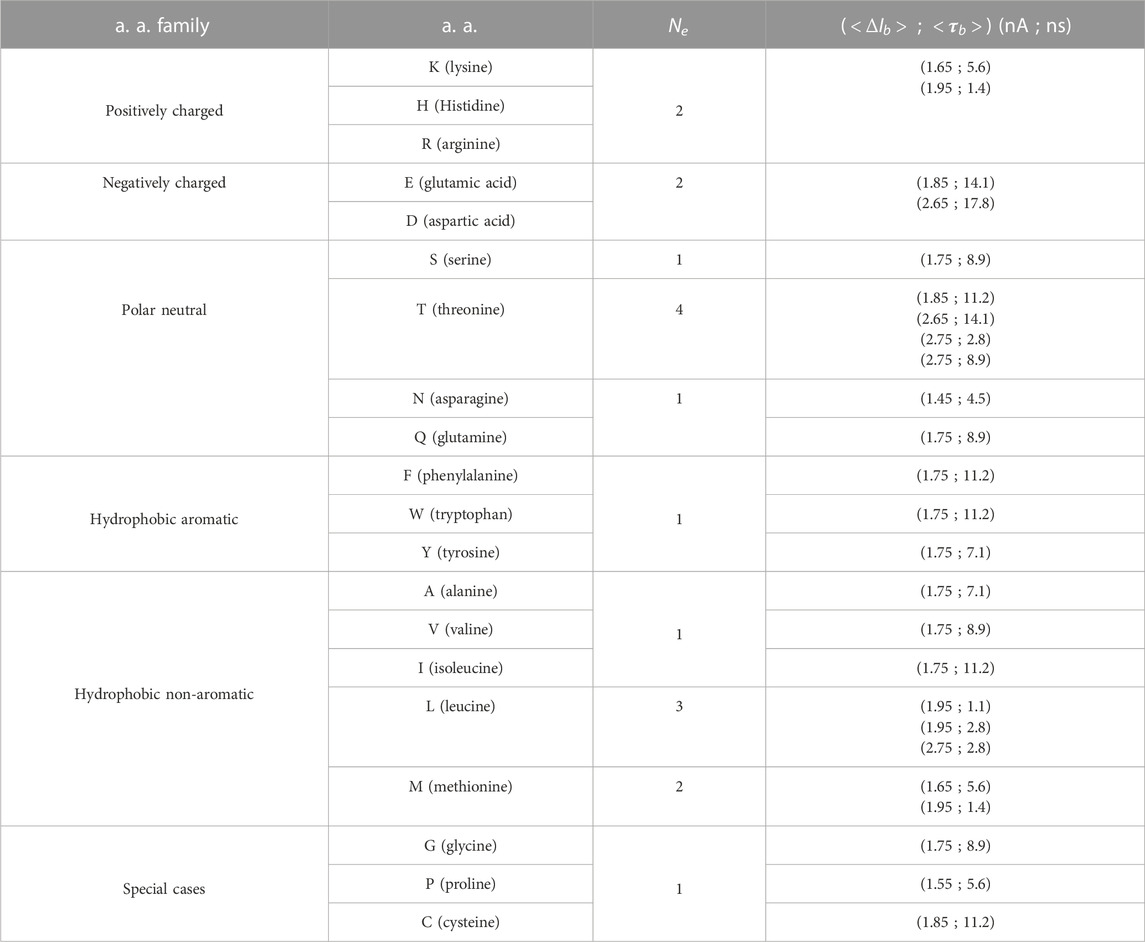
TABLE 1. Characteristics of extrema per amino acid (a. a.) extracted from 2D PDFs of cluster means
Overall, in addition to charged amino acids, which present specific characteristics and can be easily identified, T and L amino acids also present singular behavior with 4 and 3 fingerprints (Table 1), respectively. These two amino acids can also be easily identified visually from clustering of levels duration and depth of blockade events. Within each amino acid family, starting with the polar/neutral family, only S and Q show high similarity, while all the others present very low similarity within each other. It is noticeable that N amino acid, although being characterized by a single fingerprint as many other neutral amino acids (80% of them), differs by possessing the smallest and relatively short level of blockade current among all the amino acids. Then, for hydrophobic amino acids, only F and W present very similar fingerprints, as well as A and V. Finally, for the special cases family, only G and P present medium similarity. To summarize and as shown in Figure 4E, only two families of amino acids can be visually identified from their blockade levels of ionic current recorded from their translocation through single-layer MoS2 nanopores: the positively charged amino acids on one side and the negatively charged amino acids on the other side. For neutral amino acids, T and L can also be identified, presenting singular fingerprints. This result is crucial to demonstrate the feasibility of using 2D MoS2 nanopores for protein sequencing applications.
4 Conclusion
In the present work, we demonstrated the ability of single-layer MoS2 nanopore sensors to differentiate positively and negatively charged amino acids from neutral ones using classical MD and unsupervised machine learning-based models. From the large variability of ionic current traces monitored during translocation simulations and shown in Figure 3B and Supplementary Figures S5–S8, we developed a methodology to extract relevant blockade levels of ionic current based on multiple translocations (readouts) of a given amino acid. We used structural break detection applied to the different traces. Then, 2D clustering of blockade depth (drop) and duration (dwell) allows us to statistically identify relevant discrete blockade levels, hereafter called fingerprints specific to each amino acid. From this methodology, we showed that both positively and negatively charged amino acids are characterized by two fingerprints, while most of the neutral amino acids are characterized by a single one (except T, L, and M). In addition, the similarity between amino acids fingerprints is very low, with 60% of the similarities between pairs of amino acids being below 30%, with 30% being between 30% and 70%, and 10% larger than 70%. From the present conclusion, we propose the use of Coarse-Grained SEQuences (CGSEQs) of proteins for their identification. CGSEQs are made of three motifs A, B, or C, A being positively charged amino acids (K, H, and R), B being negatively charged amino acids (E and D), and C being neutral amino acids. For example, the CGSEQ of the KTKEGV sequence, which is a specific motif of the protein α-synuclein, a biomarker of Parkinson’s disease (Dettmer et al., 2015; Nicolaï et al., 2020), is ACABCC.
As a proof of concept, we tested the CGSEQ protein sequencing hypothesis by using the protein sequences available from the ASTRAL database (Brenner et al., 2000), which provides representative subsets of proteins after the elimination of doublons and sequence identity larger than 95%. It corresponds to a total of 13,000 protein sequences instead of 35,000 available. For each pair of sequences of the same length, we computed the CGSEQ percentage identity as the normalized dot product between simplified sequences by assigning value 1 for the product of two identical symbols and 0 otherwise. For example, the dot product of ACAB with BCAA is (0 + 1 + 1 + 0)/4 = 0.5. As shown in Figure 5A, the average percentage of CGSEQ identity, computed considering at least 10 protein sequences of the same length for each length available, varies from 9.0% to 21.6%, with an average score of 13%, which is very low. By comparison, the average percentage identity using the full sequence of amino acids is 6% (values range between 5.4% and 17.2%). In addition, if we consider one of the largest ensembles of protein sequences of the same length, i.e., N = 99 amino acids, we observe that 6% of CGSEQ identities are exactly zero (Figure 5B). Moreover, 35% and 92% of the CGSEQ identities are below 10% and 20%, respectively (Figure 5C). Therefore, the present results and the CGSEQ identity analysis demonstrate that the differentiation of positively charged, negatively charged, and neutral amino acids using MoS2 nanopores would allow the identification of proteins from their sequences. This is a major finding for further protein sequencing applications as it seems that the goal of detection of every amino acid of a polypeptide for its identification is not necessary.
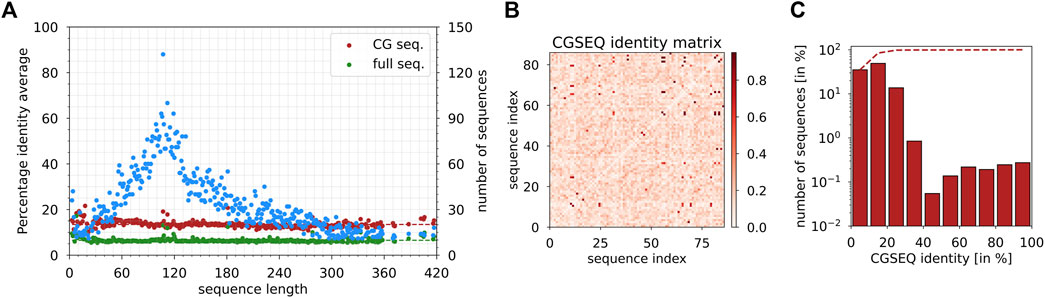
FIGURE 5. (A) Average CGSEQ percentage identity (left y-axis) as a function of the sequence length computed from protein sequences available in the ASTRAL database. Green and red dots indicate the identity values using the full sequence and the coarse-grained sequence, respectively. Blue dots indicate the number of sequences as a function of the sequence length from the database (right y-axis). (B) CGSEQ identity matrix computed between protein sequences of length N = 99 available in the ASTRAL database. (C) Histogram of CGSEQ identity computed between protein sequences of length N = 99 available in the ASTRAL database.
Data availability statement
The raw data supporting the conclusion of this article will be made available by the authors, without undue reservation.
Author contributions
AUH: data curation, formal analysis, software, validation, and writing–original draft. PD: data curation and writing–review and editing. CG: methodology and writing–review and editing. AN: conceptualization, data curation, formal analysis, methodology, supervision, validation, writing–original draft, and writing–review and editing. PS: conceptualization, funding acquisition, project administration, supervision, and writing–review and editing.
Funding
The authors declare financial support was received for the research, authorship, and/or publication of this article. This work is part of the project SEPIA supported by the EIPHI Graduate School (contract ANR-17-EURE-0002), the Conseil Régional de Bourgogne-Franche-Comté, and the European Union through the PO FEDER-FSE Bourgogne 2021/2027 program.
Acknowledgments
The simulations were performed using HPC resources from DSI-CCuB (Université de Bourgogne).
Conflict of interest
The authors declare that the research was conducted in the absence of any commercial or financial relationships that could be construed as a potential conflict of interest.
The authors declare that they were editorial board members of Frontiers, at the time of submission. This had no impact on the peer review process and the final decision.
Publisher’s note
All claims expressed in this article are solely those of the authors and do not necessarily represent those of their affiliated organizations, or those of the publisher, the editors, and the reviewers. Any product that may be evaluated in this article, or claim that may be made by its manufacturer, is not guaranteed or endorsed by the publisher.
Supplementary material
The Supplementary Material for this article can be found online at: https://www.frontiersin.org/articles/10.3389/fnano.2023.1296454/full#supplementary-material
References
Abraham, M. J., van der Spoel, D., Lindahl, E., and Hess, B. (2018). GROMACS user manual version 2018.2. GROMACS.
Arima, A., Tsutsui, M., Washio, T., Baba, Y., and Kawai, T. (2021). Solid-state nanopore platform integrated with machine learning for digital diagnosis of virus infection. Anal. Chem. 93, 215–227. doi:10.1021/acs.analchem.0c04353
Arjmandi-Tash, H., Belyaeva, L. A., and Schneider, G. F. (2016). Single molecule detection with graphene and other two-dimensional materials: nanopores and beyond. Chem. Soc. Rev. 45, 476–493. doi:10.1039/c5cs00512d
Aronov, I. Z., Rybakova, A. M., Salamatov, V. Y., Tangaeva, A., and Galkina, N. M. (2019). Application of Chow test to estimate the effect of mutual recognition agreements. Int. J. Math. Eng. Manag. Sci. 4, 591–600. doi:10.33889//ijmems.2019.4.3-047
Bah, A., Vernon, R. M., Siddiqui, Z., Krzeminski, M., Muhandiram, R., Zhao, C., et al. (2015). Folding of an intrinsically disordered protein by phosphorylation as a regulatory switch. Nature 519, 106–109. doi:10.1038/nature13999
Bandara, Y. M. N. D. Y., Saharia, J., Kim, M. J., Renkes, S., and Alexandrakis, G. (2022). “Experimental approaches to solid-state nanopores,” in Single molecule sensing beyond fluorescence. Editors W. Bowen, F. Vollmer, and R. Gordon (Cham: Springer International Publishing), 297–341.
Barati Farimani, A., Heiranian, M., and Aluru, N. R. (2018). Identification of amino acids with sensitive nanoporous MoS2: towards machine learning-based prediction. npj 2D Mater Appl. 2, 14–19. doi:10.1038/s41699-018-0060-8
Barrios Pérez, M. D., Nicolaï, A., Delarue, P., Meunier, V., Drndić, M., and Senet, P. (2019). Improved model of ionic transport in 2-D MoS2 membranes with sub 5 nm pores. Appl. Phys. Lett. 114, 023107. doi:10.1063/1.5061825
Best, R. B., de Sancho, D., and Mittal, J. (2012). Residue-specific alpha-helix propensities from molecular simulation. Biophysical J. 102, 1462–1467. doi:10.1016/j.bpj.2012.02.024
Borrebaeck, C. A. K. (2017). Precision diagnostics: moving towards protein biomarker signatures of clinical utility in cancer. Nat. Rev. Cancer 17, 199–204. doi:10.1038/nrc.2016.153
Brenner, S. E., Koehl, P., and Levitt, M. (2000). The ASTRAL compendium for protein structure and sequence analysis. Nucleic Acids Res. 28, 254–256. doi:10.1093/nar/28.1.254
Bussi, G., Donadio, D., and Parrinello, M. (2007). Canonical sampling through velocity rescaling. J. Chem. Phys. 126, 014101. doi:10.1063/1.2408420
Chen, H., Li, L., Zhang, T., Qiao, Z., Tang, J., and Zhou, J. (2018). Protein translocation through a MoS2 nanopore:A molecular dynamics study. J. Phys. Chem. C 122, 2070–2080. doi:10.1021/acs.jpcc.7b07842
Cressiot, B., Bacri, L., and Pelta, J. (2020). The promise of nanopore technology: advances in the discrimination of protein sequences and chemical modifications. Small Methods 4, 2000090. doi:10.1002/smtd.202000090
Danda, G., Masih Das, P., Chou, Y. C., Mlack, J. T., Parkin, W. M., Naylor, C. H., et al. (2017). Monolayer WS2 nanopores for DNA translocation with light-adjustable sizes. ACS Nano 11, 1937–1945. doi:10.1021/acsnano.6b08028
Dempster, A. P., Laird, N. M., and Rubin, D. B. (1977). Maximum likelihood from incomplete data via the EM algorithm. J. R. Stat. Soc. Ser. B Methodol. 39, 1–22. doi:10.1111/j.2517-6161.1977.tb01600.x
Dettmer, U., Newman, A. J., von Saucken, V. E., Bartels, T., and Selkoe, D. (2015). KTKEGV repeat motifs are key mediators of normal α-synuclein tetramerization: their mutation causes excess monomers and neurotoxicity. Proc. Natl. Acad. Sci. U.S.A. 112, 9596–9601. doi:10.1073/pnas.1505953112
Diaz Carral, A., Ostertag, M., and Fyta, M. (2021). Deep learning for nanopore ionic current blockades. J. Chem. Phys. 154, 044111. doi:10.1063/5.0037938
Dong, Z., Kennedy, E., Hokmabadi, M., and Timp, G. (2017). Discriminating residue substitutions in a single protein molecule using a sub-nanopore. ACS Nano 11, 5440–5452. doi:10.1021/acsnano.6b08452
Eggenberger, O. M., Ying, C., and Mayer, M. (2019). Surface coatings for solid-state nanopores. Nanoscale 11, 19636–19657. doi:10.1039/c9nr05367k
Eisenstein, M. (2023). Seven technologies to watch in 2023. Nature 613, 794–797. doi:10.1038/d41586-023-00178-y
Farshad, M., and Rasaiah, J. C. (2020). Molecular dynamics simulation study of transverse and longitudinal ionic currents in solid-state nanopore DNA sequencing. ACS Appl. Nano Mat. 3, 1438–1447. doi:10.1021/acsanm.9b02280
Feng, J., Liu, K., Bulushev, R. D., Khlybov, S., Dumcenco, D., Kis, A., et al. (2015). Identification of single nucleotides in MoS2 nanopores. Nat. Nanotechnol. 10, 1070–1076. doi:10.1038/nnano.2015.219
Fragasso, A., Schmid, S., and Dekker, C. (2020). Comparing current noise in biological and solid-state nanopores. ACS Nano 14, 1338–1349. doi:10.1021/acsnano.9b09353
Garaj, S., Hubbard, W., Reina, A., Kong, J., Branton, D., and Golovchenko, J. A. (2010). Graphene as a subnanometre trans-electrode membrane. Nature 467, 190–193. doi:10.1038/nature09379
Gu, Z., Luna, P. D., Yang, Z., and Zhou, R. (2017). Structural influence of proteins upon adsorption to MoS2 nanomaterials: comparison of MoS2 force field parameters. Phys. Chem. Chem. Phys. 19, 3039–3045. doi:10.1039/c6cp05260f
Heiranian, M., Farimani, A. B., and Aluru, N. R. (2015). Water desalination with a single-layer MoS2 nanopore. Nat. Commun. 6, 8616. doi:10.1038/ncomms9616
Hess, B., Bekker, H., Berendsen, H. J. C., and Fraaije, J. G. E. M. (1997). LINCS: a linear constraint solver for molecular simulations. J. Comput. Chem. 18, 1463–1472. doi:10.1021/ct700200b
Isele-Holder, R. E., Mitchell, W., and Ismail, A. E. (2012). Development and application of a particle-particle particle-mesh Ewald method for dispersion interactions. J. Chem. Phys. 137, 174107. doi:10.1063/1.4764089
Jena, M. K., and Pathak, B. (2023). Development of an artificially intelligent nanopore for high-throughput DNA sequencing with a machine-learning-aided quantum-tunneling approach. Nano Lett. 23, 2511–2521. doi:10.1021/acs.nanolett.2c04062
Jorgensen, W. L., Chandrasekhar, J., Madura, J. D., Impey, R. W., and Klein, M. L. (1983). Comparison of simple potential functions for simulating liquid water. J. Chem. Phys. 79, 926–935. doi:10.1063/1.445869
Joung, I. S., and Cheatham, T. E. I. (2008). Determination of alkali and halide monovalent ion parameters for use in explicitly solvated biomolecular simulations. J. Phys. Chem. B 112, 9020–9041. doi:10.1021/jp8001614
Kennedy, E., Dong, Z., Tennant, C., and Timp, G. (2016). Reading the primary structure of a protein with 0.07 nm3 resolution using a subnanometre-diameter pore. Nat. Nanotech 11, 968–976. doi:10.1038/nnano.2016.120
Kolmogorov, M., Kennedy, E., Dong, Z., Timp, G., and Pevzner, P. A. (2017). Single-molecule protein identification by sub-nanopore sensors. PLoS Comput. Biol. 13, e1005356. doi:10.1371/journal.pcbi.1005356
Lee, K., Park, K. B., Kim, H. J., Yu, J. S., Chae, H., Kim, H. M., et al. (2018). Recent progress in solid-state nanopores. Adv. Mater. 30, 1704680. doi:10.1002/adma.201704680
Liu, K., Feng, J., Kis, A., and Radenovic, A. (2014). Atomically thin molybdenum disulfide nanopores with high sensitivity for DNA translocation. ACS Nano 8, 2504–2511. doi:10.1021/nn406102h
Liu, S., Lu, B., Zhao, Q., Li, J., Gao, T., Chen, Y., et al. (2013). Boron nitride nanopores: highly sensitive DNA single-molecule detectors. Adv. Mater. 25, 4549–4554. doi:10.1002/adma.201301336
Luan, B., and Zhou, R. (2018). Single-file protein translocations through graphene-MoS2 heterostructure nanopores. J. Phys. Chem. Lett. 9, 3409–3415. doi:10.1021/acs.jpclett.8b01340
Luo, Y., Wu, L., Tu, J., and Lu, Z. (2020). Application of solid-state nanopore in protein detection. Int. J. Mol. Sci. 21, 2808. doi:10.3390/ijms21082808
Merchant, C. A., Healy, K., Wanunu, M., Ray, V., Peterman, N., Bartel, J., et al. (2010). DNA translocation through graphene nanopores. Nano Lett. 10, 2915–2921. doi:10.1021/nl101046t
Meyer, N., Abrao-Nemeir, I., Janot, J. M., Torrent, J., Lepoitevin, M., and Balme, S. (2021). Solid-state and polymer nanopores for protein sensing: a review. Adv. Colloid Interface Sci. 298, 102561. doi:10.1016/j.cis.2021.102561
Meyer, N., Janot, J. M., Lepoitevin, M., Smietana, M., Vasseur, J. J., Torrent, J., et al. (2020). Machine learning to improve the sensing of biomolecules by conical track-etched nanopore. Biosens. (Basel) 10, 140. doi:10.3390/bios10100140
Misiunas, K., Ermann, N., and Keyser, U. F. (2018). QuipuNet: convolutional neural network for single-molecule nanopore sensing. Nano Lett. 18, 4040–4045. doi:10.1021/acs.nanolett.8b01709
Mittal, S., Manna, S., and Pathak, B. (2022). Machine learning prediction of the transmission function for protein sequencing with graphene nanoslit. ACS Appl. Mat. Interfaces 14, 51645–51655. doi:10.1021/acsami.2c13405
Mojtabavi, M., VahidMohammadi, A., Liang, W., Beidaghi, M., and Wanunu, M. (2019). Single-molecule sensing using nanopores in two-dimensional transition metal carbide (MXene) membranes. ACS Nano 13, 3042–3053. doi:10.1021/acsnano.8b08017
Nakano, A. (1997). Parallel multilevel preconditioned conjugate-gradient approach to variable-charge molecular dynamics. Comput. Phys. Commun. 104, 59–69.
Nicolaï, A., Barrios Pérez, M. D., Delarue, P., Meunier, V., Drndić, M., and Senet, P. (2019). Molecular dynamics investigation of polylysine peptide translocation through MoS2 nanopores. J. Phys. Chem. B 123, 2342–2353. doi:10.1021/acs.jpcb.8b10634
Nicolaï, A., Rath, A., Delarue, P., and Senet, P. (2020). Nanopore sensing of single-biomolecules: a new procedure to identify protein sequence motifs from molecular dynamics. Nanoscale 12, 22743–22753. doi:10.1039/d0nr05185c
Nicolaï, A., and Senet, P. (2022). “Challenges in protein sequencing using 2-D MoS2 Nanopores,” in Single molecule sensing beyond fluorescence. Editors W. Bowen, F. Vollmer, and R. Gordon (Cham: Springer International Publishing), 343–366.
Nosé, S., and Klein, M. (1983). Constant pressure molecular dynamics for molecular systems. Mol. Phys. 50, 1055–1076. doi:10.1080/00268978300102851
Ostadhossein, A., Rahnamoun, A., Wang, Y., Zhao, P., Zhang, S., Crespi, V. H., et al. (2017). ReaxFF reactive force-field study of molybdenum disulfide (MoS2). J. Phys. Chem. Lett. 8, 631–640.
Ouldali, H., Sarthak, K., Ensslen, T., Piguet, F., Manivet, P., Pelta, J., et al. (2020). Electrical recognition of the twenty proteinogenic amino acids using an aerolysin nanopore. Nat. Biotechnol. 38, 176–181. doi:10.1038/s41587-019-0345-2
Parrinello, M., and Rahman, A. (1981). Polymorphic transitions in single crystals: a new molecular dynamics method. J. Appl. Phys. 52, 7182–7190. doi:10.1063/1.328693
Pérez-Mitta, G., Toimil-Molares, M. E., Trautmann, C., Marmisollé, W. A., and Azzaroni, O. (2019). Molecular design of solid-state nanopores: fundamental concepts and applications. Adv. Mater. 31, 1901483. doi:10.1002/adma.201901483
Perkins, S. J. (1986). Protein volumes and hydration effects. The calculations of partial specific volumes, neutron scattering matchpoints and 280-nm absorption coefficients for proteins and glycoproteins from amino acid sequences. Eur. J. Biochem. 157, 169–180. doi:10.1111/j.1432-1033.1986.tb09653.x
Qiu, H., Zhou, W., and Guo, W. (2021). Nanopores in graphene and other 2D materials: a decade’s journey toward sequencing. ACS Nano 15, 18848–18864. doi:10.1021/acsnano.1c07960
Rappe, A. K., and Goddard, W. A. (1991). Charge equilibration for molecular dynamics simulations. J. Phys. Chem. 95, 3358–3363.
Reynolds, D. (2009). “Gaussian mixture models,” in Encyclopedia of biometrics. Editors S. Z. Li, and A. Jain (Boston, MA: Springer US), 659–663.
Schneider, G. F., Kowalczyk, S. W., Calado, V. E., Pandraud, G., Zandbergen, H. W., Vandersypen, L. M. K., et al. (2010). DNA translocation through graphene nanopores. Nano Lett. 10, 3163–3167. doi:10.1021/nl102069z
Schwarz, G. (1978). Estimating the dimension of a model. Ann. Statistics 6, 461–464. doi:10.1214/aos/1176344136
Shankla, M., and Aksimentiev, A. (2020). Molecular transport across the ionic liquid–aqueous electrolyte interface in a MoS2 nanopore. ACS Appl. Mat. Interfaces 12, 26624–26634. doi:10.1021/acsami.0c04523
Song, L., Hobaugh, M. R., Shustak, C., Cheley, S., Bayley, H., and Gouaux, J. E. (1996). Structure of staphylococcal α-hemolysin, a heptameric transmembrane pore. Science 274, 1859–1865. doi:10.1126/science.274.5294.1859
Sresht, V., Govind Rajan, A., Bordes, E., Strano, M. S., Pádua, A. A., and Blankschtein, D. (2017). Quantitative modeling of MoS2–solvent interfaces: predicting contact angles and exfoliation performance using molecular dynamics. J. Phys. Chem. C 121, 9022–9031. doi:10.1021/acs.jpcc.7b00484
Stierlen, A., Greive, S. J., Bacri, L., Manivet, P., Cressiot, B., and Pelta, J. (2023). Nanopore discrimination of coagulation biomarker derivatives and characterization of a post-translational modification. ACS Cent. Sci. 9, 228–238. doi:10.1021/acscentsci.2c01256
Sun, Y., and Wang, X. (2022). An asymptotically F-distributed Chow test in the presence of heteroscedasticity and autocorrelation. Econ. Rev. 41, 177–206. doi:10.1080/07474938.2021.1874703
Taniguchi, M. (2020). Combination of single-molecule electrical measurements and machine learning for the identification of single biomolecules. ACS Omega 5, 959–964. doi:10.1021/acsomega.9b03660
Taniguchi, M., Takei, H., Tomiyasu, K., Sakamoto, O., and Naono, N. (2022). Sensing the performance of artificially intelligent nanopores developed by integrating solid-state nanopores with machine learning methods. J. Phys. Chem. C 126, 12197–12209. doi:10.1021/acs.jpcc.2c02674
Thiruraman, J. P., Fujisawa, K., Danda, G., Das, P. M., Zhang, T., Bolotsky, A., et al. (2018). Angstrom-size defect creation and ionic transport through pores in single-layer MoS2. Nano Lett. 18, 1651–1659. doi:10.1021/acs.nanolett.7b04526
Tsutsui, M., Takaai, T., Yokota, K., Kawai, T., and Washio, T. (2021). Deep learning-enhanced nanopore sensing of single-nanoparticle translocation dynamics. Small Methods 5, 2100191. doi:10.1002/smtd.202100191
Wang, F., Zhao, C., Zhao, P., Chen, F., Qiao, D., and Feng, J. (2023). MoS2 nanopore identifies single amino acids with sub-1 Dalton resolution. Nat. Commun. 14, 2895. doi:10.1038/s41467-023-38627-x
Xia, K., Hagan, J. T., Fu, L., Sheetz, B. S., Bhattacharya, S., Zhang, F., et al. (2021). Synthetic heparan sulfate standards and machine learning facilitate the development of solid-state nanopore analysis. Proc. Natl. Acad. Sci. U. S. A. 118, e2022806118. doi:10.1073/pnas.2022806118
Xue, L., Yamazaki, H., Ren, R., Wanunu, M., Ivanov, A. P., and Edel, J. B. (2020). Solid-state nanopore sensors. Nat. Rev. Mater 5, 931–951. doi:10.1038/s41578-020-0229-6
Yang, W., and Dekker, C. (2022). “Single-molecule ionic and optical sensing with nanoapertures,” in Single molecule sensing beyond fluorescence. Editors W. Bowen, F. Vollmer, and R. Gordon (Cham: Springer International Publishing), 367–387.
Zhao, D., Chen, H., Wang, Y., Li, B., Duan, C., Li, Z., et al. (2021). Molecular dynamics simulation on DNA translocating through MoS2 nanopores with various structures. Front. Chem. Sci. Eng. 15, 922–934. doi:10.1007/s11705-020-2004-z
Keywords: solid-state nanopores, protein sequencing, ionic current, molecular dynamics, machine learning, MoS2
Citation: Urquiola Hernández A, Delarue P, Guyeux C, Nicolaï A and Senet P (2023) Single-layer MoS2 solid-state nanopores for coarse-grained sequencing of proteins. Front. Nanotechnol. 5:1296454. doi: 10.3389/fnano.2023.1296454
Received: 18 September 2023; Accepted: 10 October 2023;
Published: 03 November 2023.
Edited by:
Konstantinos Ritos, University of Thessaly, GreeceReviewed by:
Karina Kubiak-Ossowska, University of Strathclyde, United KingdomHarm Van Zalinge, University of Liverpool, United Kingdom
Copyright © 2023 Urquiola Hernández, Delarue, Guyeux, Nicolaï and Senet. This is an open-access article distributed under the terms of the Creative Commons Attribution License (CC BY). The use, distribution or reproduction in other forums is permitted, provided the original author(s) and the copyright owner(s) are credited and that the original publication in this journal is cited, in accordance with accepted academic practice. No use, distribution or reproduction is permitted which does not comply with these terms.
*Correspondence: Adrien Nicolaï, YWRyaWVuLm5pY29sYWlAdS1ib3VyZ29nbmUuZnI=