 Beatrice Cipriani
 Hender Lopez
 Giorgia Brancolini
- 1School of Physics, Clinical and Optometric Sciences, Technological University Dublin, Dublin, Ireland
- 2FOCAS Research Institute, TU Dublin, Dublin, Ireland
- 3Center S3, CNR Nanoscience Institue, Modena
When in contact with biological matrices, gold nanoparticles (AuNPs) become coated with a protein corona, which governs their biological identity and mediates interactions with cells and tissues. This study explores the adsorption behavior and conformational dynamics of two key plasma proteins, human serum albumin (HSA) and transferrin (TRF), on AuNP surfaces using Brownian Dynamics (BD) and atomistic Molecular Dynamics (MD) simulations. The results reveal multiple binding mechanisms for HSA and TRF on Au (111) surfaces. HSA exhibits significant reorientations during binding, initiated by negatively charged residues and stabilized by hydrophilic amino acids, with its structural rigidity requiring multiple reversible anchoring attempts before achieving more energetically favorable interactions. In contrast, TRF demonstrates rapid and stable binding due to its intrinsic local flexibility, retaining docked orientations with minimal reorientation. While both proteins utilize electrostatic interactions to approach the surface, TRF’s disordered structure enables swift adaptation, whereas HSA’s rigidity supports strong interactions upon relaxation. These findings highlight contrasting binding strategies, with TRF prioritizing speed and flexibility, and HSA exploiting domain rearrangements for sustained stability. Importantly, the results obtained at the all-atom level of resolution are critical for the development of coarse-grained and mesoscale models. The approach in classifying protein orientation enhances our understanding of the protein corona’s shape and morphology and could advance its effective representation in lower-resolution models. The insights gained from these simulations enable us to analyze the different adsorption behavior of TRF and HSA, providing a deeper understanding of how their structural properties influence protein corona formation.
1 Introduction
Gold nanoparticles (AuNPs) are widely recognized for their diverse applications in biomedicine (Dykman and Khlebtsov, 2012; Pyne et al., 2020), including drug delivery (Erik et al., 2012; Matus and Hakkinen, 2024), diagnostics (Ray et al., 2022), and therapeutic interventions (Bloise et al., 2022; Neupane et al., 2018). When introduced into a biological environment, such as blood plasma, AuNPs quickly become coated with a complex layer of biomolecules, predominantly proteins, forming what is known as the protein/biomolecule corona (Bewersdor et al., 2020; Wang et al., 2013; Tenzer et al., 2011; Monopoli et al., 2012). This corona not only determines the biological identity of nanoparticles, but also governs their interactions with cells, their biodistribution, and their immune responses (Trinh et al., 2022; Monopoli et al., 2012). The protein corona is typically categorized into two layers: the hard corona, consisting of proteins tightly adsorbed onto the nanoparticle surface with long residence times, and the soft corona, characterized by loosely associated proteins in dynamic equilibrium with the surrounding solution (Zhang et al., 2020; Lee, 2023; Baimanov et al., 2019; Mohammad-Beigi et al., 2020; Wang et al., 2013). Despite extensive experimental and computational approaches (Lynch et al., 2009; Nel et al., 2009; Feng Ding et al., 2013), the molecular mechanisms underlying protein adsorption and corona formation remain poorly understood. Computational methods including fully atomistic classical molecular dynamics (Brancolini et al., 2019a) and coarse-grained methods (Brancolini et al., 2019b; Brancolini and Tozzini, 2019; Brancolini et al., 2019a; Vilaseca et al., 2013; Shao and Hall, 2016; Power et al., 2019; Vilanova et al., 2016; 2025), have proven particularly valuable in elucidating protein-nanoparticle interactions at atomic and molecular scales. However, significant gaps in knowledge persist regarding how the intrinsic structural properties of proteins influence their adsorption dynamics, conformational changes, and binding stability on nanoparticle surfaces. Among the proteins present in human plasma, Human Serum Albumin (HSA) and Transferrin (TRF) are of particular interest due to their abundance (Schenk et al., 2008) and distinct structural properties and roles in biological systems. HSA, a globular and highly soluble protein stabilized by numerous disulfide bridges, function as a transports molecule for various substances (Theodore Peters, 1996). In contrast, TRF, a glycoprotein specialized in iron transport (Gomme et al., 2005), is known for its structural flexibility and specific binding affinity to gold nanoparticle surfaces (Gkouvatsos et al., 2012). These distinct characteristics make HSA and TRF ideal candidates for studying how protein structure influences adsorption mechanisms. Previous studies (Dai et al., 2023), have revealed intriguing insights into protein-AuNP interactions. For example, experiments with HSA on various NP shapes (spheres, rods, and flowers) showed that adsorption often leads to conformational changes, such as a reduction in
2 Materials and methods
2.1 Computational details: preparation of atomic coordinates
The atomic coordinates of both proteins were derived from their full amino acid sequences to include previously missing residues from experimental models, ensuring a complete structural representation. The 585-aminoacidic structure of HSA (UniProt: P02768) was obtained from the AlphaFold Protein Structure Database (Varadi et al., 2024) (ID: AF-F6KPG5-F1-v4), yielding a model with an average per-residue measure of local confidence pLDDT score of 94.25. This model was subsequently aligned to a chosen experimental crystal structure to verify that incorporating the previously missing loops and flexible regions did not cause significant deviations from the experimentally determined ordered domains. The alignment was performed on the crystal structure (PDB ID: 1AO6) using TM-align (Zhang and Skolnick, 2005), achieving a TM-score of 0.979, indicating close structural similarity. For TRF (UniProt: P02787), the 679-residue structure was modelled using Alphafold3 (Ronneberger et al., 2021), resulting in a pTM score of 0.91. Although the AlphaFold-predicted structure does not include iron, structural comparisons with iron-bound (3QYT) and apo forms (7Q1L) of transferrin confirm that the overall protein fold is preserved, with a TM-score of 0.983 and 0.9995, respectively, justifying its use in adsorption studies. The PDB2PQR software (Dolinsky et al., 2004) has been used with the PROPKA method (Olsson et al., 2011) to assign titration states of the protein side chains at physiological pH (7.4), resulting in total charges of −13 for HSA and −3 for TRF. Partial atomic charges were assigned to the protein atoms based on the OPLS force field (Robertson et al., 2015).
2.2 Brownian dynamics docking
Rigid-body Brownian Dynamics (BD) simulations were conducted to perform docking using the SDA software (version 7) (Martinez et al., 2015). The ProMetCS (Kokh et al., 2010) continuum solvent model was applied to account for protein-metal surface interactions. Two primary components of the total interaction energy
A neutral Au (111) surface, with a surface area of 20 × 20
2.3 Protein-Au (111) molecular dynamics simulations
Flexible refinement of the representative docking structures was conducted through Molecular Dynamics (MD) simulations in explicit solvent using the GROMACS software package (Bekker et al., 1993). For structural refinement, the two most populated clusters from each protein docking were selected. The same protein structures and protonation states used in the BD simulations served as the starting point for the MD simulations. A cubic simulation box was constructed, containing the protein, spce water molecules, and the Au surface. Periodic boundary conditions were applied. The Au (111) surface was modelled as a crystalline slab with dimensions of
3 Results and discussion
3.1 Docking of HSA and TRF onto gold
BD simulations were used to generate trajectories of protein diffusion and identify the binding orientations (referred to as “encounter complexes”) of HSA and TRF on the Au (111) surface. To reliably determine the most frequently occurring binding orientations, a single-linkage hierarchical clustering algorithm was applied to protein-surface encounter complexes based on their spatial orientation (Martinez et al., 2015). Structures were clustered using a 3
After clustering analysis, the two most populated complexes formed between each protein and the Au surface were selected for further analysis. For the HSA-gold complexes, these two structures represented 97.6% of all observed complexes. Similarly, the two most prevalent TRF-gold complexes accounted for 89.7% of the total observed complexes. These most common protein-surface complex structures are depicted in Figure 1.
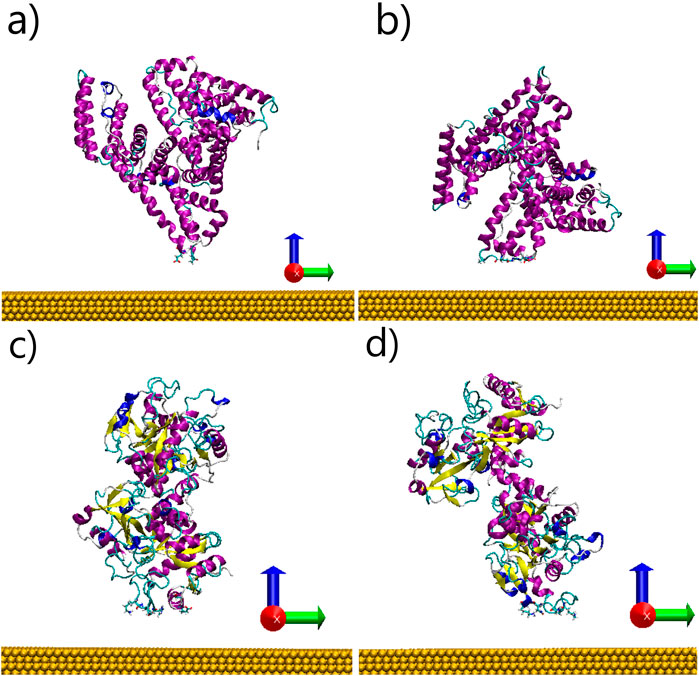
Figure 1. Encounter complexes of Human Serum Albumin (a, b) and Transferrin (c, d) on neutral gold obtained by BD simulation. The structures of representative complexes for the two most populated clusters are shown. The protein backbone is shown in cartoon representation while the residues contacting the gold surface are shown in licorice representation.
Supplementary Table S1 reports the interaction energies and contact residues of the two most populated orientations for both HSA and TRF proteins.
3.1.1 HSA clusters
Clustering analysis of HSA encounter complexes revealed two genuinely distinct binding orientations. The most populated cluster, Cluster A, is accounting for 59.2
3.1.2 TRF clusters
Cluster A represents the most populated and energetically favorable cluster. In this cluster, both the non-polar and electrostatic interactions contribute favorably to the total binding energy (
3.2 Molecular dynamics of docked complexes
To elucidate the binding mechanism of HSA and TRF proteins binding to an Au (111) surface, we performed 20 MD simulations for each protein, starting with docking-derived orientations. These included two initial configurations per protein, each simulated five times with a different random velocity generator seeds (d1-d5), and all runs lasting 500 ns. For each protein, we simulated two different orientations relative to the gold surface. The initial placements of the protein from docking-derived structures were positioned 1.2 nm away from the surface ensuring interactions via long-range electrostatic forces at the start of the simulations. Major changes in global orientation were observed for the HSA complexes, while the TRF complexes demonstrated good stability, maintaining the original docked orientation during binding. Figure 2 presents the average Coulomb and Lennard-Jones components of the protein-Au (111) interaction, as reported for both the simulated HSA and TRF complexes. On the metal surface water molecules form two layers (Supplementary Figure S2 ESI) that drive the diffusion of the protein towards it. During the anchoring phase, the protein first makes contact with the second water layer bound to the surface. Prior to the induced fit, the anchored protein gradually rearranges its structure to directly bind the relevant groups to the solid surface, displacing the water layer immediately adjacent to it. Penna et al. define this process as “Lockdown phase” (Penna et al., 2014). The simulations have consistently shown various anchoring and lockdown events, even within the same complexes (Supplementary Figure S3 ESI). Notably, the HSA Complexes have exhibited instances of reversible anchoring, as the protein comes adrift sometime after anchoring in the gold slab, especially when this phase sees involved hydrophobic amino acids. In general, we observed negatively charged residues driving the anchoring initiation event for HSA protein such as GLU60-311 and ASP129-365-562, whether for TRF the residues driving the anchoring are equally distributed between polar (THR165, SER435-437, ASN553-555-557), negatively charged (GLU281) and positively charged (LYS280-552-557), as can be depicted by Supplementary Figure S3. The lockdown phase seems highly enhanced by hydrophilic amino acids such as histidines, polar and charged groups. We hypothesize that the success rate of these events is directly influenced by the protein’s local flexibility, which allows key residues to reach out and engage effectively. The following sections will present and discuss these findings in detail. First, we provide an overview of the structural changes the proteins undergo before, during, and after binding, highlighting their connection to the observed anchoring and lockdown mechanisms. Next, we analyze the binding mechanism for each simulated complex and replica, identifying the specific residues responsible for anchoring and lockdown events. Finally, we conduct an in-depth examination of the protein’s overall shape and orientation post-binding, discussing the further implications for coarse-grained and meso-scale models.
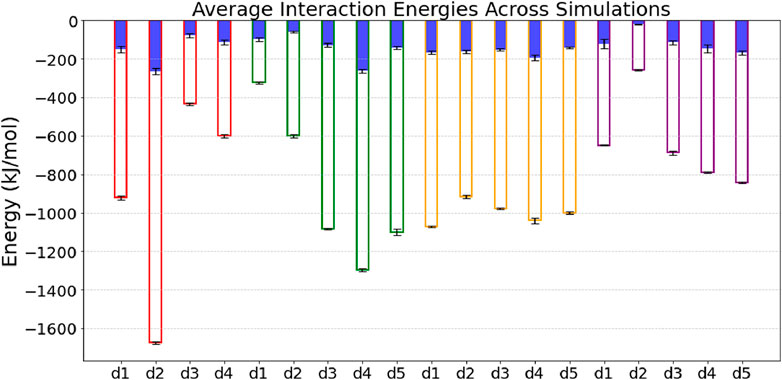
Figure 2. Average Coulomb and Lennard-Jones components of the protein-Au (111) interaction, reported for all proteins and complexes. HSA Complex A (Coul = blue, LJ = red), HSA Complex B (Coul = blue, LJ = green), TRF Complex A (Coul = blue, LJ = yellow), TRF Complex B (Coul = blue, LJ = purple). Energies are taken from the last 50 ns of the five (four for HSA-A) independent MD runs for each complex.
3.2.1 Structural changes of protein after binding
To elucidate whether and how the binding of HSA and TRF to the Au (111) surface may influence the structural stability and induce internal rearrangements in the protein structure, we calculated the radius of gyration, which provides a preliminary measure of the change in protein shape upon binding. For HSA and TRF in pure water, we obtain a gyration radius of 2.68 and 2.83 nm, respectively. As shown in Table 1, binding does not significantly alter the overall size of the proteins. Moreover, we calculated the percentage of disorder, which provides a quantitative measure of how protein adsorption affects the overall disorder in its secondary structure. This serves as an indicator of local flexibility and conformational changes upon binding. We observed a notable increase (up to 15
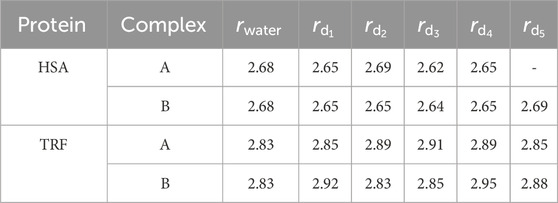
Table 1. Gyration radii from MD simulations, expressed in nm.
3.2.2 Binding mechanism of HSA - a complexes
After three anchoring attempts towards the surface, all mediated by ALA364 and ASP365, simulation d5 resulted in HSA diffusing away from the surface and binding to the top of the simulation box, so we will not discuss this simulation further. In simulation d1, HSA first attempts to anchor onto the surface at around 10 ns, with ALA364 and ASP365 interacting with the water molecules in the second layer, but no residues managing to penetrate the first water layer adjacent to the surface. This interaction led to a temporary diffusion of the protein away from the surface, similarly as observed in d5, but after undergoing a rotation exposing the C-terminal domain IIIB to the surface, a second anchoring attempt was observed through LEU585, and the protein is finally locked-down through residues GLU542, GLN543 and LYS545. After induced fit, the total number of aminoacids in close contact
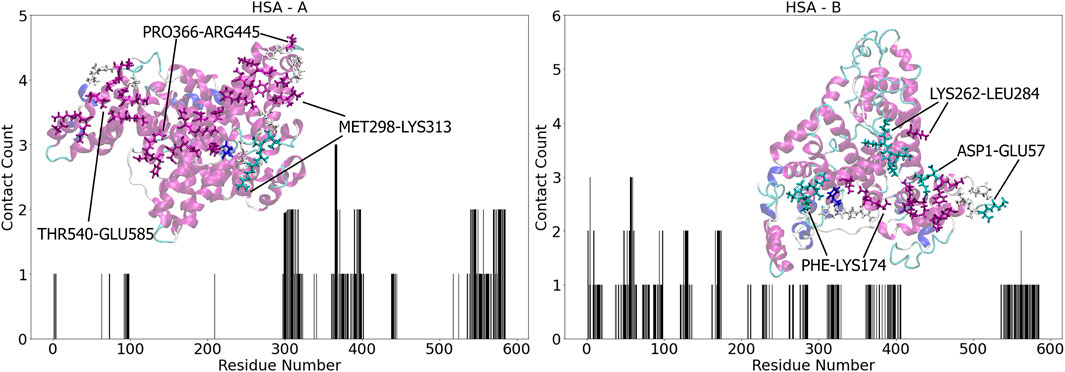
Figure 3. Contact number for HSA - A (left) and HSA - B (right) residues upon binding with Au (111), respectively. The contact count represents the cumulative occurrences across multiple simulations, accounting for repeated contacts of the same residue. Insets: graphical representations of the most populated binding sites for each complex in licorice, colored accordingly to the protein secondary structure.
3.2.3 Binding mechanism of HSA - b complexes
The simulations for Complex B reveal that only d1 and d5 retain the docking conformation after molecular dynamics. In d1, THR124 and ASP129 immediately anchor the protein, followed by the locked down phase through HIS128 and GLN170. A total of 19 residues in domain IB keep the protein attached to the gold surface, with PHE127 and the CYS124-CYS169 disulfide bond stabilizing the binding. No relaxation of other domains towards the surface is observed in this simulation, resulting in the lowest binding energy for the HSA complexes (Figure 2). In contrast, after a first, weak anchoring attempt through ALA172, d2 sees the protein diffusing away from the surface and undergoing a rotation that favors anchoring to the N-terminal domain IA, specifically through SER58 and GLU60. After, the same two residues enhance the lockdown towards the surface, and in the final stages key interactions come from the parallel guanidinium groups of ARG81 and ARG98, the CYS75-CYS91 disulfide bond, the carboxamide of ASN61, and the perpendicular orientation of PHE50’s aromatic ring. HIS3 also highly stabilizes the binding here. Simulation d3 shows residue GLN94 anchoring the surface and locking down the contact together with PRO96, with an additional relaxation of domain IIB towards the surface, that leads to a much favorable interaction energy (Figure 2). Here, three aromatic residues (PHE228, TYR263, PHE326), two histidines (3 and 367), the CYS316-CYS361 disulfide bond, and the carboxamide groups of ASN61 and GLN94 lying parallel to the surface strengthen the binding. In simulation d4, the protein first attempts to anchor the surface with ASP121, but it immediately undergoes a rotation towards domain IIIA and the C-terminal domain IIIB, with ASP562 anchoring the surface and immediately locking down the structure. In the final stage of the simulation we find contact residues in common with Complex A, simulation d2. The
3.2.4 Binding mechanism of TRF - a complexes
Differently from the HSA complexes, the five independent simulations of both TRF Complex A and B all retained the docking-derived conformation. From visual inspection, four of the simulations (d1, d2, d4, and d5) maintained a conformation perpendicular to the surface throughout the trajectory, while d3 adopted a bridge-like conformation lying horizontally to the surface plane. The protein initially anchors to the surface through HIS14; however, this interaction with the second water layer appears too weak to stabilize the protein and facilitate the conformational rearrangements necessary for the lockdown phase within relevant timescales. The protein then diffuses away from the surface. Approximately 30 nanoseconds later, the protein effectively re-anchors through favorable electrostatic interactions with residues LYS280 and GLU281, followed by a relaxation of the C-lobe. The binding is locked down in two points through favorable interactions with residues SER28 and LYS280, and it is further strengthen by HIS25, HIS273 and PHE479, with the rings lying parallel to the surface. The majority of other contact residues are polar and aliphatic in nature. Simulation d1 anchors the gold slab with residue GLU281 as well, but locks down the binding through HIS14 and PRO288. This results in a tilting of the protein towards the lobe that is located oppositely to the C-terminal one, resulting in a global conformation different from the one in d3, although with some common contact residues, as can be depicted also from Figure 4. Simulations d2 and d4 both anchors the gold slab with a similar mechanism through GLU281 and lock down the protein with residues HIS14 and HIS289. In the final binding mode we observe a significant large number (up to 26) of polar amino acids involved. Finally, simulation d5 sees the anchoring phase mainly driven by THR165 and the following lock down involving residues GLU13, LYS41 and HISD289. The simulations all yielded very similar interaction energies with the gold surface, both for the Lennard-Jones and Coulomb interactions (Figure 2). 5
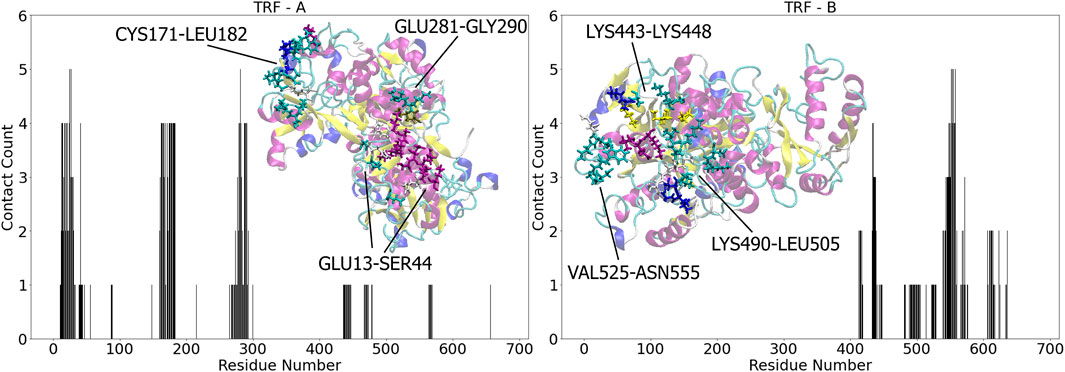
Figure 4. Contact number for TRF - A (left) and TRF - B (right) residues upon binding with Au (111), respectively. The contact count represents the cumulative occurrences across multiple simulations, accounting for repeated contacts of the same residue. Insets: graphical representations of the most populated binding sites for each complex in licorice, colored accordingly to the protein secondary structure.
3.2.5 Binding mechanism of TRF - b complexes
The interaction energies between TRF Complex B and gold after MD simulations are in good agreement with the results obtained from docking, ranking this complex as less energetically favorable than Complex A. The reason for the energy difference between Complex A and B is found in the capability of the protein to interact with the surface via two distinct lobes. In Complex B the protein interacts only through the C-terminal lobe. Figure 4 shows that a significant number of the same contact residues remain constant across all replicas, indicating that the docked orientation is consistently maintained throughout the simulations. However, after the induced fit, two dominant global conformations emerge: a skewed orientation and a fully perpendicular one. All the simulations steadily interact with the gold slab through ASN553, ASN555, ASP558 and LYS557. Simulation d2 leads to the least favorable binding energy, as the protein maintains a conformation fully perpendicular to the surface, interacting through a very small number of residues, mainly polar and negatively charged. This kind of conformation is obtained with both the anchoring and the lockdown phase are driven by SER435 and SER437. Noteworthy is the interaction via ARG568 in the final binding, whose guanidinium group lies parallel to the surface. ASN553, ASN555 and LYS557 drive the anchoring of both simulations d1 and d5, but different residues (LYS557 and SER435-ASN553) involved in the lockdown phase led to different induced fit mechanisms. In simulation d1, an additional interaction region is seen spanning residues 567-672. Conversely, in simulation d5, the interaction with the sulfur of MET499 causes a large number of residues 447-526 to relax towards the surface, resulting in the most favorable interaction for this type of complex. As we will observe in the coming section, both mechanisms result in a skewed protein conformation. In simulations d3 and d4, the protein was found anchoring the surface with LYS552, ASN553 and ASN555 and locking it down with the same residues, with the addition of LYS557. This mechanism led to a favorable interaction with two additional regions of the protein: 414-419 and 607-637. Key contacts in these intervals are given by HIS606 and ARG623.
3.2.6 Shape and orientation of protein after binding
In this section, we propose an approach to quantify and classify the overall shape and orientation of a protein after binding with a flat surface. Traditional metrics like RMSD, while useful for assessing overall structural deviation, are insufficient for classifying shape and orientation, as they do not capture directional changes or anisotropic deformation along individual spatial axes, nor do they provide information about the protein’s orientation relative to the surface. In the proposed approach, we initially assumed to model the proteins as ellipsoids, and we determine the length of their semi-axes by calculating the principal moments of inertia. In practice, at each time frame of the trajectory, we obtain the protein’s principal moments of inertia and the corresponding normalized principal axes directly using the GROMACS tool gmx principal (v. 2024.2) (Bekker et al., 1993; Abraham et al., 2015). This tool performs the diagonalization of the inertia tensor, directly providing its eigenvalues and eigenvectors at each time. We assign
the intermediate semi-axis b is given by Equation 2
and the semi-minor axis c is given by Equation 3.
Each protein shape is then classified as ellipsoid, spheroid or spherical by computing the relative differences between all pairs of the semi-axes. If all semi-axes are within 10% of each other, the shape of the protein is considered to be spherical. If two of the semi-axes are within 10% of each other while the third one differs, the shape of the protein is classified as a spheroid. In this case, the shape can be either oblate or prolate, depending on whether the dissimilar semi-axis is smaller or larger compared to the other similar two. Finally, if none of the semi-axes fall within 10% of similarity, the shape of the protein is identified as an ellipsoid. After this preliminary classification, we further quantify the eccentricity of these protein minimal models. Normally, eccentricity is calculated for a 2D ellipse using its two semi-axes (major and minor). However, since we are classifying 3D objects, we define two eccentricities: major
where
The simulations in pure water show that HSA presents a spheroid shape, specifically oblate, with semi-axes
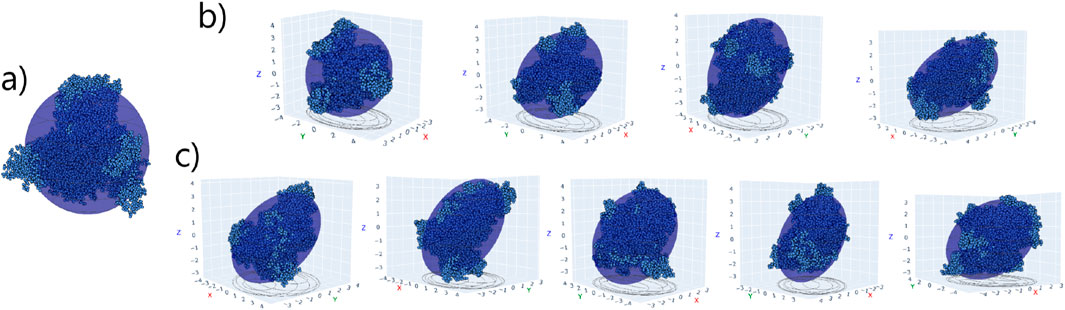
Figure 5. (a) HSA structure overlapped with equivalent spheroid in pure water. (b,c) HSA - A (d1-d4) and HSA - B (d1-d5) complexes, respectively, in their final binding orientations on the Au (111) surface (not shown). The xy plane corresponds to the Au surface.
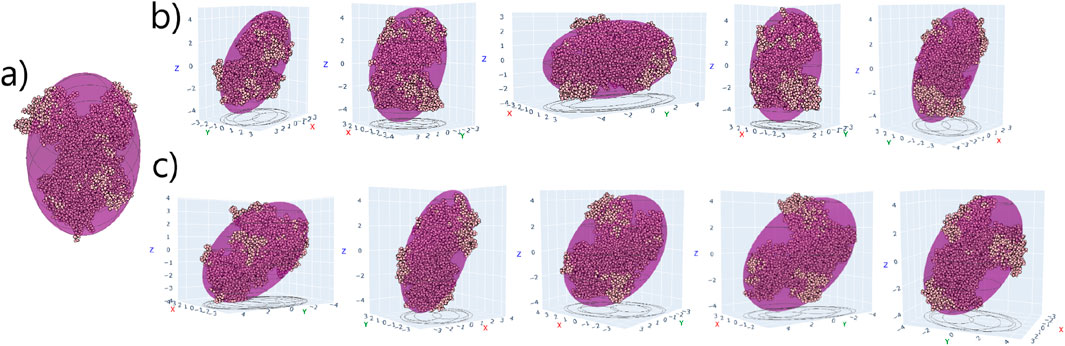
Figure 6. (a) TRF structure overlapped with equivalent ellipsoid in pure water. (b,c) TRF - A (d1-d5) and TRF - B (d1-d5) complexes, respectively, in their final binding orientations on the Au (111) surface (not shown). The xy plane corresponds to the Au surface.
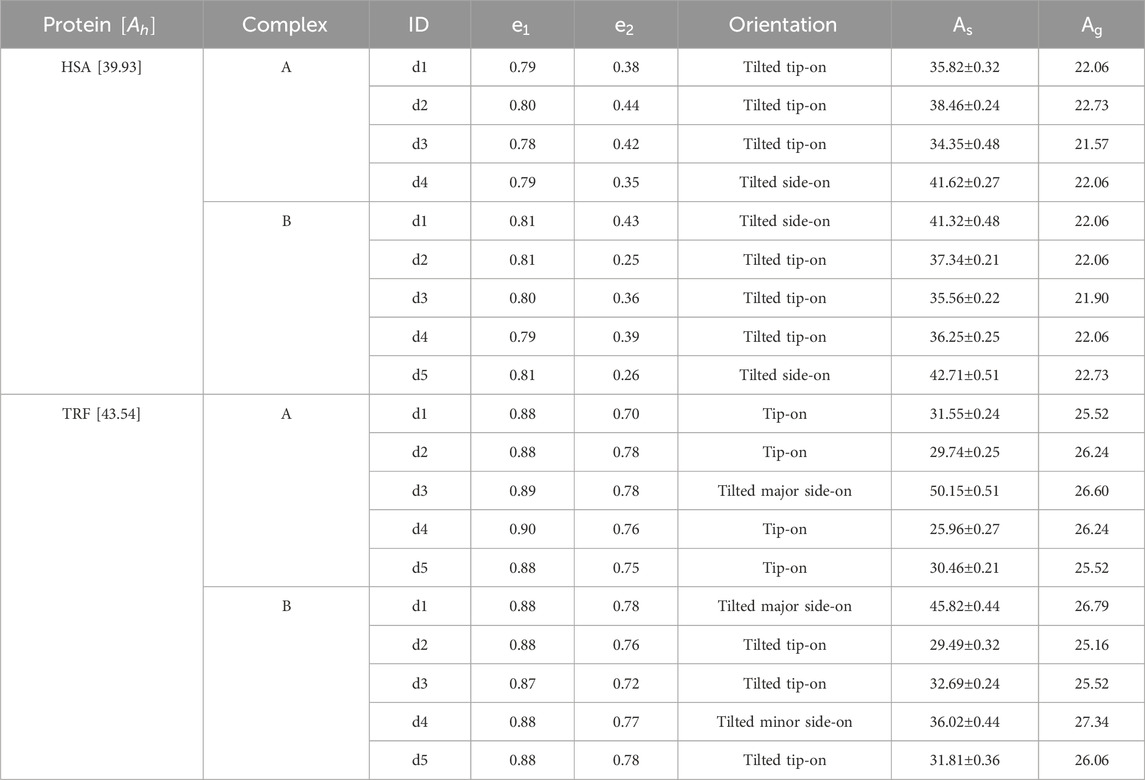
Table 2. Orientation analysis of proteins after adsorption on Au (111). Next to each protein name, the value in brackets
We then computed the surface area occupied by the proposed minimal models - e.g., the projected binding area - in their specific orientations, and compared it to the area obtained when representing the protein as a sphere of equivalent hydrodynamic or gyration size, as shown in Table 2. The hydrodynamic radius was determined using HYDROPRO (García De La Torre et al., 2000) on the protein structure in pure water, while the gyration radius used is as in Table 1. For these, the projected binding area corresponds to
We must warn that the orientation classification presented so far is based solely on the planes formed between the semi-axes and their orientation relative to the
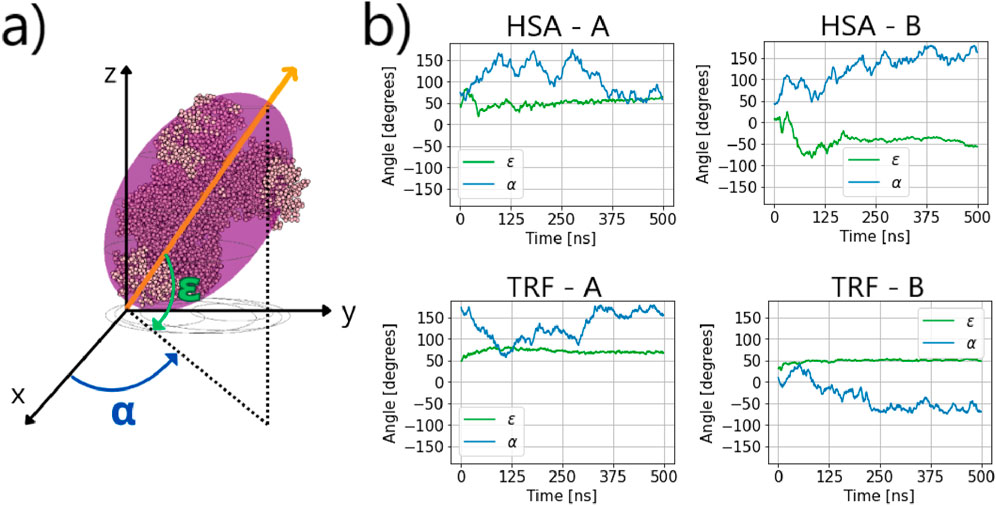
Figure 7. (a) TRF structure overlapped with equivalent ellipsoid and definition of dynamic orientation. Any protein is described by a position vector that corresponds to one of the principal axes of inertia (the most orthogonal to the
Our data show small fluctuations in the angle
4 Discussion, conclusion, and perspectives
The binding mechanism and orientation of proteins on surfaces have important implications for their biological outcome, influencing functionality, potential toxicity, and interactions with membranes. This is particularly relevant in nanomaterials, where nanoparticles are rapidly coated by a protein corona upon contact with biological fluids. In this study, we systematically examined the dynamics of two relevant plasma proteins, HSA and TRF, on neutral gold surfaces using BD simulations in a continuum solvent and MD simulations with explicit solvent. Our findings indicate that the adsorption process of large plasma proteins follows a three-step mechanism: i) directed diffusion of the protein from the bulk solution toward the water/solid interface; ii) initial anchoring to dense interfacial water layers via interactions with hydrophilic amino acids; iii) lockdown phase, driven by interactions between strongly interacting amino acids and the Au (111) surface. We observe that interfacial water is responsible for the biased diffusion of the protein towards the surface, but also determines the outcome of the second phase, leading to reversible anchoring and re-orientation if dominated by hydrophobic amino acids.
In addition to that, we observe a direct correlation between immediate or reversible anchoring and protein’s local flexibility. Orientational rearrangements are analyzed in detail and discussed in relation to the binding mechanism and structural properties. The inherent local flexibility of TRF facilitates rapid adjustments, allowing swift and stable anchoring. In contrast, HSA’s rigidity hinders efficient initial contact, leading to reversibility or misaligned anchoring and major re-orientation. However, once anchored, HSA achieves superior interaction energies, as its slower relaxation process and the rotational freedom around the axis orthogonal to the surface allow the structure to effectively adjust to the surface. Our results suggest a trade-off between speed and flexibility in TRF’s binding mechanism versus stability and energy optimization in HSA. Such insights enhance our understanding of protein-surface interactions, particularly how intrinsic structural properties influence the formation, organization, and stability of protein coronas.
The adsorption of proteins onto nanomaterials can induce structural changes that alter their overall shape (Sheibani et al., 2021; Picco et al., 2021; Cao et al., 2021; Musicò et al., 2025). To better understand the global shape of the protein corona, it is important to be able to clearly determine the proteins’ shape and their orientation over the surface. For this reason, we propose a systematic method for classifying the shape and orientation of the protein relative to the surface after binding. Our observations indicate a predominant tip-on orientation for both HSA and TRF, with their overall shape that can be approximated to spheroidal and ellipsoidal models, respectively. Interestingly, side-on orientations, which one might expect to be more energetically favorable due to their larger contact area with the surface, do not always correspond to the most stable complexes. We attribute this to two main factors: ii) the time length and number of replicas simulated may not be sufficient to observe proteins fully relaxing on the surface. Over longer timescales or larger sampling, it is possible that the proteins under analysis adopt a more stable side-on orientation, maximizing their contact with the surface; ii) limitations in the minimal models. We must emphasize that these models should be used solely to classify the final shape and orientation of the protein on the surface. Although they may capture key geometric trends, they do not account for critical features such as protein flexibility in the contact area, internal structural fluctuations, and, most importantly, uneven mass distribution. Despite these limitations, our approach to classifying protein shape and orientation remains a valuable tool for understanding the overall organization of proteins adsorbed on surfaces at larger time and length scales. In fact, we observe differences in the projected binding area between representing the proteins as ellipsoids and representing them as single spheres of equivalent hydrodynamic size. This distinction has important implications in the context of kinetic and dynamic models of protein adsorption on both flat surfaces and nanoparticles (Dell’Orco et al., 2010; Vilaseca et al., 2013; Vilanova et al., 2016; Power et al., 2019; Vilanova et al., 2025). Recent models account for the fact that once a protein occupies a specific projected binding area on the surface, that space becomes unavailable for additional protein binding, assuming the projected area can be accurately determined (Rouse and Lobaskin, 2021). The orientation a protein adopts on a surface directly impacts both the available binding area for other proteins in solution and the overall surface concentration of adsorbed proteins. Different orientations can lead to significant variations in packing density, particularly for proteins with highly anisotropic shapes, where variations in orientation can result in drastically different surface coverage and organization (Vilaseca et al., 2013). Additionally, the parametrization of coarse-grained models greatly benefits from accurate shape, orientation, and contact surface data, as these models aim to capture the key aspects of adsorption affinity from full-atomistic simulations while reducing computational costs Brancolini and Tozzini (2019).
From a dynamic point of view, we observed significant re-orientations in HSA complexes, whereas TRF complexes exhibited minimal or no re-orientations. Our analysis reveals a direct correlation between these re-orientations and the anchoring mechanism, leading us to hypothesize that both phenomena are influenced by the intrinsic local flexibility of the protein. These findings align with previous studies on small proteins and peptides, where rigid proteins undergo domain-domain reorientation and require longer times for adsorption (Penna et al., 2014; Hoefling et al., 2011; Norde, 2008; Agashe et al., 2005), and with the notion that protein orientational motions occur much faster than conformational changes (Agashe et al., 2005). Our results extend this concept to larger proteins interacting with gold surfaces, emphasizing how domain reorientation can significantly influence the composition and properties of the protein corona.
In summary, our results reveal distinct binding strategies: TRF exploits its inherent structural flexibility for rapid and stable anchoring, while HSA’s rigidity poses initial challenges but enables strong, energetically favorable interactions upon relaxation. This trade-off between speed and flexibility in the binding of TRF versus stability and energy optimization in HSA enhances our understanding of protein-surface interactions, particularly how intrinsic structural properties influence the formation and stability of protein coronas. These findings offer valuable insights into the mechanisms underlying protein adsorption on gold surfaces, which have broad implications for nanobiotechnology and biomaterials design. The distinct dynamics observed for HSA and TRF underscore the importance of tailoring surface functionalization to accommodate specific protein properties. Importantly, the results obtained at the all-atom level of resolution are critical for the development of coarse-grained and mesoscale models. The approach in classifying protein orientation enhances our understanding of the protein corona’s shape and morphology and could advance its effective representation in lower-resolution models. The insights gained from these simulations enable us to analyze the different adsorption behavior of TRF and HSA, providing a deeper understanding of how their structural properties influence protein corona formation.
Future research could focus on exploring how variations in surface chemistry, charge, or topography influence the adsorption dynamics of rigid and flexible proteins. Additionally, extending these studies to multi-protein systems would provide a deeper understanding of protein corona formation and shape in macromolecular crowding conditions, and its implications for applications such as biosensors, drug delivery systems, and nanomedicine. Future work should focus on investigating conformational changes induced by protein adsorption, as these alterations can expose new binding sites, influencing protein-protein interactions and aggregation. Understanding these structural rearrangements is crucial for predicting nanoparticle corona formation and assessing how they affect protein’s biological function, stability, and interactions with other biomolecules. The insights gained from our analysis can inform the design of coarse-grained models that incorporate the geometrical features of interacting beads, thereby improving the representation of protein-nanoparticle systems while significantly reducing computational cost. By bridging multiscale molecular dynamics simulations with experimental techniques, we can refine our understanding of protein-surface interactions, enabling the design of more effective and biocompatible nanomaterials.
Data availability statement
The original contributions presented in the study are included in the article/Supplementary Material, further inquiries can be directed to the corresponding author.
Author contributions
BC: Formal Analysis, Investigation, Methodology, Visualization, Writing – original draft, Writing – review and editing. HL: Conceptualization, Formal Analysis, Supervision, Writing – review and editing. GB: Conceptualization, Funding acquisition, Resources, Supervision, Writing – original draft, Writing – review and editing.
Funding
The author(s) declare that financial support was received for the research and/or publication of this article. This research was supported by funding from the Italian Ministry of University and Research (MUR) under the PRIN2020 program (project code: 2020LW7XWH). The total project funding amounted to €861,000, with €210,000 allocated to the CNR NANO Operational Unit. The funding was formalized under Protocol No. 0001370 dated 29/04/2022. The Coordinator for the University of Parma was Prof. Roberto Perris and the Principal Investigator for the CNR NANO unit was Giorgia Brancolini, serving as the Unit Leader. Other Italian partners involved in the project include the University of Ferrara (UniFe), and the University of Padua (UniPD). BC’s PhD project was funded through a stipend provided by Research Ireland (Grant No. GOIPG/2023/5034) and the Technological University of Dublin (First Time Supervisor Award). The funder had no role in the study design, data collection and analysis, decision to publish, or preparation of the manuscript.
Acknowledgments
GB acknowledges the funding by PRIN 2020 (Grant Nr. 2020LW7XWH). GB. and BC. acknowledge the CINECA award under the ISCRA initiative, for the availability of high-performance computing resources on Marconi100 and support. GB. acknowledges Oak Ridge National Laboratory by the Scientific User Facilities Division, Office of Basic Energy Sciences, U.S. Department of Energy is acknowledged for the supercomputing project CNMS2020-B- 00433. GB. acknowledges Facilities of the National Energy Research Scientific Computing Center (NERSC), which is supported by the Office of Science of the U.S. Department of Energy under Contract No. DE-AC02-05CH11231, are also acknowledged. BC and HL acknowledge the Irish Research Council under grant number GOIPG/2023/5034. BC and HL acknowledge the TU Dublin First Time Supervisor Award.
Conflict of interest
The authors declare that the research was conducted in the absence of any commercial or financial relationships that could be construed as a potential conflict of interest.
The author(s) declared that they were an editorial board member of Frontiers, at the time of submission. This had no impact on the peer review process and the final decision.
Generative AI statement
The author(s) declare that no Generative AI was used in the creation of this manuscript.
Publisher’s note
All claims expressed in this article are solely those of the authors and do not necessarily represent those of their affiliated organizations, or those of the publisher, the editors and the reviewers. Any product that may be evaluated in this article, or claim that may be made by its manufacturer, is not guaranteed or endorsed by the publisher.
Supplementary material
The Supplementary Material for this article can be found online at: https://www.frontiersin.org/articles/10.3389/fnano.2025.1603727/full#supplementary-material
References
Abraham, M. J., Murtola, T., Schulz, R., Páll, S., Smith, J. C., Hess, B., et al. (2015). GROMACS: high performance molecular simulations through multi-level parallelism from laptops to supercomputers. SoftwareX 1-2, 19–25. doi:10.1016/j.softx.2015.06.001
Agashe, M., Raut, V., Stuart, S. J., and Latour, R. A. (2005). Molecular simulation to characterize the adsorption behavior of a fibrinogen γ -chain fragment. Langmuir 9, 1103–1117. doi:10.1021/la0478346
Baimanov, D., Cai, R., and Chen, C. (2019). Understanding the chemical nature of nanoparticle protein interactions. Bioconjugate Chem. 30, 1923–1937. doi:10.1021/acs.bioconjchem.9b00348
Bekker, H., Berendsen, H. J. C., and Van Der Spoel, D. (1993). Gromacs: a parallel computer for molecular dynamics simulations. Phys. Comput. 92, 252–256.
Bewersdor, T., Glitscher, E. A., Bergueiro, J., Eravci, M., Miceli, E., Haase, A., et al. (2020). The influence of shape and charge on protein corona composition in common gold nanostructures. Mater. Sci. Eng. C 117, 111270. doi:10.1016/j.msec.2020.111270
Bloise, N., Strada, S., Dacarro, G., and Visai, L. (2022). Gold nanoparticles contact with cancer cell: a brief update. Inernational J. Mol. Sci. 23, 7683. doi:10.3390/ijms23147683
Brancolini, G., Bellucci, L., Maschio, M. C., Felice, R. D., and Corni, S. (2019a). The interaction of peptides and proteins with nanostructures surfaces: a challenge for nanoscience. Curr. Opin. Colloid Interface Sci. 41, 86–94. doi:10.1016/j.cocis.2018.12.003
Brancolini, G., Kokh, D. B., Calzolai, L., Wade, R. C., and Corni, S. (2012). Docking of ubiquitin to gold nanoparticles. ACS Nano 6, 9863–9878. doi:10.1021/nn303444b
Brancolini, G., Lopez, H., Corni, S., and Tozzini, V. (2019b). Low-resolution models for the interaction dynamics of coated gold nanoparticles with β2-microglobulin. Int. J. Mol. Sci. 20, 3866. doi:10.3390/ijms20163866
Brancolini, G., and Tozzini, V. (2019). Multiscale modeling of proteins interaction with functionalized nanoparticles. Curr. Opin. Colloid Interface Sci. 41, 66–73. doi:10.1016/j.cocis.2018.12.001
Cao, C., Zhang, L., Kent, B., Wong, S., Garvey, C. J., and Stenzel, M. H. (2021). The protein corona leads to deformation of spherical micelles. Angew. Chem. Int. Ed. 60, 10342–10349. doi:10.1002/anie.202101129
Dai, J., Chen, C., Yin, M., Li, H., Li, W., Zhang, Z., et al. (2023). Interactions between gold nanoparticles with different morphologies and human serum albumin. Front. Chem. 11, 1273388–15. doi:10.3389/fchem.2023.1273388
Dell’Orco, D., Lundqvist, M., Oslakovic, C., Cedervall, T., and Linse, S. (2010). Modeling the time evolution of the nanoparticle-protein corona in a body fluid. PLOS One 5, e10949–8. doi:10.1371/journal.pone.0010949
Dolinsky, T. J., Nielsen, J. E., Mccammon, J. A., and Baker, N. A. (2004). PDB2PQR: an automated pipeline for the setup of Poisson – Boltzmann electrostatics calculations. Nucleic Acids Res. 32, 665–667. doi:10.1093/nar/gkh381
Dykman, L., and Khlebtsov, N. (2012). Gold nanoparticles in biomedical applications: recent advances and perspectives. Chem. Soc. Rev. 41, 2256–2282. doi:10.1039/c1cs15166e
Erik, C., Dreaden, X. H., Alaaldin, M. A., and El-Sayed, M. A. (2012). The golden age: gold nanoparticles for biomedicine. Chem. Soc. Rev. 41, 2740–2779. doi:10.1039/c1cs15237h
Feng Ding, R. C., Slaven, R., Ke, P. C., Chen, P., Geitner, N. K., Brown, J. M., et al. (2013). Direct observation of a single nanoparticle–ubiquitin corona formation. Nanoscale 5, 9162–9169. doi:10.1039/c3nr02147e
Gabdoulline, R. R., and Wade, R. C. (1996). Effective charges for Macromolecules in solvent. J. Phys. Chem. 100, 3868–3878. doi:10.1021/jp953109f
García De La Torre, J., Huertas, M. L., and Carrasco, B. (2000). Calculation of hydrodynamic properties of globular proteins from their atomic-level structure. Biophysical J. 78, 719–730. doi:10.1016/S0006-3495(00)76630-6
Gkouvatsos, K., Papanikolaou, G., and Pantopoulos, K. (2012). Regulation of iron transport and the role of transferrin. Biochimica Biophysica Acta - General Subj. 1820, 188–202. doi:10.1016/j.bbagen.2011.10.013
Gomme, P. T., Mccann, K. B., and Bertolini, J. (2005). Transferrin: structure, function and potential therapeutic actions. Drug Discov. Today 10, 267–273. doi:10.1016/S1359-6446(04)03333-1
Hess, B., Bekker, H., Berendsen, H. J. C., and Fraaije, J. G. E. M. (1997). LINCS: a linear constraint solver for molecular simulations. J. Comput. Chem. 18, 1463–1472. doi:10.1002/(SICI)1096-987X(199709)18:12⟨1463::AID-JCC4⟩3.0.CO;2-H
Hoefling, M., Monti, S., Corni, S., and Gottschalk, K. E. (2011). Interaction of β -sheet folds with a gold surface. PLOS One 6, e20925. doi:10.1371/journal.pone.0020925
Hoover, W. G. (1985). Canonical dynamics: equilibrium phase-space distributions canonical dynamics: equilibrium phase-space distributions. Phys. Rev. A 31, 1965–1967. doi:10.1103/PhysRevA.31.1695
Iori, F., and Corni, S. (2008). Including image charge effects in the molecular dynamics simulations of molecules on metal surfaces. J. Comput. Chem. 29, 1656–1666. doi:10.1002/jcc.20928
Jurrus, E., Engel, D., Star, K., Monson, K., Brandi, J., Felberg, L. E., et al. (2018). Improvements to the APBS biomolecular solvation software suite. Protein Sci. 27, 112–128. doi:10.1002/pro.3280
Kokh, D. B., Corni, S., Winn, P. J., Hoefling, M., Gottschalk, K. E., and Wade, R. C. (2010). ProMetCS: an atomistic force field for modeling protein-metal surface interactions in a continuum aqueous solvent. J. Chem. Theory Comput. 6, 1753–1768. doi:10.1021/ct100086j
Lee, H. (2023). Differences in protein distribution, conformation, and dynamics in hard and soft coronas: dependence on protein and particle electrostatics. Phys. Chem. Chem. Phys. 25, 7496–7507. doi:10.1039/d2cp05936c
Lynch, I., Salvati, A., and Dawson, K. A. (2009). What does the cell see? Nat. Nanotechnol. 4, 546–547. doi:10.1038/nnano.2009.248
Martinez, M., Bruce, N. J., Romanowska, J., Kokh, D. B., Ozboyaci, M., Yu, X., et al. (2015). SDA 7: a modular and parallel implementation of the simulation of diffusional association software. J. Comput. Chem. 36, 1631–1645. doi:10.1002/jcc.23971
Matus, M. F., and Hakkinen, H. (2024). Rational design of targeted gold nanoclusters with high affinity to integrin αvβ3 for combination cancer therapy. Bioconjugate Chem. 35, 1481–1490. doi:10.1021/acs.bioconjchem.4c00248
Mcdonagh, B. H., Volden, S., Lystvet, S. M., Singh, G., Ese, M.-h. G., Ryan, J. A., et al. (2015). Self-assembly and characterization of transferrin–gold nanoconstructs and their interaction with bio-interfaces. Nanoscale 7, 8062–8070. doi:10.1039/c5nr01284h
Mohammad-Beigi, H., Hayashi, Y., Zeuthen, C. M., Eskandari, H., Scavenius, C., Juul-Madsen, K., et al. (2020). Mapping and identification of soft corona proteins at nanoparticles and their impact on cellular association. Nat. Commun. 11, 4535. doi:10.1038/s41467-020-18237-7
Monopoli, M. P., Åberg, C., Salvati, A., and Dawson, K. A. (2012). Biomolecular coronas provide the biological identity of nanosized materials. Nat. Nanotechnol. 7, 779–786. doi:10.1038/nnano.2012.207
Musicò, A., Zendrini, A., Reyes, S. G., Mangolini, V., Paolini, L., Romano, M., et al. (2025). Extracellular vesicles of different cellular origin feature distinct biomolecular corona dynamics. Nanoscale Horizons 10, 104–112. doi:10.1039/d4nh00320a
Nel, A. E., Mädler, L., Velegol, D., Xia, T., Hoek, E. M., Somasundaran, P., et al. (2009). Understanding biophysicochemical interactions at the nano-bio interface. Nat. Mater. 8, 543–557. doi:10.1038/nmat2442
Neupane, S., Pan, Y., Li, H., Patnode, K., Farmakes, J., Liu, G., et al. (2018). Engineering protein gold nanoparticle/nanorod complexation via surface modification for protein immobilization and potential therapeutic applications. ACS Appl. Nano Mater. 1, 4053–4063. doi:10.1021/acsanm.8b00839
Norde, W. (2008). My voyage of discovery to proteins in flatland …and beyond. beyond. Colloids Surfaces B Biointerfaces 61, 1–9. doi:10.1016/j.colsurfb.2007.09.029
Nose, S. (1984). A molecular dynamics method for simulations in the canonical ensemble. Mol. Phys. 52, 255–268. doi:10.1080/00268978400101201
Olsson, M. H. M., Søndergaard, C. R., Rostkowski, M., and Jensen, J. H. (2011). PROPKA3: consistent treatment of internal and surface residues in empirical pKa predictions. J. Chem. Theory Comput. 7, 525–537. doi:10.1021/ct100578z
Ozboyaci, M., Kokh, D. B., and Wade, R. C. (2016). Three steps to gold: mechanism of protein adsorption revealed by Brownian and molecular dynamics simulations. Phys. Chem. Chem. Phys. 18, 10191–10200. doi:10.1039/c6cp00201c
Penna, M. J., Mijajlovic, M., and Biggs, M. J. (2014). Molecular-level understanding of protein adsorption at the interface between water and a strongly interacting uncharged solid surface. J. Am. Chem. Soc. 136, 5323–5331. doi:10.1021/ja411796e
Picco, A. S., Capeletti, L. B., Cardoso, M. B., and Bettini, J. (2021). Inside the protein corona: from binding parameters to unstained hard and soft coronas visualization. Nano Lett. 21, 8250–8257. doi:10.1021/acs.nanolett.1c02416
Power, D., Rouse, I., Poggio, S., Brandt, E., Lopez, H., Lyubartsev, A., et al. (2019). A multiscale model of protein adsorption on a nanoparticle surface. Model. Simul. Mater. Sci. Eng. 27, 084003. doi:10.1088/1361-651X/ab3b6e
Pyne, A., Nandi, S., Ghosh, M., Roy, T., Dhara, S., and Sarkar, N. (2020). Denaturant-mediated modulation of the formation and drug encapsulation responses of gold nanoparticles. Langmuir 36, 7634–7647. doi:10.1021/acs.langmuir.0c01293
Ray, M., Brancolini, G., Luther, D. C., Jiang, Z., Cao-milán, R., Cuadros, A. M., et al. (2022). High affinity protein surface binding through co-engineering of nanoparticles and proteins. Nanoscale 14, 2411–2418. doi:10.1039/d1nr07497k
Robertson, M. J., Tirado-rives, J., and Jorgensen, W. L. (2015). Improved peptide and protein torsional energetics with the OPLS-AA force field. J. Chem. Theory Comput. 11, 3499–3509. doi:10.1021/acs.jctc.5b00356
Ronneberger, O., Tunyasuvunakool, K., Bates, R., Žídek, A., Ballard, A. J., Cowie, A., et al. (2021). Highly accurate protein structure prediction with AlphaFold. Nature 596, 583–589. doi:10.1038/s41586-021-03819-2
Rouse, I., and Lobaskin, V. (2021). A hard-sphere model of protein corona formation on spherical and cylindrical nanoparticles. Biophysical J. 120, 4457–4471. doi:10.1016/j.bpj.2021.09.002
Schenk, S., Schoenhals, G. J., Souza, G. D., and Mann, M. (2008). A high confidence, manually validated human blood plasma protein reference set. BMC Med. Genomics 1, 41. doi:10.1186/1755-8794-1-41
Shao, Q., and Hall, C. K. (2016). Protein adsorption on nanoparticles: model development using computer simulation. J. Phys. Condens. Matter 28, 414019. doi:10.1088/0953-8984/28/41/414019
Sheibani, S., Basu, K., Farnudi, A., Ashkarran, A., Ichikawa, M., Presley, J. F., et al. (2021). Nanoscale characterization of the biomolecular corona by cryo-electron microscopy, cryo-electron tomography, and image simulation. Nat. Commun. 12, 573. doi:10.1038/s41467-020-20884-9
Tenzer, S., Docter, D., Rosfa, S., Wlodarski, A., Rekik, A., Knauer, S. K., et al. (2011). Nanoparticle size is a critical physicochemical determinant of the human blood plasma corona: a comprehensive quantitative proteomic analysis. ACS Nano 5, 7155–7167. doi:10.1021/nn201950e
Theodore Peters, J. (1996). All about albumin: biochemistry, genetics, and medical applications. San Diego, CA: Academic Press.
Trinh, D. N., Gardner, R. A., Franciosi, A. N., Mccarthy, C., Keane, M. P., Soliman, M. G., et al. (2022). Nanoparticle biomolecular corona-based enrichment of plasma glycoproteins for N-glycan profiling and application in biomarker discovery. ACS Nano 16, 5463–5475. doi:10.1021/acsnano.1c09564
Varadi, M., Bertoni, D., Magana, P., Paramval, U., Pidruchna, I., Radhakrishnan, M., et al. (2024). AlphaFold Protein Structure Database in 2024: providing structure coverage for over 214 million protein sequences. Nucleic Acid Res. 52, 368–375. doi:10.1093/nar/gkad1011
Vilanova, O., Martinez-serra, A., Monopoli, M. P., and Franzese, G. (2025). Characterizing the hard and soft nanoparticle-protein corona with multilayer adsorption. Front. Nanotechnol. 6, 1–16. doi:10.3389/fnano.2024.1531039
Vilanova, O., Mittag, J. J., Kelly, P. M., Milani, S., Dawson, K. A., Rädler, J. O., et al. (2016). Understanding the kinetics of protein-nanoparticle corona formation. ACS Nano 10, 10842–10850. doi:10.1021/acsnano.6b04858
Vilaseca, P., Dawson, A., and Franzese, G. (2013). Understanding and modulating the competitive surface-adsorption of proteins through coarse-grained molecular dynamics simulations. Soft Matter 9, 6978–6985. doi:10.1039/c3sm50220a
Virtanen, P., Gommers, R., Oliphant, T. E., Haberland, M., Reddy, T., Cournapeau, D., et al. (2020). Scipy 1.0: fundamental algorithms for scientific computing in python. Nat. Methods 17, 261–272. doi:10.1038/s41592-019-0686-2
Wang, L., Li, J., Pan, J., Jiang, X., Ji, Y., Li, Y., et al. (2013). Revealing the binding structure of the protein corona on gold nanorods using synchrotron radiation-based techniques: understanding the reduced damage in cell membranes. J. Am. Chem. Soc. 135, 17359–17368. doi:10.1021/ja406924v
Wright, L. B., Rodger, P. M., Corni, S., and Walsh, T. R. (2013). GolP-CHARMM: first-principles based force fields for the interaction of proteins with Au(111) and Au(100). J. Chem. Theory Comput. 9, 1616–1630. doi:10.1021/ct301018m
Zhang, Y., and Skolnick, J. (2005). TM-align: a protein structure alignment algorithm based on the TM-score. Nucleic Acids Res. 33, 2302–2309. doi:10.1093/nar/gki524
Keywords: gold, nanoparticles, protein corona, docking, molecular dynamics, albumin, transferrin
Citation: Cipriani B, Lopez H and Brancolini G (2025) Distinct binding strategies of plasma proteins on gold surfaces: flexibility versus stability in the protein corona formation. Front. Nanotechnol. 7:1603727. doi: 10.3389/fnano.2025.1603727
Received: 31 March 2025; Accepted: 28 May 2025;
Published: 17 June 2025.
Edited by:
Alexandre Reily Rocha, São Paulo State University, BrazilReviewed by:
Marcelo Cardoso Dos Reis Melo, Colorado State University, United StatesGulyaim Sagandykova, Nicolaus Copernicus University in Toruń, Poland
Marcelo Yudi Icimoto, Federal University of São Paulo, Brazil
Copyright © 2025 Cipriani, Lopez and Brancolini. This is an open-access article distributed under the terms of the Creative Commons Attribution License (CC BY). The use, distribution or reproduction in other forums is permitted, provided the original author(s) and the copyright owner(s) are credited and that the original publication in this journal is cited, in accordance with accepted academic practice. No use, distribution or reproduction is permitted which does not comply with these terms.
*Correspondence: Giorgia Brancolini, Z2lvcmdpYS5icmFuY29saW5pQG5hbm8uY25yLml0