

 Wolfgang Stürzl
- Department of Neurobiology and Center of Excellence ‘Cognitive Interaction Technology’, Bielefeld University, Bielefeld, Germany
Honeybees visually pinpoint the location of a food source using landmarks. Studies on the role of visual memories have suggested that bees approach the goal by finding a close match between their current view and a memorized view of the goal location. The most relevant landmark features for this matching process seem to be their retinal positions, the size as defined by their edges, and their color. Recently, we showed that honeybees can use landmarks that are statically camouflaged, suggesting that motion cues are relevant as well. Currently it is unclear how bees weight these different landmark features when accomplishing navigational tasks, and whether this depends on their saliency. Since natural objects are often distinguished by their texture, we investigate the behavioral relevance and the interplay of the spatial configuration and the texture of landmarks. We show that landmark texture is a feature that bees memorize, and being given the opportunity to identify landmarks by their texture improves the bees’ navigational performance. Landmark texture is weighted more strongly than landmark configuration when it provides the bees with positional information and when the texture is salient. In the vicinity of the landmark honeybees changed their flight behavior according to its texture.
Introduction
Honeybees use prominent landmarks to visually pinpoint the location of a food source. Several studies on the role of visual memories have suggested, that bees like ants and wasps, accomplish their final approach to the goal by “snapshot matching” (review: Collett et al., 2006). This strategy is often pictured as a process involving three steps: stopping, comparing the current view with the memorized view at the goal, and then moving to increase the similarity between the views. But what do bees actually memorize of the visual scene around the goal?
Early studies demonstrated that the retinal positions of the landmarks and the size defined by their edges are relevant features for this matching process (Cartwright and Collett, 1983). In addition to these cues, honeybees also use the color of landmarks and even take their distance to the food source into account when finding their way back to a goal location (Cartwright and Collett, 1979, 1983; Cheng et al., 1986; Lehrer and Collett, 1994; Fry and Wehner, 2005). For feature extraction the L-receptor contrast is important, especially when the feature subtends only a small angle (<15°) on the honeybee’s eye (Giurfa et al., 1996, 1997; de Ibarra et al., 2001, 2002) and when the task requires motion detection (review Lehrer, 1994). A fairly new idea, which does not involve the extraction of any features or object identification (difficult in complex natural scenes), is the “global image matching” method (Zeil et al., 2003). Assuming that an insect somehow memorizes a panoramic image of the goal location, this information can be sufficient to guide its return to the goal as raw panoramic images implicitly contain all important static visual features (Stürzl and Zeil, 2007; Stürzl et al., 2008). Homing by global image matching works in natural scenes, and can explain the behavior of ants and crickets undertaking goal-finding tasks (e.g., Zeil et al., 2003; Mangan and Webb, 2009; Wystrach and Beugnon, 2009). The concept of matching static images has been challenged by our recent study. We showed that honeybees are able to navigate using statically camouflaged landmarks, i.e., under conditions in which an image matching approach would fail to guide the honeybees to their goal (Dittmar et al., 2010). The landmarks were detected by relative motion cues between the landmark and the background, which the bees generated when they performed characteristic flight maneuvers close to the landmarks. This finding implies that we should reconsider the concepts of static snapshot matching. Recent findings in ants suggest that they might use a more or less continuous mapping of image transformations during their return to a learned location (Harris et al., 2007; Lent et al., 2010; Wehner and Müller, 2010). The whole goal-finding process seems to be rather dynamic and determined by the insect’s interaction with its environment. It is unclear how bees choose and combine the different landmark features (static or dynamic) for a reliable localization and identification of the goal. The interaction and weighting of visual cues have been mainly analyzed in the context of pattern recognition and discrimination (review: Lehrer, 1994). From landmark studies it is clear that bees weight large and close landmarks more heavily than small and distant ones (Cheng et al., 1987). Objects very close (1 cm) to the goal location are treated like flowers, i.e., cues like their color are weighted more strongly and learned better than distant objects treated as landmarks even when they subtend the same visual angle (Lehrer, 1993). But when bees are trained with differently colored landmarks, the color is a relevant cue for goal localization and dominates the honeybees’ search (Cheng et al., 1986). In our earlier study we showed that the texture of landmarks did not play a role in goal localization when all landmarks had the same texture. Rather the honeybees used the spatial configuration of the landmarks enabling them to locate the goal even when the texture of all landmarks was changed between training and test (Dittmar et al., 2010).
It is still not known how we can integrate these different findings into a comprehensive understanding of homing behavior in bees, but all experiments so far show that bees pick the cue(s) necessary to solve the task. How do bees combine and weight different landmark cues when undertaking a navigational task? In which way does the selection and weighting depend on the cues themselves, i.e., on their saliency? In most studies, equal looking high-contrast black cylinders were used as landmarks, which did not provide any textural cues. In this case the retinal position of the landmarks and their edges (through luminance, color or motion contrast) are the major cues. Since natural objects are distinguished by their texture, and pattern cues like shape, edge orientation and symmetry have been shown to be relevant in pattern discrimination tasks (e.g., van Hateren et al., 1990; Srinivasan et al., 1993; Giurfa et al., 1996; review: Horridge, 2009), in this study we examined the role of landmark texture in goal localization. We asked whether the landmark texture plays a role if it provides the bees with positional information, i.e., telling them which of the landmarks is closest to the food source. We investigated the behavioral relevance and the interplay of the spatial configuration and the texture of landmarks by performing cue-conflict tests. The bees were tested with different salient landmark textures and we analyzed their navigational performance and flight behavior.
Materials and Methods
Experimental Procedures and Setup
Freely flying honeybees (Apis mellifera carnica) were trained to visit an indoor circular flight arena as described in (Dittmar et al., 2010) and to associate a food reward with a specific constellation of three cylinders. We used the same experimental setup as in a previous study (for details see Dittmar et al., 2010). Honeybees were trained to visit an inconspicuous perspex feeder surrounded by three cylinders with a height of 25 cm and a diameter of 5 cm. The cylinders, which we will refer to as landmarks, were placed at different distances to the feeder (10, 20, 40 cm), subtending angles of 120° to each other, as seen from the feeder (Figure 1A). During the training period the landmark closest to the feeder was covered with a different texture (called the “labeled landmark”) than the middle and the far landmark. This uniquely labeled landmark thus provided positional information to the honeybees. All patterns were printed on an inkjet printer. We conducted five experiments, with each a different texture as label (see Figure 1B). For each texture we determined the Michelson contrast (Mc) relative to the mean luminance of the background texture. In the first experiment, the label texture was the red homogenous texture (Mc = 0.6) and the other two landmarks were covered with the same random dot texture as was used for covering the arena wall and floor. To obtain the random texture a raw white-noise gray level image was blurred by convolution with a Gaussian convolution filter (sigma = 17.68 pixels). The blurred image was normalized to maximal contrast and the gray values were mapped to a red–white color map before printing. In the second experiment, we swapped the textures between landmarks, so that the near landmark had the random dot texture and the other two were homogeneously red. The random dot label texture was only distinguishable from the background by motion cues. To test the effect of a random dot texture that provides additional luminance contrast to the background, we conducted a third experiment with a high-contrast random dot texture (Mc = 0.14; for this texture the Mc was calculated between the mean luminance of the texture and the background) on the near landmark. The other two landmarks were again covered with a red homogenous texture. In the fourth experiment we used a horizontal stripe pattern as the label whereas the middle and far landmarks had a vertical stripe pattern, and in the fifth experiment this was reversed such that the labeled near landmark had vertical stripes and the other two had horizontal stripes [Mc (red stripe relative to the background) = 0.48; Mc (white stripe relative to the background) = 0.1]. The stripe width was always 1.6 cm. Bees are likely to resolve the differently striped landmarks from a distance smaller than 40 cm (distance between far landmark and feeder), as one stripe subtends an angle of 2.3° at a distance of 40 cm and the visual resolution of the bee’s compound eye has been behaviorally estimated to be in the range of 2–4° (Horridge, 2003).
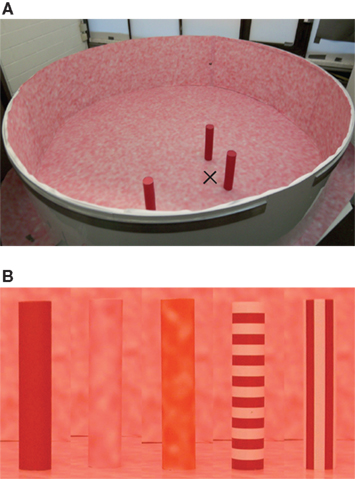
Figure 1. Honeybee flight arena. (A) Bees were trained to visit a perspex feeder (indicated by a black cross) surrounded by three landmarks (diameter of 5 cm, height of 25 cm) placed at different distances (10, 20, 40 cm) from the feeder. The circular flight arena (diameter of 1.95 m; height of 50 cm) was covered with a white curtain (removed for the picture), and indirect illumination was provided by artificial light sources positioned above and symmetrically around the arena. The arena floor and wall was covered with a random dot texture (see Materials and Methods for details). (B) Photographs of landmark cylinders covered with the five different label textures are shown (homogenous red, random dot, high-contrast random dot, horizontal and vertical stripe patterns). The landmark closest to the feeder seen in the right of picture (A) was labeled by such a unique texture.
Approach and test flights were recorded with two synchronized high-speed digital video cameras, one positioned above and one to the side of the flight arena, at 250 frames per second and with a spatial resolution of 1024 × 1024 pixels.
Training and Testing Procedure
We used a similar training procedure as in Dittmar et al. (2010). At the beginning of each experiment, naïve honeybees were trained stepwise to come to the perspex feeder surrounded by the three landmarks. To prevent the bees from relying on visual odometry to locate the feeder (Srinivasan et al., 2000; Esch et al., 2001; Tautz et al., 2004), the whole feeder and landmark configuration was shifted without rotation to four different positions in the arena. All visual cues that could have provided positional or directional information about the goal location, other than the cylinders, were carefully avoided – apart from the constant direction – from which the bees entered the arena, which could have been used as a directional cue (Fry and Wehner, 2002). Once the bees had learned to associate the reward (50% sugar solution) with the landmark configuration, individual bees were marked and we started recording of individual search flights. We recorded every second flight of each bee with the landmark-feeder configuration at the “filming position” right beneath the stereo camera system. For the next flight of this bee the feeder-landmark configuration was shifted to one of the three “non-recording positions” in the flight arena. This was done to prevent the bees from relying on visual odometry or any other visual cues than the landmarks (see above). After having recorded three training flights, testing started. Tests were interspersed every two to three training flights. During “control tests,” we removed the feeder and recorded the search flights as a reference for the navigation performance under training conditions. During cue-conflicting tests, we swapped the landmark texture between the near and the far landmark and also removed the feeder to test the influence of landmark texture cues. After a bee had entered the camera’s field of view, we recorded 16 s of the search flight. After this time, the recorded data were stored to hard disc, the landmark configuration was changed back to the training conditions and the feeder with sugar water was put back into the arena to provide a reward for the bee.
Data Analysis
The position of the bee and the orientation of her long-body axis were automatically determined in each frame of the two recorded image sequences with the aid of custom-built software (FlyTrace). We reconstructed the 3D position of the honeybee in the arena (for details see Dittmar et al., 2010). The 3D coordinates and the yaw body orientation were low-pass filtered with a second-order Butterworth filter (cut-off frequency of 20 Hz). To compare the spatial search distributions of bees under different test conditions, we calculated two-dimensional histograms of the time bees spent in one of 1024 3 × 3 cm fields in the field of view of the central camera. From the 3D position and the yaw orientation, we calculated the forward and sideways velocity with respect to the bee’s body axis and used the lift velocity in world coordinates (assuming pitch and roll to be zero). During training flights, the flight duration from the bee entering the arena until landing on the feeder was measured manually with a stop watch. By visual inspection of the video footage, we determined which landmark the honeybees approached first in the control and cue-conflicting tests.
Results
The Role of Landmark Texture in Goal Localization
Honeybees used the spatial configuration of landmarks for goal localization when the three landmarks had the same texture. This was shown in our earlier study where we exchanged the texture of all three landmarks between return flights from red to the same pattern that covered the rest of the flight arena. This change did not reduce the honeybees’ navigational performance, suggesting that the bees had used the spatial positions of the landmarks while largely ignoring texture cues. Furthermore, as the new texture did not provide contrast cues against the background, the bees must have used mainly motion parallax cues for goal localization (Dittmar et al., 2010). In the current study, we explore the role of spatial and textural cues when the landmark texture provides position information to the bees. Honeybees were trained to find the feeder in relation to three landmarks, where the near landmark had a unique texture (a “label”).
Navigational performance with one uniquely textured landmark providing position information
If the bees could identify the nearest landmark of three by pattern cues, it took them less time to locate the feeder than under conditions where all landmarks had the same texture (see Figure 2, Kruskal–Wallis test p < 0.05). However, the navigational performance depended on the kind of landmark texture, as it increased when the label was either the random dot pattern (no labeled landmark and random texture: p < 0.05, Wilcoxon rank-sum test), the high-contrast random dot pattern (no labeled landmark and high-contrast random texture: p < 0.05), or the red texture (no labeled landmark and red texture: not significant). With the horizontal and the vertical stripe label, the honeybees spent more time searching than with the random dot, the high-contrast random dot and the homogeneous red patterns (Figure 2). However, this does not imply that they searched broadly around the landmarks (see below). Particularly with the stripe patterns and the red homogenous landmark label, the honeybees searched very accurately at the correct position (compare Figure 4A), but spent more time flying close to the labeled landmark before they landed on the feeder than for the red and random label conditions (Figure 2).
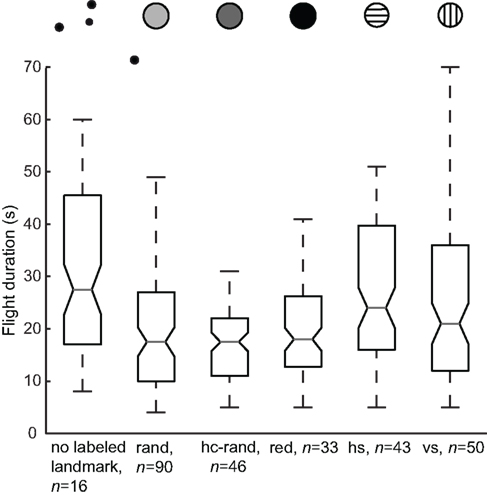
Figure 2. Navigational performance with different landmark textures. The search time was measured from the moment a bee entered the arena until it landed on the feeder. This time is an indicator of the bee’s navigational performance. The box plots allow us to compare the median flight duration for all training flights between the different conditions: with no labeled landmark (all cylinders have a homogenous red texture, n = 16, N = 6) and with a labeled landmark, where the cylinder closest to the feeder has a unique texture [random dot pattern (rand, n = 90, N = 20), high-contrast random dot pattern (hc rand, n = 46, N = 10), red homogenous texture (red, n = 33, N = 8), horizontal (hs, n = 43, N = 10) and vertical (vs, n = 50, N = 9) stripe patterns]. The central mark is the median; the edges of the box are the 25th and 75th percentiles. The plotted whisker extends to the adjacent value, which is the most extreme data value that is not an outlier. Outliers (any data point more than 1.5× IQR (interquartile range) lower than the first quartile or 1.5× IQR higher than the third quartile) are not shown. The width of the notches is computed in such a way that the box plots, whose notches do not overlap, have different medians at the 5% significance level.
Conflicting tests between the spatial configuration and the texture of the landmarks
In cue-conflicting tests, we investigated whether the bees mainly used the spatial configuration of the landmarks for localizing the feeder or whether they relied mainly on the landmark closest to the feeder, which was distinguished by its texture. By exchanging the texture between the near and the far landmark, we provided the bees with a conflicting situation. If they use the spatial configuration of the three landmarks, they would continue to search close the goal location. But if they rely on the landmark texture, they would start to search at a location close to the far landmark and not at all close to the goal location defined by the landmark configuration. When the landmark close to the feeder provided unique pattern cues, the search distribution was centered on this landmark (Figures 3A,C). After the label texture was put on the far landmark, the bees searched around the far landmark, suggesting that they had used texture cues to uniquely identify the landmark that was closest to the feeder during training (Figures 3B,D). Note that with the red texture label, the bees even searched on the correct side of the far landmark, which indicates that they have used the constant entrance position of the arena as a directional cue. Independent of the kind of pattern used as the label texture, the honeybees searched close to the far landmark when it was labeled as if it were the near landmark (Figure 4B). The bees relied most strongly on the landmark texture when the landmark was labeled with the homogenous red color (Figures 3A,B), and the horizontal and vertical stripe pattern (Figures 4A,B). They spent significantly more time searching close to the far landmark when it was labeled in the test situation and approached this landmark first in the case of the red and horizontal stripe texture (80%, n = 6 and 71%, n = 7 of the test flights; Figure 4B). The effect is slightly weaker when the vertical stripe pattern is used as the label. With the vertical stripe label the bees spend more time searching close to the far landmark when it is labeled as the near landmark (not significant, Figure 4B), but the search is more distributed and includes the other landmarks as well (data not shown). They approached the far landmark in 57% (n = 7) of the test flights and in 43% (n = 7) the near landmark of the test flights (without the label texture). This indicates that the landmark texture plays the major role in goal localization, but the spatial configuration is taken into account as well. With the low and high-contrast random pattern used as the label texture, the configuration of the landmarks played a much greater role in localizing the feeder (Figures 4A,B). When the near landmark was covered with the low or the high-contrast random pattern, the bees did not focus only on the labeled landmark, but searched in addition close to the other landmarks (compare Figures 3C and 4A). After the exchange of landmark texture, the bees continued to search close to the goal location and to the near landmark (Figures 3D and 4B). But they also spent time searching close to the far landmark, indicating the additional use of the texture (Figure 4B). This is also reflected in the order the bees approached the landmarks. Only 30% (n = 17 low contrast random pattern; n = 10 high-contrast random pattern) of the bees approached the far landmark first. The major part flew first to the near or the middle landmark and then searched at the correct spatial location relative to the three landmarks. Honeybees thus use landmark texture for goal localization if it provides them with position information. Nevertheless the type of pattern determines how strongly they rely on the landmark texture versus the overall landmark constellation.
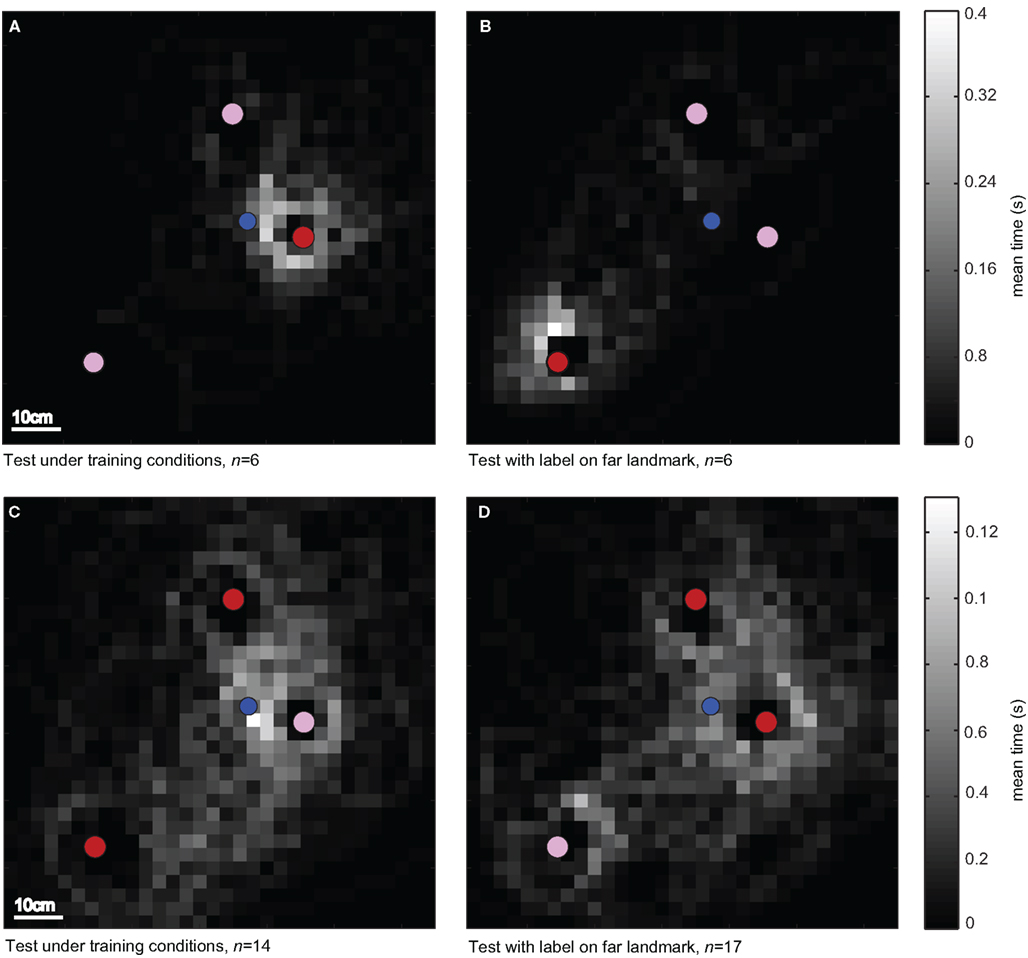
Figure 3. Spatial search distributions with a red homogenous texture and a random dot pattern labeling the near landmark. To compare the search distributions of bees for the different test conditions, we calculated two-dimensional histograms of the time bees spent in one of 1024 3 × 3 cm fields in the field of view of the top camera. The bees’ search behavior was recorded under training conditions (A,C) with the feeder removed; each bee was tested once or twice. The landmark closest to the feeder (blue dot) was either (A) homogenously red (red dot) and the other two landmarks were covered with a random dot texture (n = 6 flights; N = 5 bees) or (C) had a random dot pattern (rose dot, n = 14 flights, N = 11 bees) and the other two were homogenously red. During cue-conflicting tests (B,D), the landmark texture was exchanged between the near and the far landmark (feeder removed) to test the influence of landmark texture on the search location [(B), n = 6 flights, N = 5 bees; (D), n = 17 flights, N = 12 bees].
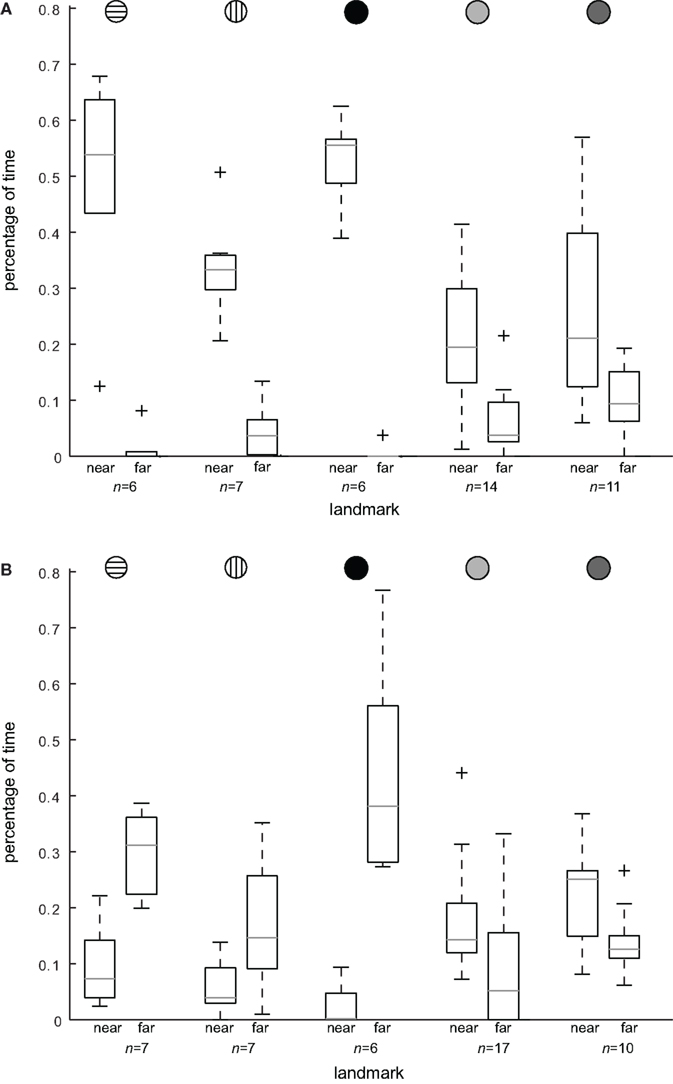
Figure 4. Search location dependent on landmark texture. To compare the effect of swapping the label texture between the landmark nearest to and farthest from the feeder, we calculated the percentage of the total search time that bees spent within an area of 150 mm around the center of the near and the far landmark, respectively. This percentage of time is plotted in (A) for the control test (“C,” label texture on near landmark) and in (B) for the conflicting test (“CF,” label texture on far landmark) and also in each case for the different textures in this order from left to right (see also inset), horizontal stripes [n(C) = 6 flights, N(C) = 6 bees; n(CF) = 7, N(CF) = 7], vertical stripes [n(C) = 7, N(C) = 6; n(CF) = 7, N(CF) = 7], red homogeneous texture [n(C) = 6, N(C) = 5; n(CF) = 6, N(CF) = 5], random dot pattern [n(C) = 14, N(C) = 11; n(CF) = 17, N(CF) = 12] and high-contrast random dot pattern [n(C) = 11, N(C) = 10; n(CF) = 10, N(CF) = 10]. The search times close to the near and the far landmark are significantly different for all textures in [(A), p < 0.05, Wilcoxon rank-sum test]. With the label texture swapped, bees spent significantly more time searching close to the far landmark than close to the near landmark when the label is homogeneous red or horizontal stripes (p < 0.05, Wilcoxon rank-sum test). For the vertical stripe pattern condition we find a similar tendency (p > 0.05). With the random patterns as label textures, the bees’ search time is slightly increased close to the far landmark, but the bees keep mainly searching close to the near landmark (with the wrong label), and thus mainly search according to the spatial configuration of the three landmarks (p < 0.05). Outliers are marked by a cross (for details see Figure 2).
The Structure of Flight Behavior During the Approach of the Food Source
Honeybees approached the goal location in different ways (Figures 5A,C). One kind of movement sequence we often observed is shown in Figure 5C. The bee approaches the labeled landmark more or less directly while keeping it in the frontal field of view. When close to the near landmark the bee performs a sideways shift to the right. In this way, the bee gets close to the feeder location. We often observed a second movement sequence used by bees to reach the feeder location (Figure 5A). It comprises passing the middle landmark on the right side, fixating the far landmark, turning left to the near landmark and then approaching it by keeping it in the frontal field of view. Close to the near landmark, the honeybees often perform distinct lateral flight maneuvers (“scanning,” see Figures 5A,C).
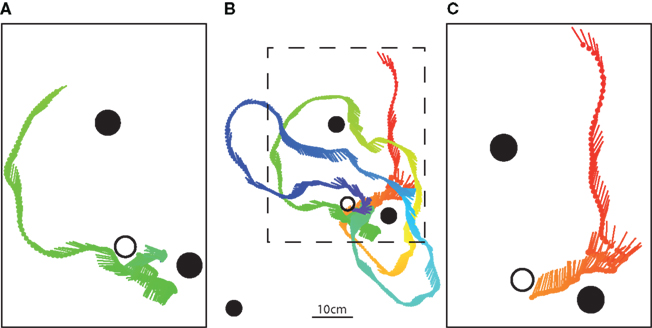
Figure 5. Different movement sequences to approach the goal location. The middle panel (B) shows a top view of an example flight trajectory during training with the feeder present (black open circle). This was the ninth recorded flight of this bee. The near landmark was covered with a horizontal stripe pattern whereas the other two landmarks were covered with the vertical stripe pattern. The position of the bee is indicated by circles at 16 ms intervals with lines indicating the orientation of the long axis of the bee; the color ranges from red–yellow–green–blue to illustrate the time course. (A,C) Show magnified parts of this search flight, which consist of landmark fixation, turning, and sideways flight maneuvers, which are often observed during approach.
General flight maneuvers close to the near landmark
Independent of the sequence of movements bees used to reach the labeled landmark, we observed them performing special maneuvers close to this landmark, which depended in detail on the texture label (see below). In general, the maneuvers close to the near landmark were characterized by a reduced forward velocity (from about 0.24 m/s (median for all flights) to about 0.1 m/s, see Figure 6A), with the most distinct flight maneuvers occurring with the two stripe patterns (see Figures 6B,C), resulting in the lowest forward velocity of all conditions (Figure 6A). Close to the landmark, the bees flew not only slowly but sometimes even backwards (Figure 6A). These flight maneuvers might serve to adjust the retinal size of the landmark (Cartwright and Collett, 1983). In addition they also performed sideways and up- and downwards movements (see below). The power spectrum of the oscillations in the sideways and lift velocity reveal high power in the low frequency range of 1–3 Hz (Figures 7A,B). These low-frequency components occur for example in the sideways velocity when the bees perform large lateral maneuvers in front of the landmark, which cover more than the width of the landmark (compare Figures 7A and 5A,B).
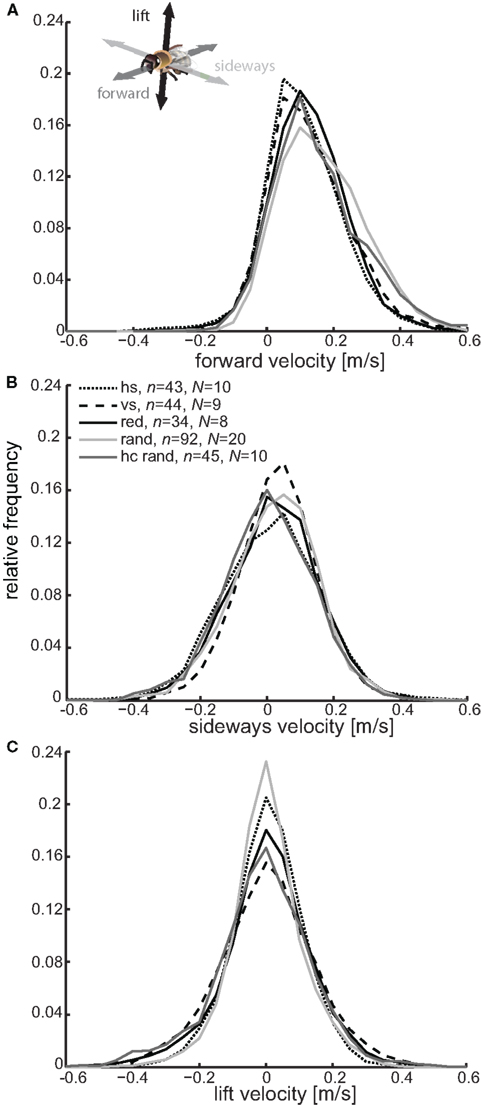
Figure 6. Flight velocity close to the differently textured landmarks. The relative frequency histograms (bin size of 0.05 m/s) for the forward (A), sideways (B) and lift (C) velocity for flights during training are shown for the different textures [horizontal stripes (dotted line, n = 43 flights, N = 10 bees), vertical stripes (dashed line, n = 44, N = 9), red (solid line, n = 34, N = 8), random dot pattern (light gray line, n = 92, N = 20) and the high-contrast random dot pattern (dark gray line, n = 45, N = 10)]. Only those parts of the flights where the bee was closer than 100 mm to the center of the labeled near landmark were taken into account. The proportion of time that bees fly with different velocities depends on the kind of landmark texture.
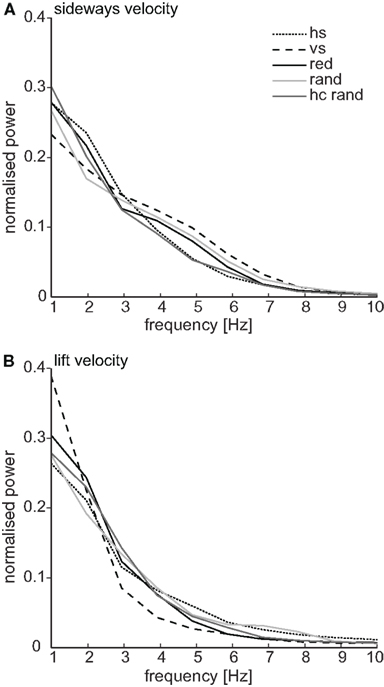
Figure 7. Power spectra for sideways and lift velocity. Mean power spectra of the sideways (A) and lift (B) velocity normalized to the mean square amplitude are shown. For each part of a flight trajectory with a minimal length of 1024 ms where the bee was close (<100 mm) to the center of the labeled near landmark, the mean velocity (sideways or lift) was subtracted and the power spectrum of the respective velocity was calculated, normalized the area to unity and then averaged over all parts (hs n = 48, vs n = 30, red n = 38, rand n = 18, hc rand n = 19). For each landmark texture the normalized power spectrum is shown (for glossary and numbers of flights and bees see Figure 6). The dominant frequencies for the sideways and lift velocities are in the low-frequency range independent of the kind of texture. The medium power in the range of 4–6 Hz in the sideways velocity reveals a second prominent frequency component in the sideways movements of the bees.
The fine structure of flight behavior depends on landmark texture
Interestingly, the bee’s detailed flight behavior is different for the different landmark textures. In order to describe these flight maneuvers, we compare the amount of time the bees flew forward, sideways or up and down in front of the landmarks, the velocity combinations and the dominant frequencies of the sideways and up and downward directed scanning behavior.
Striped landmarks. The most obvious differences occur between the differently oriented stripe patterns – the bees seemed to follow the contours of the stripes. A similar contour following has been already described by Lehrer et al. (1985) for bees in a pattern discrimination task. It is, however, interesting that it also occurs during a landmark navigation task. When flying close to the landmark with horizontal stripes, the bees performed mostly sideways directed flight maneuvers indicated by the broadest shape in the sideways velocity distribution amongst the different textures (Figure 6B). The bees flew up and downwards less when close to the horizontally striped than when close to the vertically striped landmark, indicated by the narrow peak around zero in the lift velocity distribution [Figure 6C, Kolmorgorov–Smirnov test, k (maximum difference between cumulative distribution) = 0.086, p < 0.001]. The flight is further characterized by pure sideways flight maneuvers with low forward and lift velocity (Figures 8A,C).
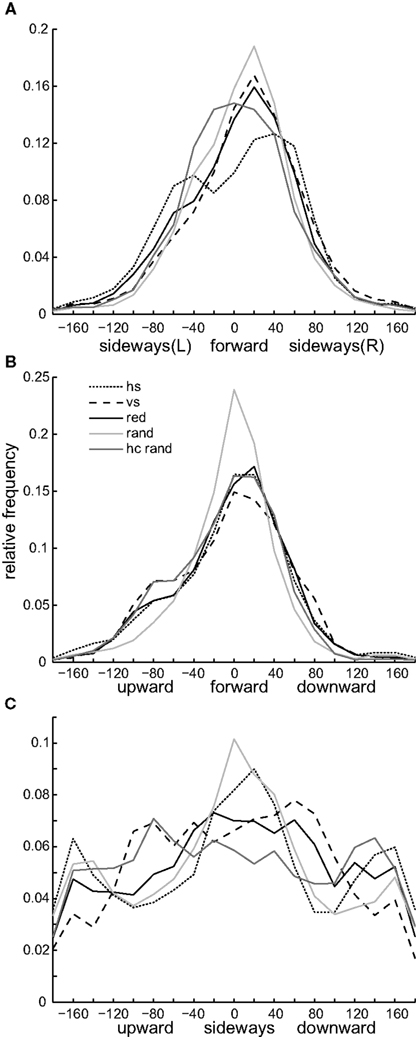
Figure 8. Flight velocity combinations close to the labeled landmarks. To compare flight velocity combinations for different landmark textures (for glossary and numbers see Figure 6), we calculated the angle of the sideways/forward (A), lift/forward (B) and lift/side velocity vectors (C) for those parts of the flight trace where the bee was closer than 100 mm to the center of the labeled landmark at each point of time. The histograms show the relative frequency for the different flight velocity combinations (bin size of 20°). An angle of zero degrees means that the bee is flying only forward in (A) and (B) or sideways [to the right in (C)] without any sideways (A) or lift component (B,C). An angle of ±90° indicates that the bee is flying sideways [to the right (R) or to the left (L)] without any forward component in (A), or only up- and downwards without any forward in (B) or sideways velocity component in (C). The amount of time honeybees fly in different velocity combinations depends on the kind of landmark texture.
In contrast, when flying close to the vertically striped landmark, the bees often followed the vertical contours and showed thus the reverse flight behavior, indicated by the broad shoulders in Figure 8B and the narrow peak in Figures 8A and 6B (comparison between sideways velocity for horizontal and vertical stripe pattern, Kolmorgorov–Smirnov test, k = 0.1, p < 0.001). Interestingly, the sideways distribution for the vertical stripes shows the largest asymmetry amongst the different conditions, which means that the bees performed more movements to the right than to the left from their perspective (Figure 6B). This could be due to the frequent approach strategy (shown in Figure 5C), during which the bees performed a large sideways shift to the right to reach the feeder position. This effect is not as strong with the horizontally striped landmark texture, in front of which they performed sideways movements to the right and left, which presumably compensate for the asymmetry (see Figure 6B). Close to the vertically striped pattern the bees often flew with high lift velocity (Figure 6C). They flew equally up and down close to the landmark (Figure 6C, compare also Figure 8C). That these maneuvers are scanning maneuvers in the vertical direction is further supported by the high power of low-frequency components in the lift velocity (Figure 7B).
Red landmark. Honeybees trained with the red homogenous texture labeling the near landmark do not show the tendency to perform the mostly laterally or vertically directed scanning movements we described for the horizontally and vertically striped landmark conditions above. The sideways and lift velocity histograms are broad, indicating that they had no preferred movement direction when flying close to the red landmark (Figures 6B,C). This raises the question of whether they performed only sideways or lift maneuvers or if they performed movements composed of different velocities. The probability distributions for combinations of the different velocities show that they flew frequently with combinations of forward, sideways and lift velocity (compare broad curves in Figures 8A–C). This finding does not imply that they did not perform distinct sideways or up- and downwards movements. Flying close to the red landmark, the bees also flew rather sideways than forward and up- or downwards (compare Figures 8A,C). They also performed flight maneuvers which mainly contained vertical rather than forward or sideways components (see high density around ±90° in Figures 8B,C).
Random patterned landmarks. One might think that bees would perform more sideways movements in front of the random dot texture than they did in front of the other textures since the random dot texture did not provide contrast cues against the background but could only be detected by relative motion between the landmark and background during translational motion. This occurs for example when the bees’ gaze is directed towards the landmark while flying sideways or when the landmark is in the lateral field of view while flying forward. Interestingly, the bees did not perform more sideways movements. We find only slight differences in the sideways velocity distribution for the random and the red texture (Figure 6B, Kolmorgorov–Smirnov test, k = 0.0228, p < 0.001). However, bees trained with the random dot texture performed less compound flight maneuvers when flying close to this landmark. Their forward flight did not include large sideways or lift components (Figures 8A,B), and when flying sideways they did this without flying up or downwards (Figure 8C). Forward or sideways flight maneuvers under this condition are thus relatively “pure” and do not contain lift components. Sideways flight without any lift component also occurred when the bees were confronted with the horizontally stripes pattern, but the separation between sideways motion and lift was stronger with the random dot pattern, and the separation between lift and forward motion only occurred with this landmark texture (Figure 8B). When the high-contrast random dot texture, which provided contrast cues against the background, was used as a label, the bees’ flight behavior became similar to that under the red texture condition (compare Figures 6A–C). However, some small differences in the sideways and lift velocity remain, e.g., flying more upwards and sideways (Figures 8B,C). This might be due to textural cues that provide horizontal and vertical contours on the landmark.
Discussion
Our experiments show that landmark texture is a feature that bees memorize and use for goal localization. The navigational performance of honeybees is increased when textural cues on landmarks make them individually distinguishable. The bees took less time in localizing a feeder in relation to three landmarks when they were able to identify the landmark that was closest to the goal by its unique texture label. They searched close to the assumed feeder location defined by the landmark with the texture label even when its position in the landmark array was changed between training and test. How strongly the bees relied on the landmark texture versus the overall landmark constellation, and which flight maneuvers they performed depended on the type of pattern.
Weighting of Cues for Goal Localization
Textural cues are weighted more strongly than the spatial configuration of landmarks when they provide the bees with positional information and when the texture is salient (compare Dittmar et al., 2010). The finding that bees search close to the landmark labeled as being the nearest to the feeder is in agreement with earlier studies where it was shown that honeybees weight large and close landmarks that are distinguishable by their color more strongly than small and distant ones (Cheng et al., 1987). The fact that bees learn different cues in different situations, depending on the task set by the experimenter, is known from several studies on pattern discrimination. They use the cue that guides them most reliably to the goal (review: Lehrer and Collett, 1994). In the landmark navigation task, we find that the weighting of landmark texture depends not only on the task but also on the saliency of the cue, i.e., the landmark texture itself. We identified some label textures that affect more strongly the search behavior of the bees and thus are more salient than others. The displacement of a landmark with a salient label texture strongly determines the search location of the bees (see Figure 4). However, if there is no salient pattern provided by the labeled landmark (e.g., the random texture), the honeybees will localize the goal based on the relative positions of the landmarks (as in Dittmar et al., 2010). In this sense saliency does not equal pattern contrast or navigational performance. Highly salient patterns strongly determine the search location of the bees but they do not necessarily lead to shorter search times (e.g., the stripe patterns). However, a high contrast seems to be one feature that characterizes a salient label texture (e.g., the homogenous red texture), but it seems to be as well important that the label texture is easy to discriminate from the textures presented on the other landmarks (e.g., the stripe patterns). From our experiment with the high-contrast random dot label texture we conclude that both criteria have to be fulfilled. When the red (high-contrast) random texture on the near landmark provides a high contrast to the background, we find that the landmark texture has only a small influence on the search location, presumably because it is more similar to the homogeneously red texture on the middle and far landmark. In contrast, landmarks with differently oriented stripe patterns seem to be highly salient. Bees can easily distinguish between horizontal and vertical stripes in pattern discrimination tasks (Lehrer et al., 1985; van Hateren et al., 1990). Interestingly, the effect of the landmark texture is slightly stronger when the label is the horizontal than the vertical stripe pattern. Earlier work reported that gratings are more attractive when their contour density is higher (Anderson, 1977). Our striped landmarks differed not only in the pattern orientation but also in their absolute number of stripes. From a given vantage point the horizontal stripe pattern offered more contrast changes than the vertical one, which might have caused the bees to weight the landmark with the horizontal label more strongly in our experiments.
Possible Mechanisms Underlying Navigational Control
Can we explain the bees’ navigation behavior we described in our experiments with existing navigation models, e.g., image matching or our recently supposed optic flow matching (Dittmar et al., 2010)? Image matching implicitly takes all static features like the color and the texture of the landmark into account (Zeil et al., 2003). To test if image matching can explain the search behavior of the bees, we have calculated the image similarities (compare Dittmar et al., 2010) between the image that would be memorized at the goal location and images taken at different positions in the flight arena (data not shown). The resulting maps show high similarity around the landmark with the label texture independent of its position in the landmark array – which is in agreement with the search behavior described here. This is not a surprising result, because the closest landmark covers about 30° of the horizontal visual field when seen from the feeder and the image at the feeder contains all static features (see above). However, when the near landmark is labeled with the same random texture as the background, image matching fails because such a landmark is not distinguishable from the background in a static image (Dittmar et al., 2010). We find that the landmark label effect is not as strong with the random dot texture as with the other label textures, but the bees still search close to the landmark labeled with the random dot texture when it is in the far position, and do not only search close to the remaining high-contrast landmarks. As described in our earlier study, the bees seem to use motion cues to detect these landmarks (“optic flow matching,” Dittmar et al., 2010). The relevance of motion cues has been shown in various behavioral tasks, e.g., for shape discrimination and distance estimation (e.g., Zhang and Srinivasan, 1994; Zhang et al., 1995; Srinivasan and Zhang, 2004; Lehrer and Campan, 2005). Depending on pattern properties, the time-dependent output of motion-sensitive neurons is strongly modulated by the features of a pattern moving across the cell’s receptive field (e.g., Egelhaaf and Borst, 1993; Kurtz et al., 2009). Thus, an optic flow snapshot matching scheme could possibly capture different landmark textures. We plan to further test our optic flow matching scheme for different landmark conditions, integrating findings on the underlying neuronal circuitry for motion detection in bees.
The Consequences of the Flight Behavior on the Visual Input
Close to the landmarks used in our experiments, the honeybees performed distinct flight maneuvers. Are these flight maneuvers part of the localization process, helping object detection and distance estimation? Flight behavior close to a landmark is characterized by slow forward and sometimes even backward flight velocities, which might serve to adjust the retinal size of the landmark during goal localization. In addition, bees also perform sideways movements that may be interpreted as scanning maneuvers to gain parallax information about the environment. We find that these oscillations in the lateral velocity have a low-frequency component at 1–3 Hz. These occur when the bees perform large lateral maneuvers in front of the landmark, which cover more than its width. We also see scanning maneuvers at a higher frequency range of 4–6 Hz. These high-frequency lateral movements of bees approaching a feeder have been described in an earlier study (Boeddeker and Hemmi, 2010). The sideways maneuvers occur between saccadic turns that are characteristic of insect flight (e.g., Schilstra and van Hateren, 1999; van Hateren and Schilstra, 1999; Dittmar et al., 2010), when the bees’ head orientation is stabilized against yaw and roll rotations (Boeddeker and Hemmi, 2010; Boeddeker et al., 2010). The resulting translational optic flow field contains depth information and enables the bees to detect camouflaged objects and provides them with distance information about the landmarks. Interestingly, under conditions in which the landmark had the same random texture as the background and was only detectable by motion cues, we did not find that the honeybees performed more sideways movements. This might not be surprising when we take into account the fact that the bees spent about 40% of their time in flight maneuvers with a large sideways component when trained with three high-contrast landmarks. However, in the random texture condition the bees performed rather “pure” forward and sideways flight maneuvers without any lift components. The random textured landmarks do not provide high-contrast vertical contours. This might induce less contour following than when the landmarks and the texture itself provide strong vertical contours.
We show that the honeybees perform different flight maneuvers depending on the landmark texture. Are these flight maneuvers involved in object identification and pattern discrimination? The bees’ scanning behavior in front of gratings was extensively studied in pattern recognition or discrimination tasks by Lehrer (Lehrer et al., 1985; Lehrer, 1994). We find that even during a localization task honeybees show contour following when flying close to the striped landmarks. Lehrer reported that the scanning behavior occurred spontaneously and did not improve the discrimination performance and thus, seems not to be necessary for pattern identification or discrimination (Lehrer et al., 1985). This becomes obvious in y-maze experiments, where the bee’s actual decision to fly to the rewarded pattern, takes place before they scan the pattern. This is in agreement with our results, as we observed the bees directly approaching the far landmark with the label texture – before the distinct flight maneuvers close to the landmark occur. However, the movements might still serve as a form of motor learning. The amount of vertical or horizontal scanning seems to be slightly influenced by prior training (Lehrer et al., 1985). When confronted with different moving gratings honeybees changed their flight pattern during training (Erber, 1982). In navigation experiments the importance of learned motor commands was shown for bees and ants (e.g., Collett et al., 1993; Fry and Wehner, 2005; Lent et al., 2009). We observed that the bees have different ways to approach the goal location. The flight paths seem to be composed of several movement sequences. Lent et al. (2009) have recently highlighted the role of motor commands associated with landmark edges when ants approach a food source. In the future, it will be interesting to further investigate the role of learned motor sequences and their association with visual cues during homing tasks.
Conclusion
The behavioral relevance of visual information for goal localization depends on the task and the saliency of the features. Bees weight textural cues stronger than spatial position cues under conditions in which the textural cues are salient and provide them with position information. Honeybees perform flight maneuvers which depend on the texture of the landmark that might be related to pattern discrimination rather than the goal localization. In the future it will be interesting to further decompose the honeybees’ navigation flight behavior and to identify a functional relationship between distinct flight maneuvers and the localization process or other relevant tasks as object identification and spatial exploration.
Conflict of Interest Statement
The authors declare that the research was conducted in the absence of any commercial or financial relationships that could be construed as a potential conflict of interest.
Acknowledgments
We thank Laura Hartman, Marcel Mertes, Daniel Kress and Grit Schwerdtfeger for their assistance with the experiments and the video analysis, and Nils Hasenbein and Ulrich Zumkier for bee keeping. Financial support came from the DFG. Laura Dittmar was funded by the Studienstiftung des deutschen Volkes.
References
Anderson, A. M. (1977). Parameters determining attractiveness of stripe patterns in honey bee. Anim. Behav. 25, 80–87.
Boeddeker, N., Dittmar, L., Stürzl, W., and Egelhaaf, M. (2010). The fine structure of honeybee head and body yaw movements in a homing task. Proc. Biol Sci. 277, 1899–1906.
Boeddeker, N., and Hemmi, J. M. (2010). Visual gaze control during peering flight manoeuvres in honeybees. Proc. R. Soc. Lond. B Biol. Sci. 277, 1209–1217.
Cartwright, B. A., and Collett, T. S. (1979). How honeybees know their distance from a near-by visual landmark. J. Exp. Biol. 82, 367–372.
Cartwright, B. A., and Collett, T. S. (1983). Landmark learning in bees – experiments and models. J. Comp. Physiol. 151, 521–543.
Cheng, K., Collett, T. S., Pickhard, A., and Wehner, R. (1987). The use of visual landmarks by honeybees – bees weight landmarks according to their distance from the goal. J. Comp. Physiol. A 161, 469–475.
Cheng, K., Collett, T. S., and Wehner, R. (1986). Honeybees learn the colors of landmarks. J. Comp. Physiol. A 159, 69–73.
Collett, T. S., Fry, S. N., and Wehner, R. (1993). Sequence learning by honeybees. J. Comp. Physiol. A 172, 693–706.
Collett, T. S., Graham, P., Harris, R. A., and Hempel-De-Ibarra, N. (2006). Navigational memories in ants and bees: memory retrieval when selecting and following routes. Adv. Study Behav. 36, 123–172.
de Ibarra, N. H., Giurfa, M., and Vorobyev, M. (2001). Detection of coloured patterns by honeybees through chromatic and achromatic cues. J. Comp. Physiol. A 187, 215–224.
de Ibarra, N. H., Giurfa, M., and Vorobyev, M. (2002). Discrimination of coloured patterns by honeybees through chromatic and achromatic cues. J. Comp. Physiol. A 188, 503–512.
Dittmar, L., Stürzl, W., Baird, E., Boeddeker, N., and Egelhaaf, M. (2010). Goal seeking in honeybees: matching of optic flow snapshots? J. Exp. Biol. 213, 2913–2923.
Esch, H. E., Zhang, S. W., Srinivasan, M. V., and Tautz, J. (2001). Honeybee dances communicate distances measured by optic flow. Nature 411, 581–583.
Fry, S. N., and Wehner, R. (2002). Honey bees store landmarks in an egocentric frame of reference. J. Comp. Physiol. A 187, 1009–1016.
Fry, S. N., and Wehner, R. (2005). Look and turn: landmark-based goal navigation in honey bees. J. Exp. Biol. 208, 3945–3955.
Giurfa, M., Eichmann, B., and Menzel, R. (1996). Symmetry perception in an insect. Nature 382, 458–461.
Giurfa, M., Vorobyev, M., and Brandt, R. (1997). Discrimination of coloured stimuli by honeybees: alternative use of achromatic and chromatic signals. J. Comp. Physiol. A 180, 235–243.
Giurfa, M., Vorobyev, M., and Kevan, P. (1996). Detection of coloured stimuli by honeybees: minimum visual angles and receptor specific contrasts. J. Comp. Physiol. A 178, 699–709.
Harris, R. A., Graham, P., and Collett, T. S. (2007). Visual cues for the retrieval of landmark memories by navigating wood ants. Curr. Biol. 17, 93–102.
Horridge, G. A. (2003). Visual resolution of gratings by the compound eye of the bee Apis mellifera. J. Exp. Biol. 206, 2105–2110.
Kurtz, R., Egelhaaf, M., Meyer, H. G., and Kern, R. (2009). Adaptation accentuates responses of fly motion-sensitive visual neurons to sudden stimulus changes. Proc. R. Soc. Lond. B Biol. Sci. 276, 3711–3719.
Lehrer, M. (1994). Spatial vision in the honeybee – the use of different cues in different tasks. Vision Res. 34, 2363–2385.
Lehrer, M., and Campan, R. (2005). Generalization of convex shapes by bees: what are shapes made of? J. Exp. Biol. 208, 3233–3247.
Lehrer, M., and Collett, T. S. (1994). Approaching and departing bees learn different cues to the distance of a landmark. J. Comp. Physiol. A 175, 171–177.
Lehrer, M., Wehner, R., and Srinivasan, M. (1985). Visual scanning behavior in honeybees. J. Comp. Physiol. A 157, 405–415.
Lent, D. D., Graham, P., and Collett, T. S. (2009). A motor component to the memories of habitual foraging routes in wood ants? Curr. Biol. 19, 115–121.
Lent, D. D., Graham, P., and Collett, T. S. (2010). Image-matching during ant navigation occurs through saccade-like body turns controlled by learned visual features. Proc. Natl. Acad. Sci. U.S.A. 107, 16348–16353.
Schilstra, C., and van Hateren, J. H. (1999). Blowfly flight and optic flow I. Thorax kinematics and flight dynamics. J. Exp. Biol. 202, 1481–1490.
Srinivasan, M. V., Zhang, S., Altwein, M., and Tautz, J. (2000). Honeybee navigation: nature and calibration of the “odometer”. Science 287, 851–853.
Srinivasan, M. V., and Zhang, S. W. (2004). Visual motor computations in insects. Annu. Rev. Neurosci. 27, 679–696.
Srinivasan, M. V., Zhang, S. W., and Rolfe, B. (1993). Is pattern vision in insects mediated by cortical processing? Nature 362, 539–540.
Stürzl, W., Cheung, A., Cheng, K., and Zeil, J. (2008). The information content of panoramic images I: the rotational errors and the similarity of views in rectangular experimental arenas. J. Exp. Psychol. Anim. Behav. Process. 34, 1–14.
Stürzl, W., and Zeil, J. (2007). Depth, contrast and view-based homing in outdoor scenes. Biol. Cybern. 96, 519–531.
Tautz, J., Zhang, S., Spaethe, J., Brockmann, A., Si, A., and Srinivasan, M. (2004). Honeybee odometry: performance in varying natural terrain. PLoS Biol. 2, E211. doi: 10.1371/journal.pbio.0020211
van Hateren, J. H., and Schilstra, C. (1999). Blowfly flight and optic flow II. Head movements during flight. J. Exp. Biol. 202, 1491–1500.
van Hateren, J. H., Srinivasan, M. V., and Wait, P. B. (1990). Pattern-recognition in bees – orientation discrimination. J. Comp. Physiol. A 167, 649–654.
Wehner, R., and Müller, M. (2010). Piloting in desert ants: pinpointing the goal by discrete landmarks. J. Exp. Biol. 213, 4174–4179.
Zeil, J., Hofmann, M. I., and Chahl, J. S. (2003). Catchment areas of panoramic snapshots in outdoor scenes. J. Opt. Soc. Am. A 20, 450–469.
Zhang, S. W., and Srinivasan, M. V. (1994). Prior experience enhances pattern-discrimination in insect vision. Nature 368, 330–332.
Keywords: landmark navigation, snapshot matching, honeybee, vision, homing, pattern discrimination
Citation: Dittmar L, Egelhaaf M, Stürzl W and Boeddeker N (2011) The behavioral relevance of landmark texture for honeybee homing. Front. Behav. Neurosci. 5:20. doi: 10.3389/fnbeh.2011.00020
Received: 23 December 2010;
Accepted: 03 April 2011;
Published online: 21 April 2011.
Edited by:
Martin Giurfa, CNRS/Université Paul Sabatier-Toulouse III, FranceReviewed by:
M. Srinivasan, The University of Queensland, AustraliaFranck Ruffier, CNRS/Aix-Marseille University, France
Copyright: © 2011 Dittmar, Egelhaaf, Stürzl and Boeddeker. This is an open-access article subject to a non-exclusive license between the authors and Frontiers Media SA, which permits use, distribution and reproduction in other forums, provided the original authors and source are credited and other Frontiers conditions are complied with.
*Correspondence: Laura Dittmar, Department of Neurobiology, Bielefeld University, Universitaetsstrasse 25, 33615 Bielefeld, Germany, e-mail:bGRpdHRtYXJAdW5pLWJpZWxlZmVsZC5kZQ==