


- Department of Neurobiology and Center of Excellence ‘Cognitive Interaction Technology,’ Bielefeld University, Bielefeld, Germany
Honeybees use visual cues to relocate profitable food sources and their hive. What bees see while navigating, depends on the appearance of the cues, the bee’s current position, orientation, and movement relative to them. Here we analyze the detailed flight behavior during the localization of a goal surrounded by cylinders that are characterized either by a high contrast in luminance and texture or by mostly motion contrast relative to the background. By relating flight behavior to the nature of the information available from these landmarks, we aim to identify behavioral strategies that facilitate the processing of visual information during goal localization. We decompose flight behavior into prototypical movements using clustering algorithms in order to reduce the behavioral complexity. The determined prototypical movements reflect the honeybee’s saccadic flight pattern that largely separates rotational from translational movements. During phases of translational movements between fast saccadic rotations, the bees can gain information about the 3D layout of their environment from the translational optic flow. The prototypical movements reveal the prominent role of sideways and up- or downward movements, which can help bees to gather information about objects, particularly in the frontal visual field. We find that the occurrence of specific prototypes depends on the bees’ distance from the landmarks and the feeder and that changing the texture of the landmarks evokes different prototypical movements. The adaptive use of different behavioral prototypes shapes the visual input and can facilitate information processing in the bees’ visual system during local navigation.
Introduction
Many insects, in particular bees, wasps, and ants, use visual cues for locating special places, like food sources or their nest (Collett et al., 2006; Zeil et al., 2009). Despite much research devoted to this fascinating ability, it is still not entirely clear what visual information these insects use and store and how they gather this information for solving the localization task. It is widely accepted that they memorize a kind of visual snapshot of the scenery surrounding the goal location (review: Collett et al., 2006). However, it is still an open question what features constitute the snapshot. The snapshot might contain raw panoramic images (Zeil et al., 2003) or distinct image features, such as the luminance, color, or surface texture of objects (Cartwright and Collett, 1983; Cheng et al., 1986; Lehrer, 1998; Lehrer and Campan, 2005).
When searching for their goal flying hymenopterans, such as bees and wasps, rarely follow a straight trajectory to their goal. Rather their flight path may be circuitous and, depending on the conditions, organized in characteristic ways (e.g., Zeil, 1993a,b; Collett and Rees, 1997; Voss and Zeil, 1998; Zeil et al., 2009; Dittmar et al., 2010). Due to the closed-loop nature of behavior, these movements generate retinal image displacements, which depend, at least during translational phases of locomotion, on the spatial layout of the environment. Bees and wasps may indeed use this kind of information derived from the behaviorally generated optic flow for behavioral control during navigation (e.g., Lehrer, 1996; Zeil et al., 1996; Srinivasan et al., 2000; review: Srinivasan and Zhang, 2004). In a local navigation task in an indoor flight arena, honeybees are able to find the goal location surrounded by camouflaged cylindrical landmarks that carry the same texture as the background and, thus, are probably detected by optic flow that is generated by movements of the animal (Dittmar et al., 2010). Furthermore, the goal localization performance was virtually the same for these camouflaged landmarks and for landmarks that are detectable because they differ from the background in their luminance and texture. The question arises whether bees cope with these different situations by changing their flight behavior to be able to localize the feeder. Bees can adjust their flight behavior to environmental needs in other spatial vision tasks as they modify their flight speed and height relative to the current surroundings (Srinivasan et al., 1996; Kern et al., 1997; Srinivasan and Zhang, 2004; Baird et al., 2006; Portelli et al., 2010) or actively generate depth information by targeted movements (Lehrer, 1996).
Here we analyze how the bees’ flight pattern varies according to whether cylindrical landmarks have the same random visual texture as the background and so are detectable only through motion contrast or whether they are uniformly colored and can also be detected through static brightness cues. We do this by employing cluster analysis as a powerful tool for behavioral analysis (Braun et al., 2010; Geurten et al., 2010) in order to identify prototypical behavioral components and relate them to the landmark’s visual appearance and their current positions relative to the bees. To identify distinguishable behavioral components during bee landmark navigation we need a quantitative description of flight behavior that allows for a classification of behavior into distinct classes. For this quantitative description, we will represent flight behavior by local rotational (yaw rotation) and translational (along all three body axes of the animal) velocity components that we determine from trajectories filmed during navigation flights. Then, we apply a clustering approach to these velocity components for determining prototypical velocity vectors in the 4D velocity space (Braun et al., 2010). By classifying the data into a finite set of reoccurring prototypical movements, we reduce the complexity of flight behavior enormously.
We determined the prototypes of the flight trajectories described in Dittmar et al. (2010) to analyze if the occurrence of prototypes depends on the landmarks’ appearance that is whether the landmarks have a different or the same texture as the background. We analyzed how the prototypes change with the landmark texture and with the bees’ distance from the landmarks. We will elucidate whether bees change their flight behavior to cope with different visual goal environments in a way that facilitates the underlying visual information processing.
Materials and Methods
The analysis is based on the same experimental data that was collected in a previous study, where the performance of honeybees in locating a feeder was probed by targeted modifications of the landmark texture and the landmark–feeder arrangement (Dittmar et al., 2010). Therefore, we briefly describe only those aspects of data acquisition that are directly relevant to our current analysis.
Experimental Setup and Data Acquisition
Honeybees (Apis mellifera carnica) were trained to collect sugar water from an inconspicuous Perspex feeder (height 0.105 m) that was located in an indoor circular flight arena (diameter 1.95 m, height 0.5 m; Figure 1A). The same red–white Gaussian blurred random dot pattern covered the wall and floor of the arena. The bees learned to associate the reward with a constellation of three cylinders with heights of 0.25 m and diameters of 0.05 m. We will refer to these cylinders as landmarks. The landmarks were symmetrically placed around the feeder at distances of 0.1, 0.2, and 0.4 m, respectively. During training, the landmarks carried in all experiments a uniform dark red paper that provided strong luminance and texture contrasts to the brighter arena wall and floor. For some tests, the landmarks were covered with the same Gaussian blurred random dot pattern as the arena floor and walls. The experimental setup provided as little additional landmark information as possible. To ensure that the bees employed the three cylindrical landmarks as the main cues for localizing the feeder and to prevent them from using their path integration system or potential external cues, the arrangement of landmarks and feeder was shifted during the training procedure (Dittmar et al., 2010).
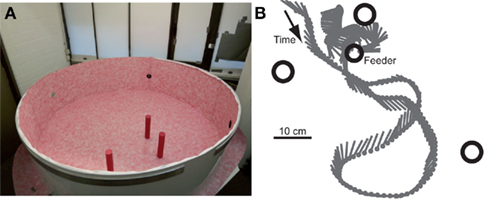
Figure 1. (A) Flight arena with the three landmarks. The upper cover of the arena made of cloth is not shown. (B) Sample trajectory as seen from above. The position (gray dot) and orientation (gray line) of the bee are shown every 24 ms. The locations of the three landmarks (big open circles) and the feeder (smaller open circle) are indicated.
The flight trajectories of the honeybees approaching the food source (for an example, see Figure 1B) were recorded with two high-speed cameras, one placed above the area of the landmark arrangement and directed vertically and one at mean height of the arena wall, directed horizontally toward the area of interest. The cameras recorded the flight trajectory before the bee landed on the feeder at 125 frames/s and with a resolution of 1024 × 1024 pixels (Dittmar et al., 2010). The 3D trajectories were determined from two corresponding 2D views using the custom-built software package ivTrace (available as open source package from: opensource.cit-ec.de/projects/ivtools) and stereo calibration data. The orientation of the bee’s body long axis was determined from the top-view camera using ivTrace. For reducing detection noise, we smoothed the resulting 3D coordinates and the body angles by applying a low pass filter (second order Butterworth filter with a cut-off frequency of 20 Hz). Based on the body position and orientation in consecutive frames we determined the forward, sideways, and upward velocities. The differences in 2D body orientation angle between consecutive frames delivered the yaw velocity. The 4D velocity data (three translational velocities; yaw rotation) calculated for each two consecutive trajectory points constitutes the base for the following movement analyses.
In the first experiment, 173 flights of 21 bees were recorded under training conditions with dark red landmarks. We analyzed 278,193 trajectory points corresponding to an overall flight time of ∼2226 s. In a second experiment, we recorded 79 flights of 16 bees with landmarks carrying the training texture (dark red) or the same random texture that covered the wall and the floor of the arena (corresponding to 113,077 data points and an overall flight time of 905 s). To compare the flight behavior before and after exchanging the landmark texture, we selected from this database the data of nine individually marked bees, which performed the same number of flights under both conditions (same data as analyzed in Dittmar et al., 2010). These bees performed three to six flights in the two different environments resulting in 65,004 trajectory points corresponding to 520 s for the random texture condition and 84,374 trajectory points and, thus, an overall flight time of 675 s for the uniform texture condition. We used the entire dataset recorded with the randomly textured landmarks for additional control analyses.
Clustering Approach to Analyze Velocity Prototypes for Bee Trajectories
To categorize the flight behavior we identified prototypical movements by applying a clustering approach on the 4D velocity data obtained from the flight trajectories. In the following, we will shortly describe this approach (for details, see Braun et al., 2010).
The main idea of this approach is to describe movements in their simplest form via velocities and to identify prototypical movements by detecting reoccurring similar combinations of velocity components. For example, if bees often fly straight forward at a velocity of 1 m/s, many velocity data points should cluster close to the 4D point corresponding to 1 m/s forward and zero sideways, upward, and yaw velocity. To detect those prototypical velocities we identified accumulation points within the 4D velocity data by applying cluster analysis. The accumulation points are called velocity prototypes, which describe prototypical movements of the bee. The cluster analysis delivers the unique assignment of each velocity data point to its nearest prototype in the 4D velocity space. To determine the accumulation points in the velocity data we applied a k-means clustering algorithm (Braun et al., 2010). This algorithm locates the k accumulation points with the aim to minimize the overall sum of occurring Euclidean distances between individual velocity data points and the corresponding accumulation point. To ensure that all velocity components contribute equally to distance estimation, we normalized each velocity component to 0 mean and SD 1.
Before applying the k-means approach the number of clusters (k) to be tested has to be defined. A suitable range of cluster numbers was assessed as described previously (Braun et al., 2010). On this basis we tested cluster numbers from 2 to 20 and chose the most suitable number by evaluating the clustering results according to two criteria: (1) Instability criterion: the resulting accumulation points have to remain constant for different randomly chosen starting conditions of the iterative clustering procedure. We calculated the stability of the results of each two k-means runs by matching the accumulation points to each other and determining the sum of distances between the matched accumulation points. From the distance for each pair of runs we calculated the mean value for the current set of runs and call this the instability, which should be minimized. (2) Quality criterion: the quality of clustering is assessed by the extent to which the distinct clusters are separated from each other. Optimal clusters have large distances between corresponding accumulation points, but small distances to the respective assigned data points. The quality of a cluster is given by the relation between these distances (for details, see Braun et al., 2010). Based on the instability and quality criteria, we are able to compare different clustering results and to select the most appropriate number of clusters: we selected the cluster number with the highest quality as it represents the data structures best and demanded the results to be stable as a prerequisite for any further interpretation.
For each tested number of clusters we calculated 10 k-means results and evaluated their instability and quality. In addition, we varied the given database in order to assess whether the results generalize from its special characteristics such as the number of included individuals and trajectories. Therefore, we left out consecutive sequences of either 10 or 20% of the data at 50 different equally distributed locations within the whole database. We determined the instability and quality of the 50 clustering results from different sets of 80 or 90% of the data, respectively. In this way, we assessed the most suitable number of clusters k. After fixing the parameter k, we selected the set of accumulation points for further analysis from those calculated for the whole database that provides the smallest mean distance to the other sets of accumulation points calculated for this database.
To determine the velocity prototypes and the SD of the individual data points assigned to this prototype we converted the corresponding normalized data back to their original physical units. By assigning the velocity prototypes to the trajectory points, we could determine the probability of their occurrence and their spatial distribution in the flight arena.
We calculated the velocity prototypes individually for the dataset collected in the first experiment, in which flight trajectories were recorded under training conditions with uniformly textured landmarks, as well as for the two datasets of the second experiment. Here flight trajectories were recorded with uniform landmarks under training conditions as a reference and additionally with the randomly textured landmarks. The comparison of the cluster results allows us to identify changes in flight behavior depending on landmark texture.
Results
Local Navigation Flights with Three Conspicuous Landmarks
Although the bees successfully learnt to pinpoint the site of a food reward with three conspicuous landmarks near to the feeder (Dittmar et al., 2010), their trajectories are rarely straight and they perform complex flight maneuvers within the landmark arrangement (Figure 1B). This indicates that they spend some time searching for the goal instead of directly heading toward it. With the help of our classification of flight behavior in prototypical movements, we can analyze this behavior in detail and identify specific reoccurring behavioral components, the prototypical movements.
We determined prototypical movements based on the bee’s translational and rotational velocity components by applying k-means clustering. By evaluating the clustering results for different numbers of clusters according to their stability and quality (see Appendix for details) the most suitable number of clusters turns out to be nine in experiment 1 (see Figure 2). This relatively small number is very similar to related studies on cruising flight of different fly species (Braun et al., 2010; Geurten et al., 2010). Only two velocity prototypes of bees contain significant yaw velocities, corresponding to fast left and right rotations. This finding confirms the classification of insect flight behavior into saccades and intersaccadic intervals (Land, 1973; Collett and Land, 1975; van Hateren and Schilstra, 1999; Boeddeker et al., 2010; Braun et al., 2010; Geurten et al., 2010). The separation of flight behavior into rotations and translations can facilitate the processing of spatial information as the optic flow generated on the bee retina during pure translational locomotion contains distance information, while the optic flow resulting from rotations does not (e.g., Land, 1999; Kern et al., 2005; Zeil et al., 2007). The Saccade Left and Saccade Right prototypes combine yaw velocities of about 500 deg/s with forward velocities of 0.38 m/s and take 18% of the whole flight time. Bees spend the remaining 82% of their flight time by performing combinations of the three translational velocity components. Seven prototypes capture such translational movements occurring in the intersaccadic intervals.
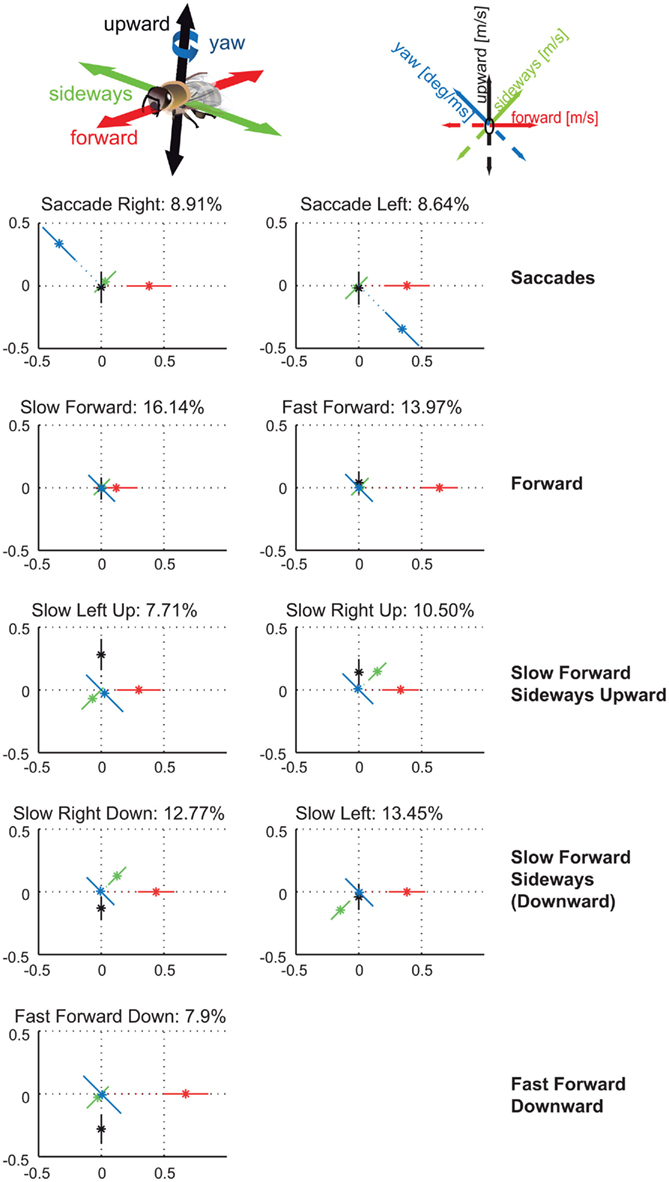
Figure 2. Nine velocity prototypes for experiment 1 in (meter per second) and (degree per millisecond), respectively. Each prototype is depicted as star plot containing the four velocity components drawn onto color coded lines equally dividing the drawing plane. For each line the distance of the dot from the center determines the absolute value of the corresponding velocity component, the error bars visualize the SD of this value. Whether the value is positive or negative determines at which part of the line relative to zero point the value is plotted. Percentage of data points assigned to the individual prototypes determines the relative occurrence of each prototype. For detailed description, see text.
Two of the intersaccadic prototypes are characterized by forward movements. These two prototypes, Slow Forward and Fast Forward, occur most often with 16 and 14% of the flight time. The remaining five translational prototypes are characterized by different combinations of sideways and/or upward/downward velocities. Together, they cover 52% of the whole flight time and 63% of the intersaccadic intervals.
By assigning one velocity prototype to every point of the bees’ trajectories, we analyze whether the prototypical movements occur preferentially at specific locations within the flight arena (Figure 3). The prototypes Saccade Left and Saccade Right are rather equally distributed across all areas of the flight arena that are flown over by the bees, except that saccades are slightly more frequent close to the arena walls (see Tammero and Dickinson, 2002 for Drosophila), where bees are particularly likely to turn toward the landmarks and feeder. The Slow Forward prototype occurs almost exclusively very close (<100 mm) to the landmarks and the feeder. In contrast, the Fast Forward prototype is infrequent when bees are near landmarks. It occurs often far away from landmarks, especially in the left and bottom side of the analyzed area. The bees fly about 1 m before getting close to the landmark arrangement and entering the recording area from the left, and they seem to reduce their speed close to the landmark–feeder arrangement. Similarly, the Fast Forward Down prototype mostly occurs far from the landmarks, but its distribution is more symmetric around the landmarks. The remaining four prototypes are characterized by intermediate forward velocities and contain combinations of different upward/downward and sideways components. The two prototypes containing upward velocity components, Slow Forward Left Upward and Slow Forward Right Upward, are concentrated around the landmarks and close to sections of the arena wall. In contrast, the Slow Forward Right Downward and Slow Forward Left prototypes spread over the whole area with only weak local circular maxima around the landmarks. The prototypes are usually distributed symmetrically around the landmarks indicating that the occurrence of individual prototypes depends on the distance to the nearest landmark and not on the direction from which bees approach the landmark.
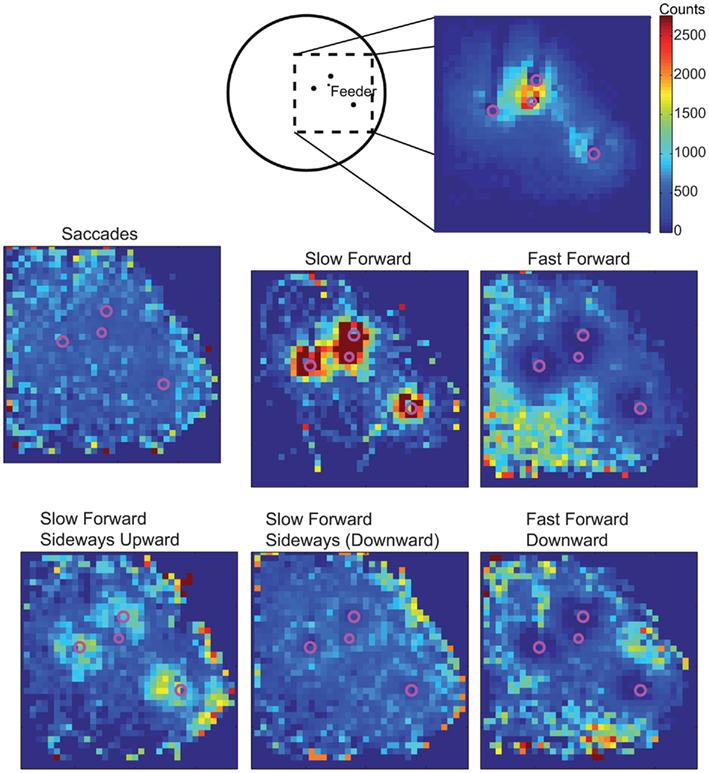
Figure 3. Sketch of the top-view of the arena and the area around the landmarks and the feeder that is covered by cameras for recording the trajectories. Spatial distribution of all analyzed trajectory points in 2D (irrespective of the height above the arena floor). Area is divided into 30 mm × 30 mm large cells and the absolute number of trajectory points assigned to one cell is visualized. C: spatial probabilities of occurrence of the nine velocity prototypes combined to six classes for better visualization. For each class of velocity prototypes’ absolute occurrences are counted within the 30-mm × 30-mm cells and, firstly, normalized with the overall spatial distribution. Finally, each distribution is normalized to sum up to 1 and, therefore, corresponds to the spatial probability of occurrence of this prototype class. The same color code is used for all distributions.
Both the distributions of the multidimensional prototypes and the individual velocity components depend on the distance to the nearest landmark (data not shown). The bees decrease their forward velocity with decreasing distance to the nearest landmark. Upward velocities occur mainly near to the landmarks, while downward velocities are more prevalent at distances larger than about 150 mm. The bees seem to fly upward close to the landmarks and then reduce their height again outside the arrangement. Sideways velocities occur rather independent of the distance to the nearest landmark.
Generally, upward and downward as well as sideways movements are particularly suitable to gather spatial information from the optic flow evoked by objects that are located within the frontal field of view, because in many environments retinal velocities are greatest orthogonally to the direction of motion (e.g., Koenderink, 1986). Hence pure sideways movements generate strong optic flow signals when there are objects in the bee’s frontal field of view, whereas the optic flow of objects in front of the bee is much weaker when approached in pure forward flight. We determined the angle under which the bees see the landmarks as approximated from the body position and orientation (for details, see inset Figure 4A) and the assumption that the head is most of the time aligned with the body (Boeddeker et al., 2010). All trajectory points <100 mm from a landmark irrespective of their height were taken into account for calculating these viewing angles. Figure 4A shows that the nearest landmark is seen mainly within the frontal visual field. However, the distribution of viewing angles is very broad (interquartile range is 105°, ranging from −47° to 58°), which indicates that the nearest landmark is not always centered within the frontal visual field. This conclusion is corroborated by the example trajectory (Figure 4B), where the bee mainly moves forward and sideways to the right and the landmark center is always seen within the left visual field. Figure 4C shows the angular retinal position of the right and left vertical edge of the landmark for the corresponding five slow intersaccadic prototypes that mainly occur close to the landmarks. The viewing angles differ qualitatively for the different prototypes. The retinal positions of the edges are significantly shifted away from the central frontal position for those prototypes that contain large sideways velocities. Furthermore, the direction of this shift is determined by the direction of the prototypical sideways movement: while moving left, the landmark is most often held in the right visual field and vice versa. This finding underlines the importance of sideways movements for gathering landmark information from the optic flow evoked in the fronto-lateral visual field.
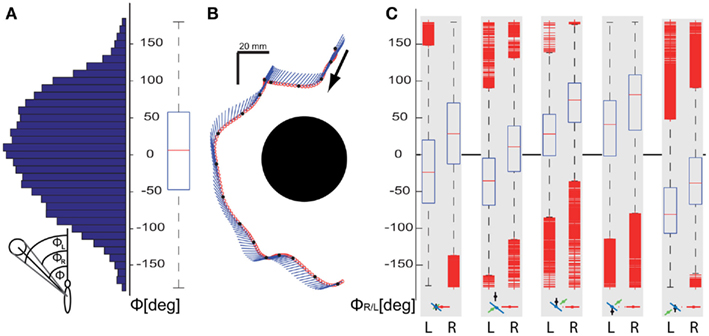
Figure 4. Analysis of the angle Φ between the orientation of the bee and the direction of the landmark center, which approximates the viewing angle of the landmark. (A) Distribution and corresponding boxplot indicating the median and quartiles and the range of the viewing angles Φ to the center of the landmarks for all trajectory points with the bee closer than 100 mm from the center of the nearest landmark. (B) Example trajectory of a flight near to the landmark as seen from above. The position of the bee’s center of mass (dot) and its orientation (line) are shown every 8 ms. (C) Angles of view of the right and left edge of the nearest landmark, (indicated by R and L below the respective subplot) for the same data as analyzed in (A) in dependence on the corresponding prototypical movement. The median, quartiles, and range of the data are shown. Outliers are displayed as short horizontal bars; data points are drawn as outliers if they are larger than 1.5 of the distance between the 25th and 75th percentiles. This corresponds to ∼±2.7 ( and 99.3 coverage if the data are normally distributed. Only data corresponding to the prototypes providing slow forward velocities are depicted underneath the subplots because they predominantly occur near to the landmarks; prototypes are depicted in the format as explained in Figure 2.
Taken together, the analysis of prototypical movements during landmark navigation reveals that bees change their flight behavior according to their position relative to the landmarks.
Dependence of the Flight Pattern on the Landmarks’ Appearance
Do the prototypical movements vary according to whether the landmarks require motion contrast to be detected if seen against the equally textured background? In Dittmar et al. (2010) the uniform red texture that covered the landmarks during training was swapped during about half of the trials to the same random texture that covered the wall and floor of the flight arena. The navigational performance with the randomly textured landmarks was not reduced (Dittmar et al., 2010). By applying the clustering approach to the same data set, we tested for the different conditions whether the velocity prototypes, their occurrence, and localization in the flight arena depend on the visual appearance of the landmarks. As a control, we compared the cluster results of the data set with the uniform red texture with the results obtained in experiment 1 when bees only experienced uniformly colored landmarks. Both data sets recorded with a uniform landmark texture led to nine similar velocity prototypes (Figure 5A; Figure A3 in Appendix compares the two sets directly; Figure A5 in Appendix shows the spatial probability distributions of the prototypes for this experiment). When clustering the data obtained for the same bees but with the landmark texture exchanged, we find differences in the detailed flight behavior. With randomly textured landmarks, eight rather than nine clusters describe the data best (Figure A2 in Appendix; Figure 5B). This result does not depend on the size of the data set, but also holds true for the complete dataset available for randomly textured landmarks (see Materials and Methods, Figure A4 in Appendix). As a further control, we clustered the data obtained with randomly textured landmarks with a pre-set number of nine prototypes (data not shown). It turned out that selecting nine instead of eight clusters does not change any of our following conclusions. Because of the better quality of the clustering with eight prototypes, we will focus on the comparison of these eight prototypes for the randomly textured landmarks with nine prototypes for the uniform landmarks.
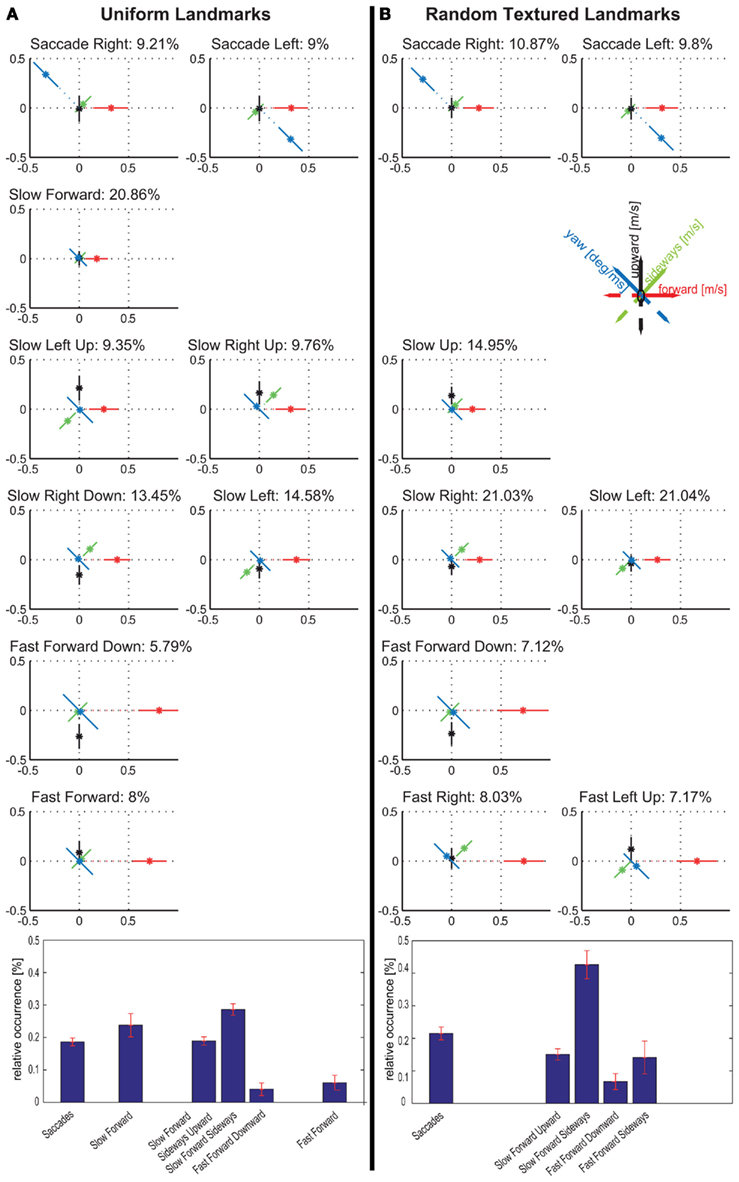
Figure 5. Comparison between velocity prototypes resulting from tests with uniformly red coloured (A) and randomly textured (B) landmarks for experiment 2. Bar diagram shows the relative occurrences for prototype classes. Error bars show the mean error of the mean value of the occurrence data for the individual bees. For detailed description, see text.
The extracted sets of prototypes for flights in the two landmark situations both contain two prototypes that correspond to saccades (Figure 5). These saccadic prototypes are distributed uniformly over the arena independently of the landmarks (Figure A5 in Appendix). Amongst the prototypes occurring in the intersaccadic interval we find for both landmark textures those that are characterized by a slow forward velocity (<0.5 m/s). They occur mostly close to the landmarks and the feeder, while prototypes characterized by fast forward velocities occur mostly in the outer areas of the arena (Figure A5 in Appendix). However, the two sets of prototypes differ in their sideways and upward/downward velocity components. In contrast to the uniform landmarks, there are no pure forward prototypes. With the random-textured landmarks, all prototypes contain either significant sideways or upward/downward velocity components or both. We consider a component as significant, if its mean value deviates by at least 1 SD from 0. In particular, when flying distant from the landmarks that are only detectable by motion contrast, the fast forward flight prototypes (15% of the whole flight time) contain, in contrast to the uniform texture, significant sideways components (see Figure 5). These flight maneuvers allow the bees to detect the camouflaged landmarks by relative motion, even when flying far from the landmarks. Sideways and upward/downward locomotion create translational optic flow that allows the animal to gather information about the layout of the environment, in particular, in the frontal visual field. In fact, if the bees are near to the landmarks, they see them mostly in their frontal visual field. The viewing angles of the uniform and randomly textured landmarks are similar to each other (data not shown) and to those obtained in the first experiment (Figure 4). The differences in the distributions of sideways and upward/downward velocities for the different landmark textures have a strong impact on translational optic flow in the frontal visual field. They may facilitate the detection of random-textured landmarks in front of the background. As has been discussed in detail in Dittmar et al. (2010), the bees may have seen in their upper field of view the top end of the landmarks against the white background. However, this “skyline” did not provide a reliable cue, as it changed during training, due to the shifting of the feeder–landmark arrangement. Furthermore, the dependence of prototypical movements on landmark texture provides strong evidence that motion information plays a decisive role in detecting the randomly textured landmarks (other evidence is discussed in Dittmar et al., 2010).
The six intersaccadic prototypes obtained for the random landmark condition can be separated into those dominated by a sideways velocity component and others that are dominated by an upward/downward velocity component. Only one exception, the Fast Forward Left Upward prototype, contains a combination of equivalent sideways and upward velocity components. The prototypes dominated by upward/downward velocities occur for about 22% of the total flight time, corresponding to 28% of the intersaccadic intervals, while those just containing significant sideways velocities occur during about 50% of the flight time, corresponding to 63% of the intersaccadic interval. This means that during intersaccadic intervals sideways movements occur more often than upward/downward movements when the bees navigate with the randomly textured landmarks. In contrast, the prototypes determined for uniform landmarks either do not contain any sideways or upward/downward velocity components at all (Slow Forward, Fast Forward) or the prototypes are characterized by combinations of these velocity components.
Does this difference in the occurrence of these combinations mean that bees always perform either pure sideways or upward or downward movements when confronted with the randomly textured landmarks, while they fly always combinations of both in the presence of uniform landmarks? There is no such strict separation, which is indicated by the SDs of the different velocity components of each prototype (Figure 5) as well as by the probability distributions of the relation between two velocity components (Figure 6). With the uniform landmarks, combinations of sideways and upward/downward velocity components as well as movements dominated by either a sideways or an upward/downward component occur equally often (Figure 6A). For the randomly textured landmarks, dominant sideways velocities are more frequent than combinations and dominant upward/downward velocities (Figure 6A). This is indicated also by the relative occurrences of the corresponding prototypical velocities. Figures 6B,C show the probabilities for combinations of forward with upward/downward and forward with sideways velocity components, for the two landmark texture conditions, respectively. These histograms reveal a dominance of the forward velocity component. However, while the distributions of the forward/sideways combinations are very similar for both landmark texture conditions, the distributions of the forward/upward/downward combinations appear to differ slightly from each other depending on landmark texture. With uniform landmarks, the upward/downward velocity component might play a more important role in relation to the sideways and forward component than when the landmarks are randomly textured (see also Figure 5 and Dittmar et al., 2011).
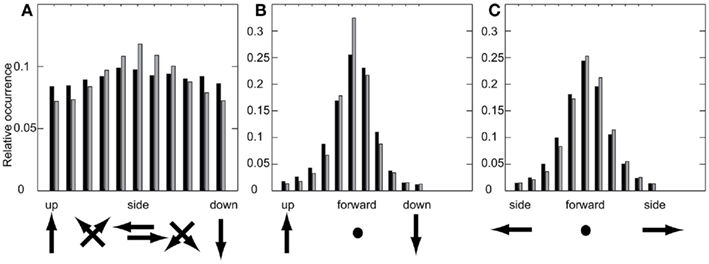
Figure 6. Probability distributions of velocity component combinations measured as histograms of the occurrence of relations between two components. Dark: uniform landmarks, gray: random landmarks. (A) Upward/sideways/downward velocity, (B) upward/forward/downward, (C) left/forward/right.
These findings indicate that it might be meaningful to take also the bees’ flight height into consideration, because the functional significance of the different prototypical movements may differ depending on whether a bee is close to the base of the landmark, at its top or somewhere in the middle. We analyzed the height of the bees when they were closer than 100 mm to either of the two landmark types (Figures 7A,B). For the uniform landmark the bees fly for most of the time between the arena floor and the height of the feeder; nonetheless they frequently fly also at a height just below landmark’s the top edge. In contrast, for the randomly textured landmarks the flight height is approximately distributed around the feeder height. These characteristic texture dependent flight heights go along with different proportions of prototypical movements (Figures 7C,D). Two features might be most important from a functional point of view: (1) Prototypical movements with a strong sideways component are much more prominent along the entire vertical extent of the landmark for the uniform landmarks than for the randomly textured ones. Sideways movements are a precondition for the randomly textured landmark to be discriminated from the background. (2) Prototypical movements with a strong vertical component slightly predominate close to the top edge of the uniform landmark; up- and downward movements of the bee lead to relative motion information only at the horizontal edges of the landmark, but not along most of its vertical extent.
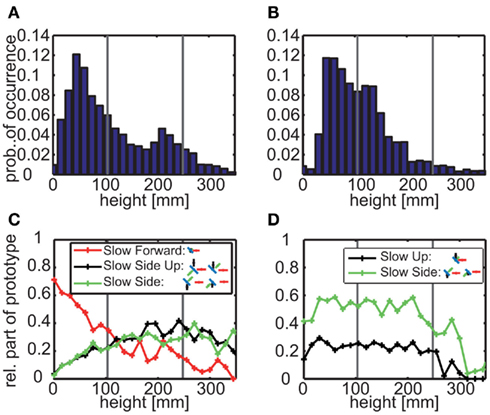
Figure 7. (A,B) Height probability distributions for all trajectory points that are near to the uniform (A) or randomly textured (B) landmarks (distance < 100 mm). The data sets contain 23,891 points out of 84,374 (corresponding to 191 s) for uniform landmarks and 15,877 points (corresponding to 127 s) out of 65,004 for randomly textured landmarks. Gray vertical lines mark the height of the feeder (105 mm) and the landmarks (250 mm), respectively. (C,D) Relative part of different prototypes depending on the height near to the uniform (C) or randomly textured (D) landmarks. The saccadic prototypes are not depicted here, because they are rather uniformly distributed within the flight arena. The fast forward prototypes do not play a role near to the landmarks at all.
Discussion
We investigated, whether and how bees adapt their flight behavior during a local navigation task depending on the appearance of landmarks by decomposing the flight behavior into prototypical movements and relating the distribution of these prototypes to the distance from the landmarks and the goal. We find that these distances influence the type of prototypical movements performed by the bees. Furthermore, depending on the appearance of the landmarks, we find that different sets of prototypical movements describe the honeybees detailed flight structure. Prototypical movements, their relative occurrence, and spatial distribution are well suited to classify the bees’ flight behavior and to relate these components to characteristics of their current visual environment.
Saccadic Flight Structure
The separation of flight behavior into saccadic and intersaccadic intervals is typical for the flight behavior of many insects (Land, 1973; Collett and Land, 1975; van Hateren and Schilstra, 1999; Boeddeker et al., 2010; Braun et al., 2010; Geurten et al., 2010). The cluster analysis allows us now to quantify and localize saccadic movements. We find here that honeybees perform saccades independently of their location within the flight arena. This finding reveals that partitioning flight sequences into saccades and intersaccadic intervals constitutes an elementary flight strategy that separates rotational and translational optic flow. Kern et al. (2005) suggested that this separation is of functional significance for motion sensitive neurons that respond to translational optic flow components during the intersaccadic intervals. Rotations are compressed into short fast movements, which maximizes the time during which spatial information can be acquired. Bees spend less than 20% of the flight time with saccades. This proportion of saccadic time is similar to that obtained for free-flight behavior of blowflies (17%; Braun et al., 2010) and hoverflies (7%; Geurten et al., 2010).
In contrast, the intersaccadic prototypes reveal qualitative differences in the translational movements between insect species under the analyzed experimental conditions. While forward movements play by far the most prominent role for free-flying blowflies, some free-flight hoverfly prototypes do not contain a forward velocity at all. Instead, hoverflies perform sideways and up- or downward movements more often (Geurten et al., 2010). All velocity prototypes assigned to the intersaccadic intervals during local navigation flights of honeybees contain a forward velocity component, but also sideways and/or up- or downward velocity components play an important role.
Intersaccadic Translational Movements during Honeybee Local Navigation Flights
Generally, all translational movements induce optic flow patterns that contain distance information. Especially, sideways and up- or downward movements are suited for gathering spatial information in particular in the frontal visual field. Indeed, our analysis of the viewing angles confirms that the bees hold the near landmark most often in the frontal visual field. Also wasps, while performing learning and return flights (e.g., Zeil, 1993a,b; Zeil et al., 1996) or object oriented zig–zag flights (Voss and Zeil, 1998), as well as bumblebees in learning flights (Baddeley et al., 2009) do not generally face landmarks; peak orientations are toward the nest-hole unless a landmark is very close to the nest-hole. However, relating the viewing angles to the corresponding prototypical movements leads to different angle distributions. The prototypes providing sideways velocity components occur together with viewing angles of the landmark edges that are shifted for about 10°–80° (median values, Figure 4C) to the lateral field of view. Furthermore, the directions of sideways movements and viewing angle shift are coupled: while flying to the right, the landmark is most often seen on the left side and vice versa. This shift in retinal landmark position might be another indicator that the optic flow generated by intersaccadic translational movements might be employed for distance estimation. The observed shifts are expected at least qualitatively, if the bee follows a strategy to keep the retinal landmark position in an eye region that experiences for a given landmark distance the largest optic flow, i.e., the region that is oriented orthogonally to the direction of motion. Since all prototypical movements with a strong sideways component contain also a forward component, the largest retinal velocities are generated in the right and left fronto-lateral visual field during prototypical movements with a leftward and rightward sideways component, respectively. A similar correlation was found in Zeil (1993a) for individual orientation flights of ground nesting wasps that hold their nest entrance at angles of about 30°–70° on the left while flying to the right and vice versa. However, such lateral retinal landmark positions were found rarely during orientation and search flights of these wasps (Zeil, 1993b).
The honeybees’ translational velocity prototypes are characterized by different combinations of forward and sideways and/or up- or downward velocity components. When navigating with landmarks that provide high luminance and texture contrasts, 60% of the intersaccadic flight time is characterized by prototypes that contain sideways and/or up- or downward velocity components. Whether either sideways or up- and downward movements are better suited for gathering object information in particular in the frontal visual field depends on the orientation of the edges between the landmarks and the background. Generally, the vertical landmark edges are the longest and most prominent ones in our experimental setup. They evoke motion contrasts with the background, when the bee moves sideways in front of them. In fact, prototypes containing a sideways velocity component occur during more than 50% of the intersaccadic intervals. This finding supports the hypothesis that the bees exploit relative motion information provided by the vertical landmark edges in the frontal visual field. Whereas relative motion in the frontal visual field evoked by intersaccadic translation with a pronounced sideways component is an important source of spatial information irrespective of the landmark texture, relative motion becomes the major cue for detecting and localizing landmarks, if the landmarks carry the same random texture as the background, which makes them rather inconspicuous in static images (Dittmar et al., 2010). Under this condition all the intersaccadic prototypes either contain sideways or up- or downward components. More than 70% of the intersaccadic intervals are assigned to prototypes with a relevant sideways velocity component, which emphasizes the role of sideways when navigating with landmarks only detectable by relative motion. Prototypes providing an up- or downward velocity component occur during less than 40% of the intersaccadic intervals with random landmarks. Up- and downward movements seem to play a less important role than sideways movements, if the landmarks are camouflaged by carrying the random texture. In contrast, for the uniform landmarks, we find a more similar proportion of translational prototypes containing an up- or downward velocity component (47% of the intersaccadic interval) and prototypes containing a sideways component (58% of the intersaccadic interval).
The conspicuous vertical edges of the uniform landmarks might induce up- and downward movements, known as contour following behavior (Lehrer et al., 1985; Lehrer and Srinivasan, 1994; Dittmar et al., 2011). The landmarks provide also a horizontal edge at their top, which may be exploited for gathering distance information by moving up- and downward, if the bee flies close to the top of the landmark. Indeed, near to the uniform landmarks bees frequently fly at heights in the range of the top of the landmark. With randomly textured landmarks, preferred heights are below and around the feeder height, where sideways movements generate motion parallax cues at the vertical landmark edges. It should be noted, that the correlation between the different types of prototypical translational movements close to the landmarks or the feeder, does not prove that during these movements the bee really gathers spatial information, although this hypothesis may appear plausible.
Spatial Distribution of Prototypical Movements
Slow forward prototypes occur most frequently when the bees are close to the landmarks. When flying through a narrow tunnel, bees adapt their forward velocity to the tunnel width and wall textures keeping the optic flow on their eyes constant (Srinivasan et al., 1996; Srinivasan and Zhang, 2004; Baird et al., 2006). A similar mechanism might explain that the honeybees reduce their velocity close to the landmarks in order to avoid collisions with them. However, in the context of spatial navigation, a reduction of flight speed is characteristic of search behavior. Honeybees are assumed to search for the feeder by matching the current visual scene with a memorized snapshot of the scenery surrounding the feeder location (snapshot matching). Dittmar et al. (2010) showed that for the experimental setup used here the similarity is high between the image as seen from the feeder and images at locations around the landmarks. Assuming that the bees have memorized the image motion pattern as an optic flow snapshot, they can navigate with high contrast and camouflaged landmarks (Dittmar et al., 2010). Homing by panoramic matching of images or of the motion pattern, can explain the behavior of ants and bees (e.g., Zeil et al., 2003; Dittmar et al., 2010; Wystrach et al., 2011). Whether static or dynamic information is more important may depend on the locomotion type, i.e., walking of flying. However, also recent findings in ants suggest that they may use a more or less continuous mapping of image transformations during their return to a learned goal location (Harris et al., 2007; Wehner and Müller, 2010). Global matching does not require a separation into landmarks and background. The phases of translational prototypical movements (about 80% of the bees’ flight time) are well suited to memorize an optic flow snapshot and later compare the current motion pattern with the memorized optic flow snapshot.
In conclusion, the selection of prototypical movements depending on the bee’s position and orientation relative to visual cues in its environment can be interpreted as an active behavior suitable for gathering the relevant information for the homing process based on optic flow.
Conflict of Interest Statement
The authors declare that the research was conducted in the absence of any commercial or financial relationships that could be construed as a potential conflict of interest.
Acknowledgments
This study was supported by the Deutsche Forschungsgemeinschaft (DFG). L. Dittmar was funded by the Studienstiftung des deutschen Volkes.
References
Baddeley, B., Philippides, A., Graham, P., Hempel de Ibarra, N., Collett, T., and Husbands, P. (2009). What can be learnt from analysing insect orientation flights using probabilistic SLAM? Biol. Cybern. 101, 169–182.
Baird, E., Srinivasan, M. V., Zhang, S., Lamont, R., and Cowling, A. (2006). “Visual control of flight speed and height in the honeybee,” in From Animals to Animats, Vol. 4095, ed. S. Nolfi (Berlin: Springer), 40–51.
Boeddeker, N., Dittmar, L., Stürzl, W., and Egelhaaf, M. (2010). The fine structure of honeybee head and body movements in a homing task. Proc. Biol. Sci. 277, 1899–1906.
Braun, E., Geurten, B., and Egelhaaf, M. (2010). Identifying prototypical components in behaviour using clustering algorithms. PLoS ONE 5, e9361. doi: 10.1371/journal.pone.0009361
Cartwright, B., and Collett, T. (1983). Landmark learning in bees-experiments and models. J. Comp. Physiol. A 151, 521–543.
Cheng, K., Collett, T. S., and Wehner, R. (1986). Honeybees learn the colours of landmarks. J. Comp. Physiol. A 159, 69–73.
Collett, T., Graham, P., Harris, R., and Hempel de Ibarra, N. (2006). Navigational memories in ants and bees: memory retrieval when selecting and following routes. Adv. Stud. Behav. 36, 123–172.
Collett, T., and Land, M. (1975). Visual spatial memory in a hoverfly. J. Comp. Physiol. A 100, 59–84.
Collett, T., and Rees, J. (1997). View-based navigation in Hymenoptera: multiple strategies of landmark guidance in the approach to a feeder. J. Comp. Physiol. A 181, 47–58.
Dittmar, L., Egelhaaf, M., Stürzl, W., and Boeddeker, N. (2011). The behavioural relevance of landmark texture for honeybee homing. Front. Behav. Neurosci. 5:20. doi: 10.3389/fnbeh.2011.00020
Dittmar, L., Stürzl, W., Baird, E., Boeddeker, N., and Egelhaaf, M. (2010). Goal seeking in honeybees: matching of optic flow snapshots? J. Exp. Biol. 213, 2912–2923.
Geurten, B. R. H., Kern, R., Braun, E., and Egelhaaf, M. (2010). A syntax of hoverfly flight prototypes. J. Exp. Biol., 213, 2461–2475.
Harris, R. A., Graham, P., and Collett, T. S. (2007). Visual cues for the retrieval of landmark memories by navigating wood ants. Curr. Biol. 17, 93–102.
Kern, R., Egelhaaf, M., and Srinivasan, M. V. (1997). Edge detection by landing honeybees: behavioural analysis and model simulations of the underlying mechanism. Vision Res., 37, 2103–2117.
Kern, R., van Hateren, J., Michaelis, C., Lindemann, J., and Egelhaaf, M. (2005). Function of a fly motion-sensitive neuron matches eye movements during free flight. PLoS Biol. 3, e171. doi: 10.1371/journal.pbio.0030171
Lehrer, M. (1996). Small-scale navigation in the honeybee: active acquisition of visual information about the goal. J. Exp. Biol. 199, 253–261.
Lehrer, M. (1998). Looking all around: honeybees use different cues in different eye regions. J. Exp. Biol. 201, 3275–3292.
Lehrer, M., and Campan, R. (2005). Generalization of convex shapes by bees: what are shapes made off? J. Exp. Biol. 208, 3233–3247.
Lehrer, M., and Srinivasan, M. (1994). Active vision in honeybees: task-oriented suppression of an innate behaviour. Vision Res. 34, 511–516.
Lehrer, M., Wehner, R., and Srinivasan, M. (1985). Visual scanning behaviour in honeybees. J. Comp. Physiol. A 157, 405–415.
Portelli, G., Ruffier, F., and Franceschini, N. (2010). Honeybees change their height to restore their optic flow. J. Comp. Physiol. A 196, 307–313.
Srinivasan, M., and Zhang, S. (2004). Visual motor computations in insects. Annu. Rev. Neurosci. 27, 679–696.
Srinivasan, M., Zhang, S., Altwein, M., and Tautz, J. (2000). Honeybee navigation: nature and calibration of the ‘odometer.’ Science 287, 851–853.
Srinivasan, M., Zhang, S., Lehrer, M., and Collett, T. (1996). Honeybee navigation en route to the goal: visual flight control and odometry. J. Exp. Biol. 199, 237–244.
Tammero, L. F., and Dickinson, M. H. (2002). The influence of visual landscape on the free flight behavior of the fruit fly Drosophila melanogaster. J. Exp. Biol. 205, 327–343.
van Hateren, J., and Schilstra, C. (1999). Blowfly flight and optic flow. II. Head movements during flight. J. Exp. Biol. 202, 1491–1500.
Voss, R., and Zeil, J. (1998). Active vision in insects: an analysis of object-directed zig-zag flights in wasps. J. Comp. Physiol. A 182, 373–387.
Wehner, R., and Müller, M. (2010). Piloting in desert ants: pinpointing the goal by discrete landmarks. J. Exp. Biol. 213, 4174–4179.
Wystrach, A., Cheng, K., Sosa, S., and Beugnon, G. (2011). Geometry, features, and panoramic views: ants in rectangular arenas. J. Exp. Psychol. 37, 420–435.
Zeil, J. (1993a). Orientation flights of solitary wasps. I. Description of flight. J. Comp. Physiol. A 172, 189–205.
Zeil, J. (1993b). Orientation flights of solitary wasps. II. Similarities between orientation and return flights and the use of motion parallax. J. Comp. Physiol. A 172, 207–222.
Zeil, J., Boeddeker, N., Hemmi, J., and Stürzl, W. (2007). “Going wild: toward an ecology of visual information processing,” in Invertebrate Neurobiology, eds G. North and R. Greenspan (Cold Spring Harbor, NY: Cold Spring Harbor Press), 381–403.
Zeil, J., Boeddeker, N., and Stürzl, W. (2009). “Visual homing in insects and robots,” in Flying Insects and Robots, eds D. Floreano, J.-C. Zufferey, M. V. Srinivasan, and C. Ellington (Berlin: Springer Verlag), 87–100.
Zeil, J., Hofmann, M., and Chahl, J. (2003). Catchments areas of panoramic snapshots in outdoor scenes. J. Opt. Soc. Am. A 20, 450–469.
Zeil, J., Kelber, A., and Voss, R. (1996). Structure and function of learning flights in bees and wasps. J. Exp. Biol. 199, 245–252.
Appendix
Evaluating Clustering Results for Determining the Suitable Number of Clusters
To determine prototypes based on the velocity data calculated from local navigation flight trajectories we apply a k-means clustering approach, as described in Materials and Methods (for more details see Braun et al., 2010). As the first step of this approach, we have to define the number of clusters that describes the data best. Therefore, we evaluate the stability and quality of the results of several runs varying the random starting conditions and the velocity database. For the range of 2–12 clusters, we calculated the mean quality and mean instability for 10 runs containing the whole database and 50 runs containing different portions of 90 and 80% of the database, respectively.
The mean quality is maximal for this data, when clustering it into nine clusters (Figure A1). The mean instability is slightly increased for nine in contrast to eight or seven clusters for the reduced databases. When analyzing these differences in detail, it turns out that we get for some reduced databases sets of velocity prototypes that differ in the four prototypes combining slow forward velocity with sideways and upward/downward velocity components (Figure 2). The instability values result from different combinations of upward/downward and sideways velocity components within this subset of velocity prototypes but does not change their characteristics qualitatively. Based on the evaluation of the quality and stability of the clustering results, we determined nine clusters to be best suited for describing the data and, consequently, to be analyzed further.
Clustering the velocity data obtained for the randomly textured landmarks leads to eight clusters providing best quality (Figure A2). However, some of the mean instability values for the small data set originating from the nine individual bees that were tested under both landmark conditions are increased for this number of clusters. The comparably small size of the database (65,004 data points) is likely not to be sufficient for additionally leaving out data for the stability test. Therefore, we employed a different procedure to assess the viability of our results and compared the results obtained with the small database to the one determined from the complete data recorded under the random condition (see Materials and Methods). For the larger database, the eight prototypes of maximal quality are also stable. The resulting eight prototypes for both data sets are equivalent (Figure A4). This finding leads us to the conclusion that these eight prototypes are most suitable to describe the behavioral data occurring with the random landmark texture.
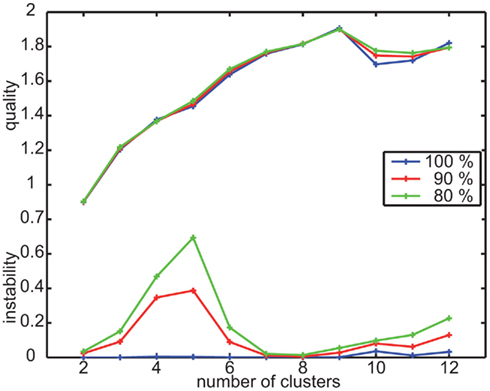
Figure A1. Quality and instability criterion for clustering the velocity data of experiment 1. Determine suitable number of clusters by minimizing instability and maximizing quality to be nine.
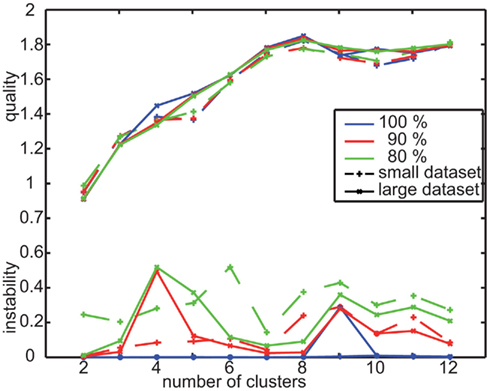
Figure A2. Quality and instability for two data sets recorded with randomly textured landmarks. Small data set contains the 41 flights of the nine bees that were also tested with uniform landmarks. Large dataset is extended by additional data and contains 79 flights from 16 bees at all.
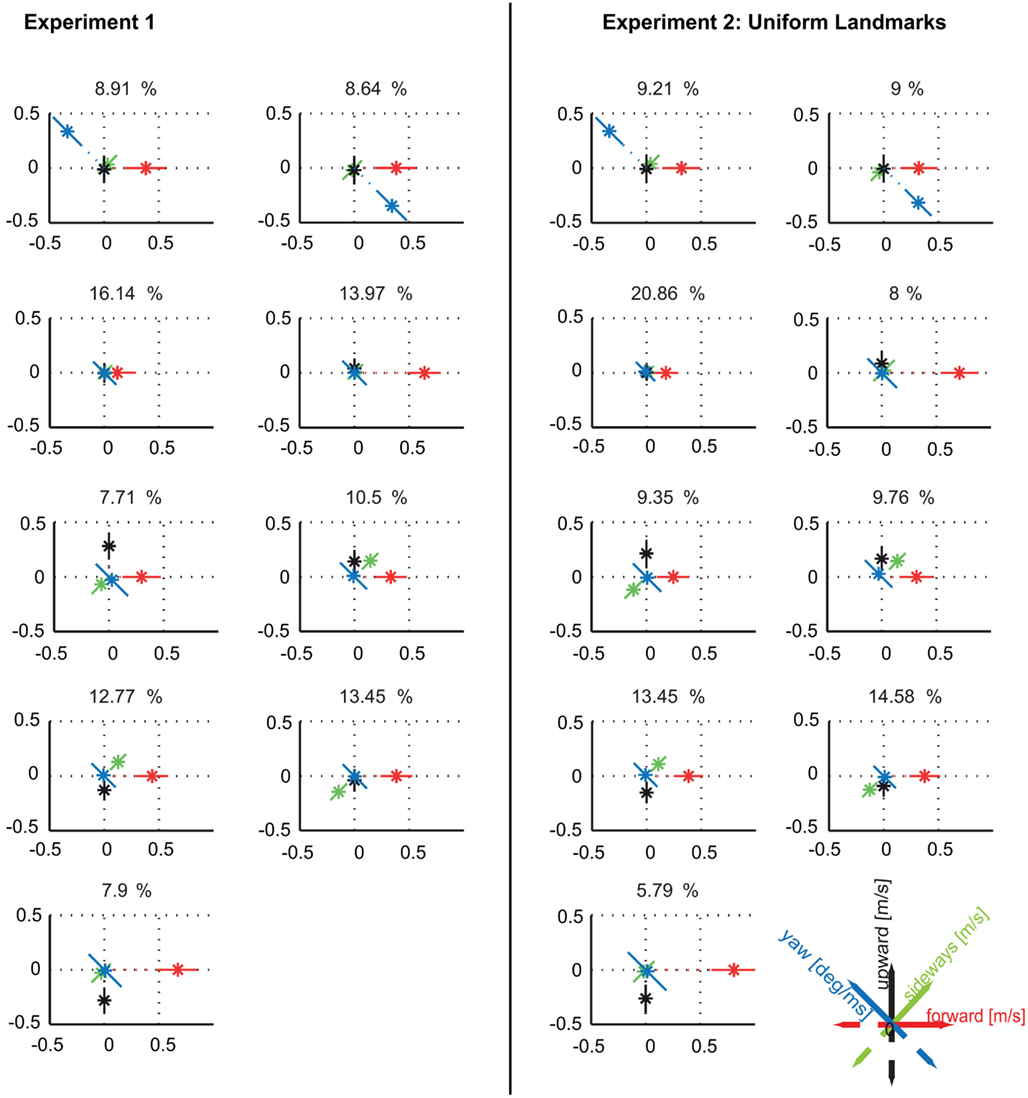
Figure A3. Comparison between prototypes resulting from clustering the data of experiment 1 and the data within the same condition (three uniformly red colored landmarks) of experiment 2. Clustering the independent data set of experiment 2 leads again to nine clusters providing the maximal quality and being sufficiently stable (data not shown). The resulting velocity prototypes are similar to those obtained in experiment 1. There are only quantitative differences in the relative occurrences of the velocity prototypes between the data sets which, however, do not affect our conclusions. The spatial probability distributions of occurrence of the different prototypes are also similar between the two experiments (Figure A5).
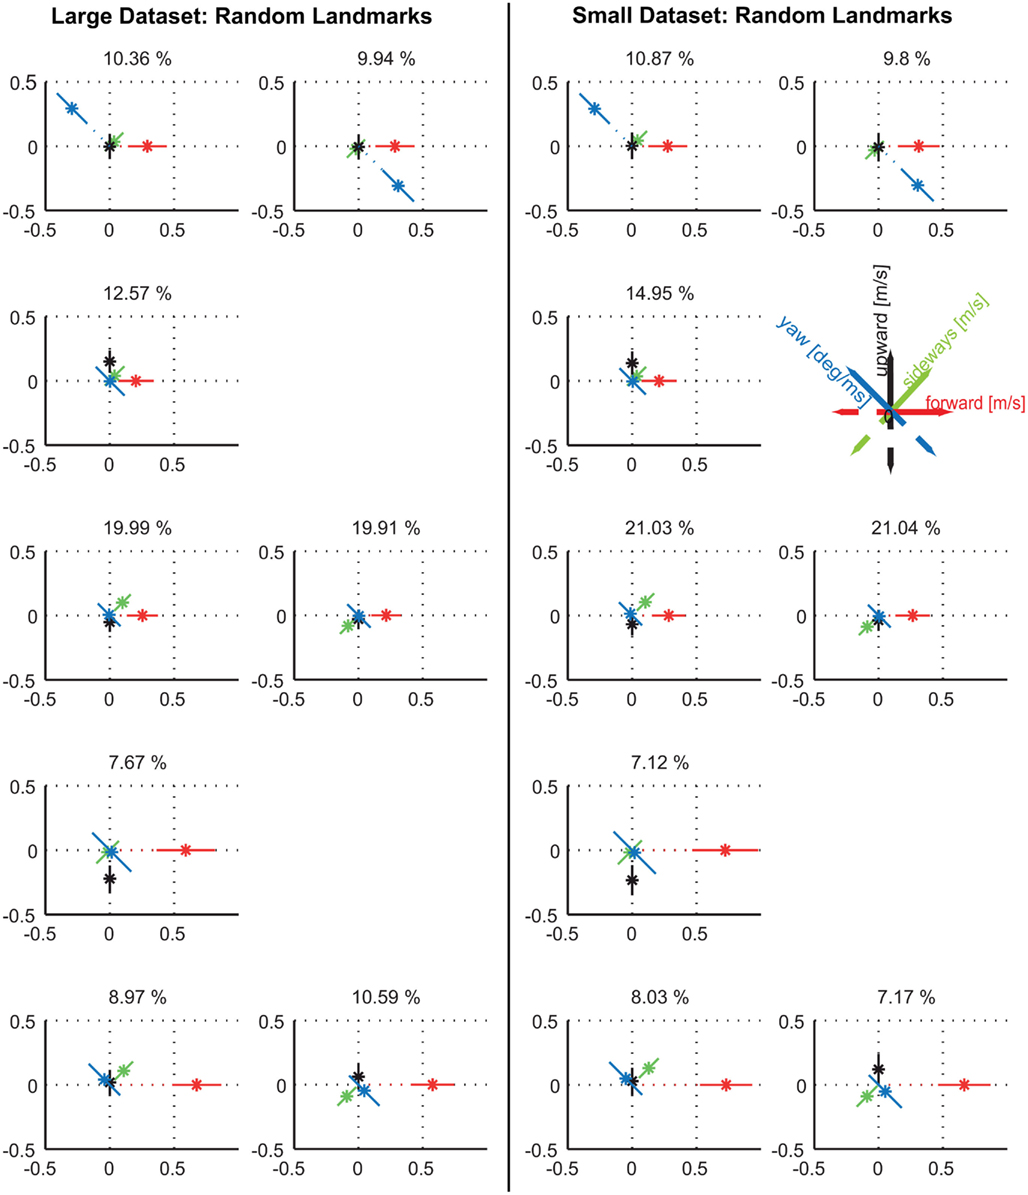
Figure A4. Comparison between prototypes resulting from all available 79 flights for the random texture condition (left) and the 41 flights of the nine individuals that were also tested with the uniformly red landmarks (right). Again, there are no qualitative differences within the prototypes themselves, but in details of the relative occurrences.
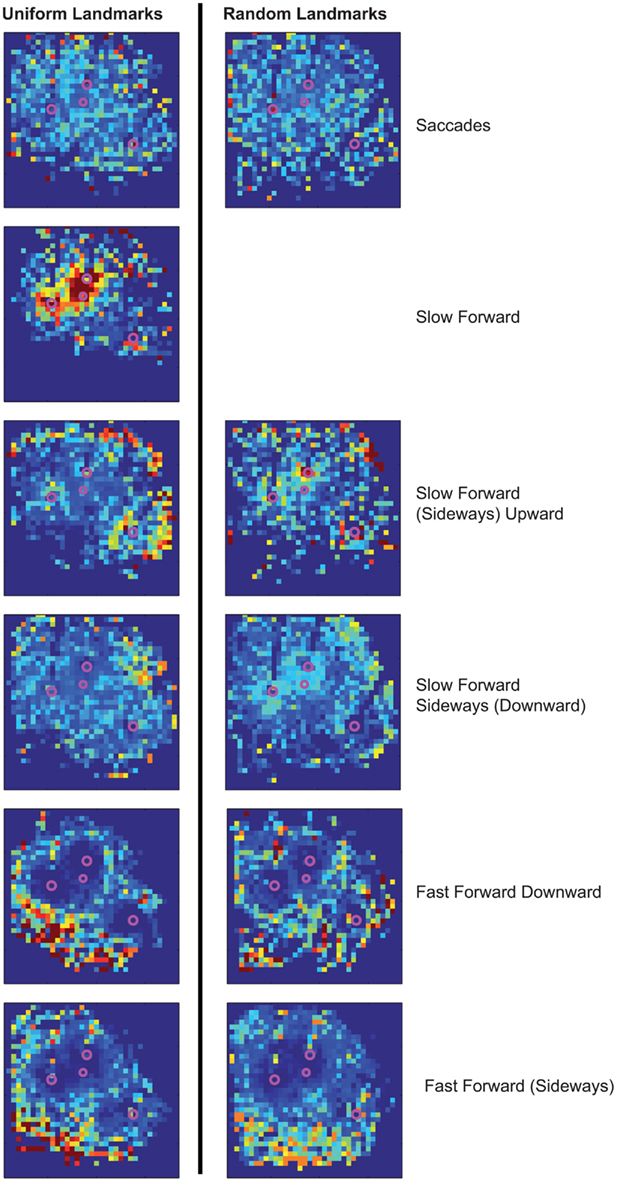
Figure A5. Spatial distributions of occurrence probabilities of the prototypes of experiment 2. There are no characteristic differences in the spatial distributions of occurrences of the prototypes in dependence on the landmark texture. The saccadic prototypes are rather equally distributed under both landmark conditions. During the intersaccadic intervals, the prototypical forward velocity mainly determines the probability distributions. Increasing forward velocity shifts the probability of occurrence to areas of larger distance to the landmarks. For the random landmarks, there is no prototype as concentrated near to the landmarks as for the uniform landmarks, because this Slow Forward prototype does not occur for randomly textured landmarks. Instead, the existing prototypes providing slow forward velocities occur more often very close to the landmarks than the remaining prototypes for the uniform landmarks.
Keywords: honeybee local navigation, prototypical movements, classification of behavior
Citation: Braun E, Dittmar L, Boeddeker N and Egelhaaf M (2012) Prototypical components of honeybee homing flight behavior depend on the visual appearance of objects surrounding the goal. Front. Behav. Neurosci. 6:1. doi: 10.3389/fnbeh.2012.00001
Received: 18 October 2011; Accepted: 03 January 2012;
Published online: 18 January 2012.
Edited by:
Martin Giurfa, Centre National de la Recherche Scientifi que – Université Paul Sabatier-Toulouse III, FranceReviewed by:
Thomas Collett, University of Sussex, UKAntoine Wystrach, Universite Paul Sabatier / University of Sussex, France
Copyright: © 2012 Braun, Dittmar, Boeddeker and Egelhaaf. This is an open-access article distributed under the terms of the Creative Commons Attribution Non Commercial License, which permits non-commercial use, distribution, and reproduction in other forums, provided the original authors and source are credited.
*Correspondence: Martin Egelhaaf, Department of Neurobiology, Bielefeld University, P.O. 100131, D-33501 Bielefeld, Germany. e-mail:bWFydGluLmVnZWxoYWFmQHVuaS1iaWVsZWZlbGQuZGU=