 Nastassja L. Fischer
 Rafael Peres
 Mario Fiorani
- 1Laboratory of Cognition Physiology, Institute of Biophysics Carlos Chagas Filho, Federal University of Rio de Janeiro, Rio de Janeiro, Brazil
- 2Department of Morphological Sciences, Medical School Souza Marques, Rio de Janeiro, Brazil
Social media has gained increasing importance in many aspects of everyday life, from building relationships to establishing collaborative networks between individuals worldwide. Sharing behavior is an essential part of maintaining these dynamic networks. However, the precise neural factors that could be related to sharing behavior in online communities remain unclear. In this study, we recorded electroencephalographic (EEG) oscillations of human subjects while they were watching short videos. The subjects were later asked to evaluate the videos based on how much they liked them and whether they would share them. We found that, at the population level, subjects watching videos that would not be shared had higher power spectral density (PSD) amplitudes in the theta band (4–8 Hz), primarily over the frontal and parietal sites of the right hemisphere, than subjects watching videos that would be shared. Previous studies have associated task disengagement with an increase in scalp-wide theta activation, which can be interpreted as a mind-wandering effect. This might suggest that the decision to not share the video may lead to a more automatic/effortless neural pattern. We also found that watching videos that would be shared was associated with lower PSD amplitudes in the alpha band (8–12 Hz) over the central and right frontal sites, and with more negative scores of frontal alpha asymmetry (FAA) index scores. These results may be related to previous work linking right-sided frontal EEG asymmetry to the pursuit of social conformity and avoidance of negative outcomes, such as social isolation. Finally, using support vector machine (SVM) algorithms, we show that these EEG parameters and preference rating scores can be used to improve the predictability of sharing information behavior. The information sharing-related EEG pattern described here could therefore improve our understanding of the neural markers associated with sharing behavior and contribute to studies about stimuli propagation.
Introduction
Being a member of a social group has been recognized as a crucial factor for human survival throughout the ages (Baumeister and Leary, 1995; Lieberman and Eisenberger, 2009) since it confers an evolutionary advantage by facilitating access to food and ensuring safety (Adolphs, 2009). People who have good social interaction skills are likely to have better opportunities and to adapt faster to an ever-changing environment. Social interaction involves sharing information with others, and is generally acknowledged as a core contemporary mechanism for innovation and human development (Scholz and Falk, in press). The emergence of online social networks over the past decade has boosted such social interactions. Social media networks can be defined as “a group of internet-based applications that build on the ideological and technological foundations of Web 2.0, and that allow the creation and exchange of user-generated content” (Kaplan and Haenlein, 2010:61). In a recent survey conducted by the Pew Research Center (2017), 76% of adult internet users from 40 countries stated that they used at least one type of social network. Content shared on social media platforms may influence human interaction on an individual and a broader societal level (Van Dijck, 2013). However, little is known about which personal variables, particularly neurophysiological factors, are involved in information sharing behavior. Most studies in this area rely on self-reported results and/or on content characteristics (Berger and Milkman, 2012; Stieglitz and Dang-Xuan, 2013; Ferrara and Yang, 2015). However, this type of approach does not account for implicit (unconscious) cognitive processes that could be involved in the sharing decision. Thus, there is a need for neuroscientific studies to uncover the fundamental mechanisms underlying information sharing.
Studies of the brain mechanisms that influence how ideas and information are propagated in online and offline environments are in their infancy (as reviewed by Falk and Bassett, 2017). Nevertheless, some empirical evidence from functional magnetic resonance imaging (fMRI) studies suggests that information sharing behavior is related to three primary domains: inferring the thoughts and desires of others (i.e., mentalizing), self-referential cognition and social reward processing (Meshi et al., 2015) and likely involves brain areas such as the temporoparietal junction (TPJ) and dorsomedial prefrontal cortex (dmPFC) in those processes (Falk et al., 2013; O’Donnell et al., 2015; Baek et al., 2017; Scholz et al., 2017). However, although fMRI has excellent millimeter-range spatial resolution and provides a good estimate of the location of neural processes, it has some disadvantages. For example, some authors already arose the issues about the role of fMRI hemodynamic signal as an indirect indicator of neural activity (Logothetis, 2008; Hari and Kujala, 2009) and the need of a sophisticated infrastructure to run fMRI experiments (Glover, 2011). The drawbacks of fMRI in combination with the relative paucity of neuroscientific studies about information sharing behavior using non-invasive neuroimaging techniques prompted us to investigate the use of electroencephalography (EEG) as an alternative method of correlating brain activity with sharing behavior.
EEG directly records brain activity at the millisecond (ms) level and is thus generally acknowledged to provide a direct measure of the dynamic interaction between different brain systems as they are occurring (Ward, 2003; Buzsáki and Draguhn, 2004; Lopes da Silva, 2013; Cohen, 2014). Additional advantages of EEG include its flexibility in accommodating a range of experimental designs and subjects (e.g., healthy subjects, patients and children); its portability, which permits analysis outside a laboratory setting; and its relatively low cost (Loo et al., 2015). EEG currents can be quantified and classified into five bands of differing frequency (also known as EEG rhythms): delta (1–4 Hz), theta (4–8 Hz), alpha (8–13 Hz), beta (14–30 Hz) and gamma (>30 and typically <100 Hz; Pizzagalli, 2007; Urigüen and Garcia-Zapirain, 2015). However, the precise range assigned to these bands can vary across studies (Klimesch, 1999; Wang et al., 2015). The standard method of quantifying frequency band oscillations is the power spectrum analysis or power spectral density (PSD), which describes the distribution of signal power at differing frequencies, or the “frequency content” of the signal (Dressler et al., 2004).
Substantial evidence supports the use of EEG to investigate how frequency band types are associated with particular cognitive processes. For example, studies have shown that theta and gamma rhythms are associated with memory processes such as retrieval and encoding (Klimesch, 1999; Nyhus and Curran, 2010), alpha and gamma rhythms are related to visual processing prioritization (Jensen et al., 2014), and whole-scalp gamma frequency synchronization is associated with consciousness (Doesburg et al., 2008). EEG parameters can also be useful for analyzing preference selection and predicting behavior. Vecchiato et al. (2011) found that theta-band activity in the right hemisphere was higher when participants watched videos they did not like compared with those they did like. Wang et al. (2016) showed that video commercials containing a structured narrative significantly affected the viewer’s product branding preference compared with other commercials and induced higher theta power in the left frontal and bilateral occipital regions and higher gamma power in the limbic system. Christoforou et al. (2017) demonstrated that analysis of beta and gamma EEG bands could successfully predict box-office performance of newly released movies. Finally, Park et al. (2018) analyzed EEGs to assess participants’ abilities to predict movie poster preferences of another participant about whom they had minimal information, and they discovered a time-frequency-related relationship between beta-band frequency at right temporal sites and prediction accuracy. Taken together, these studies support the utility of EEG recordings to study neural correlates of a range of behavioral outcomes.
Another widely used method in cognitive neuroscience studies of behavior is the use of indexes that combine two or more EEG variables (Vecchiato et al., 2011; Yener and Başar, 2013; Cheron et al., 2016). One example is frontal alpha asymmetry (FAA), which is defined as the difference between right and left alpha activity over frontal regions of the brain (Davidson et al., 1990) and is thought to be a measure of the propensity to adopt approaching vs. withdrawing behavior (Coan and Allen, 2004). More specifically, greater left frontal activity (lower alpha power) is associated with an increased tendency to approach or more intensely respond to affectively positive stimuli, whereas greater right frontal activity (or, possibly, lower left frontal brain activity) is associated with an increased tendency to withdraw or more intensely respond to affective negative stimuli. Thus, alterations in FAA detected by EEG can be correlated with emotional/motivational personality traits (Reznik and Allen, 2018). FAA has also been correlated with various aspects of social decision-making and empathy, pointing to a possible link between right hemisphere lateralization and social-oriented behaviors (Hecht, 2014). For example, Sabbagh and Flynn (2006) showed that mental state decoding skills (i.e., judgments about others’ psychological states) were stronger in those with right-sided compared with left-sided frontal alpha activation. Furthermore, the degree of relative right mid-frontal activation predicted performance on a mental decoding task. In another study, children who exhibited right-sided frontopolar EEG activity during an emotion-eliciting task showed empathic concern when they observed pain being expressed by the experimenter (Light et al., 2009). Similarly, Tullett et al. (2012) found that baseline measures of right frontal asymmetry were a significant predictor of empathic concern, as indicated by feelings of sadness. These authors suggested that higher right FAA might increase sensitivity towards others’ suffering. Since sharing behavior may involve inferring the thoughts and desires of others (Scholz and Falk, in press) and can also be related to motivation (approach vs. avoidance behavior), it is possible that FAA could also be associated with information sharing behavior.
Correlating EEG oscillations and indexes with specific cognitive, affective and decision-making tasks may allow us to better identify the types of information being processed with temporal precision. This information could be applied to brain–computer interface methods, which allow typically covert aspects of the mental state to be assessed with little-to-no interference on the task at hand (van Erp et al., 2015). EEG analysis could also be used to improve prediction of behavioral outcomes, since pre-existing judgments and socially presumed expectations have less influence on EEG oscillations than on traditional self-reported measures such as questionnaires (Telpaz et al., 2015).
Although information sharing is increasingly prevalent in the context of social media networks, little is known about its neural correlates. To address this, we explored brain parameters related to information sharing behavior by recording EEGs when subjects were watching short videos that they subsequently decided they would or would not share with others. This video-based approach has been used increasingly in neuroscience research in recent years (Ki et al., 2016). We then identified which EEG features differed when watching videos that would vs. would not be shared and applied a support vector machine (SVM) algorithm to identify the precise features could accurately predict information sharing behavior. Our goal was to improve our understanding of neural correlates of social-oriented behavioral patterns such as information sharing.
Materials and Methods
Subjects
The study consisted of two experiments. First we performed a pre-selection experiment in which a small cohort (n = 10, “Stimuli Selection” section) of subjects watched a large number of videos and then answered questions. Second based on their responses, the video pool was narrowed to 100 for viewing in the main experiment with a larger cohort (n = 23, “Stimuli Presentation and Experimental Design” section). The pre-selection cohort consisted of 5 men and 5 women aged 21–32 years (men 24.8 ± 3.7 years, women 24.1 ± 2.6 years, mean ± standard deviation [SD]). The cohort for the main experiment consisted of 23 additional subjects (12 men/11 women) aged 18–31 years (men 23.2 ± 3.50 years, women 23.1 ± 3.45 years).
All participants had a normal or corrected-to-normal vision; were not left-handed (assessed by the Edinburgh Handedness Inventory; Oldfield, 1971); and were free of diagnosed psychiatric disorders (assessed by the personal data formulary). We also only included participants with a Beck Depression Inventory score >18 to exclude subjects at risk for depression. Participants were unpaid volunteer undergraduate and graduate students at the Federal University of Rio de Janeiro. This study was carried out in accordance with the recommendations of the Comissão Nacional de Ética em Pesquisa (National Research Ethics Commission—CONEP). The protocol was approved by the Comitê de Ética em Pesquisa do Hospital Universitário Clementino Fraga Filho e da Faculdade de Medicina da Universidade Federal do Rio de Janeiro (Ethics Institutional Review Board of the University Hospital Clementino Fraga Filho and of the Medicine School of Federal University of Rio de Janeiro; protocol code: CAAE 02761212.0.0000.5257). All subjects gave written informed consent in accordance with the Declaration of Helsinki.
Stimuli Selection
The 10 participants each watched 252 short video clips one time. The videos were downloaded from YouTube.com and Vimeo.com and edited to a maximum length of 10 s. After watching each video, the participants were asked: (1) if they liked the video (“yes” or “no”); (2) how much they liked the video (1–5 Likert scale of liked/disliked); and (3) if they had seen the video before (“yes” or “no”). The videos were presented using Psychtoolbox Brainard (1997) for MATLAB (The MathWorks, Inc., Natick, MA, USA) in a soundproof room.
To select the final 100 videos to be used in the main experiment, we eliminated 25 videos that had previously been viewed by at least one subject. The remaining 227 videos were then ranked according to the frequency of “yes” answers to question (1) above. For the final selection, 25 videos were liked by 7–10 subjects, 50 were liked by 4–6 subjects and 25 were liked by 0–3 subjects. The final selection therefore included videos with a range of viewer preferences. Question (2) responses were not incorporated into the selection process because they reduced the final number of candidate videos to fewer than 100.
Stimuli Presentation and Experimental Design
The main experiment was performed as described for the pre-selection experiment with some modifications. Participants were monitored throughout using a video camera to ensure compliance with the experimental design. To minimize the possibility that the subjects had previously viewed the videos, we confirmed that the 100 videos had a low view count at the host websites. The number of visualizations varied between 1–553,260 views. In comparison, the most watched video in the year this study was performed had 301 million views1.
The main experiment consisted of two experimental designs, although the data were combined for analysis. The first cohort (n = 11; Figure 1A) viewed the videos and were then asked: (1) if they liked the video (“yes” or “no”); (2) how much they liked the video (Likert scale of liked/disliked, in which the number of yellow stars indicated how much participants liked the video and the number of red stars stated how much subjects disliked the video); (3) if they would share the video with another (“yes” or “no”); and (4) if they had seen the video before (“yes” or “no”). The second cohort (n = 12; Figure 1B) were shown the same videos but were asked only questions (2) through (4) in an effort to reduce the overall time taken for the task. In addition, the answer to question (2) (how much they liked the video) was changed from the Likert rating system to a color scale where red (score 0) indicated “not at all” and green (score 1) indicated “a lot” (Figure 1). The subjects were free to take as much time as necessary to answer the questions. The experimental design is shown in Figure 1.
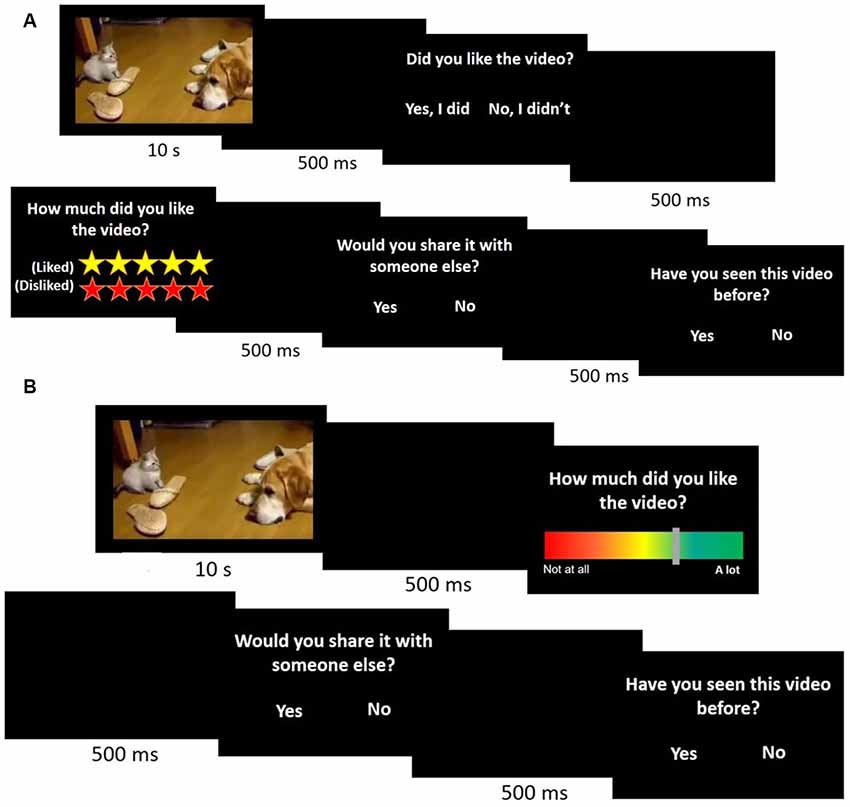
Figure 1. Main experimental design. A cohort of 23 participants watched 100 10-s videos and answered four (A, n = 11) or three (B, n = 12) questions immediately after viewing each one.
Behavioral Analysis
A non-parametric t-test (Mann-Whitney U test, two-tailed) was used to compare the “like” ratings of shared (S) vs. not shared (N-S) videos and the response times to answer the question “would you share the video?” We excluded response time outliers (greater than or equal to ±3 SD from the mean [n = 100]) and response times of <200 ms to avoid possible anticipation errors. We also recorded the sharing behavior of each participant based on the number of videos they decided to share. The behavioral analysis was performed using STATISTICA data analysis software, version 12 (StatSoft, Inc., Tulsa, OK, USA, 2014). p ≤ 0.05 was considered statistically significant.
EEG Data Acquisition and Pre-processing
EEGs were recorded using a BNT36 EEG model (EMSA®, Rio de Janeiro, RJ, Brazil) at the following positions of the 10–20 system: Fp1, Fp2, F7, F3, Fz, F4, F8, T7, C3, Cz, C4, T8, P7, P3, Pz, P4, P8, O1, Oz, O2, A2 and A1. 10-20 electrode paste (D.O. Weaver and Co., Aurora, CO, USA) was applied to each electrode before placing it on the scalp. Electrode impedance was ≤5 kOhms. EEG signals were acquired at a 600 Hz sampling rate.
Data were pre-processed using EEGLAB toolbox (Delorme and Makeig, 2004) for MATLAB. Continuous EEG data were filtered using a 0.1–45 Hz band-pass filter and re-referenced using the grand average reference algorithm as implemented in the EEGLAB routine. EEG epochs were extracted using a time window of 10.7 s (0.5 s pre-stimulus to 10.2 s post-stimulus) and were divided according to the start of each video. Noisy trials were removed by visual inspection. EEG data were decomposed into independent components (ICs) using the runica function implemented in EEGLAB. Components representing eye movements and/or muscle contractions were excluded by visual inspection to remove artifacts from the neural data.
EEG Data Analysis
EEG data analysis was performed using the MATLAB toolbox Fieldtrip (Oostenveld et al., 2011) and in-house MATLAB scripts. The PSD at each electrode was calculated in 1 Hz steps between 2 Hz and 30 Hz with a 7-cycle length sliding window and a single Hanning taper in 50 ms steps. This gave a decreasing time-window length as the frequency increased (e.g., 700 ms for 10 Hz and 350 ms for 20 Hz). For each channel, PSD values obtained during viewing of S and N-S videos were averaged for each EEG frequency band: (1) theta (4–8 Hz); (2) alpha (8–12 Hz); and (3) beta (12–20 Hz).
PSD values were log-transformed for group-level analysis. A cluster-based permutation test with a Monte Carlo approach (Maris and Oostenveld, 2007) was used to test for significant differences in PSD between the S (n = 316) and N-S (n = 1099) trials. Cluster-based statistics involves grouping of neighboring variables (here, t-values) into clusters and deriving characteristic values. In practice, values are only considered for inclusion in a cluster if they exceed a certain threshold (e.g., p value of <0.05 in univariate analysis). It is then possible to compute the clusters’ attributes and their associated probabilities (Pernet et al., 2015). Therefore, a t-statistic was calculated for each electrode for theta, alpha and beta frequency bands, with time averaged from 0 ms to 9000 ms during viewing of S and N-S videos. The final 1000 ms was not employed to eliminate possible artifacts caused by the anticipation of answering questions. Channel-frequency points with a t-value >95th percentile were retained. Adjacent frequency-channel points were clustered, and cluster statistics were calculated as the maximum sum of each cluster. A permutation test was then conducted, consisting of randomizing the trials for each condition (N or N-S) and recalculating a t-statistic. This procedure was repeated 2000 times. Finally, we obtained a reference distribution of cluster-based t-statistics and tested the distribution against the observed t-statistic. We also conducted a time-frequency analysis using cluster-based statistics as described before. Channel-frequency-time points with a t-value >95th percentile were retained.
For calculation of the FAA index, the normalized PSD of the alpha frequency band (8–12 Hz) from the left mid-frontal electrode F3 was subtracted from the right mid-frontal electrode F4 (lnPSD F4 − lnPSD F3). Because alpha power is inversely related to cortical activity (Gollan et al., 2014), a positive FAA index reflects greater left-sided frontal activity (lnPSD F3 > lnPSD F4); whereas negative values indicate greater right-sided activity (lnPSD F3 < lnPSD F4). The FAA index for S and N-S videos was compared using a permutation test.
Classification of EEG Data
To determine whether the EEG data can be used to classify sharing intention, we used a SVM with a linear kernel (C = 1) from a libSVM library (Chang and Lin, 2013). The utility of SVMs for classifying brain states has previously been demonstrated (Mourão-Miranda et al., 2005). Time-averaged power of each frequency band with a significant difference between S and N-S videos and FAA indexes were used as features. Classification was performed using all 1415 trials as samples. To account for the imbalance between the number of S (n = 316) and N-S (n = 1099) trials, oversampling was performed with the S condition using the synthetic minority over-sampling technique (SMOTE; Chawla et al., 2002). This method consists of creating synthetic data points by taking the vector between one of the k nearest neighbors in feature space (we worked with five nearest neighbors), multiplying it by a random number between 0 and 1 and adding this point to the sample to create a new one.
To determine whether the EEG data plus self-reported measures are helpful in assessing sharing intention, we compared SVM performed with a self-reported measure (like/dislike scores) as the sole feature with SVM performed with the self-reported measure plus EEG data (theta- and alpha-band PSDs and FAA index) as features. All performance measures were obtained in a 10-fold cross-validation, and feature sets were divided into 10 mutually disjointed training (final number = 1978) and test (final number = 220) sets. The results are reported as accuracy, the sum of true positive (TP) plus true negative (TN) cases divided by the number of sample instances; and F1-score, which is a weighted average of the precision and recall and is defined as F1 = 2*(precision * recall)/(precision + recall), where Precision = TP/(TP+FP) (with FP meaning “false positive”) and Recall = TP/(TP + FN) (with FN meaning “false negative”). F1 scores range from 0 (worst) to 1 (best). The significance of classification scores was assessed using a permutation test (Ojala and Garriga, 2009).
Results
Behavioral Results
The median frequency with which videos were shared was 23% (range 3%–41%). After exclusion of outliers, the median response to decide whether or not to share a video was 0.98 ± 0.67 s (±SD, n = 2200). The response time was significantly shorter to decide to not share a video vs. to share a video (0.74 ± 0.944 s [n = 1655] vs. 0.95 ± 0.945 s [n = 545]; Mann-Whitney test, U = 344,878, p < 0.001, r = −0.18). We also found that S videos were significantly more liked than N-S videos (median score 0.75 vs. 0.45 on a 0–1 scale; Mann-Whitney test, U = 78,572, p < 0.001, r = −0.62).
EEG Analysis: PSD and FAA
Differences between PSD oscillations (theta, alpha and beta) across frontal, central and parietal electrodes during viewing of S compared with N-S videos were assessed using non-parametric cluster-based permutation tests. No significant differences were detected for the time-frequency analysis. However, for channel-frequency (time averaged) analysis, significant differences were detected between S and N-S conditions. These differences were observed in midline-frontal and right parietal-occipital clusters for theta-band power (4–8 Hz) and in right-central frontal and right occipital clusters for alpha-band power (8–12 Hz; Figure 2). No significant differences were detected in beta-band clusters.
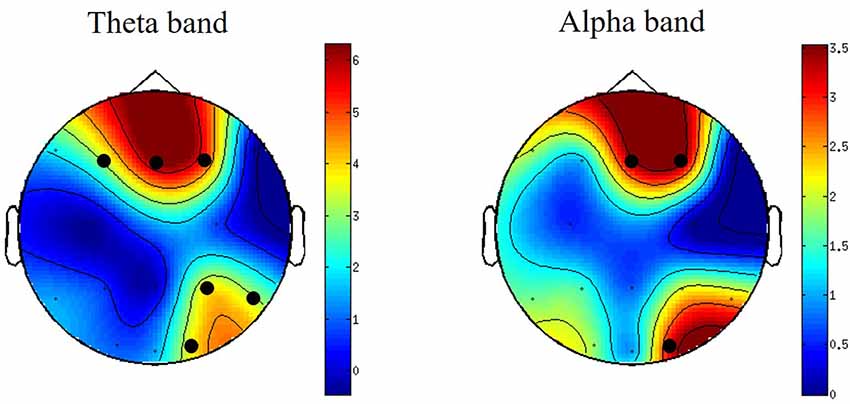
Figure 2. Topographically distributed independent-samples t-values for theta- and alpha-band power differences when watching S vs. N-S videos. For graphical purposes, the surface in between electrodes is interpolated to create scalp maps. Clusters with significant t-values are indicated by black circles. The colors bars indicate the t-values of the clusters. N = 23.
To examine the directionality of S vs. N-S-related changes in theta and alpha bands, we plotted the log-transformed PSD values for each electrode and computed their t- and p-values after correction for multiple comparisons (“Monte Carlo” method, 2000 randomizations). Theta-band, PSD values were significantly higher in the N-S condition, when compared with the S condition, for electrodes F3 (−0.24 vs. −0.29; t = 3.27, p = 0.018); Fz (−0.05 vs. −0.14; t = 6.34, p = 0.002); F4 (−0.22 vs. −0.31; t = 5.11, p = 0.002); P8 (−0.29 vs. −0.33; t = 3.16, p = 0.02); P4 (−0.34 vs. −0.38; t = 3.73, p = 0.004) and O2 (−0.05 vs. −0.11; t = 3.83, p = 0.004). Similarly, for alpha-band, PSD values were higher in the no-shared condition, when compared to the shared condition, for electrodes Fz (−0.03 vs. −0.09; t = 3.39, p = 0.010); F4 (−0.15 vs. −0.22; t = 3.53, p = 0.006) and O2 (0.01 vs. −0.04; t = 3.13, p = 0.022; Figure 3).
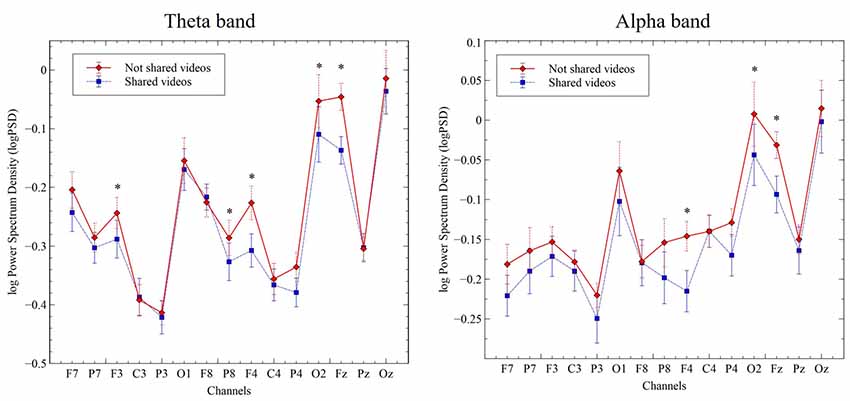
Figure 3. Change in log power spectral density (PSD; μV2/Hz) for the theta-band (4–8 Hz, left panel) and alpha-band (8–12 Hz, right panel) in the indicated channel clusters during viewing of S and N-S videos. Data represent the mean ± SEM. *p ≤ 0.05.
Since we observed significant differences in frontal alpha oscillations between the right and left hemispheres, the FAA index was computed. An independent-sample t-test showed a significant difference between S and N-S conditions (t = −4.95, p = 0.002, “Monte Carlo” method, 2000 times randomizations). A more negative FAA score obtained for viewing S videos compared with N-S videos (Figure 4), reflecting higher right frontal alpha activity.
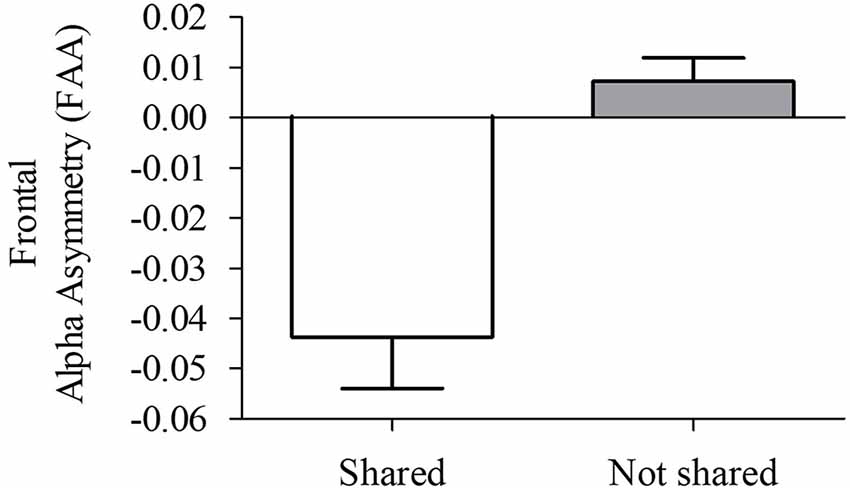
Figure 4. Frontal alpha asymmetry (FAA) index (lnPSD F4 − lnPSD F3) during viewing of S and N-S videos. Data are presented as the mean ± SEM (t = 4.95, p = 0.002). More negative FAA values reflect higher alpha activation in the right hemisphere when compared with the left hemisphere.
Classification Results
To determine whether the neural data obtained with our subjects could improve prediction of sharing intention, we compared classification models using SVM. Using only the pleasantness rating (self-reported variable) as a feature, our classifier accuracy was 78% and the F1 Score was 0.78 (F1 score reaches its best value at 1 and worst at 0, p < 0.01, permutation test, 100 iterations, Table 1; F1 scores of 1 and 0 reflect the best and worst scores, respectively). However, combining the self-reported ratings with the theta- and alpha-band PSDs and the FAA index as features increased the classifier accuracy to 81% and the F1 Score of 0.81 (p < 0.01, permutation test, 100 iterations), representing a significant improvement in the general accuracy of 3% (t = 2.75, p = 0.005, t-test between the predictions made by the two models using the test data, Table 2). These results suggest that neural markers may be useful parameters in evaluating sharing intention.
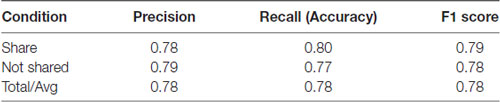
Table 1. Classification results using only pleasantness ratings (self-reported variable).
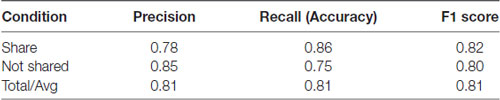
Table 2. Classification results using pleasantness ratings (self-reported variable) plus EEG parameters.
Discussion
In the present study, we investigated correlations between EEG-derived data and information sharing behavior, using viewing of videos that would or would not be shared as the model system. Time-frequency analysis was conducted revealing no significant differences between conditions (S vs. N-S videos). EEG channel-frequency analysis revealed that viewing of N-S videos resulted in higher PSD amplitudes in the theta band, primarily over bilateral frontal (F3, F4 and Fz), right parietal (P4 and P8) and right occipital (O2) sites and higher PSD amplitudes in the alpha band over central-right frontal sites (F4 and Fz) and right occipital (O2) sites compared with viewing of S videos. These data are consistent with the lower FAA index (i.e., higher right frontal brain activity) for viewing of S vs. NS videos. We also discovered that these EEG measures could aid in the prediction of sharing behavior. Using SVM, a machine-learning algorithm widely used in neuroscience applications (Quitadamo et al., 2017), we found that a self-reported variable in combination with theta PSD, alpha PSD and FAA index as features improved the prediction accuracy by 3% compared with the self-reported variable alone. Therefore, these data have identified an EEG oscillation pattern that can improve the prediction of information sharing behavior.
First we found that theta rhythms in bilateral frontal and right parietal and occipital sites were higher in N-S trials, when compared to the S trials. Previous studies have yielded conflicting evidence for the contribution of theta-band power to cognitive processes. Klimesch (1999) proposed that theta-band power could be negatively related to cognitive and memory performance and brain maturity, but in a complex and partly non-linear manner. The author states that within the theta frequency range, EEG power is negatively related to cognitive performance, whereas the theta reactivity (or more specifically theta synchronization) is related to a good cognitive performance and memory. Additional studies have shown that theta frequency activity is increased, especially at frontal sites, during cognitive activities that require attention or short-term memory, such as mental arithmetic and working memory load tasks, which indicates a possible role of theta oscillations in working memory maintenance (reviewed by Scheeringa et al., 2008). This also hints at the possibility that information sharing behavior might be associated with higher theta amplitudes, particularly at frontal sites, since this behavior demands engagement of higher cognitive processes. Falk and Scholz (2018) noted that the decision to share information would require increased externalized attention, given that this behavior involves integration of brain processes related to stimuli value computation, self-related relevance and inference of another’s state-of-mind. However, other studies have shown that more generalized theta rhythm activation pattern (i.e., not restricted at frontal sites) can be related to more automatic processes and diminished attentional efforts. Braboszcz and Delorme (2011) showed that among participants performing a breath-counting task, generalized theta EEG activity, especially within occipital and parieto-central regions, was increased during mind-wandering moments. Thus, higher theta activity could reflect decreased alertness and sensory processing when participants are disengaged from the task at hand. Hermens et al. (2005) demonstrated that patients with attention deficit hyperactivity disorder displayed higher theta power that correlated with poorer performance in an attentional (oddball) task compared with control subjects. Lin et al. (2016) also demonstrated a relationship between higher theta power and declining attentional effort and worsening of task performance. Based on these observations, we suggest that in our study, the higher theta PSD pattern along right frontal, parietal and occipital sites and the lower response times associated with the decision to not share a video reflect a lower cognitive demand, thereby generating a quicker and more automatic decision.
We also found that right frontal alpha rhythms are associated with information sharing intention. EEG alpha rhythms, which were first identified by Berger (1929), have been interpreted by some authors to be an “idling” rhythm with a diminished amplitude when the eyes are opened or mental activity is engaged (Laufs et al., 2003). Consequently, high and low alpha power is typically associated with low and high mental activity, respectively (Goldman et al., 2002). It has been shown that frontal asymmetries have physiological relevance for inferring emotional behavioral patterns (for an extensive review, see Harmon-Jones et al., 2010; Smith et al., 2017) and are involved in motivation driven-behaviors. Given this, our finding of alpha power asymmetry prompted us to compare the FAA indexes obtained under S vs. N-S video viewing conditions. We found that FAA scores were more negative (higher right frontal brain activity) when viewing S compared with N-S videos, which was somewhat surprising because one might expect information sharing behavior to be more associated with approach-related behavior and thus with higher frontal left-brain activity (Coan and Allen, 2003). Various studies have shown that information sharing decisions and successful persuasive or influential behavior involve increased activity in “valuation network”-related brain areas, such as the ventral striatum and ventromedial prefrontal cortex (vmPFC; Falk et al., 2013; Baek et al., 2017; Scholz et al., 2017). In addition, it has been proposed that there may be some intrinsic reward or positive value in information sharing (Tamir and Mitchell, 2012; Falk et al., 2013). However, it is important to note that the value assigned to a particular choice or action is subjective and involves a range of features dependent on the individual and social context. The brain’s value system may thus be involved in tracking non-compliance vs. conformity with group opinion rather than simply the stimulus value. Indeed, some evidence suggests that the brain initially computes convergence and divergence with group opinion as the main goal (Falk and Scholz, 2018). Schnuerch and Pfattheicher (2017) showed that susceptibility to social influence (e.g., social conformity) is mainly guided by higher punishment sensitivity and chronic avoidance behavior. Thus, the pressure to conform is related to avoidance of detrimental consequences of disagreement. These authors also showed that the tendency to adopt the group’s response was negatively associated with FAA, indicating that stronger right hemisphere activation is associated with higher social conformity. This finding supports the notion that social conformity is guided by avoidance-related rather than approach-seeking behavior. Our finding that higher right frontal brain activity is related to information sharing behavior is therefore consistent with the hypothesis that information sharing is driven by social conformity and avoidance of negative outcomes of non-compliance with a larger group, such as social isolation. However, further research is necessary to assess the contribution of reward vs. punishment processes to information sharing behavior.
A third finding of our study is that EEG data features combined with a subjective variable (like/dislike score) improved the accuracy of information sharing intention by 3% compared with the subjective variable alone. Other authors have examined the predictive value of neuronal activity parameters using videos as the stimuli. For example, Dmochowski et al. (2014) examined EEG parameters for subjects who viewed a recorded television broadcast and used inter-subject correlation analysis to analyze the association between EEG parameters and social media metrics (viewership size and tweet frequency rates). They found that the social media interactions during commercial breaks could predict the preference rating for each advertisement after broadcasting. Similarly, Boksem and Smidts (2015) compared the ability of neural measures and traditional self-stated preference measures to predict the box-office success of movies. Their results indicated that overall beta and gamma activity in EEGs provided predictive information about individual preferences and population-wide success, respectively. Although the predictive power of the neuronal measures was small (explained variance <2%), the magnitude is comparable to the 3% improvement we obtained here. Interestingly, several recent studies have discussed the use of neurophysiological measures to improve brain state classification and its potential applications in brain-machine interfaces and prediction of behavioral outcomes (Hettich et al., 2016; Gauba et al., 2017; So et al., 2017; Zhao et al., 2018). Our work therefore provides additional support for the utility of EEG features in improving prediction of information sharing intention.
Our study has several limitations. First, we couldn’t detect significant differences regarding time-frequency analysis between S vs. N-S videos. We suspect that this negative result happened because we conducted our analysis concerning the answers that were given to each trial (video). It means the trials within each condition were heterogeneous regarding the videos they contained. It could lead to more complex frequency oscillations patterns through time which could reduce the chances to observe subtle effects between the two conditions (S vs. N-S). We also suspect that movement-related artifacts due to the long experimental sessions could have contributed to blur possible time-frequency effects that might have arisen. Second, recording of EEGs for sustained periods (>40 min in our study) when head movements are not restricted can increase the number of artifacts. This effect is exacerbated by low electrode density recordings (<64 electrodes) because it limits the number of artifacts that can be discarded after independent component analysis (ICA) and increases the removal of noisier epochs and even whole channels. Here, we used 21 channels and rejected 37.7% of trials, which is comparable to the 25% trial rejection rate of Braboszcz and Delorme (2011), using 128 channels and long (20 s) trials of a simple breath-counting task. Nevertheless, the 3% predictive improvement in our study, which could potentially be improved using high-density recordings, demonstrates the power of EEG measures as potential candidates to explain sharing behavior outcomes. Third, this was an exploratory study without a priori assumption evaluate traditional neural markers. Our only goal was to determine whether the three frequency bands (theta, alpha and beta) might be involved in information sharing decisions, and we had no preconceived expectations of what we might observe. This approach can increase the number of statistical comparisons leading to type I error. However, we addressed this issue by implementing nonparametric permutation testing as described by Maris and Oostenveld (2007), which accounts for issues related to the multiple comparison problem, especially in exploratory studies.
Despite its limitations, the present study makes several valuable contributions to the understanding of social neuroscience dynamics. As stated earlier, the sense of belonging to a society and social coordination is critical for human well-being and survival (Baumeister and Leary, 1995; Lieberman and Eisenberger, 2009). Influencing opinions and ideas is a core mechanism by which different groups interact and communicate. Consequently, diverse social, emotional and cognitive processes must be integrated, often without conscious awareness, when sharing information. Combining neural activity and behavioral measures with computational approaches can help to integrate and understand the underlying mechanisms that drive information sharing behavior, and thus improve the predictive ability of statistical models of sharing. This powerful knowledge has applications in domains such as marketing research (Berns et al., 2010; Ohme et al., 2010; Pozharliev et al., 2017), economic decisions (Camerer, 2008; Weber and Johnson, 2009) and social media and public health campaigns (Falk et al., 2010, 2012, 2015; Cascio et al., 2013). In conclusion, our identification of neural markers related to sharing information behavior may improve our understanding of the underlying motives and mechanisms of such behavior. We also demonstrate that analysis of neural oscillations in message propagation research can improve the predictive strength of self-reported measures.
Author Contributions
NF and MF designed the study. NF performed the experiments and interpreted the results. NF and RP pre-processed the data and wrote the article. NF, RP and MF analyzed the data. MF reviewed and contributed to the final version. All authors read and approved the submitted version.
Funding
This work was supported by the Conselho Nacional de Desenvolvimento Científico e Tecnológico (CNPq; National Council for Scientific and Technological Development; Grant/Award Number: 471.166/2013-8), the Fundação Carlos Chagas Filho de Amparo à Pesquisa do Estado do Rio de Janeiro (FAPERJ; the Carlos Chagas Filho Foundation for Research Support in Rio de Janeiro; Grant/Award Number: E-26/110.905/2013, E-26/210.917/2016), and the Financiadora de Estudos e Projetos (FINEP; Funding Authority for Studies and Projects; Grant/Award Number: PEC20150).
Conflict of Interest Statement
The authors declare that the research was conducted in the absence of any commercial or financial relationships that could be construed as a potential conflict of interest.
Acknowledgments
We would like to thank Ana Elena Vedoveli, Bruno Massa, Lucas Coutinho, Luiza Volpi and Marllon Ricardo Barbosa for the technical assistance provided during experimental procedures. We also thank Dr. Billy Edving Muniz do Nascimento and Dr. Agustin Ibañez for the valuable insights into the experimental design.
Footnotes
References
Adolphs, R. (2009). The social brain: neural basis of social knowledge. Annu. Rev. Psychol. 60, 693–716. doi: 10.1146/annurev.psych.60.110707.163514
Baek, E. C., Scholz, C., O’Donnell, M. B., and Falk, E. B. (2017). The value of sharing information: a neural account of information transmission. Psychol. Sci. 28, 851–861. doi: 10.1177/0956797617695073
Baumeister, R. F., and Leary, M. R. (1995). The need to belong: desire for interpersonal attachments as a fundamental human motivation. Psychol. Bull. 117, 497–529. doi: 10.1037/0033-2909.117.3.497
Berger, H. (1929). Uber das elektroenkephalogramm des menschen. Arch. Psychatrie 87, 527–570. doi: 10.1007/BF01797193
Berger, J., and Milkman, K. L. (2012). What makes online content viral? J. Mark. Res. 49, 192–205. doi: 10.1509/jmr.10.0353
Berns, G. S., Capra, C. M., Moore, S., and Noussair, C. (2010). Neural mechanisms of the influence of popularity on adolescent ratings of music. Neuroimage 49, 2687–2696. doi: 10.1016/j.neuroimage.2009.10.070
Boksem, M. A. S., and Smidts, A. (2015). Brain responses to movie trailers predict individual preferences for movies and their population-wide commercial success. J. Mark. Res. 52, 482–492. doi: 10.1509/jmr.13.0572
Braboszcz, C., and Delorme, A. (2011). Lost in thoughts: neural markers of low alertness during mind wandering. Neuroimage 54, 3040–3047. doi: 10.1016/j.neuroimage.2010.10.008
Brainard, D. H. (1997). The psychophysics toolbox. Spat. Vis. 10, 433–436. doi: 10.1163/156856897x00357
Buzsáki, G., and Draguhn, A. (2004). Neuronal oscillations in cortical networks. Science 304, 1926–1929. doi: 10.1126/science.1099745
Camerer, C. F. (2008). “Neuroeconomics: using neuroscience to make economic predictions,” in The Philosophy of Economics: An Anthology, ed. D. M. Hausman (Cambridge: Cambridge University Press), 356–377.
Cascio, C. N., Cin, S. D., and Falk, E. B. (2013). “Health communications: predicting behavior change from the brain,” in Social Neuroscience and Public Health: Foundations for the Science of Chronic Disease Prevention, ed. P. A. Hall (New York, NY: Springer), 57–72.
Chang, C.-C., and Lin, C.-J. (2013). LIBSVM: a library for support vector machines. ACM Trans. Intell. Syst. Technol. 2, 1–27.doi: 10.1145/1961189.1961199
Chawla, N. V., Bowyer, K. W., Hall, L. O., and Kegelmeyer, W. P. (2002). SMOTE: synthetic minority over-sampling technique. J. Artif. Intell. Res. 16, 321–357. doi: 10.1613/jair.953
Cheron, G., Petit, G., Cheron, J., Leroy, A., Cebolla, A., Cevallos, C., et al. (2016). Brain oscillations in sport: toward EEG biomarkers of performance. Front. Psychol. 7:246. doi: 10.3389/fpsyg.2016.00246
Christoforou, C., Papadopoulos, T. C., Constantinidou, F., and Theodorou, M. (2017). Your brain on the movies: a computational approach for predicting box-office performance from viewer’s brain responses to movie trailers. Front. Neuroinform. 11:72. doi: 10.3389/fninf.2017.00072
Coan, J. A., and Allen, J. J. B. (2003). “The state and trait nature of frontal EEG asymmetry in emotion,” in The Asymmetrical Brain, eds K. Hugdahl and R. J. Davidson (Cambridge, MA: MIT Press), 565–615.
Coan, J. A., and Allen, J. J. B. (2004). Frontal EEG asymmetry as a moderator and mediator of emotion. Biol. Psychol. 67, 7–50. doi: 10.1016/j.biopsycho.2004.03.002
Cohen, M. X. (2014). Analyzing Neural Time Series Data: Theory and Practice. Cambridge, MA: The MIT Press.
Davidson, R. J., Ekman, P., Saron, C. D., Senulis, J. A., and Friesen, W. V. (1990). Approach-withdrawal and cerebral asymmetry: emotional expression and brain physiology: I. J. Pers. Soc. Psychol. 58, 330–341. doi: 10.1037/0022-3514.58.2.330
Delorme, A., and Makeig, S. (2004). EEGLAB: an open source toolbox for analysis of single-trial EEG dynamics including independent component analysis. J. Neurosci. Methods 134, 9–21. doi: 10.1016/j.jneumeth.2003.10.009
Dmochowski, J. P., Bezdek, M. A., Abelson, B. P., Johnson, J. S., Schumacher, E. H., and Parra, L. C. (2014). Audience preferences are predicted by temporal reliability of neural processing. Nat. Commun. 5:4567. doi: 10.1038/ncomms5567
Doesburg, S. M., Roggeveen, A. B., Kitajo, K., and Ward, L. M. (2008). Large-scale gamma-band phase synchronization and selective attention. Cereb. Cortex 18, 386–396. doi: 10.1093/cercor/bhm073
Dressler, O., Schneider, G., Stockmanns, G., and Kochs, E. F. (2004). Awareness and the EEG power spectrum: analysis of frequencies. Br. J. Anaesth. 93, 806–809. doi: 10.1093/bja/aeh270
Falk, E. B., and Bassett, D. S. (2017). Brain and social networks: fundamental building blocks of human experience. Trends Cogn. Sci. 21, 674–690. doi: 10.1016/j.tics.2017.06.009
Falk, E. B., Berkman, E. T., and Lieberman, M. D. (2012). From neural responses to population behavior: neural focus group predicts population-level media effects. Psychol. Sci. 23, 439–445. doi: 10.1177/0956797611434964
Falk, E. B., Berkman, E. T., Mann, T., Harrison, B., and Lieberman, M. D. (2010). Predicting persuasion-induced behavior change from the brain. J. Neurosci. 30, 8421–8424. doi: 10.1523/JNEUROSCI.0063-10.2010
Falk, E. B., Morelli, S. A., Welborn, B. L., Dambacher, K., and Lieberman, M. D. (2013). Creating buzz: the neural correlates of effective message propagation. Psychol. Sci. 24, 1234–1242. doi: 10.1177/0956797612474670
Falk, E. B., O’Donnell, M. B., Cascio, C. N., Tinney, F., Kang, Y., Lieberman, M. D., et al. (2015). Self-affirmation alters the brain’s response to health messages and subsequent behavior change. Proc. Natl. Acad. Sci. U S A 112, 1977–1982. doi: 10.1073/pnas.1500247112
Falk, E., and Scholz, C. (2018). Persuasion, influence, and value: perspectives from communication and social neuroscience. Annu. Rev. Psychol. 69, 329–356. doi: 10.1146/annurev-psych-122216-011821
Ferrara, E., and Yang, Z. (2015). Measuring emotional contagion in social media. PLoS One 10:e0142390. doi: 10.1371/journal.pone.0142390
Gauba, H., Kumar, P., Roy, P. P., Singh, P., Dogra, D. P., and Raman, B. (2017). Prediction of advertisement preference by fusing EEG response and sentiment analysis. Neural Netw. 92, 77–88. doi: 10.1016/j.neunet.2017.01.013
Glover, G. H. (2011). Overview of functional magnetic resonance imaging. Neurosurg. Clin. N. Am. 22, 133–139. doi: 10.1016/j.nec.2010.11.001
Goldman, R. I., Stern, J. M., Engel, J. Jr., and Cohen, M. S. (2002). Simultaneous EEG and fMRI of the alpha rhythm. Neuroreport 13, 2487–2492. doi: 10.1097/01.wnr.0000047685.08940.d0
Gollan, J. K., Hoxha, D., Chihade, D., Pflieger, M. E., Rosebrock, L., and Cacioppo, J. (2014). Frontal alpha EEG asymmetry before and after behavioral activation treatment for depression. Biol. Psychol. 99, 198–208. doi: 10.1016/j.biopsycho.2014.03.003
Hari, R., and Kujala, M. V. (2009). Brain basis of human social interaction: from concepts to brain imaging. Physiol. Rev. 89, 453–479. doi: 10.1152/physrev.00041.2007
Harmon-Jones, E., Gable, P. A., and Peterson, C. K. (2010). The role of asymmetric frontal cortical activity in emotion-related phenomena: a review and update. Biol. Psychol. 84, 451–462. doi: 10.1016/j.biopsycho.2009.08.010
Hecht, D. (2014). Cerebral lateralization of pro- and anti-social tendencies. Exp. Neurobiol. 23, 1–27. doi: 10.5607/en.2014.23.1.1
Hermens, D. F., Soei, E. X. C., Clarke, S. D., Kohn, M. R., Gordon, E., and Williams, L. M. (2005). Resting EEG theta activity predicts cognitive performance in attention-deficit hyperactivity disorder. Pediatr. Neurol. 32, 248–456. doi: 10.1016/j.pediatrneurol.2004.11.009
Hettich, D. T., Bolinger, E., Matuz, T., Birbaumer, N., Rosenstiel, W., and Spüler, M. (2016). EEG responses to auditory stimuli for automatic affect recognition. Front. Neurosci. 10:244. doi: 10.3389/fnins.2016.00244
Jensen, O., Gips, B., Bergmann, T. O., and Bonnefond, M. (2014). Temporal coding organized by coupled alpha and gamma oscillations prioritize visual processing. Trends Neurosci. 37, 357–369. doi: 10.1016/j.tins.2014.04.001
Kaplan, A. M., and Haenlein, M. (2010). Users of the world, unite! The challenges and opportunities of Social Media. Bus. Horiz. 53, 59–68. doi: 10.1016/j.bushor.2009.09.003
Ki, J. J., Kelly, S. P., and Parra, L. C. (2016). Attention strongly modulates reliability of neural responses to naturalistic narrative stimuli. J. Neurosci. 36, 3092–3101. doi: 10.1523/JNEUROSCI.2942-15.2016
Klimesch, W. (1999). EEG alpha and theta oscillations reflect cognitive and memory performance: a review and analysis. Brain Res. Rev. 29, 169–195. doi: 10.1016/s0165-0173(98)00056-3
Laufs, H., Kleinschmidt, A., Beyerle, A., Eger, E., Salek-Haddadi, A., Preibisch, C., et al. (2003). EEG-correlated fMRI of human alpha activity. Neuroimage 19, 1463–1476. doi: 10.1016/s1053-8119(03)00286-6
Lieberman, M. D., and Eisenberger, N. I. (2009). Neuroscience: pains and pleasures of social life. Science 323, 890–891. doi: 10.1126/science.1170008
Light, S. N., Coan, J. A., Zahn-Waxler, C., Frye, C., Goldsmith, H. H., and Davidson, R. J. (2009). Empathy is associated with dynamic change in prefrontal brain electrical activity during positive emotion in children. Child Dev. 80, 1210–1231. doi: 10.1111/j.1467-8624.2009.01326.x
Lin, C. T., Chuang, C. H., Kerick, S., Mullen, T., Jung, T. P., Ko, L. W., et al. (2016). Mind-wandering tends to occur under low perceptual demands during driving. Sci. Rep. 6:21353. doi: 10.1038/srep21353
Logothetis, N. K. (2008). What we can do and what we cannot do with fMRI. Nature 453, 869–878. doi: 10.1038/nature06976
Loo, S. K., Lenartowicz, A., and Makeig, S. (2015). Research review: use of EEG biomarkers in child psychiatry research—current state and future directions. J. Child Psychol. Psychiatry 1, 4–17. doi: 10.1111/jcpp.12435
Lopes da Silva, F. (2013). EEG and MEG: relevance to neuroscience. Neuron 80, 1112–1128. doi: 10.1016/j.neuron.2013.10.017
Maris, E., and Oostenveld, R. (2007). Nonparametric statistical testing of EEG- and MEG-data. J. Neurosci. Methods 164, 177–190. doi: 10.1016/j.jneumeth.2007.03.024
Meshi, D., Tamir, D. I., and Heekeren, H. R. (2015). The emerging neuroscience of social media. Trends Cogn. Sci. 19, 771–782. doi: 10.1016/j.tics.2015.09.004
Mourão-Miranda, J., Bokde, A. L. W., Born, C., Hampel, H., and Stetter, M. (2005). Classifying brain states and determining the discriminating activation patterns: support Vector Machine on functional MRI data. Neuroimage 28, 980–995. doi: 10.1016/j.neuroimage.2005.06.070
Nyhus, E., and Curran, T. (2010). Functional role of gamma and theta oscillations in episodic memory. Neurosci. Biobehav. Rev. 34, 1023–1035. doi: 10.1016/j.neubiorev.2009.12.014
O’Donnell, M. B., Falk, E. B., and Lieberman, M. D. (2015). Social in, social out: how the brain responds to social language with more social language. Commun. Monogr. 82, 31–63. doi: 10.1080/03637751.2014.990472
Ohme, R., Reykowska, D., Wiener, D., and Choromanska, A. (2010). Application of frontal EEG asymmetry to advertising research. J. Econ. Psychol. 31, 785–793. doi: 10.1016/j.joep.2010.03.008
Ojala, M., and Garriga, G. C. (2009). “Permutation tests for studying classifier performance,” in Proceedings—IEEE International Conference on Data Mining, ICDM (Miami, FL), 908–913. doi: 10.1109/icdm.2009.108
Oldfield, R. C. (1971). The assessment and analysis of handedness: the Edinburgh inventory. Neuropsychologia 9, 97–113. doi: 10.1016/0028-3932(71)90067-4
Oostenveld, R., Fries, P., Maris, E., and Schoffelen, J. M. (2011). FieldTrip: open source software for advanced analysis of MEG, EEG, and invasive electrophysiological data. Comput. Intell. Neurosci. 2011:156869. doi: 10.1155/2011/156869
Park, J., Kim, H., Sohn, J.-W., Choi, J., and Kim, S.-P. (2018). EEG beta oscillations in the temporoparietal area related to the accuracy in estimating others’ preference. Front. Hum. Neurosci. 12:43. doi: 10.3389/fnhum.2018.00043
Pernet, C. R., Latinus, M., Nichols, T. E., and Rousselet, G. A. (2015). Cluster-based computational methods for mass univariate analyses of event-related brain potentials/fields: a simulation study. J. Neurosci. Methods 250, 85–93. doi: 10.1016/j.jneumeth.2014.08.003
Pew Research Center. (2017). Demographics of internet and home broadband usage in the United States | Pew Research Center. Pew Res. Cent. Available at: http://www.pewinternet.org/fact-sheet/internet-broadband/
Pizzagalli, D. A. (2007). “Electroencephalography and high-density electrophysiological source localization,” in Handbook of Psychophysiology, eds J. T. Cacioppo, L. G. Tassinary and G. G. Berntson (New York, NY: Cambridge University Press), 56–84. doi: 10.1017/CBO9780511546396.003
Pozharliev, R., Verbeke, W. J. M. I., and Bagozzi, R. P. (2017). Social consumer neuroscience: neurophysiological measures of advertising effectiveness in a social context. J. Advert. 46, 351–362. doi: 10.1080/00913367.2017.1343162
Quitadamo, L. R., Cavrini, F., Sbernini, L., Riillo, F., Bianchi, L., Seri, S., et al. (2017). Support vector machines to detect physiological patterns for EEG and EMG-based human-computer interaction: a review. J. Neural Eng. 14:011001. doi: 10.1088/1741-2552/14/1/011001
Reznik, S. J., and Allen, J. J. B. (2018). Frontal asymmetry as a mediator and moderator of emotion: an updated review. Psychophysiology 55:e12965. doi: 10.1111/psyp.12965
Sabbagh, M. A., and Flynn, J. (2006). Mid-frontal EEG alpha asymmetries predict individual differences in one aspect of theory of mind: mental state decoding. Soc. Neurosci. 1, 299–308. doi: 10.1080/17470910601029163
Scheeringa, R., Bastiaansen, M. C. M., Petersson, K. M., Oostenveld, R., Norris, D. G., and Hagoort, P. (2008). Frontal theta EEG activity correlates negatively with the default mode network in resting state. Int. J. Psychophysiol. 67, 242–251. doi: 10.1016/j.ijpsycho.2007.05.017
Schnuerch, R., and Pfattheicher, S. (2017). Motivated malleability: frontal cortical asymmetry predicts the susceptibility to social influence. Soc. Neurosci. 13, 1–15. doi: 10.1080/17470919.2017.1355333
Scholz, C., Baek, E. C., O’Donnell, M. B., Kim, H. S., Cappella, J. N., and Falk, E. B. (2017). A neural model of valuation and information virality. Proc. Natl. Acad. Sci. U S A 114, 2881–2886. doi: 10.1073/pnas.1615259114
Scholz, C., and Falk, E. B. (in press). “The neuroscience of information sharing,” in Handbook of Communication in the Networked Age, eds S. González-Bailón and B. Foucault Welles (Oxford: Oxford University Press).
Smith, E. E., Reznik, S. J., Stewart, J. L., and Allen, J. J. B. (2017). Assessing and conceptualizing frontal EEG asymmetry: an updated primer on recording, processing, analyzing, and interpreting frontal alpha asymmetry. Int. J. Psychophysiol. 111, 98–114. doi: 10.1016/j.ijpsycho.2016.11.005
So, W. K. Y., Wong, S. W. H., Mak, J. N., and Chan, R. H. M. (2017). An evaluation of mental workload with frontal EEG. PLoS One 12:e0174949. doi: 10.1371/journal.pone.0174949
Stieglitz, S., and Dang-Xuan, L. (2013). Emotions and information diffusion in social media—sentiment of microblogs and sharing behavior. J. Manag. Inf. Syst. 29, 217–248. doi: 10.2753/mis0742-1222290408
Tamir, D. I., and Mitchell, J. P. (2012). Disclosing information about the self is intrinsically rewarding. Proc. Natl. Acad. Sci. U S A 109, 8038–8043. doi: 10.1073/pnas.1202129109
Telpaz, A., Webb, R., and Levy, D. J. (2015). Using EEG to predict consumers’ future choices. J. Mark. Res. 52, 511–529. doi: 10.1509/jmr.13.0564
Tullett, A. M., Harmon-Jones, E., and Inzlicht, M. (2012). Right frontal cortical asymmetry predicts empathic reactions: support for a link between withdrawal motivation and empathy. Psychophysiology 49, 1145–1153. doi: 10.1111/j.1469-8986.2012.01395.x
Urigüen, J. A., and Garcia-Zapirain, B. (2015). EEG artifact removal-state-of-the-art and guidelines. J. Neural Eng. 12:31001. doi: 10.1088/1741-2560/12/3/031001
Van Dijck, J. (2013). Facebook and the engineering of connectivity: a multi-layered approach to social media platforms. Convergence 19, 141–155. doi: 10.1177/1354856512457548
van Erp, J. B. F., Brouwer, A. M., and Zander, T. O. (2015). Editorial: using neurophysiological signals that reflect cognitive or affective state. Front. Neurosci. 9:193. doi: 10.3389/fnins.2015.00193
Vecchiato, G., Toppi, J., Astolfi, L., De Vico Fallani, F., Cincotti, F., Mattia, D., et al. (2011). Spectral EEG frontal asymmetries correlate with the experienced pleasantness of TV commercial advertisements. Med. Biol. Eng. Comput. 49, 579–583. doi: 10.1007/s11517-011-0747-x
Wang, R. W. Y., Chang, Y. C., and Chuang, S. W. (2016). EEG spectral dynamics of video commercials: impact of the narrative on the branding product preference. Sci. Rep. 6:36487. doi: 10.1038/srep36487
Wang, R., Wang, J., Yu, H., Wei, X., Yang, C., and Deng, B. (2015). Power spectral density and coherence analysis of Alzheimer’s EEG. Cogn. Neurodyn. 9, 291–304. doi: 10.1007/s11571-014-9325-x
Ward, L. M. (2003). Synchronous neural oscillations and cognitive processes. Trends Cogn. Sci. 7, 553–559. doi: 10.1016/j.tics.2003.10.012
Weber, E. U., and Johnson, E. J. (2009). “Decisions under uncertainty: psychological, economic, and neuroeconomic explanations of risk preference,” in Neuroeconomics: Decision Making and the Brain, eds P. W. Glimcher, C. F. Camerer, E. Fehr, and R. A. Poldrack (San Diego, CA: Elsevier Academic Press), 127–144.
Yener, G. G., and Başar, E. (2013). Brain oscillations as biomarkers in neuropsychiatric disorders: following an interactive panel discussion and synopsis. Suppl. Clin. Neurophysiol. 62, 343–363. doi: 10.1016/b978-0-7020-5307-8.00016-8
Keywords: social media, social networking, stimuli propagation, attention, social conformity, decision-making, EEG
Citation: Fischer NL, Peres R and Fiorani M (2018) Frontal Alpha Asymmetry and Theta Oscillations Associated With Information Sharing Intention. Front. Behav. Neurosci. 12:166. doi: 10.3389/fnbeh.2018.00166
Received: 02 May 2018; Accepted: 16 July 2018;
Published: 02 August 2018.
Edited by:
Oliver T. Wolf, Ruhr-Universität Bochum, GermanyReviewed by:
Bastian Schiller, Albert Ludwigs Universität Freiburg, GermanyCristina Gonzalez-Liencres, Consorci Institut D’Investigacions Biomediques August Pi I Sunyer, Spain
Copyright © 2018 Fischer, Peres and Fiorani. This is an open-access article distributed under the terms of the Creative Commons Attribution License (CC BY). The use, distribution or reproduction in other forums is permitted, provided the original author(s) and the copyright owner(s) are credited and that the original publication in this journal is cited, in accordance with accepted academic practice. No use, distribution or reproduction is permitted which does not comply with these terms.
*Correspondence: Nastassja L. Fischer, bmFzdGFsZkBiaW9mLnVmcmouYnI=; bmFzdGFmaXNjaGVyQGdtYWlsLmNvbQ==