
 Kennyn D. Statler2
- 1 Department of Biomedical Engineering, Oregon Health & Science University, Portland, OR, USA
- 2 Neurological Sciences Institute, Oregon Health & Science University, Portland, OR, USA
- 3 School of Health Sciences and Human Performance, Lynchburg College, Lynchburg, VA, USA
- 4 Department of Neurology, Oregon Health & Science University, Portland, OR, USA
Postural control of upright stance was investigated in well-compensated, unilateral vestibular loss (UVL) subjects compared to age-matched control subjects. The goal was to determine how sensory weighting for postural control in UVL subjects differed from control subjects, and how sensory weighting related to UVL subjects’ functional compensation, as assessed by standardized balance and dizziness questionnaires. Postural control mechanisms were identified using a model-based interpretation of medial–lateral center-of-mass body-sway evoked by support-surface rotational stimuli during eyes-closed stance. The surface-tilt stimuli consisted of continuous pseudorandom rotations presented at four different amplitudes. Parameters of a feedback control model were obtained that accounted for each subject’s sway response to the surface-tilt stimuli. Sensory weighting factors quantified the relative contributions to stance control of vestibular sensory information, signaling body-sway relative to earth-vertical, and proprioceptive information, signaling body-sway relative to the surface. Results showed that UVL subjects made significantly greater use of proprioceptive, and therefore less use of vestibular, orientation information on all tests. There was relatively little overlap in the distributions of sensory weights measured in UVL and control subjects, although UVL subjects varied widely in the amount they could use their remaining vestibular function. Increased reliance on proprioceptive information by UVL subjects was associated with their balance being more disturbed by the surface-tilt perturbations than control subjects, thus indicating a deficiency of balance control even in well-compensated UVL subjects. Furthermore, there was some tendency for UVL subjects who were less able to utilize remaining vestibular information to also indicate worse functional compensation on questionnaires.
Introduction
Unilateral loss of vestibular function (unilateral vestibular loss, UVL) usually results in functional compensation such that patients are able to stand and walk independently with little or no ataxia and/or vertigo. However, compensation is never fully complete (for reviews see Curthoys and Halmagyi, 1995; Curthoys, 2000; Curthoys and Halmagyi, 2007), and a proportion of patients continue to report some level of disability (Parving et al., 1992; Humphriss et al., 2003; Darrouzet et al., 2004; Saman et al., 2009). Currently, there is limited understanding about how or why compensation varies so widely.
Postural compensation for bilateral loss of vestibular function depends upon the ability to increase reliance on the remaining sensory systems for postural orientation (Horak, 2010). For example, following bilateral loss of vestibular function, studies have shown that subjects increase reliance upon their remaining sensory systems as demonstrated by increased orientation to a rotating support surface (SS) when their eyes are closed, rather than to gravitational vertical (Peterka, 2002). However, currently it is unknown the extent to which postural compensation for UVL depends on increasing reliance upon alternative sensory sources of orientation information.
It is unclear how well subjects who have lost vestibular function on one side can use the remaining vestibular function for postural orientation. Initially, loss of vestibular function on one side is associated with leaning the trunk and head to the side of the lesion when the eyes are closed (Borel et al., 2002), biased subjective visual vertical or horizontal (Tribukait et al., 1998; Vibert and Häusler, 2000), severe vertigo with head motion, and continuous nystagmus, as the nervous system interprets asymmetrical vestibular function as head rotation and head-tilt (Curthoys and Halmagyi, 1995; Halmagyi et al., 2010). After weeks to months, spontaneous nystagmus disappears (Fetter and Zee, 1988; Fetter et al., 1991), measures of subjective visual vertical or horizontal return to normal or near normal values (Tribukait et al., 1998; Vibert and Häusler, 2000), and posture and balance improve (Black et al., 1989; Fetter et al., 1991; Levo et al., 2004; Parietti-Winkler et al., 2006, 2010, 2011). In particular, results using the sensory organization test procedure (Nashner and Peters, 1990; Nashner, 1993) have demonstrated transient disruptions of balance control following UVL, but then return to normal function after 2 or 3 months (Fetter et al., 1991; Parietti-Winkler et al., 2006, 2010, 2011). In contrast, measures of center of pressure (CoP) sway velocity during quiet stance and vibration-perturbed stance improve following UVL but remain statistically distinguishable from controls a year after UVL (Levo et al., 2004), and in more challenging balance and gait tasks, UVL subjects show long-term deficits particularly in the roll direction (Allum and Adkin, 2003; Mbongo et al., 2005).
From animal experiments, there is evidence that compensation for UVL involves changes in background neural activity in the bilateral vestibular nuclei from very asymmetrical, with reduced activity on the side of the vestibular loss, to more symmetrical background neural activity (Curthoys and Halmagyi, 1995). Central compensation typically results in normal gain and symmetry of the vestibulo-ocular reflex in UVL subjects in response to small-to-moderate amplitude head rotations (Black et al., 1989), although response asymmetries are always revealed by large, impulsive head thrusts (Halmagyi et al., 1990, 2008). The absence of asymmetries seen for moderate head movements is likely related to vestibular nerve afferents in humans having high spontaneous discharges rates, as observed in non-human primates (Goldberg and Fernandez, 1971). High spontaneous discharge rates facilitate bidirectional encoding of head movements and thus provide the basis for symmetric vestibulo-ocular responses in well-compensated UVL subjects. Because head movements associated with body-sway during quiet stance and during moderately perturbed stance are very small compared to the large head movements required to reveal vestibulo-ocular reflex asymmetries due to UVL, one hypothesis is that compensated UVL subjects will show no deficits in postural control. Specifically, UVL subjects may be able to use their remaining vestibular information for postural control such that their responses to postural perturbations are identical to responses of subjects with bilaterally normal vestibular function.
An alternative hypothesis, based on optimal estimation theory (Ernst and Banks, 2002), is that UVL subjects will show altered use of vestibular information for postural control even when postural perturbations are small. Optimal estimation theory suggests that, when combining signals derived from two sensory systems that are sensing a physical variable, the lowest variance internal estimate of the physical variable is obtained by forming a weighted combination of the two sensory signals with the weights inversely related to the variance of signals in the two sensory channels. Assuming that variability is reduced by central mechanisms that combine motion information across individual vestibular afferents from both ears, UVL subjects should have greater uncertainty (higher variance, lower signal-to-noise) in their central vestibular-derived representation of head orientation, compared to subjects with normal vestibular function due to the loss of half the vestibular afferents. Therefore, UVL subjects would be expected to show reduced, but not absent, reliance on vestibular-derived orientation information and increased reliance on other sensory sources of orientation information. Specifically, in an eyes-closed condition in which proprioceptive and vestibular cues are the main sources of orientation information, UVL subjects should rely more heavily on proprioceptive information for postural control than subjects with normal vestibular function.
We have previously quantified the relative dependence of postural control on orientation information derived from vestibular, proprioceptive, and visual systems using a model-based interpretation of stimulus-evoked body-sway. The model is a feedback control model that is able to account for the dynamic characteristics of body-sway evoked by surface or visual surround tilts (Peterka, 2002, 2003) that evoke anterior–posterior (AP) sway (Peterka, 2002) or medial–lateral (ML) sway (Cenciarini and Peterka, 2006). For an eyes-closed condition that eliminates the visual contribution, the model includes a proprioceptive weighting factor, WP, and a vestibular weighting factor, WV = 1−WP. The sensory weights WV and WP, which represent the relative contributions of orientation information from the respective sensory systems, can be derived from the analysis of body-sway responses to pseudorandom surface-tilt stimuli.
Previous results in subjects with normal vestibular function have shown that the sensory channel weights depend on stimulus amplitude and these weights can be predicted by methods that apply optimal estimation theory to the postural control system (van der Kooij and Peterka, 2011). At very low surface-tilt stimulus amplitudes (0.5° or 1° peak-to-peak) eyes-closed subjects rely primarily on proprioceptive cues (WP = ∼0.7, WV = ∼0.3) while they rely primarily on vestibular cues for larger (8° peak-to-peak) stimulus amplitudes (WP = ∼0.3, WV = ∼0.7; Peterka, 2002; Cenciarini and Peterka, 2006). Our method for measuring sensory weights has been validated by demonstrating the expected amplitude-independent result that WP = ∼1.0, WV = ∼0.0 in bilateral vestibular loss subjects (Peterka, 2002) and by showing that galvanic-evoked sway responses scale in proportion to WV (Cenciarini and Peterka, 2006).
In the present study, we used our model-based interpretation of sway responses to pseudorandom surface-tilt stimuli to quantify the relative contributions (i.e., sensory weighting) of vestibular and proprioceptive orientation information for stance control in patients with chronic UVL, compared to age-matched healthy control subjects. We considered two alternative hypotheses regarding sensory weighting: (1) there will be no difference between UVL and control subjects because of the ability of a single vestibular labyrinth to encode bidirectional low-amplitude motion or (2) UVL subjects will show increased WP and decreased WV due to the increased variance of the vestibular-derived estimate of body orientation caused by the loss of half of the vestibular afferents. Furthermore, there is apparent variation among UVL subjects in their level of functional compensation with some subjects reporting continued symptoms or feeling partially disabled regarding some tasks (Parving et al., 1992). We hypothesize that UVL subjects reporting poorer compensation will show reduced reliance on their remaining vestibular function compared to subjects reporting better functional compensation who are better able to utilize their remaining vestibular function.
Materials and Methods
Subjects
The experimental protocols were approved by the Institutional Review Board at Oregon Health & Science University. All subjects gave their informed consent prior to testing. Twenty-two subjects participated in this study. Eleven control subjects were adults who had normal results on clinical sensory organization tests of postural control (Peterka and Black, 1990), and had no known history of balance impairment or dizziness. The other 11 subjects had a UVL and were tested a minimum of 1 year following their vestibular loss. All of the UVL subjects had either a labyrinthectomy or vestibular nerve section to treat vertigo or an acoustic neuroma that was surgically treated with operative history suggesting that destruction of vestibular function was likely (Table 1). There was no significant difference in age of control subjects (mean 53 years ± 10 SD) and UVL subjects (54 ± 10 years).
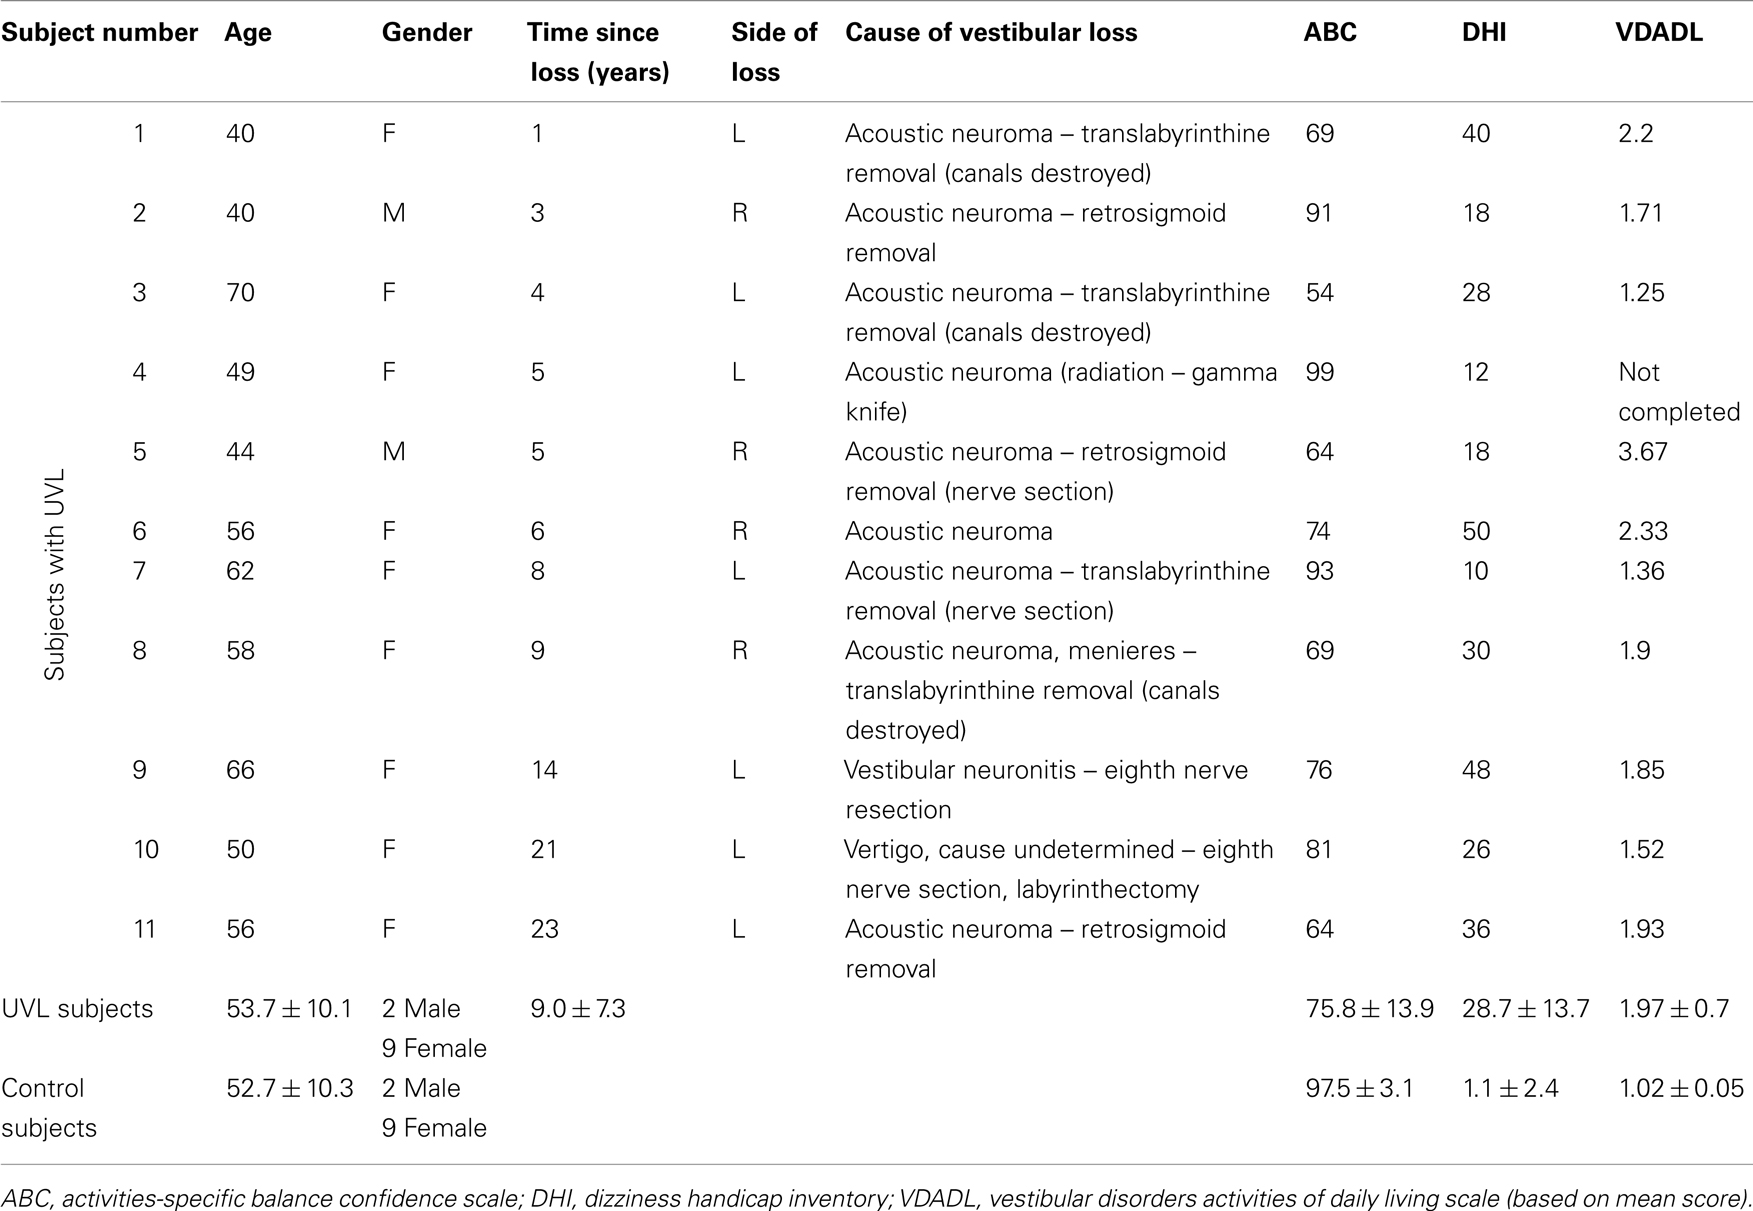
Table 1. Subject demographic information.
Experimental Setup
All experiments were performed on a custom, balance-testing device that included a motor-driven rotating SS. A position servo-controlled motor produced ML tilts of the SS with the rotation axis located between the feet at the height of the subject’s ankle joints. Vertical force sensors in the SS were used to measure CoP data. ML body motion was measured by two horizontal sway rods that rested in V-shaped slots attached to the subject at the level of the greater trochanter and the shoulder. ML body-sway produced rotational motions of the sway rods that were recorded by earth-fixed potentiometers mounted behind the subject. Appropriate trigonometric conversions were applied to the potentiometer signals to measure ML hip and shoulder lateral displacements. Results from a calibration trial that compared ML CoP displacements with sway rod displacements were used to form a calibration function from which measures of center-of-mass (CoM) angular rotation were calculated on each experimental trial (Peterka, 2002). The CoM rotation time series was considered to be the output variable of interest in all experiments. Stimulus delivery and data sampling were computer controlled at a rate of 100 Hz. Sampled data included: SS angular position, four vertical forces from sensors at the corners of the SS, and rotational position of the hip and shoulder sway rods. Subjects stood with arms crossed, with a relatively narrow foot placement of approximately 2.5 cm between the inner malleoli and with the feet angled out 15°.
Pseudorandom Stimuli
A pseudorandom rotational SS stimulus was created based on a pseudorandom ternary sequence (PRTS) of 242 numbers (Davies, 1970). The PRTS was used to define a rotational velocity waveform that, depending on the value of each successive PRTS number, was set every 0.2 s to one of three velocity levels +v, 0, and −v. The amplitude spectrum of the PRTS velocity waveform is shown in Figure 1 in Cenciarini and Peterka (2006). This velocity waveform was mathematically integrated to produce a rotational position waveform and this position waveform was scaled to make stimulus waveforms with four different amplitudes (1°, 2°, 4°, and 8° peak-to-peak; Peterka, 2002; Cenciarini and Peterka, 2006). These waveforms were used to command a position servo-controlled motor to produce the SS rotational stimuli used in this study. The stimulus waveforms were symmetric producing equal tilts to the right and left. On each test trial, six consecutive cycles (0.2 × 242 s = 48.4 s per cycle) of this waveform were presented. This stimulus appeared to be unpredictable to the test subject, and thus likely limited any predictive contributions to postural responses, which are known to occur (McIlroy and Maki, 1994).
Protocol
Each subject performed the six-cycle PRTS trials at four different amplitudes. The stimulus trials were presented in a randomized order for each subject and subjects rested for 5 min between each trial. All trials were performed eyes-closed. Subjects were instructed to maintain a relaxed upright stance position. Subjects wore headphones and listened to audiotapes of novels and short stories to mask equipment sounds, maintain alertness, and distract them from concentrating on their balance control. Each experimental session lasted about 1 h.
Root Mean Square Sway Analysis
Root mean square (RMS) measures of CoM sway were calculated for each subject and each test trail. CoM sway data from each trail were first averaged across the last five cycles of the PRTS stimulus to form an cycle-averaged CoM sway waveform. The mean value of this CoM waveform was subtracted and the RMS value was calculated from this zero-meaned, cycle-averaged waveform.
Frequency-Domain Analysis
A frequency-domain analysis of stimulus-evoked CoM sway data from each subject and each trial was made by applying Fourier analysis to the measured SS stimulus and CoM sway response, calculating power and cross power spectra of the stimulus and response, and using these power spectra to calculate frequency response functions (FRFs), and coherence functions (see Peterka, 2002 for details). FRFs and coherence functions were calculated at 16 frequencies approximately equally space on a logarithmic scale from 0.021 to 2.77 Hz. Only the last five cycles of the response to the PRTS stimulus were included in the analysis to avoid transient behavior in the first cycle.
An FRF characterizes the dynamic behavior of a system by showing how response sensitivity (gain) and timing (phase) change as a function of stimulus frequency. At each frequency, the FRF gain gives the ratio of the amplitude of the response (CoM body-sway angle) to the stimulus amplitude (SS tilt angle) at that frequency. The FRF phase (in degrees) expresses the relative timing of the response compared to the stimulus at each frequency. If a subject had a gain of 1 and phase of 0° at a particular stimulus frequency, this would indicate that the subject swayed with amplitude equal to the moving surface at that frequency and with no time lead or lag. That is, the subject oriented perfectly to the moving surface at that frequency. A gain value of 0 across all frequencies would indicate that the subject was unaffected by SS stimulus and remained in a vertical orientation.
For a linear system, the FRF provides a complete description of the system behavior. Previous results have shown that postural responses to PRTS stimuli are consistent with linear behavior for each stimulus amplitude, but that systematic changes in FRFs occurred with changing stimulus amplitudes and these changes were primarily attributable to sensory re-weighting (Peterka, 2002; Cenciarini and Peterka, 2006). One goal of the current study was to determine how UVL alters the amplitude-dependent changes to obtain insight into how UVL affects sensory re-weighting.
The coherence function is a frequency-domain version of a correlation coefficient in that it provides a measure of the extent to which the stimulus and response are correlated. Coherence function values range from 0 to 1 with unity values being associated with perfect correlation between stimulus and response with no noise in the system or in measurements (Pintelon and Schoukens, 2001).
Posture Control Model
To provide a functional interpretation of the experimental stimulus–response data, curve fits were made to the experimentally determined FRFs to estimate model parameters. The curve fits were based on the feedback control model shown in Figure 1. This model is the same as one used previously to characterize the dynamic behavior of sway evoked by ML surface rotations (Cenciarini and Peterka, 2006) and is slightly modified from a previous model originally used to analyze AP evoked sway (Peterka, 2002). Our model is based on earlier feedback control models of human posture control (Ishida and Miyazaki, 1987; Johansson et al., 1988) but is expanded to separately represent the contributions of sensory systems encoding different aspects of body motion and orientation, and it accounts for time delay in feedback control. Further details can be found in Peterka (2003). Numerous other models have been developed to explain human postural control (e.g., van der Kooij et al., 1999; Sungho and Massaquoi, 2004; Kuo, 2005; Maurer et al., 2006), but we utilized our model because of its ability to account for the experimental data, to provide parameters with physiological meaning, and to provide parameters estimates with low variance (e.g., see Figure 7 in Cenciarini and Peterka, 2006).
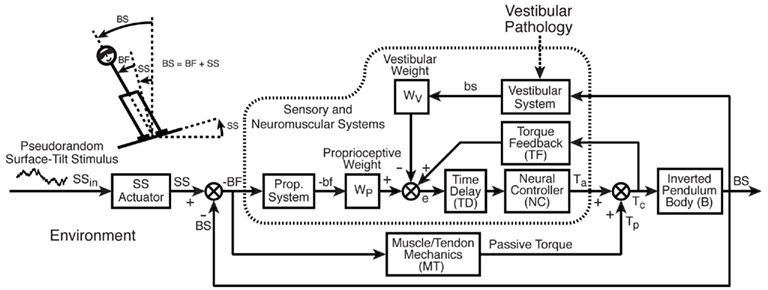
Figure 1. Feedback control model of sensory control of balance and posture adopted from Cenciarini and Peterka, 2006. Stick figure shows our measures of lateral body-sway (BS) and lateral surface rotation (SS) and body movement relative to feet (BF) in addition to the internal representations of BS and BF (bs, bf) derived from vestibular and proprioceptive sensory systems. The model diagram illustrates the assumed feedback control structure whereby the corrective torque (Tc) applied to control body orientation is determined primarily by a weighted combination of vestibular and proprioceptive orientation signals (weights WV and WP, respectively) with additional feedback from sensory systems that detect the corrective torque applied to the body. Visual feedback is not included since experiments were performed with eyes-closed. Detailed descriptions of model components are provided in Table 2.
Each block in the model diagram represents a functional component of the postural control system. These blocks and their associated parameters are defined in Table 2 along with important variables that represent physical variables, internal sensory system signals, and processed orientation information. The model in Figure 1 represents an FRF equation between the SS stimulus and the CoM body-in-space (BS) response of the following form:

where s is the Laplace transform variable. The Laplace transform equations that define the elements MT, NC, B, TD, and TF in Eq. 1 are given in Table 2.
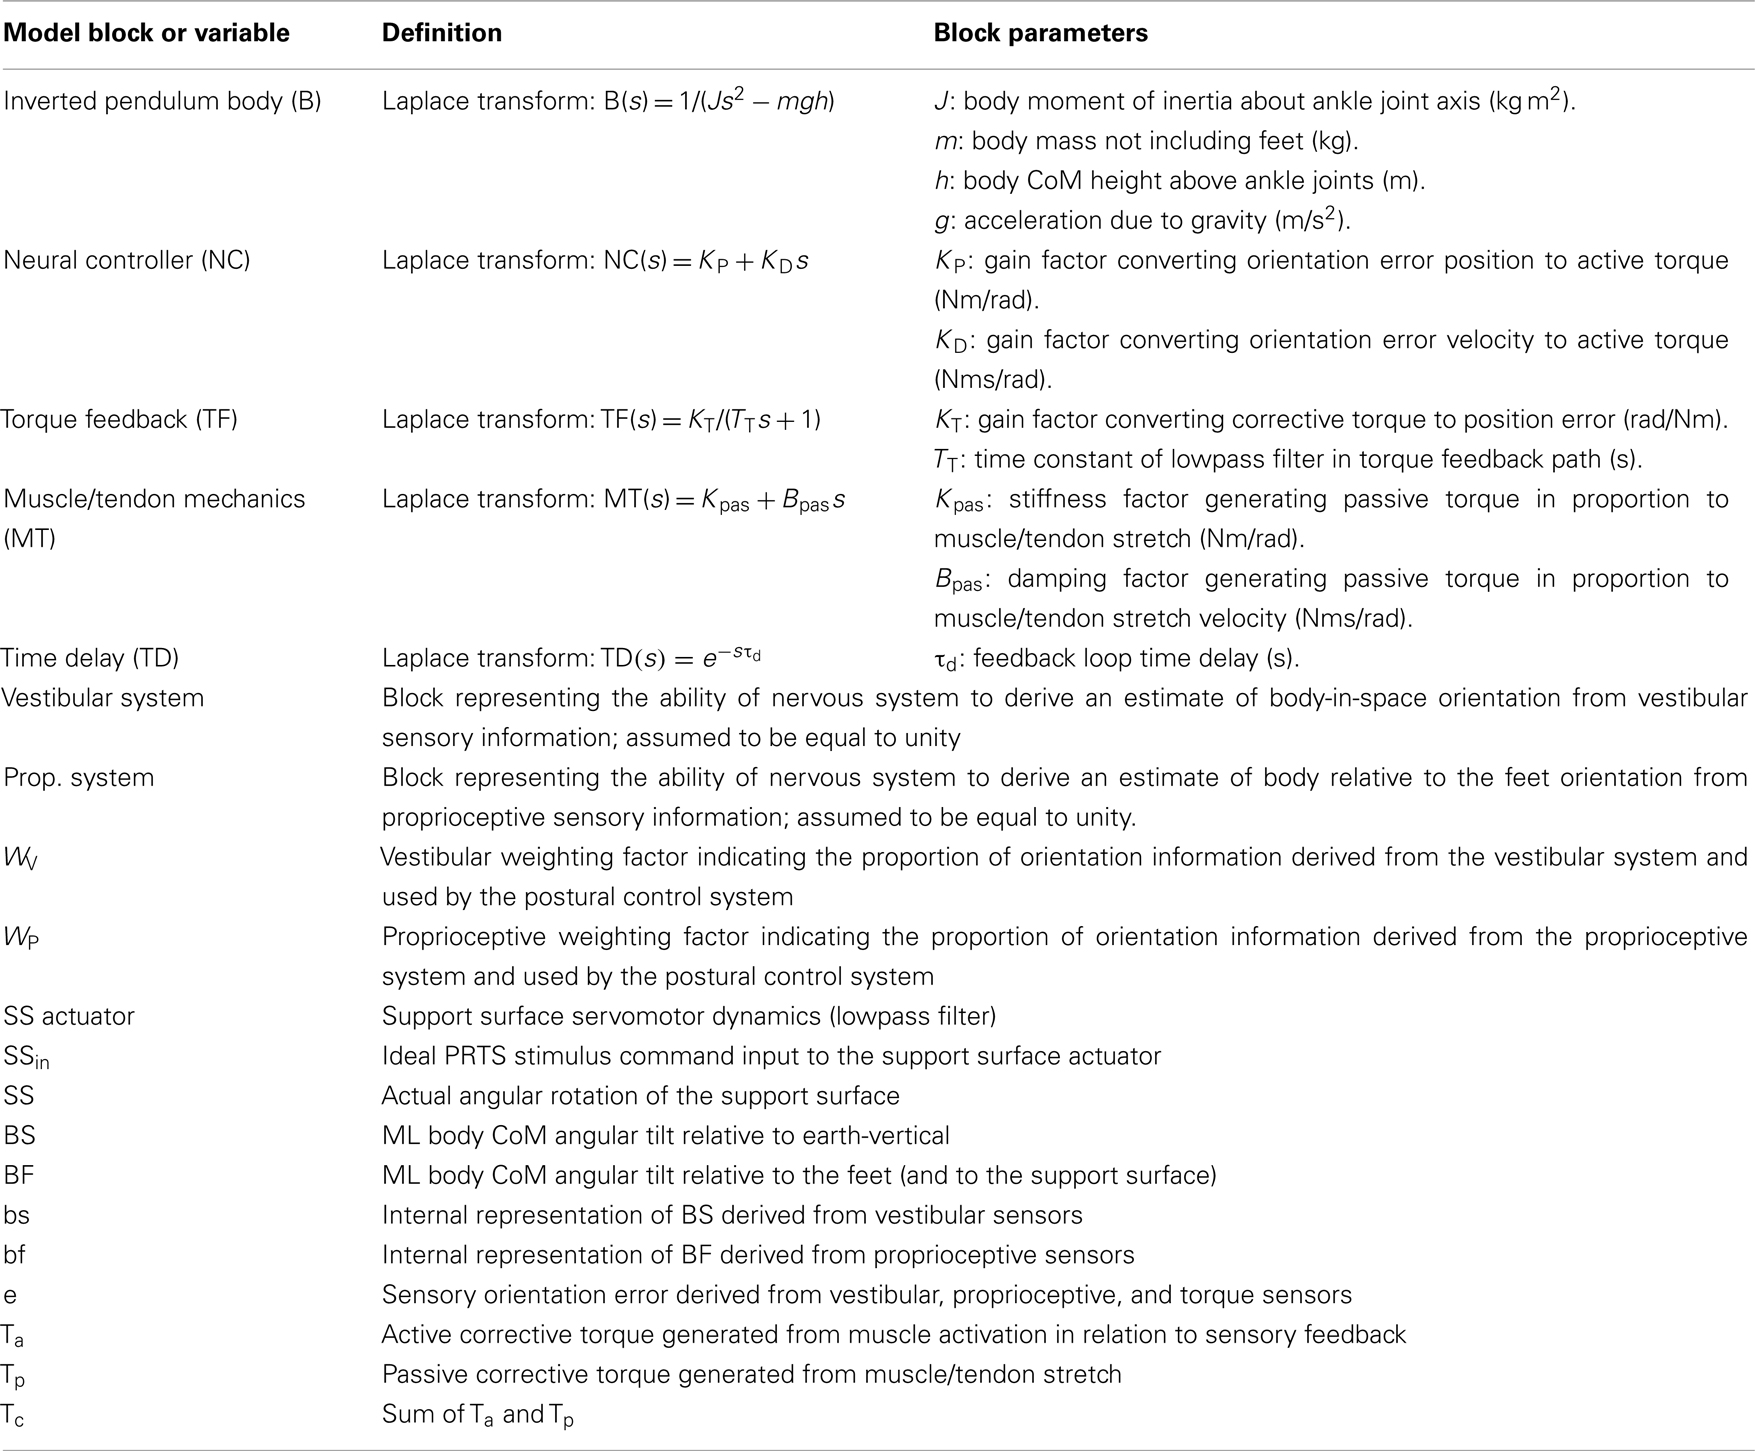
Table 2. Posture model parameters and definition of variables.
The factors WP and WV are the proprioceptive and vestibular channel weights, respectively, and are of particular interest in this study. These sensory weights represent the relative contributions made to an internal estimate of orientation provided by proprioception and by the vestibular sensory system such that WP + WV = 1. There is no loss of generality in constraining the sensory weights to sum to one. In the model, proprioception is defined as a kinematic measurement system that provides a neural signal of body angular orientation relative to SS. The vestibular system is assumed to provide a neural signal of body orientation relative to gravity and earth-vertical. Thus, the detailed dynamics of peripheral proprioceptors (e.g., muscle spindles) and peripheral vestibular receptors (semicircular canals and otoliths) are not explicitly represented, but rather it is assumed that the nervous system is capable of extracting accurate kinematic information by processing signals from peripheral sensors (see Mergner et al., 1991; Angelaki et al., 1999; Merfeld and Zupan, 2002; Casabona et al., 2004). For example, previous studies (Angelaki et al., 1999; Merfeld and Zupan, 2002) demonstrated the ability of the nervous system to distinguish between linear acceleration caused by translation and linear acceleration due to head-tilt with respect to gravity. By combining vestibular head-tilt information with proprioceptive information encoding inter-segmental joint angles and encoding ankle joint angles with respect to the surface, the nervous system has available to it vestibular-derived information about body orientation in space (Mergner et al., 1997).
Curve fits of Eq. 1 were made to all individual FRFs of each control and UVL subject at each stimulus amplitude using the procedure described previously (Peterka, 2002). The highest three frequencies were excluded from the fit procedure, leaving frequencies ranging from 0.021 to 1.47 Hz, since the model FRF was often unable to account for these data and coherence values at these higher frequencies were typically low indicating low correlation with the stimulus. The curve fits provided estimates of the various parameters in Eq. 1 (see Table 2). To limit the number of unconstrained fit parameters, we used anthropometric estimates of body moment of inertia, J, and CoM height, h, (Winter, 2005) and direct measurement of body mass, m. Furthermore, we assumed that the sum of the proprioceptive and vestibular weights equals one in the eyes-closed condition. Curve fits reliably converged to single solutions.
The quality of model fits was determined by simulating the CoM sway responses to the PRTS stimuli, using Matlab Simulink (The MathWorks, Natick, MA, USA) and the curve fit parameters for each test trial. For each trial, the variance accounted for (VAF) by the model was calculated as VAF = 1 − VAR (exp − sim)/VAR(exp) where VAR(exp − sim) is the variance of the difference between the experimental CoM sway response averaged across the PRTS stimulus cycles and the model-simulated CoM sway across a PRTS stimulus cycle, and VAR(exp) is the variance of the experimental CoM sway response averaged across the PRTS stimulus cycles.
Clinical Measures
To determine how well subjects with UVL judged their functional compensation, they completed questionnaires designed for vestibular patients that included the vestibular disorders activities of daily living (VDADL) scale (Cohen and Kimball, 2000), the activities-specific balance confidence (ABC) scale (Powell and Myers, 1995), and the dizziness handicap inventory (DHI; Jacobson and Newman, 1990). In the current study, we focused mainly on the VDADL since these results were found to have the highest correlation with measures of sensory weighting. The VDADL test consists of 28 questions that assess subjects’ comfort and ability to perform activities categorized as functional, ambulatory, and instrumental as well as a “total scale” that summarizes all three categories. In the original definition of the VDADL, subjects scored their responses to each question using integer numbers ranging from 1 (best) to 10 (worst), and the median values of answers to questions in the three categories or across all questions for the total scale were used as the VDADL scores. VDADL total score measures were compared to vestibular sensory weights, WV, to determine if variations in WV among UVL subjects were related to functional compensation for their vestibular deficit. Because VDADL scores are always integer values, we modified the VDADL to calculate a total score based on the arithmetic mean rather than a median in order to obtain a continuous variable for comparing with WV.
Statistical Analysis
Root mean square data and model parameters were evaluated using NCSS statistical analysis software (NCSS, Kaysville, UT, USA) to perform a linear mixed model analysis that determined the significance of group effect (controls versus UVLs), stimulus amplitude effect, and interaction between group and stimulus amplitude. A Bonferroni correction was used to account for multiple pair-wise comparisons.
Results
Stimulus-Evoked Body-Sway
The cycle-averaged ML CoM sway responses (Figure 2A) followed the general time course of the PRTS stimulus waveform, indicating that both control and UVL subjects tended to orient to the moving SS. The CoM sway responses of the representative control and UVL subjects shown in Figure 2A illustrate that stimulus-evoked CoM sway increased with increasing stimulus amplitude, but that the CoM sway amplitude was slightly larger in the UVL subject compared to the control subject. The disparity between controls and UVL subjects in the amplitude of stimulus-evoked CoM sway is confirmed by analysis of the RMS sway measures from all subjects (Figure 2B). The mean RMS sway of UVL subjects was larger than the mean RMS sway of controls at all stimulus amplitudes and this difference was statistically significant at the 4° and 8° stimulus amplitudes (p = 0.01, p = 0.0002 respectively). The RMS data also revealed a non-linearity in sway responses across stimulus amplitude for both UVL and control subjects in that the stimulus-evoked RMS sway did not increase in direct proportion to the stimulus amplitude. Specifically, for the eight-fold increase from the lowest to highest stimulus amplitude, UVL subjects showed only a 3.2-fold increase in mean RMS sway and control subjects showed only a 3.0-fold increase. Thus there was a saturation effect (i.e., decreasing responsiveness or sensitivity) at higher stimulus amplitudes although individual CoM sway waveforms (Figure 2A) showed no obvious clipping effect that would be indicative of saturation caused by a non-linearity that limited the peak amplitude of sway.
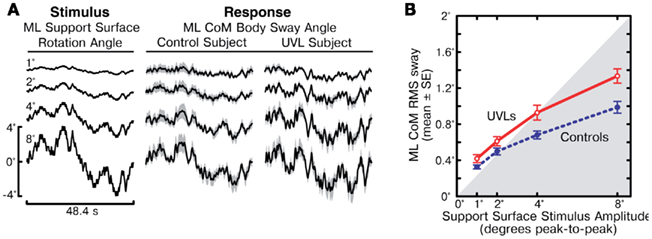
Figure 2. Medial–lateral (ML) body-sway evoked by support surface rotations. (A) Time course of one cycle of pseudorandom ML support surface rotation angle at four different amplitudes (left column) and mean ML body-sway angle are shown for a control subject (middle column) and a unilateral vestibular loss subject (UVL, right column). Body-sway response means with 95% confidence intervals (shaded gray) are shown. (B) Root mean square (RMS) values of ML body-sway are plotted as a function of peak-to-peak amplitude of the pseudorandom surface-tilt stimulus. The gray shaded region indicates the range where stimulus RMS values are less than the ML sway RMS values.
Frequency-Domain Analysis of Postural Dynamics
The mean FRFs from 11 control subjects and 11 UVL subjects at each of the four different stimulus amplitudes are shown in Figure 3. Examination of each individual’s FRFs showed that they were consistent with the population mean. For both UVL and control subjects, FRF gains (CoM sway amplitude/SS amplitude) were largest in the mid-frequency region (0.1–1 Hz) and declined at lower frequencies and sharply declined at higher frequencies (above ∼1 Hz). For both UVL and control subjects, as the stimulus amplitude increased the low- and mid-frequency gains decreased. At each stimulus amplitude, the mid-frequency gain values of the UVL subjects were consistently larger than the corresponding gain values of the control subjects. For both control and UVL subjects, the gain functions corresponding to the four stimulus amplitudes converged at about 2 Hz.
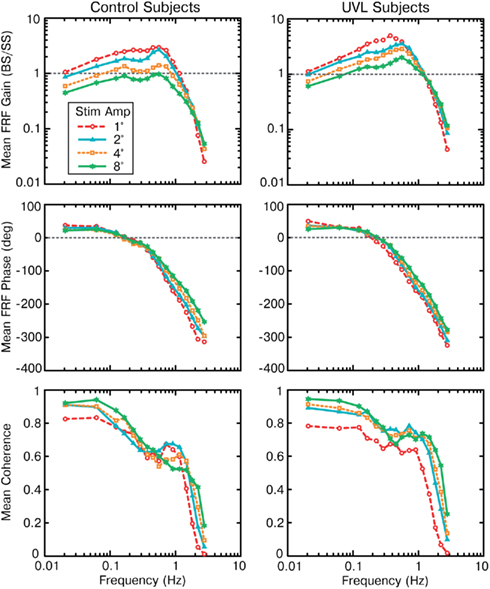
Figure 3. Group mean frequency response functions (FRFs expressed as gain and phase functions) and coherence functions of medial–lateral body-sway responses to four amplitudes of pseudorandom surface-tilt stimuli for control (left column) and unilateral vestibular loss subjects (right column).
The FRF phases for control and UVL subjects showed similar patterns as a function of stimulus frequency. There was a phase lead at frequencies below about 0.2 Hz and an increasing phase lag with increasing frequency for frequencies above about 0.2 Hz. For the control subjects, the phase functions were very similar for frequencies below about 0.2 Hz. There were only limited changes in phase as a function of stimulus amplitude with a tendency for there to be less phase lag at a given frequency with increasing stimulus amplitude for frequencies above about 0.6 Hz. This trend was more evident in phase data from controls than in UVL phase data.
Coherence functions were generally largest at the lowest test frequencies and had values above 0.6 for frequencies up to ∼1 Hz, consistent with a high correlation between stimulus and response. The coherence function from the 1° stimulus typically had lower values than the coherence functions associated with the larger stimulus amplitudes. This is consistent with a lower signal-to-noise ratio for responses evoked by this very low-amplitude stimulus. For 2–8° stimuli, there was no systematic change in coherence with stimulus amplitude consistent with there being similar signal-to-noise ratios for these data. Coherence values dropped sharply for frequencies above ∼1–1.5 Hz. Low coherence values at higher frequencies were expected given the low signal-to-noise associated with the low FRF gains at these higher frequencies.
Model Parameters
Model parameters were derived from curve fits to FRFs from each trial of each subject. Model simulations using parameters from each trial showed that the model accounted for about 90% of the variability of the experimental CoM sway evoked by the PRTS stimulus (VAF = 91.6% mean, 7% SD for control subjects and 89.2% mean, 12.1% SD for UVL subjects).
Table 3 summarizes the mean parameter values across all stimulus amplitudes. The only model parameter that differed significantly between control and UVL subjects was the sensory weighting factor WP (and therefore WV = 1 − WP). Variations in sensory weighting as a function of subject group and stimulus amplitude are discussed in detail in the next section. Among the other parameters, several showed significant variation across stimulus amplitude. On average, the neural controller parameters KP and KD increased, torque feedback parameters TT and KT decreased, and the time delay parameter τd decreased with increasing stimulus amplitude. The amplitude-dependent changes in these parameters were essentially identical to parameter variations determined in a previous study performed with similar PRTS stimuli (see Figure 7 in Cenciarini and Peterka, 2006). Only KD showed a significant interaction effect between group and stimulus amplitude where KD in UVL subjects increased slightly with increasing stimulus amplitude while it did not in control subjects.
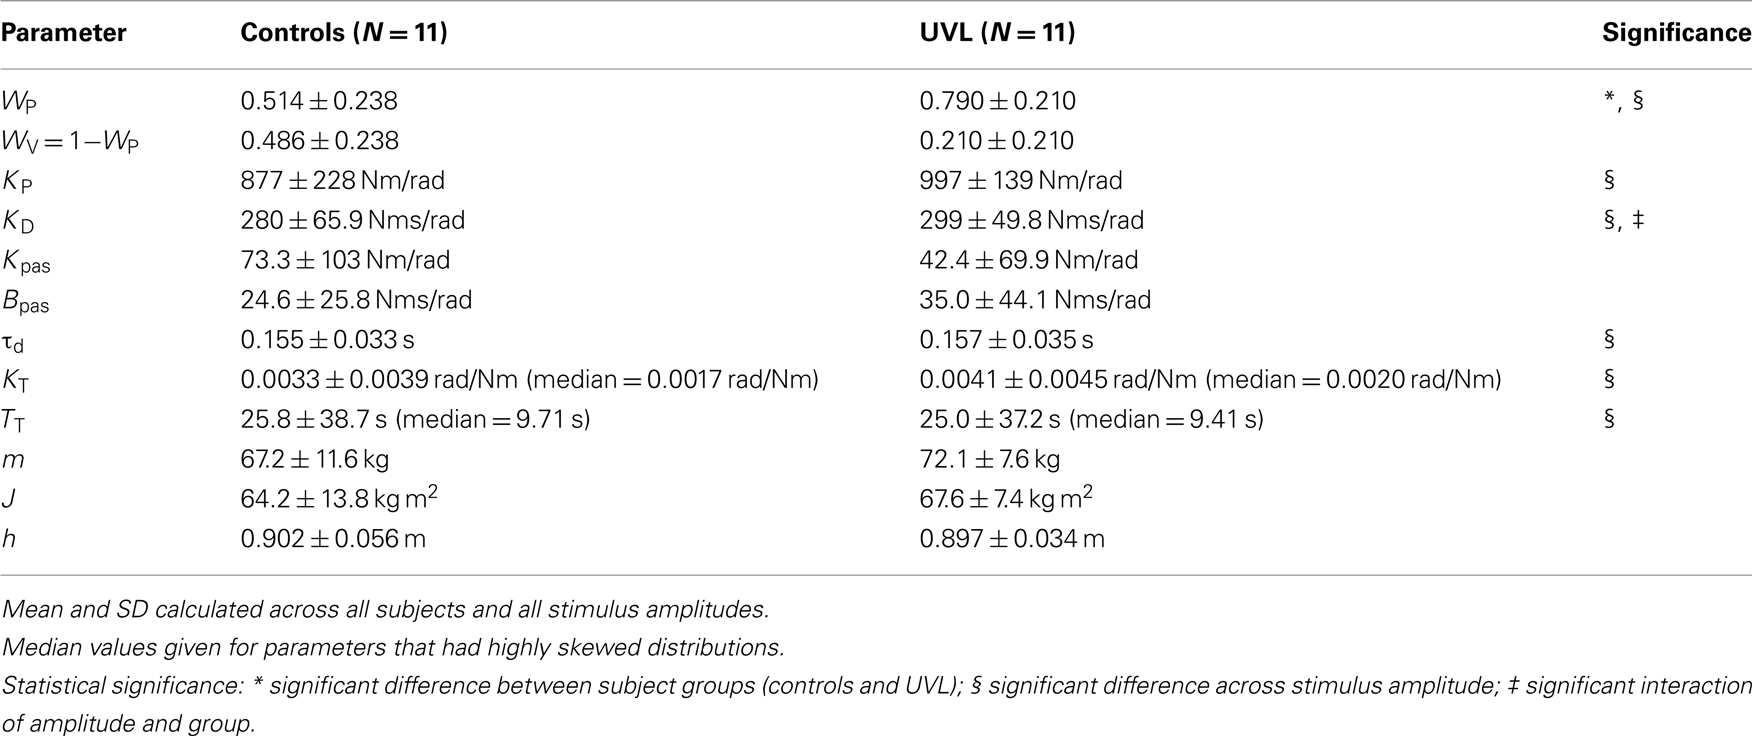
Table 3. Model parameters (mean ± SD).
The passive stiffness and damping parameters (Kpas, Bpas) associated with muscle/tendon mechanics were small relative the active stiffness and damping associated with of the neural controller (KP, KD). Specifically, Kpas was only about 6% of KP and Bpas was only about 10% of KD. Since passive and active stiffness and damping parameters determine the magnitude of corrective torque generated with body-sway and SS motion, most of the corrective torque was attributable to neurally mediated muscle activation. Furthermore, because the muscle/tendon factor MT (defined by Kpas and Bpas parameters; Table 2) in Eq. 1 was small relative to the neural controller factor NC (defined by KP and KD parameters), the overall FRF gain was determined primarily by the proprioceptive sensory weight WP, which occurs as a multiplier in the numerator of Eq. 1. Therefore, the decrease in FRF gain with increasing stimulus amplitude can be qualitatively associated with a decrease in WP with increasing stimulus amplitude.
Sensory Weighting
Similar to previous studies of AP (Peterka, 2002) and ML sway (Cenciarini and Peterka, 2006) evoked by surface rotations, the sensory contributions to stance control represented by WV and WP changed as a function of PRTS stimulus amplitude for the control subjects (Figure 4A). Specifically, control subjects shifted from a predominant reliance on proprioceptive information and limited reliance on vestibular information at the lowest amplitude (WP = 0.77, WV = 1 − WP = 0.23) to a limited reliance on proprioception information and predominant reliance on vestibular information at the highest stimulus amplitude (WP = 0.27, WV = 0.73). Like control subjects, UVL subjects also showed a decrease in WP and increase in WV with increasing stimulus amplitude (Figure 4B).
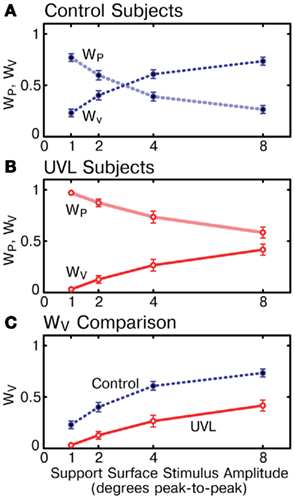
Figure 4. Vestibular (WV) and proprioceptive (WP) weights vary as a function of support surface stimulus amplitude for control subjects and unilateral vestibular loss subjects. (A) Mean WV and WP values for control subjects. (B) Mean WV and WP values for unilateral vestibular loss subjects. (C) Comparison of WV for controls and unilateral vestibular loss subjects. Mean WV values in unilateral vestibular loss subjects were always less than in control subjects and never exceeded 0.5 (50% reliance on vestibular information). Means ± SE are plotted (N = 11 subjects in each group).
However, sensory weights were significantly different between control and UVL subjects across all stimulus amplitudes (p < 0.00001). In fact, at each individual stimulus amplitude (p < 0.006) UVL subjects showed a greater reliance on proprioceptive information and reduced reliance on vestibular information than control subjects (WV comparison in Figure 4C). On average across all stimulus amplitudes, UVL subjects showed a sensory weight shift of 0.28 toward increased reliance on proprioception and, therefore, decreased reliance on vestibular information for ML stance control, compared to control subjects. This difference between control and UVL subjects was most evident at the lowest stimulus amplitude where, on average, UVL subjects made almost no use of vestibular information (UVL WV = 0.03) whereas controls made much greater use (control WV = 0.23). Furthermore, the mean UVL vestibular weight was always less than 0.5, indicating the UVL subjects were, on average never primarily reliant on vestibular information.
The variation in WV with stimulus amplitude of individual subjects is shown in Figure 5A for control subjects and in Figure 5B for UVL subjects. There was considerable variation in WV within each subject group but also substantial, although not complete, separation between groups in their WV values across the range of stimulus amplitudes. WV values from two of the control subjects were noticeably lower than the values from the other nine controls such that these two subjects’ WV values were close to the mean WV values of UVL subjects. However, the WV values of the other nine control subjects were larger than WV values from nearly all other UVL subjects (exceptions UVL subject 8 at 2° and 4° stimulus amplitudes and subject 10 at 8° amplitude).
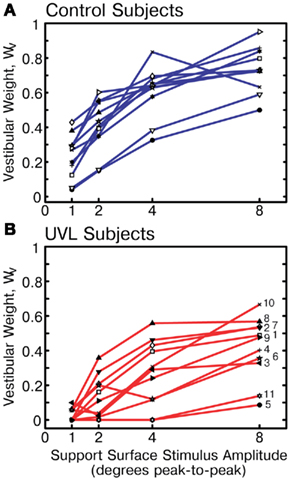
Figure 5. Vestibular weights (WV) across stimulus amplitudes for individual control subjects (A) and individual unilateral vestibular loss subjects (B). Numbers labeling WV data of unilateral loss subjects correspond to labels in Table 1.
The variability of WV for UVL subjects increased with increasing stimulus amplitude whereas the WV variability for control subjects was approximately constant across stimulus amplitude. In particular at the lowest stimulus amplitude, WV values were tightly clustered between 0 and 0.1 for UVL subjects while corresponding WV values for control subjects varied from 0.05 to 0.43. At higher stimulus amplitudes, two of the UVL subjects’ results (subjects 5 and 11) contributed to increased variability since their WV values remained well below the values of other UVL subjects. In particular, results from these two UVL subjects, whose WV values remained close to zero, resemble similar results seen previously in subjects with bilaterally absent vestibular function tested using surface-tilt experiments that evoked AP sway (Peterka, 2002).
Functional Correlation
There was evidence for a weak correlation between UVL subjects’ functional status as measured by the VDADL scale and vestibular weighting measured at 4° and 8° stimulus amplitudes (Figure 6A). Subjects with poorer vestibular compensation, as indicated by larger VDADL scores, tended to make less use vestibular information for stance control, as indicated by lower WV values (r = 0.56 and r = 0.62 at 4° and 8° amplitudes, respectively). However, the correlations of VDADL with WV had only borderline significance levels (p = 0.089 and p = 0.055 at 4° and 8° amplitudes, respectively). Furthermore, the data from the UVL subject with the largest magnitude VDADL score had a particularly large influence on these correlations such that elimination of this subject’s data greatly reduced the significance of the correlation.
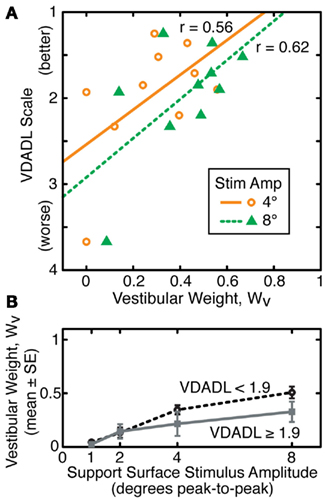
Figure 6. Relationship between vestibular weights (WV) and functional status assessed using the vestibular disorders activities of daily living (VDADL) scale for subjects with unilateral vestibular loss. (A) Linear regression and linear correlation coefficients relating VDADL score and WV are shown for WV values obtained from sway responses to support surface stimuli with 4° and 8° amplitudes. (B) Segregation of WV data into two sets (N = 5 in each group) according to VDADL scores demonstrates that unilateral loss subjects with better function (lower VDADL) make greater use of vestibular information for stance control at larger stimulus amplitudes.
To the extent that a relationship exists between functional compensation for UVL and utilization of vestibular information for stance control, this relationship was only evident at larger stimulus amplitudes (Figure 6B). When UVL subjects were divided into subgroups based on their VDADL scores, subjects with larger VDADL scores (poorer compensation) had lower WV values at 4° and 8° amplitudes. However, the mean WV values in the subgroups were essentially identical to one another at 1° and 2° amplitudes. These results are only suggestive since statistical analysis was unable to confirm the significance of these trends due to the high variability of the data and limited number of subjects.
UVL subjects’ functional status as assessed by the ABC scale also showed some trend for correlation with WV measures from the 8° surface stimulus (r = 0.50), but this result was also not statistically significant (p = 0.114). In contrast, DHI measures in UVL subjects were clearly not correlated with WV even at the highest stimulus amplitude (r = −0.06, p = 0.86).
Discussion
Hypotheses Regarding UVL Compensation
Two hypotheses were considered regarding how loss of vestibular function in one ear might influence how subjects utilize vestibular function for stance control in subjects who have had years to compensate for their vestibular loss. One hypothesis is that UVL would have no influence on stance control because body motions during quiet and perturbed stance are usually quite small relative to the dynamic range over which individual vestibular sensors are able to encode angular and linear motion. Therefore, vestibular sensors in the remaining ear could accurately encode body motion and this motion information could be used as effectively as information derived from two ears.
The second hypothesis is that UVL subjects would decrease reliance on their remaining vestibular function because loss of half of their vestibular afferents would increase the variability (decrease the signal-to-noise) of a vestibular-derived internal estimate of body orientation. Therefore, based on previous considerations for how variability in sensory systems influences the optimal estimate of a sensory percept obtained by combining information from more than one sensory system (Ernst and Banks, 2002), UVL subjects should show reduced use of vestibular information for stance control compared to subjects with normal vestibular function. Under our eyes-closed experimental conditions, proprioceptive and vestibular sensory systems were the primary systems available for sensing body-sway. If the brain uses an internal estimate of body orientation derived from a combination of proprioceptive and vestibular cues, then subjects with a higher variance of the vestibular contribution should rely less on vestibular information and more on proprioceptive information. Assuming this internal estimate determines the corrective actions that subjects make in response to balance perturbations, then body-sway responses to perturbations should differ between subjects with higher vestibular variance (due to UVL) and those with lower vestibular variance (normal vestibular function) for perturbations where proprioceptive and vestibular orientation signals differ from one another. Specifically on a rotating surface, proprioceptive cues, signaling body-sway relative to the surface, and vestibular cues, signaling body orientation in space, encode different orientation signals. Therefore, subjects with reduced reliance on vestibular and increased reliance on proprioceptive cues (e.g., UVL subjects) should show larger body-sway responses to surface-tilts since these subjects would orient to the tilting surface more than subjects who rely to a greater extent on vestibular information (e.g., subjects with normal vestibular function).
Results from this study demonstrated a clear difference between UVL and control subjects in their sway responses to surface-tilt. Consistent with the optimal estimation hypothesis, UVL subjects swayed more in response to surface-tilts than control subjects (Figure 2) suggesting that UVL subjects were relying more on proprioceptive information and less on vestibular information for stance control than subjects with normal vestibular function. While results based on sway magnitude alone provide suggestive evidence for changes in reliance on sensory systems, these results are not conclusive since there might be other causes for the observed changes in sway magnitude. For example, UVL subjects might have a degraded ability to control body orientation such that they generate too little corrective torque and thus sway more in response to a perturbation than control subjects. Alternatively, UVL subjects might co-contract their leg muscles resulting in an increased tendency to orient toward the tilting surface. Therefore, we employed a model-based analysis to provide a more detailed interpretation of the sway responses.
Model-Based Interpretation
Model parameters, estimated from curve fits of the FRF equation (Eq. 1 representing the feedback control model in Figure 1) to the FRFs derived from the experimental data, represent different functional aspects of the stance control system including: (1) a sensory integration mechanism represented by WV and WP sensory weight parameters, (2) an active control mechanism represented by neural controller parameters that indicate how much corrective torque is generated in relation to sensory-derived orientation information, and (3) a passive mechanism represented by passive stiffness and damping parameters that characterize the amount of corrective torque generated by the biomechanical properties of muscles and tendons.
A number of model parameters showed amplitude-dependent changes for both control and UVL subjects (Table 3). Collectively, these parameter changes accounted for the observed amplitude-dependent changes in FRFs. However, most of the amplitude-dependent parameter variations were similar in control and UVL subjects and, therefore, do not account for the differences in FRFs between subject groups. Specifically, there was no significant difference between UVL and control subjects in their neural controller parameters or passive stiffness and damping parameters. Thus, there was no evidence that active, neurally mediated control was inadequate in UVL subjects or that UVL subjects used co-contraction (An increase in passive control parameters would be consistent with increased co-contraction that changes the biomechanical properties of muscles).
Consistent with our second hypothesis predicting decreased reliance on vestibular information for postural control, the only significant difference between control and UVL subjects was in their sensory weight parameters with UVL subjects showing less reliance on vestibular information at all stimulus amplitudes tested (Figure 4). Averaged across all stimulus amplitudes, WV in UVL subjects was only 43% of the WV in control subjects. Like control subjects, UVL subjects were able to alter their utilization of sensory information to adjust to increasing stimulus amplitude by increasing their utilization of vestibular cues. An increase in WV and corresponding decrease in WP allows a subject to decrease sensitivity to a surface-tilt perturbation and thus improves the likelihood that the subject can maintain balance even during large perturbations. However, the large difference between WV in control and UVL subjects indicates that UVL subjects would be more vulnerable to loss of balance in conditions where visual orientation cues are absent and proprioceptive cues provide inaccurate information about earth-vertical orientation (e.g., stance on sloped or compliant surfaces in low light conditions).
The association between the variability of sensory signals and sensory weights is supported by results from a recent study that applied optimization methods to predict various experimentally observed features of human postural sway evoked by pseudorandom surface-tilt stimuli (van der Kooij and Peterka, 2011). This study demonstrated that amplitude-dependent changes in sensory weights, measured in subjects with normal vestibular function, could be predicted if it was assumed that (1) the system includes both internal sensory and motor noise sources, but is dominated by sensory noise, (2) the vestibular sensory noise is about ten times larger than proprioceptive noise, and (3) the postural control system parameters are optimally adjusted to minimize body-sway velocity. The observed low reliance on vestibular information (i.e., small Wv) at low stimulus amplitudes is consistent with the large variance of vestibular signals relative to proprioceptive signals. With increasing surface-tilt amplitude, minimization of body-sway velocity favors increased reliance on vestibular information, despite its large noise variance, because an increased reliance on vestibular information is accompanied by a decreased reliance on proprioceptive information, thus reducing the magnitude of body-sway evoked by a surface-tilt stimulus.
Sensory weight variations across individual subjects indicate that subjects with chronic, complete UVL vary greatly in the extent to which they depend upon vestibular function on their intact side for stance control (Figure 5B). For example, vestibular dependence during 4° amplitude surface rotations varied from almost zero to almost 60% among UVL subjects. Control subjects also showed variation in their vestibular weights (Figure 5A). Nevertheless, there was substantial separation between WV measures from UVL and control subjects. When WV measures were averaged across the four stimulus amplitudes for each individual subject, the average WV values for 9 of the 11 control subjects were larger than the WV values of all 11 UVL subjects. This separation between WV measures in control and UVL subjects suggests that the testing and analysis methods employed in this study might contribute to the neuro-otologic assessment of patients with suspected unilateral vestibular deficits. In particular, results from this study contrast with previous results using sensory organization tests that demonstrated that results are often normal in compensated UVL subjects (Black et al., 1989; Fetter et al., 1991; Parietti-Winkler et al., 2006, 2010, 2011). Therefore, the methods we employed in this study appear to be more sensitive than sensory organization tests in detecting differences between postural control in control and UVL subjects. Our study also demonstrated that UVL subjects use a sensory substitution strategy to control balance even in non-challenging test conditions.
The reasons for the wide variation in sensory weighting and re-weighting among UVL subjects are unknown, but could be due to differences in (1) the integrity of peripheral vestibular function in their remaining intact ear, (2) central compensation capabilities, (3) daily living activity levels and rehabilitation experiences, or (4) their ability to utilize proprioceptive information for stance control (i.e., higher variability in proprioceptive signals would favor increased use of vestibular information even though vestibular variability was also large due to UVL). Similarly for subjects with normal vestibular function, the variability of orientation cues derived from vestibular and proprioceptive systems could vary across subjects, and daily living activity levels could influence their ability to optimally integrate sensory cues for stance control.
Functional Correlations
Subjects were tested an average of 9 years, and minimally 1 year, following their vestibular loss. Therefore, they were at some steady-state level of compensation for their vestibular loss. However, their scores on patient questionnaires (ABC, DHI, and VDADL), designed to provide a functional assessment of balance impairments affecting daily living, demonstrate that all of the UVL subjects rated themselves as having more functional difficulties than control subjects (Table 1). This raised the question as to whether there was a relationship between UVL subjects’ self assessment of their functional abilities and results from our current study. A plausible hypothesis is that UVL subjects who differed the most from control subjects in their ability to utilize sensory orientation information for stance control in changing conditions would rate themselves as being more impaired than UVL subjects whose sensory utilization was closer to normal.
Two of the three functional assessment questionnaires (ABC and VDADL, but not DHI) showed some level of correlation with sensory weights, although the correlation coefficients never reached statistical significance with the limited number of subjects in this study (largest correlation coefficients of 0.5 for ABC and 0.62 for VDADL). The absence of correlation of DHI with posturography results in compensated UVL subjects is consistent with findings in a previous study (Mbongo et al., 2007). Thus, the balance related questionnaires, but not the dizziness questionnaire, were related to sensory weighting. It is interesting to note that the correlations were largest with WV measures obtained at the highest amplitude of the surface-tilt stimulus and there was no hint of correlation with WV values measured at the lowest stimulus amplitudes (1° and 2° amplitudes). The highest stimulus amplitudes require the stance control system to make the largest sensory re-weighting adjustments in order to avoid instability. Therefore, the higher correlations with functional assessments at higher stimulus amplitudes indicate that UVL subjects who were least able to adjust to changing stimulus conditions also reported having more functional difficulties. In contrast, at the lowest stimulus amplitude, UVL subjects were all almost entirely reliant on proprioceptive information for stance control (Figure 5B). Thus, there was insufficient variation among WV values obtained at low stimulus amplitudes for there to be any correlation of WV with functional measures.
The moderate correlations observed between functional measures and sensory weights suggest that a test paradigm similar to the one used in this study might provide (1) a quantitative measure for judging the level of compensation for vestibular disorders and (2) a method to track the success of rehabilitation methods designed to improve balance function. Although this study was limited to the assessment of proprioceptive and vestibular contributions to balance function, similar methods using visual stimuli are able to provide estimates of visual weight parameters characterizing the visual contribution to stance control (Peterka, 2002). Thus, methods employed in the current study could be extended to investigate the contribution of the visual system to compensation for UVL and to determine whether abnormal use of visual motion cues is indicative of poor functional compensation.
Conflict of Interest Statement
The authors declare that the research was conducted in the absence of any commercial or financial relationships that could be construed as a potential conflict of interest.
Acknowledgments
Work supported by NIH NIA grant AG-17960 and NIDCD grant 004082.
References
Allum, J. H. J., and Adkin, A. L. (2003). Improvements in trunk sway observed for stance and gait tasks during recovery from an acute unilateral peripheral vestibular deficit. Audiol. Neurootol. 8, 286–302.
Angelaki, D. E., McHenry, M. Q., Dickman, J. D., Newlands, S. D., and Hess, B. J. (1999). Computation of inertial motion: neural strategies to resolve ambiguous otolith information. J. Neurosci. 19, 316–327.
Black, F. O., Shupert, C. L., Peterka, R. J., and Nashner, L. M. (1989). Effects of unilateral loss of vestibular function on the vestibulo-ocular reflex and postural control. Ann. Otol. Rhinol. Laryngol. 98, 884–889.
Borel, L., Harlay, F., Magnan, J., Chays, A., and Lacour, M. (2002). Deficits and recovery of head and trunk orientation and stabilization after unilateral vestibular loss. Brain 125, 880–894.
Casabona, A., Stella Valle, M., Bosco, G., and Perciavalle, V. (2004). Cerebellar encoding of limb position. Cerebellum 3, 172–177.
Cenciarini, M., and Peterka, R. J. (2006). Stimulus-dependent changes in the vestibular contribution to human postural control. J. Neurophysiol. 95, 2733–2750.
Cohen, H. S., and Kimball, K. T. (2000). Development of the vestibular disorders activities of daily living scale. Arch. Otolaryngol. Head Neck Surg. 126, 881–887.
Curthoys, I. S., and Halmagyi, G. M. (1995). Vestibular compensation: a review of the oculomotor, neural and clinical consequences of unilateral vestibular loss. J. Vestib. Res. 5, 67–107.
Curthoys, I. S., and Halmagyi, G. M. (2007). “Vestibular compensation: clinical changes in vestibular function with time after unilateral vestibular loss,” in Vestibular Rehabilitation, ed. S. Herdman (Philadelphia, FA: Davis), 76–97.
Darrouzet, V., Martel, J., Enée, V., Bébéar, J.-P., and Guérin, J. (2004). Vestibular schwannoma surgery outcomes: our multidisciplinary experience in 400 cases over 17 years. Laryngoscope 114, 681–688.
Davies, W. D. T. (1970). System Identification for Self-Adaptive Control. London: Wiley-InterScience.
Ernst, M. O., and Banks, M. S. (2002). Humans integrate visual and haptic information in a statistically optimal fashion. Nature 415, 429–433.
Fetter, M., Diener, H.-C., and Dichgans, J. (1991). Recovery of postural control after an acute unilateral vestibular lesion in humans. J. Vestib. Res. 1, 373–383.
Fetter, M., and Zee, D. S. (1988). Recovery from unilateral labyrinthectomy in rhesus monkey. J. Neurophysiol. 59, 370–393.
Goldberg, J. M., and Fernandez, C. (1971). Physiology of peripheral neurons innervating semicircular canals of the squirrel monkey. III. Variations among units in their discharge properties. J. Neurophysiol. 34, 676–684.
Halmagyi, G. M., Curthoys, I. S., Cremer, P. D., Henderson, C. J., Todd, M. J., Staples, M. J., and D’Cruz, D. M. (1990). The human horizontal vestibulo-ocular reflex in response to high-acceleration stimulation before and after unilateral vestibular neurectomy. Exp. Brain Res. 81, 479–490.
Halmagyi, G. M., Weber, K. P., Aw, S. T., Todd, M. J., and Curthoys, I. S. (2008). Impulsive testing of semicircular canal function. Prog. Brain Res. 171, 187–194.
Halmagyi, G. M., Weber, K. P., and Curthoys, I. S. (2010). Vestibular function after acute vestibular neuritis. Restor. Neurol. Neurosci. 28, 33–42.
Horak, F. B. (2010). Postural compensation for vestibular loss. Restor. Neurol. Neurosci. 28, 57–68.
Humphriss, R. L., Baguley, D. M., and Moffat, D. A. (2003). Change in dizziness handicap after vestibular schwannoma excision. Otol. Neurotol. 24, 661–665.
Ishida, A., and Miyazaki, S. (1987). Maximum likelihood identification of a posture control system. IEEE Trans. Biomed. Eng. 34, 1–5.
Jacobson, G. P., and Newman, C. W. (1990). The development of the dizziness handicap inventory. Arch. Otolaryngol. Head Neck Surg. 116, 424–427.
Johansson, R., Magnusson, M., and Akesson, M. (1988). Identification of human postural dynamics. IEEE Trans. Biomed. Eng. 35, 858–869.
Kuo, A. D. (2005). An optimal state estimation model of sensory integration in human postural balance. J. Neural Eng. 2, S235–S249.
Levo, H., Blomstedt, G., and Pyykkö, I. (2004). Postural stability after vestibular schwannoma surgery. Ann. Otol. Rhinol. Laryngol. 113, 994–999.
Maurer, C., Mergner, T., and Peterka, R. J. (2006). Multisensory control of human upright stance. Exp. Brain Res. 171, 231–250.
Mbongo, F., Patko, T., Vibert, N., Tran Ba Huy, P., and de Waele, C. (2005). Postural control in patients with unilateral vestibular lesions is more impaired in the roll than the pitch plane: a static and dynamic posturography study. Audiol. Neurotol. 10, 291–302.
Mbongo, F., Tran Ba Huy, P., Vidal, P. P., and de Waele, C. (2007). Relationship between dynamic balance and self-reported handicap in patients who have unilateral peripheral vestibular loss. Otol. Neurotol. 28, 905–910.
McIlroy, W. E., and Maki, B. E. (1994). The ‘deceleration response’ to transient perturbation of upright stance. Neurosci. Lett. 175, 13–16.
Merfeld, D. M., and Zupan, L. H. (2002). Neural processing of gravitoinertial cues in humans. iii. modeling tilt and translation responses. J. Neurophysiol. 87, 819–833.
Mergner, T., Huber, W., and Becker, W. (1997). Vestibular-neck interaction and transformation of sensory coordinates. J. Vestib. Res. 7, 347–367.
Mergner, T., Siebold, C., Schweigart, G., and Becker, W. (1991). Human perception of horizontal trunk and head rotation in space during vestibular and neck stimulation. Exp. Brain Res. 85, 389–404.
Nashner, L. M. (1993). “Computerized dynamic posturography,” in Handbook of Balance Function Testing, eds G. P. Jacobson, C. W. Newman, and J. M. Kartush (St. Louis: Mosby-Year Book, Inc.), 280–307.
Nashner, L. M., and Peters, J. F. (1990). Dynamic posturography in the diagnosis and management of dizziness and balance disorders. Neurol. Clin. 8, 331–349.
Parietti-Winkler, C., Gauchard, G. C., Simon, C., and Perrin, P. P. (2006). Sensorimotor postural rearrangement after unilateral vestibular deafferentation in patients with acoustic neuroma. Neurosci. Res. 55, 171–181.
Parietti-Winkler, C., Gauchard, G. C., Simon, C., and Perrin, P. P. (2010). Long-term effects of vestibular compensation on balance control and sensory organization after unilateral deafferentation due to vestibular schwannoma surgery. J. Neurol. Neurosurg. Psychiatry 81, 934–936.
Parietti-Winkler, C., Gauchard, G. C., Simon, C., and Perrin, P. P. (2011). Pre-operative vestibular pattern and balance compensation after vestibular schwannoma surgery. Neuroscience 172, 285–292.
Parving, A., Tos, M., Thomsen, J., Møller, H., and Buchwald, C. (1992). Some aspects of life quality after surgery for acoustic neuroma. Arch. Otolaryngol. Head Neck Surg. 118, 1061–1064.
Peterka, R. J. (2002). Sensorimotor integration in human postural control. J. Neurophysiol. 88, 1097–1118.
Peterka, R. J. (2003). Simplifying the complexities of maintaining balance. IEEE Eng. Med. Biol. Mag. 22, 63–68.
Peterka, R. J., and Black, F. O. (1990). Age-related changes in human posture control: sensory organization tests. J. Vestib. Res. 1, 73–85.
Pintelon, R., and Schoukens, J. (2001). System Identification: A Frequency Domain Approach. New York: IEEE Press.
Powell, L. E., and Myers, A. M. (1995). The activities-specific balance confidence (ABC) scale. J. Gerontol. A Biol. Med. Sci. 50A, M28–M34.
Saman, U., Bamiou, D.-E., and Gleeson, M. (2009). A contemporary review of balance dysfunction following vestibular schwannoma surgery. Laryngoscope 119, 2085–2093.
Sungho, J., and Massaquoi, S. G. (2004). A model of cerebellum stabilized and scheduled hybrid long-loop control of upright balance. Biol. Cybern. 91, 188–202.
Tribukait, A., Bergenius, J., and Brantberg, K. (1998). Subjective visual horizontal during follow-up after unilateral vestibular deafferentation with gentamicin. Acta Otolaryngol. 118, 479–487.
van der Kooij, H., Jacobs, R., Koopman, B., and Grootenboer, H. (1999). A multisensory integration model of human stance control. Biol. Cybern. 80, 299–308.
van der Kooij, H., and Peterka, R. J. (2011). Non-linear stimulus-response behavior of the human stance control system is predicted by optimization of a system with sensory and motor noise. J. Comput. Neurosci. 30, 759–778.
Keywords: vestibular, posture, unilateral, balance, compensation
Citation: Peterka RJ, Statler KD, Wrisley DM and Horak FB (2011) Postural compensation for unilateral vestibular loss. Front. Neur. 2:57. doi: 10.3389/fneur.2011.00057
Received: 22 November 2010; Accepted: 18 August 2011;
Published online: 06 September 2011.
Edited by:
Ulrich Mansmann, University of Munich, GermanyReviewed by:
Itsaso Olasagasti, Zurich University Hospital, SwitzerlandAndrew Clarke, Charité Universitaetsmedizin Berlin, Germany
Copyright: © 2011 Peterka, Statler, Wrisley and Horak. This is an open-access article subject to a non-exclusive license between the authors and Frontiers Media SA, which permits use, distribution and reproduction in other forums, provided the original authors and source are credited and other Frontiers conditions are complied with.
*Correspondence: Fay B. Horak, Oregon Health & Science University, OHSU West Campus, Mail Code NSI, 505 NW 185th Avenue, Beaverton, OR 97006, USA. e-mail:aG9yYWtmQG9oc3UuZWR1