 Katharina Hüfner1,2*
 Thomas Stephan1,4
 Virginia L. Flanagin2,3 Angela Deutschländer2,4 Thomas Dera1 Cornelia Karch1 Jennifer Linn5 Stefan Glasauer2,3
 Marianne Dieterich1,2
 Michael Strupp1,2
 Thomas Brandt2,4
- 1 Department of Neurology, Hospital of the University of Munich, Ludwig-Maximilians University, Munich, Germany
- 2 Integrated Research and Treatment Center for Vertigo IFBLMU, Hospital of the University of Munich, Ludwig-Maximilians University, Munich, Germany
- 3 Bernstein Center for Computation Neurosciences, Hospital of the University of Munich, Ludwig-Maximilians University, Munich, Germany
- 4 Institute for Clinical Neurosciences, Hospital of the University of Munich, Ludwig-Maximilians University, Munich, Germany
- 5 Department of Neuroradiology, Hospital of the University of Munich, Ludwig-Maximilians University, Munich, Germany
Structural brain abnormalities associated with congenital nystagmus (CN) are still unknown. In some patients with CN additional sensory, metabolic, or gross structural alterations can be detected. In the present study voxel-based morphometry was used to compare the gray matter (GM) brain volumes of 14 individuals with CN without associated sensory, metabolic, or obvious structural alterations (i.e., idiopathic CN) to those of a group of controls. Further, GM brain volumes were correlated with nystagmus severity as measured by sway path. Intergroup comparison exhibited significant volume increases in the human motion sensitive complex V5/MT+, the fusiform gyrus, and the middle occipital gyrus bilaterally in CN. These volume increases may be associated with excess visual motion stimulation due to involuntary retinal slip of the visual scene. A positive correlation (linear model) of nystagmus sway path with cerebellar GM volume was seen in the following areas: vermal parts VIII-X as well as hemisphere lobule II, hemisphere VI, crus I, crus II, and lobule VII-IX bilaterally. There is evidence that the reported GM volume changes in the vestibulo-cerebellum, which correlated with nystagmus sway path, might be related to the subjects‘ attempt to maintain fixation, rather than be due to the generation of nystagmus.
Introduction
Congenital nystagmus (CN; classified as infant nystagmus syndrome in 2001) has its onset within the first few months of life. In some individuals it may be associated with metabolic (e.g., hypothyroidism), sensory (e.g., achromatopsia), or structural abnormalities of the brain (excessive or absent crossing of nasal fibers at the optic chiasm; Leigh and Zee, 1999). In over 60% of afflicted subjects no additional abnormalities can be found (Leigh and Zee, 1999), this entity can thus be termed “idiopathic CN.” The clinical picture of CN can be highly variable, but its typical appearance is that of a conjugate, predominantly horizontally beating jerk nystagmus with waveforms that show a slow phase with an exponential increase in velocity or that have a pendular shape; periods of foveation are frequently superimposed on both waveforms (Jacobs and Dell’Osso, 2004). The nystagmus interferes with fixation, is often exacerbated in stressful situations, and is sometimes suppressed by convergence. Intensity varies depending on gaze direction (null zone). Individuals with CN can have normal or near normal visual function (depending on foveation times) unless additional afferent deficits are present (for an overview of clinical characteristics see Khanna and Dell’Osso, 2006). Unlike patients with acquired nystagmus, most individuals with CN do not experience illusory motion of the visual surroundings (oscillopsia; Leigh et al., 1988). Such spatial inconstancy can, however, be provoked in many CN individuals under laboratory conditions, depending on the contrast and luminance of the stimulus as well as the viewing angle (Tkalcevic and Abel, 2003).
Several compelling theories have been put forward to elucidate the pathophysiology of abnormal eye movements in CN. All these models and hypotheses have been generated on the basis of eye movement analysis. Voxel-based morphometry (VBM) has not yet been used (to the best of our knowledge) to approach the question of whether CN might be associated with distinct brain volume changes. Our aim in this study was thus to identify such brain areas using VBM. On the basis of previous literature, the region of interest (ROI) selected included the cerebellum and the visually driven cortex areas (Schmitz et al., 2004; Schlindwein et al., 2009).
Materials and Methods
Subjects
Fourteen individuals (seven males, mean age: 28.3 years, SD: 9.38 years) diagnosed to have CN at the Department of Ophthalmology, Ludwig-Maximilians University, Munich, Germany were included in the study (four additional individuals with CN had to be excluded from the study after on-site questioning revealed incompatibilities for elective MRI scanning). All individuals had undergone surgery for correction of CN 1–29 years prior to the study at the Department of Ophthalmology, Ludwig-Maximilians University, Munich, Germany. Subject characteristics are given in Table 1; all subjects had conjugate nystagmus and eight subjects had amblyopia. No further ophthalmological disorders were noted. Subjects were compared to a group of 18 individuals without any ocular motor, neurological, or visual abnormalities (11 males, mean age: 28.56 year, SD: 8.58 years). In accordance with the Declaration of Helsinki (last adopted at the 52nd World Medical Association General Assembly 2000 in Edinburgh), all subjects gave their informed, written consent before the experiment. The study was approved by the Ethics Committee of the Ludwig-Maximilians University, Munich, Germany.
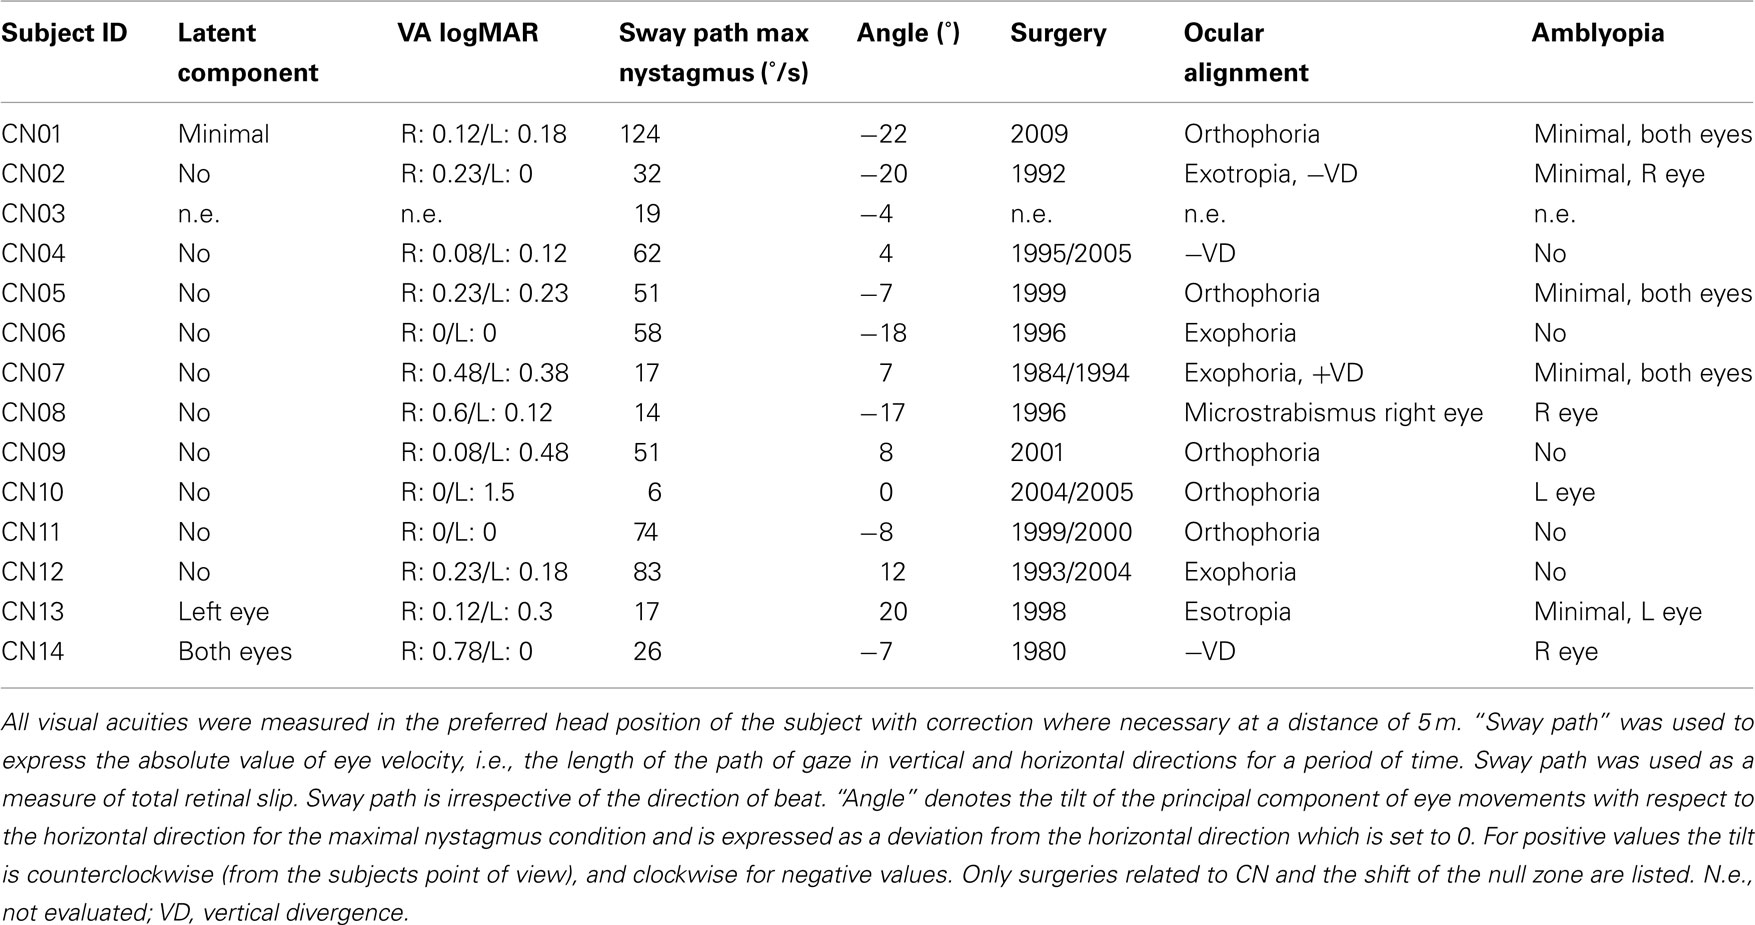
Table 1. Subject characteristics.
MRI Measurements
Acquisition protocol
All MRI scans were obtained using a clinical standard 3.0 T General Electric (GE) Signa system (HDx platform; GE Medical Systems, Milwaukee, WI, USA) and an eight-channel standard head coil. A 3D gradient-echo sequence (FSPGR fast-spoiled gradient recalled), with a voxel size of 0.86 mm × 0.86 mm × 1.4 mm, and 0.7 mm oversampling in the z direction was used to acquire T1-weighted brain images from all subjects.
Voxel-based morphometry
Voxel-based morphometry was used to analyze the 3D FSPGR data sets. Data were processed using SPM5 (Wellcome Department of Cognitive Neurology, London, UK)1 and the VBM 5.1 toolbox2, both implemented in Matlab (The MathWorks, Natick, MA, USA). The following preprocessing steps of the VBM toolbox were applied: spatial normalization to the space defined by the MNI template, tissue classification, and registration using linear and non-linear transformations (warping) within the same generative model (Ashburner and Friston, 2005). Analysis was performed on modulated gray matter (GM) segments, which were multiplied by the non-linear components derived from the normalization matrix to preserve actual GM volumes locally, and then smoothed with an 8-mm isotropic Gaussian kernel. The confounding effects of individual differences in brain orientation, alignment, and size were accounted for by applying modulation for non-linear warping only.
Voxel-wise GM differences between CN subjects and controls were analyzed using statistical parametric mapping software (SPM5). Voxel-wise GM intensity values for each subject were entered according to their group into a general linear model. Age was included as a covariate in the model. Voxel-wise statistical parametric maps were created using linear contrasts, which identified brain regions containing significant local GM volume differences between CN subjects and controls (Friston et al., 1995). A functional ROI for visual motion processing was created in this specific study population by scanning the same patients and controls that participated in the VBM experiment and by mapping the area V5/MT+ as well as other visually driven cortex areas using a localization fMRI experiment. fMRI stimuli were presented on a back projection screen (visual field of view 25° horizontal, 19° vertical, viewing distance: 60 cm) located inside the bore of the MRI scanner, behind the subject’s head. Subjects were able to view this screen using a mirror. A random dot movement based on experiments by Morrone et al. (2000) was used for visual motion stimulation during fixation of a central target. The motion stimuli consisted of 100 white and 100 black dots moving in random directions (dot diameter 0.3°, speed 7°/s, lifetime 0.3 s, reversal time 2 s) on a gray background. They were presented within a rectangular area that reached from +7° off center to the right border of the screen and from −7° off center to the left border of the screen. The control condition consisted of fixation of a stationary target on an isoluminant gray background. The motion stimuli were alternated with the control condition in a block design (block length 8 MRI scans, TR 2500 ms, six repetitions of each motion stimulus). The data were analyzed for CN individuals and controls together to obtain the mask used as a ROI (including: lingual gyrus, fusiform gyrus, superior, middle and inferior occipital gyrus, calcarine area, superior and inferior temporal gyrus). All VBM results of CN > control and control > CN are reported within this functional ROI.
In a second, separate general linear model analysis, GM volume changes in the cerebellum were correlated with nystagmus sway path and angle using images from only the CN subject group. A ROI covering the entire cerebellum was created using the WFU-Pickatlas toolbox (ANSIR, Wake Forest University; Maldjian et al., 2003). All results of the analysis are reported within this cerebellar ROI. Anatomical structures were named according to the Automated Anatomical Labeling Atlas (Tzourio-Mazoyer et al., 2002) for supratentorial structures and using Schmahmann et al. (1999) and Larsell and Jansen (1972) for the cerebellum. In all analyses, results at p < 0.05 corrected for multiple comparisons, FDR (false discovery rate), were considered significant. Clusters exceeding 1 voxel were reported.
Video-Oculography
Eye movements were recorded in all CN subjects using infrared video-oculography (VOG) with an in-house custom-built system (software “EyeSeeCam”; Schneider et al., 2009) that stored horizontal and vertical eye positions, eye velocities, and video recordings. An analog video camera monitored the right eye of the subjects at 60 frames per second while the left eye was covered with a patch. Resolution of the VOG was <0.1°. A five point calibration procedure was performed in all subjects. Eye movements were then recorded during fixation of a target with minimal and maximal nystagmus positions. Analysis of the recorded VOG data was performed off-line using Matlab (The MathWorks). Mean horizontal and vertical eye positions and mean eye velocities were calculated for minimal and maximal nystagmus conditions. The absolute value of eye velocity was expressed as sway path (°/s), i.e., the length of the path of gaze in vertical and horizontal directions for a period of time. Sway path was used as a measure of total retinal slip. Sway path is irrespective of the direction of beat. The predominant beating direction (nystagmus angle) of the nystagmus for the maximal nystagmus condition (degree) was also computed and expressed as a deviation from the horizontal direction.
Results
Intergroup Comparison of Gray Matter Volume in CN Individuals vs. Controls
Larger GM volumes were found in CN individuals in the middle occipital gyrus, the fusiform gyrus, and in the middle/inferior temporal gyrus bilaterally (Table 2; Figure 1A). The volume changes in the middle/inferior temporal gyrus were located within the caudal part of the mapped area for V5/MT+ (Figure 1B). When visual acuity was included as a covariate in the analysis, no additional GM changes were detected (not shown). No GM volume decreases were found in CN individuals compared to controls.
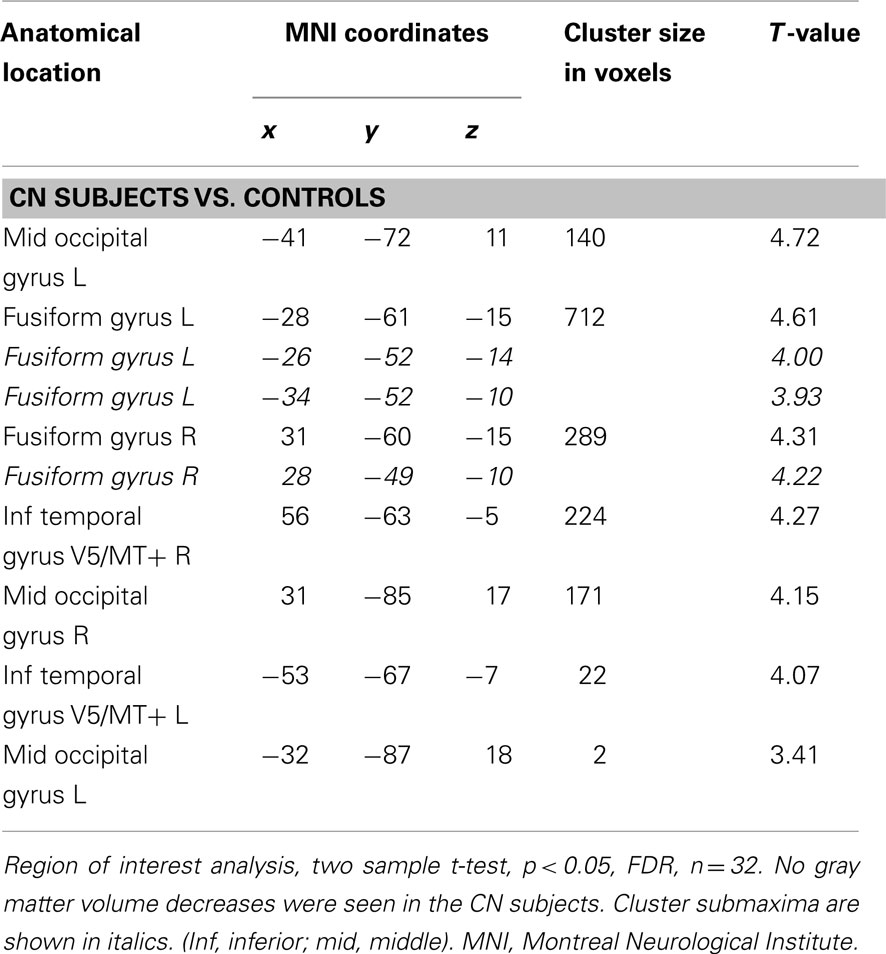
Table 2. Gray matter volume increases in CN subjects vs. controls.
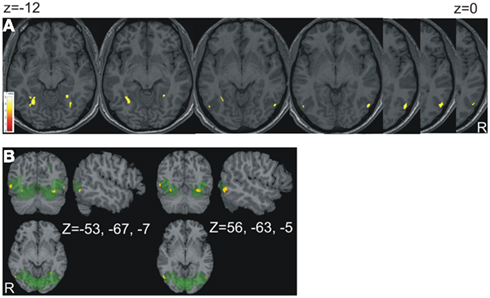
Figure 1. Results of the contrast CN subjects vs. controls. (A) The areas of volume increase in CN subjects were projected onto an individual anatomical brain chosen at random. The slices were chosen from z = −12 to z = 0 (distance 2 mm). They show volume changes in the fusiform and lingual gyri as well as V5/MT+ bilaterally. In (B) the functional ROI (green) is superimposed; x, y, z, views at the two cluster maxima of V5/MT+ are shown.
Correlation of Nystagmus Severity with Cerebellar Volume in CN Subjects
Cerebellar GM volume of the CN individuals correlated positively with nystagmus sway path (linear model) in vermis VIII (pyramis), IX (uvula), and X (nodulus; Table 3; Figure 2A). Correlations were also found with cerebellar hemisphere lobule II (left, lingula), hemisphere VI (right, lobus simplex), crus I (right, lobulus ansiformis), crus II (lobulus ansiformis), and lobule VII (lobus paramedianus), VIII (lobus biventer), and IX (paraflocculus) bilaterally. No negative correlations between cerebellar GM volume and nystagmus sway path were found in CN individuals, and no correlations with a positive or negative nystagmus angle were found (not shown). The normalized local cerebellar volume values were extracted at x = 6 y = −72 z = −48 (local cluster maximum) and plotted vs. nystagmus sway path (Figure 2B). VOI were extracted from several additional locations within the cerebellar clusters and all tested correlations were positive. For comparison, an analysis was also done for the group of controls by assuming their sway path to be 0. The variation of GM volume in the selected VOI was about the same in controls as in CN individuals (Figure 2B).
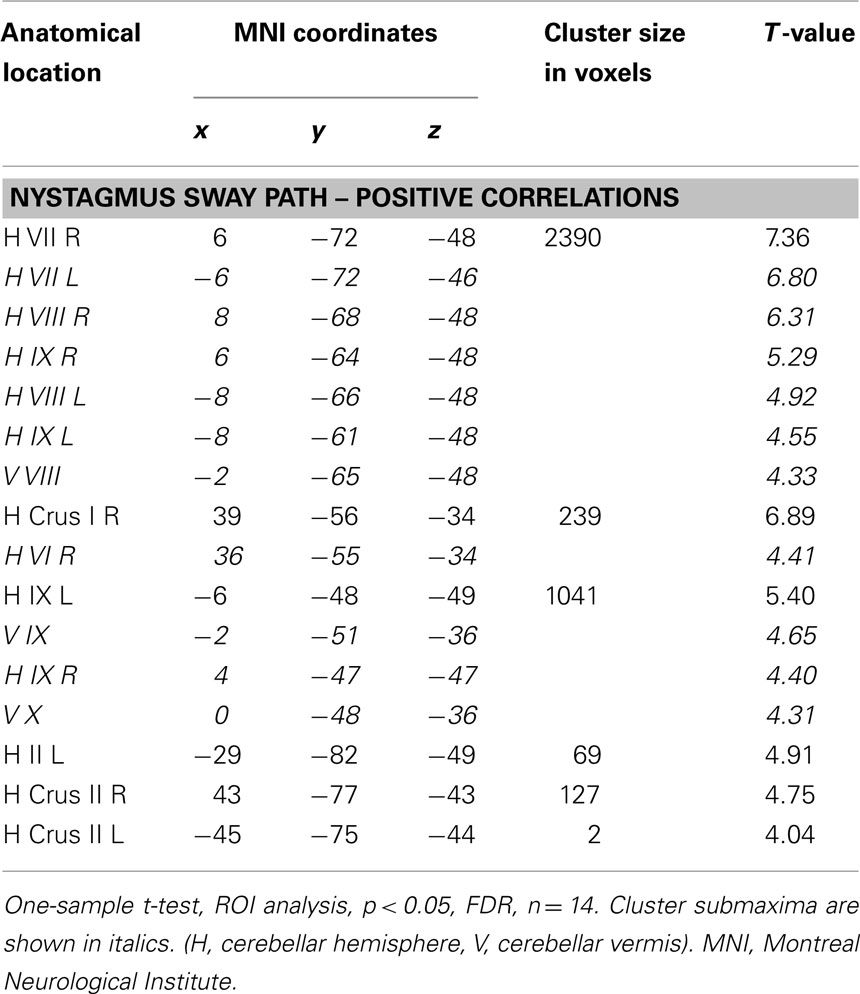
Table 3. Gray matter cerebellar volumes that correlated positively with CN sway path in CN subjects.
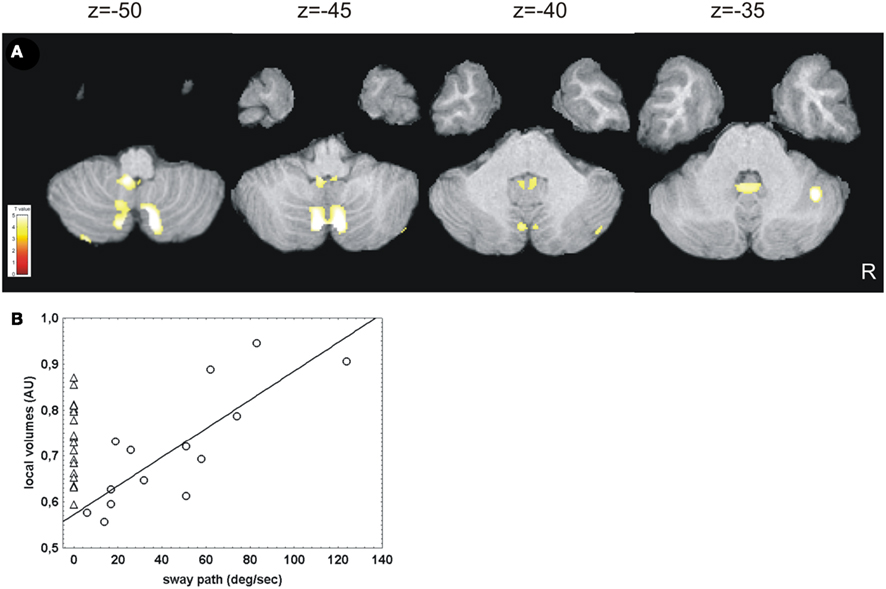
Figure 2. Results of correlation analysis of cerebellar gray matter volume with nystagmus severity in CN subjects. (A) A positive correlation of cerebellar gray matter volume with nystagmus sway path was found in CN subjects (linear model), while no overall changes in gray matter compared to controls were detected. In (B) the normalized local cerebellar volume values were plotted against nystagmus sway path for display purposes. Normalized local cerebellar volume values were extracted at x = 6 y = −72 z = −48 (local cluster maximum) within a specified volume of interest (VOI) to obtain an indirect measure of gray matter thickness (arbitrary units, AU). The triangles in (B) depict the wide variability of cerebellar volume in controls. In the CN subjects the linear correlation between the cerebellar volume and the nystagmus severity is demasked only by adding nystagmus sway path as a variable [circles in (B)]. The correlation statistics were calculated for the CN subjects at r = 0.85, p < 0.001. The r values must be interpreted with caution, since such values tend to be overestimated in this kind of analysis (Vul et al., 2009).
Discussion
Our aim in this study was to identify GM volume changes of the human brain that are associated with CN in patients without associated sensory deficits or metabolic disease. The main findings of our study were as follows: (1) the GM brain volume was larger in visually driven cortex areas including V5/MT+ in CN subjects than in controls. (2) There was a positive linear correlation between cerebellar GM volume in the vestibulo-cerebellum and adjacent vermal and paravermal structures with nystagmus sway path in subjects with CN. (3) No GM decreases were found in subjects with CN.
Gray Matter Volume Increases in Visually Driven Cortex Areas and Oscillopsia
The volume changes observed in the visually driven cortex areas in our subjects with CN were located within the lateral aspects of the anatomical landmarks described for V5/MT+ in studies (Dumoulin et al., 2000; Malikovic et al., 2007). There are two alternative explanations as to the functional significance of the GM volume increases observed in the current study. First, the mere viewing of a stationary scene activates V5/MT+ due to nystagmus and this excessive motion stimulation may cause the hypertrophy in CN. An fMRI study on albino subjects (all of whom had CN) investigated the decussation of optic nerve/tract fibers and found that static monocular checkerboard stimulation led to activation of the middle/inferior temporal gyrus in the CN subjects (Schmitz et al., 2004). This indicates that areas such as V5/MT+ can be activated due to nystagmus when static scenes are viewed. This interpretation is further supported by an fMRI study in patients with bilateral vestibular failure, who were stimulated with a visual motion paradigm. They had increased BOLD activations in V5/MT+ during optokinetic nystagmus compared to healthy controls (Dieterich et al., 2007). This was suggested to reflect increased visual sensitivity and interpreted as evidence of visual substitution for the vestibular failure. The amblyopia which was present in 8/14 CN subjects did not contribute to the GM increases in the visually driven cortex areas in our study. Additionally amblyopia in adults has been shown to be associated with GM volume decreases in visually driven cortex areas (Mendola et al., 2005). Alternatively, the volume increases could be due to the active suppression of oscillopsia in CN individuals. This is supported by psychophysical studies (Dieterich and Brandt, 1987). We also observed volume increases in the middle occipital gyrus and the fusiform gyrus bilaterally in CN subjects; both regions have been shown to be involved in the processing of motion stimuli (Shulman et al., 1998).
Cerebellar Volume Correlates with Nystagmus Severity
Intergroup comparison did not exhibit significant GM volume differences in the cerebellum. However, a significant correlation of various cerebellar structures could be demonstrated when the volume was correlated with nystagmus as measured by the sway path. A plausible explanation is provided by the large interindividual variability among CN individuals and healthy controls (Figure 2B): while the nystagmus sway path seems to drive the volume of cerebellar structures in CN subjects, other individual, or environmental as well as subject-specific factors must be responsible for the variations in cerebellar volume in controls. The GM volume correlations in the cerebellum can be separated roughly into vestibulo-cerebellar structures (vermis IX and X and hemispheres IX and X), structures adjacent to the vestibulo-cerebellum (vermis VIII and paravermal hemispheres lobules VII and VIII), and volume changes in the lateral cerebellar hemispheres (lobules II, VI, crus I, and crus II). The vermis and the vestibulo-cerebellum synergize during many ocular motor tasks; in CN they might act to suppress the excess eye movements. The role of the lateral hemispheric parts of the cerebellum during eye movements is much less clear. During CN they might be involved in generating them, as we will describe below.
Vermis VIII (pyramidis) and especially IX (uvula) and X (nodulus) are involved in smooth pursuit and optokinetic responses as has been shown in human (e.g., Baier et al., 2009) and non-human primates (e.g., Heinen and Keller, 1996). This has also been demonstrated for the paraflocculus/flocculus in animal experiments (Zee et al., 1981) as well as by functional imaging studies in humans (Kalla et al., 2006). Activations of the uvula, nodulus, and paraflocculus/flocculus (the vestibulo-cerebellum) have been described during fixation suppression of vestibular nystagmus in a PET study (Naito et al., 2003). The paraflocculus/flocculus is also important for gaze holding, because it exerts a stabilizing influence on brainstem integrators (Zee et al., 1981). We therefore interpret the hypertrophy of vestibulo-cerebellar and adjacent vermal and paravermal structures (hemispheres VII, VIII, and vermis VIII) in CN individuals to be the structural consequence of the constant attempt to inhibit a hyperoscillating system according to the model of Jacobs and Dell’Osso (2004).
Apart from the above-described vestibulo-cerebellar structures that most likely inhibit CN, there is also evidence that hypertrophy of hemisphere VI as well as crus I and II is associated with the generation of eye movements. In general, the role of the lateral cerebellar hemispheres for ocular motor control is more speculative: evidence comes from studies in humans with cerebellar lesions that impaired smooth pursuit initiation (Straube et al., 1997) as well as fMRI studies during optokinetic nystagmus (Bense et al., 2006). Using fMRI we were able to show activations of cerebellar hemispheres (including hemisphere VI and crus II) in individuals with CN while they looked in the direction of maximal nystagmus (unpublished observation). A similar observation was recently published suggesting that the cerebellar declive is involved in ocular motor dysfunction in idiopathic CN (Leguire et al., 2011). Volume increases in the cerebellar hemispheres were also observed in individuals with genetic syndromes, which can like other ophthalmologic and neurological abnormalities, be associated with CN. Additionally in these subjects the cerebellar vermis showed a GM volume loss that might lead to impaired central suppression of the CN in these individuals (Free et al., 2003).
Congenital and Congenital-Type Nystagmus
There are a few single case descriptions of CN and congenital-type nystagmus which involve activation or alteration of cerebellar structures. A PET experiment showed a significant increase in the rCGM in the nodulus of a patient with pendular-type CN (Schlindwein et al., 2009). After an unsuccessful biopsy of a brainstem lesion, which resulted in the removal of a small piece of normal cerebellar tissue from the inferior uvula (IX) and adjacent pyramis (VIII), a horizontal congenital-type spontaneous nystagmus appeared with exponentially increasing velocity of the slow phases (Radtke et al., 2001). Similar nystagmus waveforms were observed in patients with Arnold-Chiari malformation or cerebellar degeneration (e.g., Nakahara and Murofushi, 2003).
Limitations of the Study
Our study has several limitations which could potentially influence the interpretation of the results: first the fact that nystagmus severity was not measured during natural viewing conditions but during minimal and maximal nystagmus intensity. Second the finding that no decreases in GM were found in the CN subjects has to be viewed with caution since our analysis was not initially designed to allow for this kind of conclusion.
Conclusions
In conclusion, we found GM volume increases in subjects with CN. These increases can be related to different aspects of ocular motor and perceptual functions. It appears equally important that no distinct areas of GM volume decreases could be demonstrated. Further longitudinal studies are necessary to resolve whether a causative relationship exits between the observed GM brain volume changes and CN.
Conflict of Interest Statement
The authors declare that the research was conducted in the absence of any commercial or financial relationships that could be construed as a potential conflict of interest.
Acknowledgments
We thank all our CN and control subjects for participating in the study and we thank Dr. Oliver Ehrt at the Department of Ophthalmology at the LMU for help with recruiting the patients. In addition, we are grateful to Judy Benson for copy-editing the manuscript. This work was supported by grants from the German Ministry of Education and Research (BMBF) to the IFBLMU and the Hertie foundation.
Footnotes
References
Baier, B., Stoeter, P., and Dieterich, M. (2009). Anatomical correlates of ocular motor deficits in cerebellar lesions. Brain 132, 2114–2124.
Bense, S., Janusch, B., Vucurevic, G., Bauermann, T., Schlindwein, P., Brandt, T., Stoeter, P., and Dieterich, M. (2006). Brainstem and cerebellar fMRI-activation during horizontal and vertical optokinetic stimulation. Exp. Brain Res. 174, 312–323.
Dieterich, M., Bauermann, T., Best, C., Stoeter, P., and Schlindwein, P. (2007). Evidence for cortical visual substitution of chronic bilateral vestibular failure (an fMRI study). Brain 130, 2108–2116.
Dieterich, M., and Brandt, T. (1987). Impaired motion perception in congenital nystagmus and acquired ocular motor palsy. Clin. Vis. Sci. 1, 337–345.
Dumoulin, S. O., Bittar, R. G., Kabani, N. J., Baker, C. L. Jr., Le, G. G., Bruce, P. G., and Evans, A. C. (2000). A new anatomical landmark for reliable identification of human area V5/MT: a quantitative analysis of sulcal patterning. Cereb. Cortex 10, 454–463.
Free, S. L., Mitchell, T. N., Williamson, K. A., Churchill, A. J., Shorvon, S. D., Moore, A. T., van, H. V., and Sisodiya, S. M. (2003). Quantitative MR image analysis in subjects with defects in the PAX6 gene. Neuroimage 20, 2281–2290.
Friston, K. J., Holmes, A. P., Worsley, K. J., Poline, J. B., Frith, C. D., and Frackowiak, R. S. J. (1995). Statistical parametric maps in functional imaging: a general linear approach. Hum. Brain Mapp. 2, 189–210.
Heinen, S. J., and Keller, E. L. (1996). The function of the cerebellar uvula in monkey during optokinetic and pursuit eye movements: single-unit responses and lesion effects. Exp. Brain Res. 110, 1–14.
Jacobs, J. B., and Dell’Osso, L. F. (2004). Congenital nystagmus: hypotheses for its genesis and complex waveforms within a behavioral ocular motor system model. J. Vis. 4, 604–625.
Kalla, R., Deutschländer, A., Hüfner, K., Stephan, T., Jahn, K., Glasauer, S., Brandt, T., and Strupp, M. (2006). Detection of floccular hypometabolism in downbeat nystagmus by fMRI. Neurology 66, 281–283.
Khanna, S., and Dell’Osso, L. F. (2006). The diagnosis and treatment of infantile nystagmus syndrome (INS). ScientificWorldJournal 6, 1385–1397.
Larsell, O., and Jansen, J. (1972). The Comparative Anatomy and Histology of the Cerebellum. The Human Cerebellum, Cerebellar Connections, and Cerebellar Cortex. Minneapolis: University Minnesota Press.
Leguire, L. E., Kashou, N. H., Fogt, N., Smith, M. A., Lewis, J. R., Kulwin, R., and Rogers, G. L. (2011). Neural circuit involved in idiopathic infantile nystagmus syndrome based on fMRI. J. Pediatr. Ophthalmol. Strabismus 1–10.
Leigh, R. J., Dell’Osso, L. F., Yaniglos, S. S., and Thurston, S. E. (1988). Oscillopsia, retinal image stabilization and congenital nystagmus. Invest. Ophthalmol. Vis. Sci. 29, 279–282.
Leigh, R. J., and Zee, D. S. (1999). The Neurology of Eye Movements, 3rd Edn. New York: Oxford University Press.
Maldjian, J. A., Laurienti, P. J., Kraft, R. A., and Burdette, J. H. (2003). An automated method for neuroanatomic and cytoarchitectonic atlas-based interrogation of fMRI data sets. Neuroimage 19, 1233–1239.
Malikovic, A., Amunts, K., Schleicher, A., Mohlberg, H., Eickhoff, S. B., Wilms, M., Palomero-Gallagher, N., Armstrong, E., and Zilles, K. (2007). Cytoarchitectonic analysis of the human extrastriate cortex in the region of V5/MT+: a probabilistic, stereotaxic map of area hOc5. Cereb. Cortex 17, 562–574.
Mendola, J. D., Conner, I. P., Roy, A., Chan, S. T., Schwartz, T. L., Odom, J. V., and Kwong, K. K. (2005). Voxel-based analysis of MRI detects abnormal visual cortex in children and adults with amblyopia. Hum. Brain Mapp. 25, 222–236.
Morrone, M. C., Tosetti, M., Montanaro, D., Fiorentini, A., Cioni, G., and Burr, D. C. (2000). A cortical area that responds specifically to optic flow, revealed by fMRI. Nat. Neurosci. 3, 1322–1328.
Naito, Y., Tateya, I., Hirano, S., Inoue, M., Funabiki, K., Toyoda, H., Ueno, M., Ishizu, K., Nagahama, Y., Fukuyama, H., and Ito, J. (2003). Cortical correlates of vestibulo-ocular reflex modulation: a PET study. Brain 126, 1562–1578.
Nakahara, H., and Murofushi, T. (2003). Congenital-type nystagmus in Arnold-Chiari malformation. Otolaryngol. Head Neck Surg. 128, 598–600.
Radtke, A., Bronstein, A. M., Gresty, M. A., Faldon, M., Taylor, W., Stevens, J. M., and Rudge, P. (2001). Paroxysmal alternating skew deviation and nystagmus after partial destruction of the uvula. J. Neurol. Neurosurg. Psychiatr. 70, 790–793.
Schlindwein, P., Schreckenberger, M., and Dieterich, M. (2009). Visual-motion suppression in congenital pendular nystagmus. Ann. N. Y. Acad. Sci. 1164, 458–460.
Schmahmann, J. D., Doyon, J., McDonald, D., Holmes, C., Lavoie, K., Hurwitz, A. S., Kabani, N., Toga, A., Evans, A., and Petrides, M. (1999). Three-dimensional MRI atlas of the human cerebellum in proportional stereotaxic space. Neuroimage 10, 233–260.
Schmitz, B., Kasmann-Kellner, B., Schafer, T., Krick, C. M., Gron, G., Backens, M., and Reith, W. (2004). Monocular visual activation patterns in albinism as revealed by functional magnetic resonance imaging. Hum. Brain Mapp. 23, 40–52.
Schneider, E., Villgrattner, T., Vockeroth, J., Bartl, K., Kohlbecher, S., Bardins, S., Ulbrich, H., and Brandt, T. (2009). EyeSeeCam: an eye movement-driven head camera for the examination of natural visual exploration. Ann. N. Y. Acad. Sci. 1164, 461–467.
Shulman, G. L., Schwarz, J., Miezin, F. M., and Petersen, S. E. (1998). Effect of motion contrast on human cortical responses to moving stimuli. J. Neurophysiol. 79, 2794–2803.
Straube, A., Scheuerer, W., and Eggert, T. (1997). Unilateral cerebellar lesions affect initiation of ipsilateral smooth pursuit eye movements in humans. Ann. Neurol. 42, 891–898.
Tkalcevic, L. A., and Abel, L. A. (2003). Effects of stimulus size and luminance on oscillopsia in congenital nystagmus. Vision Res. 43, 2697–2705.
Tzourio-Mazoyer, N., Landeau, B., Papathanassiou, D., Crivello, F., Etard, O., Delcroix, N., Mazoyer, B., and Joliot, M. (2002). Automated anatomical labeling of activations in SPM using a macroscopic anatomical parcellation of the MNI MRI single-subject brain. Neuroimage 15, 273–289.
Vul, E., Harris, C., Winkielman, P., and Pashler, H. (2009). Puzzlingly high correlations in fMRI studies of emotion, personality, and social cognition. Perspect. Psychol. Sci. 4, 274–290.
Keywords: congenital nystagmus, voxel-based morphometry, gray matter changes, structural brain imaging
Citation: Hüfner K, Stephan T, Flanagin VL, Deutschländer A, Dera T, Karch C, Linn J, Glasauer S, Dieterich M, Strupp M and Brandt T (2011) Cerebellar and visual gray matter brain volume increases in congenital nystagmus. Front. Neur. 2:60. doi: 10.3389/fneur.2011.00060
Received: 17 July 2011;
Paper pending published: 29 July 2011;
Accepted: 03 September 2011;
Published online: 29 September 2011.
Edited by:
Susan J. Herdman, Emory University, USAReviewed by:
Michael Schubert, Johns Hopkins University, USAPamela Tridandapani Bhatti, Georgia Institute of Technology, USA
Copyright: © 2011 Hüfner, Stephan, Flanagin, Deutschländer, Dera, Karch, Linn, Glasauer, Dieterich, Strupp and Brandt. This is an open-access article subject to a non-exclusive license between the authors and Frontiers Media SA, which permits use, distribution and reproduction in other forums, provided the original authors and source are credited and other Frontiers conditions are complied with.
*Correspondence: Katharina Hüfner, Department of Neurology, Hospital of the University of Munich, Ludwig-Maximilians University, Marchioninistr. 15, 81377 Munich, Germany. e-mail:a2F0aGFyaW5hLmh1ZWZuZXJAbWVkLnVuaS1tdWVuY2hlbi5kZQ==