 Claus Nissen*
 Birgit Sander and Henrik Lund-Andersen
- Department of Ophthalmology, Glostrup Hospital, University of Copenhagen, Copenhagen, Denmark
Purpose: To evaluate the influence of the size of the light exposed pupil in one eye on the pupillary light reflex of the other eye. Method: Using a monochromatic pupillometer, the left eye in each of 10 healthy subjects was exposed to 20 s of monochromatic light of luminance 300 cd/m2, first red (660 nm) and in a following session, blue (470 nm) light. The consensual pupillary diameter in the right eye was continuously measured before, during, and after light exposure. Subsequently, Tropicamide 1% or Pilocarpine 2% was instilled into the left eye and when the pupil was either maximally dilated or contracted, the entire sequence of red and blue light exposure repeated. After at least 3 days, when the effect of the eye drop had subsided, the entire experiment was repeated, this time employing the other substance. Results: Prior dilatation of the left pupil augmented the post light contraction to blue (p < 0.0001), but not to red light. The contraction during light exposure did not change. Prior contraction of the left pupil decreased the post-stimulus contraction to blue light (p < 0.04). Conclusion: The size of the light exposed pupil influences the magnitude of the response to blue, but not to red light. Prior dilatation may therefore prove useful, when the response to blue light – as a marker of melanopsin containing retinal ganglion cell function – is of interest, especially when this response is weak.
Introduction
The pupillary light reflex (henceforth termed pupillary response) is a physiological reaction of the eye, which is elicited routinely in the physical examination of patients as a marker of the function of the retina, the optic nerve, and the brain stem (Kawasaki, 1999).
Recently it was shown that a subset of retinal ganglion cells in mammals, not comprising more than approximately 1/2% of the total ganglion cell number, governs the pupillary response and entrains the daily rhythm of the organism according to the prevailing luminance and wavelength of ambient light (Berson, 2003). These cells which are intrinsically photosensitive to blue light has been termed ipRGCs (Hattar et al., 2002).
Methods and equipment based upon pupillometry have been developed to distinguish between the function of these cells and that of the rod and cone system in pupillometry (Gamlin et al., 2007; Kardon et al., 2009, 2011).
Generally, red light is used as a marker of the function of the outer retina (rods and predominantly cones) and blue light as a marker of ipRGC function. As the technique is new, several prototype pupillometers are in existence.
Some investigations have been performed on the dilated pupil (Gamlin et al., 2007), some on the undilated (Kardon et al., 2009). To the best of our knowledge no systematic comparison between these two approaches has been performed until now.
The aim of the present study is this comparison and the exploration of the pupillary response as a function of the retinal input illuminance. Since, in the healthy eye under normal circumstances, the retinal illuminance is governed by the negative feedback loop of the pupillary response, which makes retinal illuminance variant in time, steady state of the area of the input pupilla was ensured by the use of either pilocarpine (contraction) or tropicamide (dilatation).
Materials and Methods
Subjects
Ten healthy individuals, seven women and three men (mean age of 34 years, range 22–52 years) participated in the study. Prior eye-examination, including pupil function, slit lamp examination, fundus examination, applanation tonometry, OCT (Cirrus, Humphrey Instruments, CA, USA), and autoperimetry (Humphrey Instruments, Type 750, CA, USA) revealed neither eye disease nor shallow chambers (precipitating angle closure glaucoma in pupil dilatation). None received any medication known to influence the eyes, the central, or the peripheral nervous system. All subjects participating were informed of the procedure and their written consent obtained. The rules of the Helsinki Declaration were adhered to and the study approved by the local ethics committee.
Pupillometer
The pupillometer of Herbst et al. (2011) has previously been described together with the procedure used.
The instrument consists of two parts: an input section, which stimulates one eye for a predetermined time period (usually 20 s) with light of a well defined wavelength and luminance, and an output section, detecting the area of the contralateral pupil before, during, and after light stimulation. Both sections are controlled by a common computer program and thus synchronized. The area of the pupil is monitored with a frequency of 20 Hz and converted into a diameter, assuming a circular pupil. Light intensity (luminance) was 300 cd/m2 for red and blue light, corresponding to 2.2 × 10¹⁵ quanta/cm2/s (red) and 1.7 × 10¹⁵ quanta/cm2/s (blue) and less for the infrared detecting system. All intensities were chosen below the recommendations of ANSI-2007 and ICNIRP.
Examination Procedure
Sessions were performed in a dark room, in which luminance was controlled by the investigator. All sessions were performed between 9 am and 4 pm in the months October to March. The left eye was exposed to light as described below and the pupil of the right eye video filmed. While the subject was seated, the instrument adjusted, ambient light was mesopic for approximately 5 min. Then, prior to examination the subject was exposed to darkness for 1 min. The examination session was as follows: 10 s of darkness (baseline pupil), 20 s of exposure to (red or blue) light, and 60 s of darkness (post-exposure). After 5–7 min the entire session was repeated. First examination session was always performed with red light 300 cd/m2, second always with blue light 300 cd/m2. Subsequently either pilocarpine 2% or tropicamide 1% was instilled into the left eye and, after 20 min, the red and blue sessions repeated. After 3–14 days the entire experiment was repeated, this time comprising instillation of pilocarpine, if the first sequence had comprised tropicamide, and vice versa.
The absolute diameter of the input pupil in the contracted or dilated state was measured in the slit lamp.
Processing and Calculation of the Output Data
The diameter of the right pupil was the principal output parameter. A baseline pupil diameter was calculated as the mean of determinations in the 10 s in the dark preceding light initiation. The pupillary response was expressed relative to the baseline pupil and the resultant pupillogram analyzed during the light on phase and the light off phase with the following parameters:
1. Maximal contraction amplitude (CA) defined as the maximal contraction of the pupil within the first 6 s of light exposure as % of the baseline diameter.
2. The time period (expressed in s) from light on to maximal CA (time to max).
3. Sustained CA was calculated as the area under the curve (AUC; see below) of the last second of the light on phase (the 20th second).
4. The AUC, which may be taken as the response vs. time of all contraction during a well defined time period, in this case three different periods: (1) during the 20-s of light on (AUC0–20 s, light on), (2) for the first 10 s after light is turned off (AUC0–10 s, light off), and (3) from 10 to 30 s after light is turned off (AUC10–30 s, light off).
Statistical Procedure
Since the data could be assumed to follow a normal distribution, they were analyzed with paired t-tests for the difference in pupillary response between the natural state and either mydriasis (dilatation with tropicamide) or miosis (contraction due to pilocarpine). Additional comparisons between responses to red and blue light and baseline measurements were analyzed in a similar manner, p < 0.05 being considered statistically significant. All parameters including baseline pupil diameter were subjected to analysis for correlation with age (Pearson). Calculations were performed using SAS statistical software (SAS version 9.1., SAS Institute Inc., Cary, NC, USA).
Results
Comparison between the Effect of Red and Blue Light on AUC, No Eye Drops Instilled
During light exposure the difference between the pupillary response to red and to blue light was significant, the reaction to blue always being the bigger (Figures 1 and 2). AUC 0–20 s, light on, blue light was 11–13% bigger than AUC 0–20 s, light on, red light. Maximal CA and sustained CA showed an identical pattern.
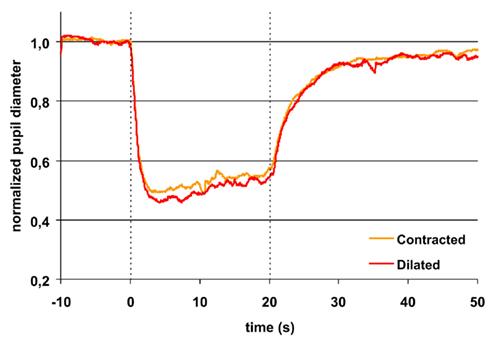
Figure 1. Pupillary contraction to a red light stimulus (660 nm) as a function of time (s). A constant and continuous stimulus of 300 cd/m2 was applied at time 0 and discontinued at the end of the 20th second. The stimulus was applied to the left eye and the consensual, right pupillary contraction recorded. The yellow graph represents contraction of the non-stimulated pupil, when the input pupil was contracted (miotic) in advance with pilocarpine, the red, when it was dilated (mydriatic) in advance with tropicamide. The average area of the input pupil to pilocarpine was 2.5 mm2, and to tropicamide 44.9 mm2. Although this difference represents a factor of 18 in retinal illuminance, the two graphs are virtually indistinguishable. Their reaction is independent of photon load. Both graphs exhibit rapid contraction to light and show pupillary escape. When the light stimulus is terminated, fairly rapid dilatation ensues. Maximal contraction is slightly larger in the red graph than in the yellow graph (cf. Table 1). Graphs represent mean values from 10 subjects. The pupillary contraction with the input pupil in natural state was indistinguishable from these two graphs and therefore not shown. Dashed vertical lines represent light on (0 s) and light off (20 s).
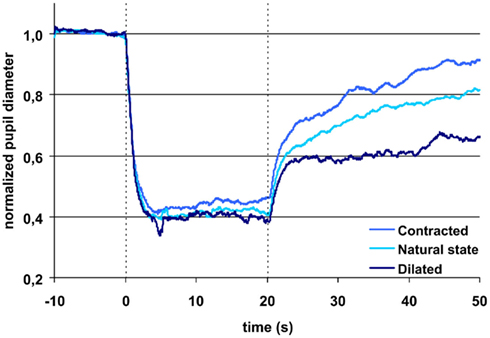
Figure 2. Pupillary contraction to a blue light stimulus (470 nm) as a function of time (s). Time period, stimulus luminance, and size of input pupil as in Figure 1. The uppermost blue graph represents pupillary contraction, when the input pupil was miotic and the dark blue when it was mydriatic. The light blue graph between the two represents pupillary contraction with the input pupil in the natural state. The vertical dashed lines denotes light on and off (cf. Figure 1). In comparison with the graphs in Figure 1, contraction is larger during light on in all graphs. Post light stimulus redilatation is far slower and dependant on the area of the input pupilla and hence the retinal photon load, in marked contrast to the graphs in Figure 1. Each graph represents mean values from 10 subjects. For details, see Table 1.
After light cut off, blue AUC0–10 s, light off was 33% and AUC10–30 s, light off 37% of AUC0–20 s, light on blue. In comparison, red AUC0–10 s, light off was only 21% and AUC10–30 s, light off 13% of AUC0–20 s, light on red.
Thus, the AUCs to red light were always significantly smaller than the corresponding AUCs to blue light and after light off decreasing in contrast with the corresponding AUCs to blue light, which were rising (Table 1; Figures 1 and 2).
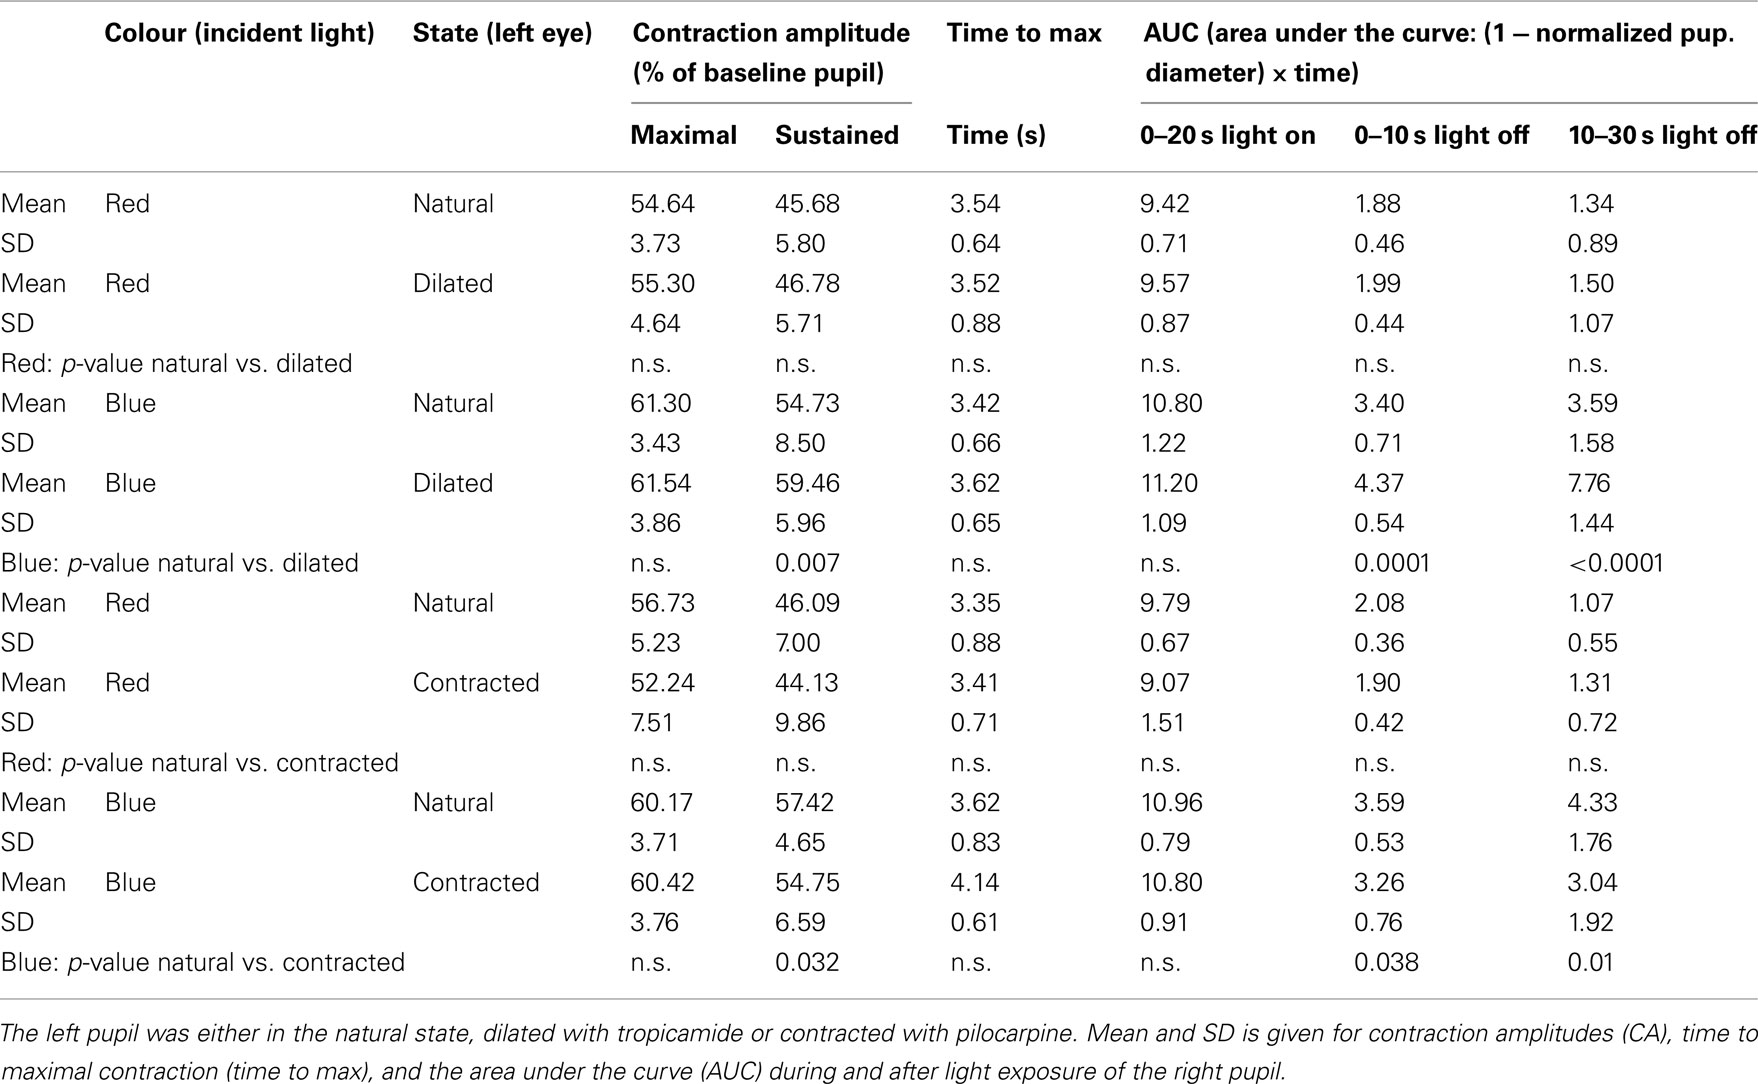
Table 1. Response of the right pupil to exposure of the left pupil to either red or blue light.
Comparison between the Effect of Tropicamide and Pilocarpine on the AUC
During light exposure AUC0–20 s, light on to red light was significantly smaller than that to blue light irrespective of type of eye drop (pilocarpine or tropicamide) instilled (Table 1).
After light off, AUC0–10 s, light off blue light was 39%, AUC10–30 s, light off 69% of AUClight on, 0–20 s, when tropicamide had been instilled, but only AUC0–10 s, light off, 30% and AUC10–30 s, light off, 28%, respectively, after pilocarpine instillation (Figure 2).
Post-red light: irrespective of type of instillation (tropicamide or pilocarpine), AUC0–10 s, light off was 21% and AUC10–30 s, light off 15% of AUC0–20 s, light on (Figure 1).
In short, the post blue light AUC increases with time, when the input pupil is dilated and remains constant, when the pupil is contracted. In contrast, the post-red light AUC remains invariant in time irrespective of the size of the input pupil (dilated or contracted).
Contraction Amplitude, Maximal, and Sustained
The difference in maximal CA is non-significant for the same color (red or blue), irrespective of the state of the input pupil, but significant between colors. In contrast, the sustained amplitude (sustained CA) follows the same response pattern as AUC during light off (Table 1).
Time to Maximal Contraction Amplitude (Time to Max)
Apart from the “time to max” for blue light exposure in the pilocarpine contracted pupil, which was >4 s, all other “time to max” was <4 s (Table 1).
Effect of Age
No significant correlation was found between the normalized output parameters and age (p > 0.05 for all parameters). The baseline pupil, however, decreased significantly with age (p < 0.01).
Discussion
The detection of a small subset of melanopsin containing ganglion cells, the ipRGCs, in the retina has led to the discovery of an “opto-endocrinological system,” maintaining diurnal homeostasis, in which the receptor of light is the ipRGCs, and the effector organs the supra chiasmatic nucleus (SCN) and the pineal gland (Berson, 2003). The ipRGCs are maximally sensitive to shortwave light, while – under photopic conditions – the great majority of cones exhibit maximal sensitivity to medium and long wave light. Since impulses governing the pupillary light reflex must pass through the ipRGCs (Güler et al., 2008), the change of size of the pupil may be taken as an indicator of the function of the inner or outer retina, depending upon the wavelengths of the incident light employed.
Pupillometry is generally approached in one of two ways: either the pupil is exposed to light in the natural state or it is dilated in advance. The first approach is favored by clinicians (Kardon et al., 2011) who must use the procedure in a clinical setting; the latter by sensory physiologists, e.g., Gamlin et al. (2007).
The pupillary response has previously been shown to increase with increased intensity of the light (Gamlin et al., 2007; Kardon et al., 2009; Herbst et al., 2011). In the present study, we have analyzed the human pupillary response as a function of the pupil size with an exposure of 300 cd/m2, thus saturating the ipRGC-response (Herbst, personal communication; Gamlin et al., 2007). For the initial part of the pupillary response curve no significant differences were found as both time to maximal contraction, maximal CA, and the summed response during light exposure (AUClight on) were comparable irrespective of the state of the input pupil and this lack of significance was found for exposure to both red and blue light.
For the last part of the light exposure period, a significant, larger sustained CA was seen for exposure to blue light as a function of pupil size, i.e., the largest response was found for the dilated pupil followed by the pupil in the natural state and the smallest response after instillation of pilocarpine. Similar results for AUC were found after blue light was turned off. In contrast, the pupillary response was not significantly different during or after light exposure to red light for a small or a large input pupil.
Even though the pupillary response is known to be variable, partly due to central regulation (Girkin, 2003), and the number of patients was relatively small (n = 10), the data were reproducible, with unchanged baseline values for the examination before installation of eye drops and the differences in baseline comparable to same-day examinations as earlier reported (Herbst et al., 2011).
The (non-normalized) baseline pupil showed correlation with age, no other parameters did. Since the present protocol does not include dark adaptation, the responses to red light probably is mainly related to the L and L–M cones, which are known to adapt very fast and bleach under persistent light. Therefore red light post illumination response would be expected to be independent of pupil size, as is indeed it was in this study. The rapid return to the dark pupil diameter illustrates that melanopsin was not stimulated to any noticeable degree by red light (Figure 1). The response to blue light is known to be due to stimulation of the photopigment melanopsin present in intrinsically light sensitive retinal ganglion cells (ipRGCs) and probably to stimulation of S-cones and rods. The hallmark of the melanopsin response is low sensitivity and a slow, but sustained response, which is present after light is turned off. These characteristics are clearly seen in the present study (Figure 2). The response in the blue light off phase is biphasic with a rapid redilatation within the first approximately 5 s and a later much slower redilatation phase. While the early phase appears unaffected of the state of the input pupil, the late phase is clearly correlated to it. As already noticed by McDougal and Gamlin (2010), these two phases probably are generated by rods and ipRGCs respectively.
In vivo, most protocols are based on undilated pupils and therefore the sensitivity to changes of the late response may decrease, in particular in elderly patients with small pupils. The present study underlines the observation that dilatation is useful despite its inconvenience to the patient, because the response 10–30 s after light is turned off was more than doubled, when the input pupil was dilated as compared to contracted. Since the mean pupil area of dilated state was 44.97 mm2 (SD 9.85) and that of the contracted 2.49 mm2 (SD 0.93), this effect was obtained with a difference in illuminated pupil area of 18 times, corresponding to 13491 and 747 Trolands respectively.
Employing radiometric units and putting lens transmission = 1.0, the retinal photon flux of blue light was 7.5 × 10¹³ quanta/s in the contracted state and 1.35 × 10¹⁵ quanta/s in the dilated state. It can therefore be assumed that the ipRGC-system is saturated in the dilated state and most likely also in the contracted state. Assuming linearity between input and output and cf. Figure 2 it may also be assumed that the system is saturated, even when the pupil is in the natural state.
It may be argued, that the reaction to blue light could be caused by a direct influence of tropicamide or pilocarpine on the retina. Nothing is known on the pharmacological effect of tropicamide on the retina in vivo (Shell, 1982), but it is likely to be insignificant, since diffusion through the vitreous is very slow (Lund-Andersen and Sander, 2011) and since there is no direct vascular pathway from the anterior segment to the retina. Furthermore the blood–retina-barrier should hamper contact. As for the influence of pilocarpine only very few reports exist (e.g., Kovacik et al., 1976; Shell, 1982) which does not corroborate any effect of pilocarpine on the bovine retina. Finally, any effect of tropicamide or pilocarpine on the ipRGCs would have to be highly selective, if the different responses to red and blue should be ascribed to a direct action of these substances upon the retina.
In conclusion, the present study demonstrates that for blue light exposure, the pupillary response is correlated to the size of the stimulated pupil. Therefore dilation should be considered for protocols exploring the response of blue-sensitive, intrinsically light sensitive retinal ganglion cells, especially if maximal stimulation of this cell system is intended.
Conflict of Interest Statement
The authors declare that the research was conducted in the absence of any commercial or financial relationships that could be construed as a potential conflict of interest.
References
Berson, D. M. (2003). Strange vision: ganglion cells as circadian photoreceptors. Trends Neurosci. 26, 314–320.
Gamlin, P. D., McDougal, D. H., Pokorny, J., Smith, V. C., Yau, K. W., and Dacey, D. M. (2007). Human and macaque pupil responses driven by melanopsin-containing retinal ganglion cells. Vision Res. 47, 946–954.
Girkin, C. A. (2003). Evaluation of the pupillary light response as an objective measure of visual function. Ophthalmol. Clin. North Am. 16, 143–153.
Güler, A. D., Ecker, J. L., Lall, G. S., Haq, S., Altimus, C. M., Liao, H. W., Barnard, A. R., Cahill, H., Badea, T. C., Zhao, H., Hankins, M. W., Berson, D. M., Lucas, R. J., Yau, K. W., and Hattar, S. (2008). Melanopsin cells are the principal conduits for rod-cone input to non-image-forming vision. Nature 453, 102–105.
Hattar, S., Liao, H. W., Takao, M., Berson, D. M., and Yau, K. W. (2002). Melanopsin-containing retinal ganglion cells: architecture, projections, and intrinsic photosensitivity. Science 295, 1065–1070.
Herbst, K., Sander, B., Milea, D., Lund-Andersen, H., and Kawasaki, A. (2011). Test-retest repeatability of the pupil light response to blue and red light stimuli in normal human eyes using a novel pupillometer. Front. Neurol. 2:10. doi:10.3389/fneur.2011.00010
Kardon, R., Anderson, S. C., Damarjian, T. G., Grace, E. M., Stone, E., and Kawasaki, A. (2009). Chromatic pupil responses: preferential activation of the melanopsin-mediated versus outer photoreceptor-mediated pupil light reflex. Ophthalmology 116, 1564–1573.
Kardon, R., Anderson, S. C., Damarjian, T. G., Grace, E. M., Stone, E., and Kawasaki, A. (2011). Chromatic pupillometry in patients with retinitis pigmentosa. Ophthalmology 118, 376–381.
Kawasaki, A. (1999). Physiology, assessment, and disorders of the pupil. Curr. Opin. Ophthalmol. 10, 394–400.
Kovacik, L., Mrazova, E., and Jezek, L. (1976). Acetylcholine in the bovine retina and the parasympathomimetic effect of pilocarpine. Arch. Ophtalmol. (Paris) 36, 615–618.
Lund-Andersen, H., and Sander, B. (2011). “The vitreous,” in Adler’s Physiology of the Eye Elsevier Saunders, eds L. A. Levin, S. F. E. Nilsson, J. Ver Hoeve, S. M. Wu, P. L. Kaufman, and A. Alm (London and New York: Elsevier-Saunders), 164–181.
McDougal, D. H., and Gamlin, P. D. (2010). The influence of intrinsically-photosensitive retinal ganglion cells on the spectral sensitivity and response dynamics of the human pupillary light reflex. Vision Res. 50, 72–87.
Keywords: the pupillary light reflex, dilatation, melanopsin, retinal ganglion cells
Citation: Nissen C, Sander B and Lund-Andersen H (2012) The effect of pupil size on stimulation of the melanopsin containing retinal ganglion cells, as evaluated by monochromatic pupillometry. Front. Neur. 2:92. doi: 10.3389/fneur.2011.00092
Received: 01 October 2011; Accepted: 30 December 2011;
Published online: 02 February 2012.
Edited by:
Satoshi Kashii, Japanese Red Cross Society, JapanReviewed by:
Chuman Hideki, University of Miyazaki, JapanHitoshi Ishikawa, Kitasato University School of Allied Health Sciences, Japan
Paul Gamlin, University of Alabama at Birmingham, USA
Copyright: © 2012 Nissen, Sander and Lund-Andersen. This is an open-access article distributed under the terms of the Creative Commons Attribution Non Commercial License, which permits non-commercial use, distribution, and reproduction in other forums, provided the original authors and source are credited.
*Correspondence: Claus Nissen, Department of Ophthalmology, Glostrup Hospital, Nordre Ringvej 57, DK-2600 Glostrup, Denmark. e-mail:Y25pczAwMTJAcmVnaW9uaC5kaw==