
 Johanna Hedin

- Neurosurgery, Department of Neuroscience, Uppsala University, Uppsala, Sweden
All experimental models of traumatic brain injury (TBI) result in a progressive loss of brain tissue. The extent of tissue loss reflects the injury severity and can be measured to evaluate the potential neuroprotective effect of experimental treatments. Quantitation of tissue volumes is commonly performed using evenly spaced brain sections stained using routine histochemical methods and digitally captured. The brain tissue areas are then measured and the corresponding volumes are calculated using the distance between the sections. Measurements of areas are usually performed using a general purpose image analysis software and the results are then transferred to another program for volume calculations. To facilitate the measurement of brain tissue loss we developed novel algorithms which automatically separate the areas of brain tissue from the surrounding image background and identify the ventricles. We implemented these new algorithms by creating a new computer program (SectionToVolume) which also has functions for image organization, image adjustments and volume calculations. We analyzed brain sections from mice subjected to severe focal TBI using both SectionToVolume and ImageJ, a commonly used image analysis program. The volume measurements made by the two programs were highly correlated and analysis using SectionToVolume required considerably less time. The inter-rater reliability was high. Given the extensive use of brain tissue loss measurements in TBI research, SectionToVolume will likely be a useful tool for TBI research. We therefore provide both the source code and the program as attachments to this article.
Introduction
Traumatic brain injury (TBI) results in an immediate cell death due to mechanical forces and this initial injury triggers a number of cellular processes such as free radical formation, inflammation, and energy metabolic disturbances. These secondary processes lead to both apoptotic and necrotic cell death which cause additional tissue loss after the injury, progressing for years after the initial injury (Shiozaki et al., 2001; Ng et al., 2008). Most of the tissue loss is presumably caused by a loss of cells but can also be caused by atrophy of surviving cells (Lifshitz et al., 2007) and/or white matter degeneration (Gale et al., 1993, 1995). The lost brain tissue is replaced with a fluid filled cavity, hydrocephalus ex vacuo, but TBI may also lead to increased ventricular volume caused by compensatory atrophy. Brain injury can also cause disturbances in cerebrospinal fluid (CSF) dynamics leading to post-traumatic hydrocephalus (Marmarou et al., 1996; Mazzini et al., 2003; De Bonis et al., 2010). If measurement of tissue volumes in the initial days following TBI is performed, injury-induced edema and focal hemorrhages needs to be taken into account (Başkaya et al., 2000a,b).
At later post-injury time points, the amount of tissue loss is an important endpoint in most experimental TBI studies. Since the pathophysiology, injury type and severity of clinical TBI is markedly heterogeneous, several experimental rodent models have been designed to mimic these features (Marklund and Hillered, 2011). To date, there is no consensus to the definition of mild, moderate, or severe experimental TBI. There can also be a substantial variability in the attained injury severity even when identical instrument settings are used by an experienced experimenter (Kaufman et al., 2010). To enable comparisons among different studies, the amount of tissue loss can be used as an objective assessment of the actual injury severity.
The neuroprotective effects are often measured as an important outcome measure in the evaluation of novel experimental treatments for experimental TBI (Loane and Faden, 2010). Neuronal and glial cell death combined with wide-spread white matter damage are likely to be detrimental and the ability of a treatment to preserve brain tissue following TBI is for obvious reasons considered to be positive. It is however important to keep in mind that the spared brain tissue may not necessarily be functionally intact. The evaluation of novel treatments therefore ultimately has to rely on behavioral tests as well.
Nevertheless, evaluation of brain tissue loss remains an integral part of experimental TBI research and is an important tool used, e.g., for the evaluation of neuroprotective compounds. The volume of a brain region is often estimated by measuring its area in several evenly spaced, serial coronal brain sections together with the distance between the sections. To clearly distinguish brain tissue from the background in the sections, routine histochemical methods such as hematoxylin and eosin (H&E) or cresyl violet are frequently used. Several computer programs can be used to trace the perimeter of the region and measure the area (see Table 1). According to the Cavaliers principle (Michel and Cruz-Orive, 1988), the shape of an area is not important when calculating volumes using the formula “area × height” and the volume between two sections, slice volume, can be calculated as:

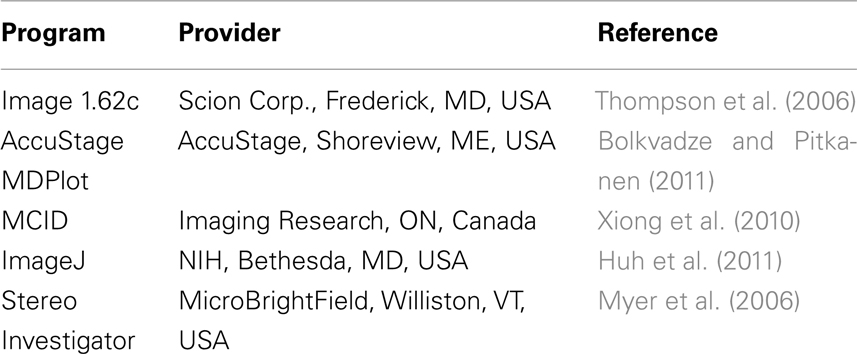
Table 1. Examples of computer programs used to analyze tissue loss.
The total volume of the evaluated region is then calculated by adding the slice volumes.
Tissue volumes can be measured using histology following experimental TBI and also by magnetic resonance imaging (MRI). Since MRI is non-invasive and may be performed in living animals, it allows sequential measurements of post-injury tissue loss and can be used to follow the progressive loss of brain tissue within the same animal (Colgan et al., 2010). If high resolution MRI is used, the results may be more accurate than histological evaluation of tissue sections. Unfortunately MRI requires expensive equipment, is time consuming and might interfere with subsequent behavioral testing.
Instead, the majority of experimental TBI research, today and in the future, will likely continue to rely on histology to assess cell death, brain atrophy, and loss of brain tissue. Since measurement of tissue volumes from sections is highly time consuming, we developed novel algorithms to facilitate this process and implemented them into a computer program (SectionToVolume). We validated the measurements made in our novel program and demonstrate that it facilitates the process of determining brain tissue loss following TBI.
Materials and Methods
To facilitate the measurements of tissue loss and/or atrophy and ventricular volume post-injury we developed novel algorithms which automatically distinguish tissue from background as well as identify the ventricles. We also aimed at finding a method to detect tissue areas which would work regardless of staining intensity and background color. Since research projects that measure tissue loss usually include a large number of sections from numerous animals, we wanted a system that could organize the digital images and link the acquired data to each section. We also aimed at developing a method within the program to assign bregma levels to each section to enable calculations of volumes without a need for a second computer program. Additionally, since brain sections frequently have imperfections such as tears or folds produced by brain fixation, sectioning and/or slide preparation, we aimed at including a method that could reliably compensate for this problem. All coding was done in Java Standard Edition using NetBeans IDE 6.8 (Oracle, Redwood Shores, CA, USA).
Brain Injury Model
The algorithms were tested on H&E stained slides obtained from a previous study (Clausen et al., 2011). Male C57BL mice weighing 24–27 g were subjected to a controlled cortical impact (CCI) TBI according to previous reports from our lab and others (Smith et al., 1995; Hånell et al., 2010). In brief, a 3-mm diameter piston was used to strike the exposed dura over the right parietal cortex 1 mm caudal to bregma at a speed of 2.8 m/s and was set to penetrate 0.7 mm into the cortex. Twenty days following the brain injury, the mice were deeply anesthetized with pentobarbital (200 mg/kg i.p.) and cardially perfused using heparinized saline followed by phosphate buffered formaldehyde. The brains were then removed, cryoprotected in sucrose solution and cut into 12 μm thick coronal sections using a cryostat (HM500, Microm GmbH, Walldorf, Germany) and mounted on Superfrost+ object glasses (Histolab, Gothenburg, Sweden). Following H&E staining (Histolab, Gothenburg, Sweden), digital images of the sections were acquired using a stereo microscope (Zeiss Stemi 2000-C; Zeiss Gmbh, Göttingen, Germany) equipped with a digital camera (Mcm5c; Zeiss Gmbh, Göttingen, Germany). All procedures were approved by the Uppsala County Animal Ethics board and followed the rules and regulations of the Swedish Animal Welfare Agency.
Image Analysis
The different steps of the image analysis are outlined in Figure 1. The first step in the automated analysis was to identify the tissue in the image. Most digital images use the RGB color model in which each pixel has one value for red, one for green, and one for blue ranging from 0 to 255. In H&E sections, the values for red and blue will be higher than the values for green (Figure 1A; Table 2). To be able to use the color to distinguish between tissue and background, two values are calculated for each pixel:

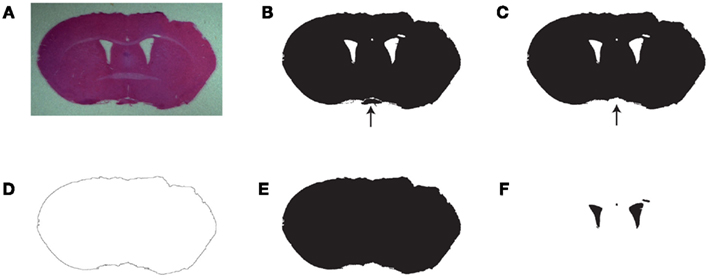
Figure 1. Work process used in SectionToVolume for the automated identification of tissue and ventricles. (A) Original image from a brain-injured animal stained with H&E. (B) Pixels with tissue color identified. (C) The largest continuous area of tissue pixels. The arrows in (C,D) point to an area of tissue, which was not continuous with the main part of the section. If present, it would have prevented proper detection of the perimeter. (D) The perimeter of the largest object. (E) All pixels enclosed by the perimeter of the section. (F) The ventricles are identified as the pixels which are white in (B) and black in (E). Note that some areas with low staining intensity are assigned as part of the ventricles. This must be manually corrected.
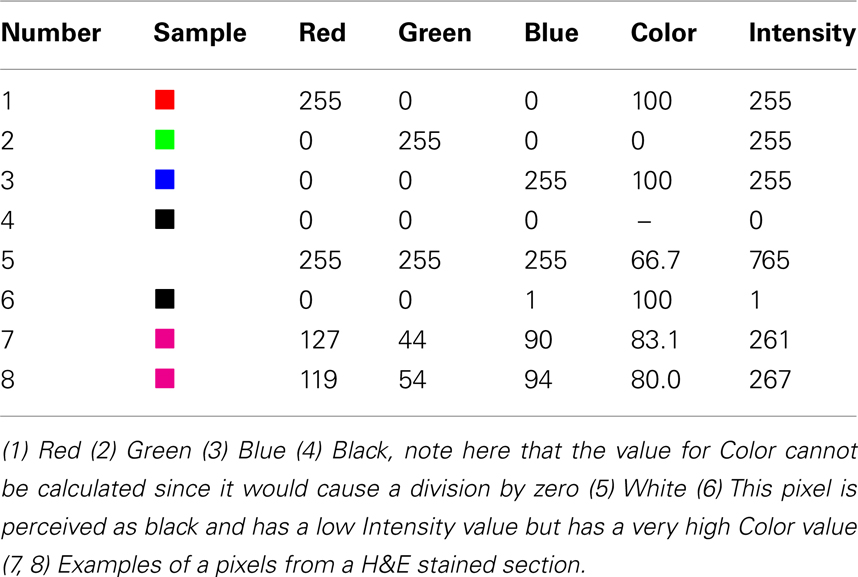
Table 2. Examples of pixels and the resulting values for Color and Intensity which are used in SectionToVolume.
For pixels with the value (R = 0; G = 0; B = 0), Color is undefined since division with 0 is not allowed. These pixels are assigned as background without calculating any values. Examples are provided in Table 2. White background will have an approximately equal amount of red, green, and blue which results in a lower value for Color than in stained tissue. A black background will also have approximately equal amounts of red, green, and blue but the values will be very low, which in some cases will cause high values for Color. For example, a pixel with the value (R = 1; G = 0; B = 0) will be perceived as black but have a value for Color of 100. This type of pixel can be assigned as a background by using its low value for Intensity (Figure 1B; Table 2).
To identify the ventricles it is crucial to distinguish between the ventricles and the part of the image that surrounds the section. Since these two regions have the same color, the ventricles are instead identified by the fact that they are enclosed by brain tissue.
To identify the perimeter of the section, it is first separated from other areas of tissue that might be present in the image. Typically, there should only be one continuous area of tissue (the section) although tissue debris and parts of other sections can be present if they lie in close proximity on the object glass. These types of areas will interfere with the process of identifying the perimeter and must be removed. To reliably identify the section, the size of all continuous areas of tissue is measured and the largest area is considered to be the section (Figure 1C).
When the largest continuous tissue area is identified, the program starts the process of identifying the perimeter of the section. For each pixel lying on the edge of the image, a line is then traced perpendicular to the edge of the image. If this line makes contact with the section, the background pixel adjacent to the first section pixel is considered to be part of the perimeter. Since this process is not guaranteed to find the entire perimeter of the section, the image is checked for additional perimeter pixels. A pixel is considered to be a new perimeter pixel if it is (1) not already part of the perimeter, (2) has background color, (3) is adjacent to a pixel with tissue color, and (4) is adjacent to another perimeter pixel (Figure 1D).
To find the area inside the perimeter of the section a starting point is required. To identify a pixel located inside the perimeter, the program then scans each row from top to bottom. If the first perimeter pixel is immediately followed by a non-perimeter pixel, this pixel is considered to be enclosed by the perimeter. The continuous area of non-perimeter pixels starting from this pixel is then identified (Figure 1E). All the background pixels in this area are ventricle pixels (Figure 1F).
Functions in SectionToVolume
In unilateral experimental injury models, the injury is located in one hemisphere (the ipsilateral side) and the other hemisphere (the contralateral side) can be used as a control (Zhang et al., 1998). To get separate measurements for the ipsilateral and contralateral side, the user of SectionToVolume only needs to draw a line which separates the hemispheres. To identify the pixels present in the left side and the right side, the program scans every horizontal line in the image. The left-most pixel in a horizontal line is considered to be part of the left side. The program then checks the pixel to the right of the previous pixel, and if that is not part of the user defined line, it is also considered to be part of the left side. This step is repeated until a pixel which is part of the division line is detected. All pixels to the right of this pixel are considered to be part of the right side.
In many studies, it is of interest to measure specific regions in the brain such as the cavity caused by focal injury models or the volume of the hippocampus (Mannix et al., 2011). SectionToVolume accomplishes this task by supporting user defined areas, where the user draws a line around the structure of interest. The area enclosed by the line is then automatically measured and can be set to include only pixels with tissue color, only pixels with background color or all pixels regardless of color.
Importing and organizing the image files and linking measurement data to the original image is an important feature of SectionToVolume. Before a project is created in SectionToVolume, the original image files must be organized by placing images from each subject in a separate folder. In the program, the section will then be identified by the filename and the subject by the folder name. To calculate volumes, a bregma level will also have to be assigned to each section. Since most projects use sections from the same levels in every brain, the same set of bregma levels is assigned to all brains when a project is created. The assigned bregma level can be changed for individual sections, if needed, once the project is created.
When accurate and robust algorithms had been identified, these were validated by comparing measurements obtained using SectionToVolume with measurements made in ImageJ (NIH, Bethesda, MD, USA). Ten sections per animal from sham-injured (n = 3) and brain-injured (n = 3) animals were used, randomly selected from a cohort of sham- and brain-injured mice (Clausen et al., 2011). The perimeter of the two hemispheres, the ventricles in each hemisphere and the cortical cavity were traced in ImageJ and the enclosed areas measured. The data was then copied to Microsoft Excel, where volumes corresponding to these areas were calculated. The same volumes were also calculated using SectionToVolume. The time required to make the measurements in both programs was recorded. To determine the inter-rater reliability, these sections were also evaluated by three different investigators using SectionToVolume.
Statistics
The comparison between ImageJ and SectionToVolume was made using correlations calculated in GraphPad Prism (GraphPad Software Inc, La Jolla, CA, USA). Inter-rater reliability was evaluated using Cronbach’s alpha and the interclass correlation, both calculated in SPSS 20 (IBM, New York, NY, USA).
Results
In all brain-injured animals, CCI resulted in a large cortical contusion cavity, a loss of hemispheric tissue and an increased size of the ipsilateral ventricle (Clausen et al., 2011). To validate the accuracy of SectionToVolume, tissue from three sham-injured and three brain-injured animals were used to measure the area of hemispheric tissue, ventricle area in each hemisphere and the area of the cortical cavity. We then calculated the corresponding volumes and compared these results to those obtained using the ImageJ software.
The mean ± SD hemispheric tissue volume in SectionToVolume was 106.81 ± 12.6 and in ImageJ 106.07 ± 10.8, respectively. The mean ± SD ventricular volume was 2.46 ± 0.9 in SectionToVolume and 2.51 ± 1.0 in ImageJ. Finally, the lesion volume measured in the two programs was 4.06 ± 4.5 and 4.17 ± 4.6, respectively.
The results obtained from the two programs showed a very high correlation, R2 = 0.90 for hemispheric tissue and R2 = 0.98 for the ventricles and cortical cavity (p < 0.05; Figures 2A,B). Total time for performing all measurements using ImageJ was approximately 4 h while the same measurements using SectionToVolume required approximately 30 min.
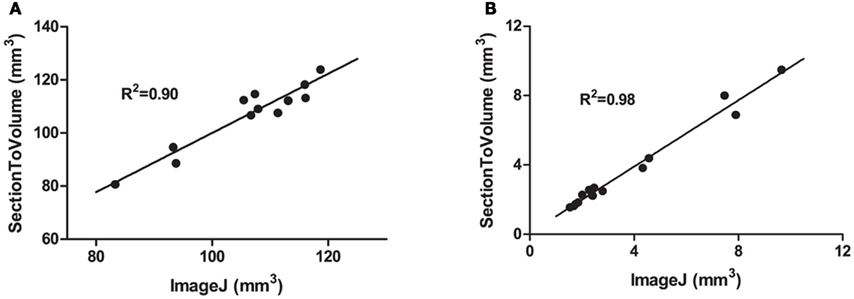
Figure 2. Comparisons between measurements made in ImageJ and SectionToVolume. (A) The hemispheric tissue volume between bregma 0 and bregma −4.5 after focal TBI in the mouse. (B) The volume of the ventricles of both sham- and brain-injured animals in addition to values of the cortical cavity of brain-injured animals. For all measurements, values obtained with the SectionToVolume were highly correlated with ImageJ data.
The measurements from three investigators using SectionToVolume for all sections showed a high inter-rater reliability (Cronbach’s alpha was 0.998 and the intraclass correlation was 0.995; deviation from the mean of each researcher is shown in Figure 3). The ipsilateral ventricle showed the largest variability between investigators.
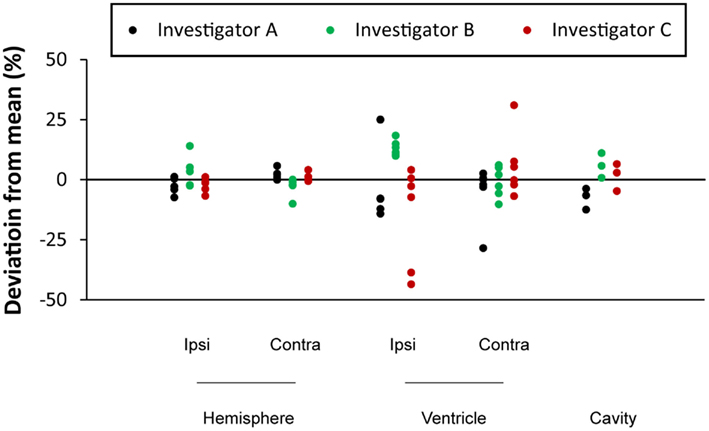
Figure 3. Assessment of the inter-rater reliability using three different investigators. Each circle represents an individual measurement of a brain region volume from one animal. The deviation of each measurement from the average value from the three investigators is plotted on the y-axis.
Discussion
In the present report, we used an in-house developed novel computer program, named SectionToVolume, and evaluated its use for the assessment of focal and diffuse brain tissue loss following TBI. Our main finding was that SectionToVolume, provided as an attachment to this article, swiftly rapidly and reliably measure areas and volumes of interest following TBI in mice. Our results indicate that the novel approach to area and volume measurements used in this program may be a useful tool for this commonly used histological evaluation in TBI research.
By measuring the total amount of brain tissue in each hemisphere, the amount of tissue loss from unilateral injury models can be assessed. The amount of lost brain tissue in diffuse models can be estimated by comparing the volume of brain tissue in sham-injured control and brain injury groups. After a number of days post-injury, focal TBI results in a gradually enlarging cortical cavity which can be separately measured and used as an estimate for the amount of tissue loss and injury severity.
Measurements of brain tissue loss following experimental TBI differs both in the choice of evaluated brain regions and how the results are presented. The measurements can be presented as either the volume of a region in cubic millimeter or as a ratio between two regions. The use of a ratio avoids the problem of differences in head size encountered in clinical studies and the effect of brain swelling and shrinkage during tissue processing in histological studies (Golanov and Reis, 1995; Wahl et al., 1997). The amount of lost tissue can also be expressed as the relative size of the two hemispheres expressed as:

where contra refers to the volume of the contralateral hemisphere and ipsi the hemisphere ipsilateral to the injury (Zhang et al., 1998). When using a focal TBI model, the inclusion of uninjured parts of the brain rostral and caudal to the cavity will decrease the relative difference between the hemispheres. Differences in included region can therefore make comparisons between studies difficult. Alternatively, the result can instead be expressed as the absolute volume difference between the hemispheres expressed in cubic millimeter (Hånell et al., 2010). Choosing to present the results in cubic millimeter will not be influenced by inclusion of uninjured parts of the brain but can on the other hand be altered by any shrinkage or swelling of the brain caused by the tissue processing. Since experimental models of diffuse TBI cause symmetric bilateral injury to the brain the difference between hemispheres cannot be used to evaluate the tissue loss. Instead, it may be possible to use the ventricle-to-brain ratio which is sometimes used in clinical studies (Anderson et al., 1996; Ghosh et al., 2009). Other measures used to assess cerebral abnormalities in models of brain injury include the Evans index, defined as the maximum distance between the frontal horns divided by the maximum inner diameter of the skull (Evans, 1942; Poca et al., 2005), and cortical thickness (Merkley et al., 2008).
One purpose of creating SectionToVolume was to reduce the time and effort required for making measurements of brain tissue loss, which was accomplished in several ways. If the original image files from each subject are located in separate folders, they are automatically assigned to their respective subjects when imported into the program. The file names are also imported and automatically linked to the image and the resulting data to allow the results to be traced back to the original image file. Since bregma levels can be assigned to each image, volumes can be calculated automatically, completely removing the time required for this part of the work process. When validating the results from SectionToVolume, we achieved a marked reduction in the time required to complete the measurement. The time saved will likely vary between different projects depending on the quality of the sections and the measured areas. Performing the automated measurements in SectionToVolume required less than 5 min, although some measurements had to be performed manually, such as the separation of the hemispheres and the location of the cortical cavity. In a project solely relying on the automated measurements, the reduction in work effort would thus be considerably greater. Correcting the measurements for sectioning artifacts such as folds and tears also requires some effort, which naturally will be reduced when using high quality sections. The evaluation of SectionToVolume was made using H&E stained sections since all stained tissue in the section will have a uniform color. Different forms of Nissl stain such as Cresyl violet will on the other hand only stain the cell bodies leaving white matter tracts with a pale appearance. Using Nissl stained sections it will likely be difficult for SectionToVolume to distinguish between white matter and the image background. It is possible that future applications of, e.g., machine learning (Kononenko, 2001; Lemm et al., 2011) could be used to detect the midline and the cortical cavity which would further reduce the time required to do these measurements.
Another purpose of creating SectionToVolume was to create a work process that minimizes the risk of introducing errors into the measurements. Even a normal size project with 50 subjects and 10 sections per subject which measures five different brain regions will generate 2500 measured areas. Keeping track of all this data can be a daunting task and SectionToVolume facilitates this process in two ways. The first way is by organizing the brain section images. Since all images are stored as part of the project data and presented as a tree structure within the program, the obtained measurements will always be linked to the source image. Should any extreme measurements be detected at a later time point, it will always be possible to re-open the project and re-review the measurements and adjust if needed. The second way is by calculating volumes based on the measured areas within the program. When using a general purpose image analysis program such as ImageJ (see also Table 1), these calculations must be performed in another program which leads to the risk of introducing errors when transferring data. By performing both area measurements and volume calculations within a single program, this risk is avoided and in SectionToVolume this part of the work process is fully automated.
Several computer programs used to assess tissue volumes were listed in Table 1. These programs were designed for general image analysis and not specifically for analyzing tissue loss. The Stereo Investigator program does however have a Cavalieri function which may be useful for the purpose of determining brain tissue loss (Myer et al., 2006; Nandoe Tewarie et al., 2009). Although other programs may be used, to the best of our knowledge, SectionToVolume is the only program made specifically to assess loss of brain tissue following TBI.
Focal brain injuries ultimately results in fluid filled cavity and the size of this cavity is commonly used as a measure of the tissue loss caused by the injury (Zhang et al., 1998). A severe focal injury can after a few weeks expand sufficiently to reach, and fuse with, the ventricular system, which has been repeatedly observed in previous experiments from our group (unpublished data). In such instances, it can be a difficult task to objectively distinguish between the injury cavity and the ventricle. Furthermore, even a rather small cavity can be connected to the subarachnoidal space causing difficulties in defining the boundary between the cavity and the outside of the brain in the sections. In both these situations the perimeter of the cavity is not obvious and risks making the method highly subjective. The ipsilateral ventricle was also the region where the results differed most between investigators evaluating the same sections. This problem can be avoided by comparing the volume of the two hemispheres or by measuring the total tissue volume. Brain sections will also occasionally contain folds and tears, resulting from either the sectioning or the histology process. If solely relying on automated measures, these artifacts would cause incorrect measurements and SectionToVolume therefore include the possibility to adjust images by manually assigning areas as background or tissue. Because of these types of problems we believe that our program should be used to facilitate brain tissue loss evaluation, rather than being considered a replacement of the investigator.
Conclusion
Progressive loss of brain tissue, including white matter, and the resulting brain atrophy, are important markers for the brain damage that occurs following TBI. In experimental models of TBI, the evaluation of tissue loss is widely used both to assess the injury severity and to establish possible neuroprotective effects of treatments. With the new algorithms and computer program presented here, measurements of tissue loss can be made faster and easier. The automated detection of both the total tissue volume and the ventricular volume is especially useful for the evaluation of the diffuse injury component, an extremely important factor in the pathophysiology of TBI.
Conflict of Interest Statement
The authors declare that the research was conducted in the absence of any commercial or financial relationships that could be construed as a potential conflict of interest.
Acknowledgments
This work was funded by the Swedish Brain Foundation, the Swedish Research Council, and Uppsala University.
Supplementary Material
The Supplementary Material for this article can be found online at http://www.frontiersin.org/Neurotrauma/10.3389/fneur.2012.00029/abstract
References
Anderson, C. V., Wood, D. M., Bigler, E. D., and Blatter, D. D. (1996). Lesion volume, injury severity, and thalamic integrity following head injury. J. Neurotrauma 13, 59–65.
Başkaya, M. K., Doğan, A., Rao, A. M., and Dempsey, R. J. (2000a). Neuroprotective effects of citicoline on brain edema and blood-brain barrier breakdown after traumatic brain injury. J. Neurosurg. 92, 448–452.
Başkaya, M. K., Doğan, A., Temiz, C., and Dempsey, R. J. (2000b). Application of 2,3,5-triphenyltetrazolium chloride staining to evaluate injury volume after controlled cortical impact brain injury: role of brain edema in evolution of injury volume. J. Neurotrauma 17, 93–99.
Bolkvadze, T., and Pitkanen, A. (2011). Development of post-traumatic epilepsy after controlled cortical impact and lateral fluid-percussion induced brain injury in the mouse. J. Neurotrauma 1–80.
Clausen, F., Hånell, A., Israelsson, C., Hedin, J., Ebendal, T., Mir, A. K., Gram, H., and Marklund, N. (2011). Neutralization of interleukin-1β reduces cerebral edema and tissue loss and improves late cognitive outcome following traumatic brain injury in mice. Eur. J. Neurosci. 34, 110–123.
Colgan, N. C., Cronin, M. M., Gobbo, O. L., O’Mara, S. M., O’Connor, W. T., and Gilchrist, M. D. (2010). Quantitative MRI analysis of brain volume changes due to controlled cortical impact. J. Neurotrauma 27, 1265–1274.
De Bonis, P., Pompucci, A., Mangiola, A., Rigante, L., and Anile, C. (2010). Post-traumatic hydrocephalus after decompressive craniectomy: an underestimated risk factor. J. Neurotrauma 27, 1965–1970.
Evans, W. (1942). An encephalographic ratio for estimating ventricular enlargement and cerebral atrophy. Arch. Neurol. Psychiatry 47, 931.
Gale, S. D., Burr, R. B., Bigler, E. D., and Blatter, D. (1993). Fornix degeneration and memory in traumatic brain injury. Brain Res. Bull. 32, 345–349.
Gale, S. D., Johnson, S. C., Bigler, E. D., and Blatter, D. D. (1995). Nonspecific white matter degeneration following traumatic brain injury. J. Int. Neuropsychol. Soc. 1, 17–28.
Ghosh, A., Wilde, E. A., Hunter, J. V., Bigler, E. D., Chu, Z., Li, X., Vasquez, A. C., Menefee, D., Yallampalli, R., and Levin, H. S. (2009). The relation between Glasgow Coma Scale score and later cerebral atrophy in paediatric traumatic brain injury. Brain Inj. 23, 228–233.
Golanov, E. V., and Reis, D. J. (1995). Contribution of cerebral edema to the neuronal salvage elicited by stimulation of cerebellar fastigial nucleus after occlusion of the middle cerebral artery in rat. J. Cereb. Blood Flow Metab. 15, 172–174.
Hånell, A., Clausen, F., Björk, M., Jansson, K., Philipson, O., Nilsson, L. N. G., Hillered, L., Weinreb, P. H., Lee, D., McIntosh, T. K., Gimbel, D. A., Strittmatter, S. M., and Marklund, N. (2010). Genetic deletion and pharmacological inhibition of Nogo-66 receptor impairs cognitive outcome after traumatic brain injury in mice. J. Neurotrauma 27, 1297–1309.
Huh, J. W., Widing, A. G., and Raghupathi, R. (2011). Differential effects of injury severity on cognition and cellular pathology after contusive brain trauma in the immature rat. J. Neurotrauma 28, 245–257.
Kaufman, N. A., Beare, J. E., Tan, A. A., Vitek, M. P., McKenna, S. E., and Hoane, M. R. (2010). COG1410, an apolipoprotein E-based peptide, improves cognitive performance and reduces cortical loss following moderate fluid percussion injury in the rat. Behav. Brain Res. 214, 395–401.
Kononenko, I. (2001). Machine learning for medical diagnosis: history, state of the art and perspective. Artif. Intell. Med. 23, 89–109.
Lemm, S., Blankertz, B., Dickhaus, T., and Müller, K.-R. (2011). Introduction to machine learning for brain imaging. Neuroimage 56, 387–399.
Lifshitz, J., Kelley, B. J., and Povlishock, J. T. (2007). Perisomatic thalamic axotomy after diffuse traumatic brain injury is associated with atrophy rather than cell death. J. Neuropathol. Exp. Neurol. 66, 218–229.
Loane, D. J., and Faden, A. I. (2010). Neuroprotection for traumatic brain injury: translational challenges and emerging therapeutic strategies. Trends Pharmacol. Sci. 31, 596–604.
Mannix, R. C., Zhang, J., Park, J., Lee, C., and Whalen, M. J. (2011). Detrimental effect of genetic inhibition of B-site app-cleaving enzyme 1 on functional outcome after controlled cortical impact in young adult mice. J. Neurotrauma 28, 1855–1861.
Marklund, N., and Hillered, L. (2011). Animal modeling of traumatic brain injury in pre-clinical drug development – where do we go from here? Br. J. Pharmacol. 164, 1207–1229.
Marmarou, A., Foda, M. A., Bandoh, K., Yoshihara, M., Yamamoto, T., Tsuji, O., Zasler, N., Ward, J. D., and Young, H. F. (1996). Posttraumatic ventriculomegaly: hydrocephalus or atrophy? A new approach for diagnosis using CSF dynamics. J. Neurosurg. 85, 1026–1035.
Mazzini, L., Campini, R., Angelino, E., Rognone, F., Pastore, I., and Oliveri, G. (2003). Posttraumatic hydrocephalus: a clinical, neuroradiologic, and neuropsychologic assessment of long-term outcome. Arch. Phys. Med. Rehabil. 84, 1637–1641.
Merkley, T. L., Bigler, E. D., Wilde, E. A., McCauley, S. R., Hunter, J. V., and Levin, H. S. (2008). Diffuse changes in cortical thickness in pediatric moderate-to-severe traumatic brain injury. J. Neurotrauma 25, 1343–1345.
Michel, R. P., and Cruz-Orive, L. M. (1988). Application of the Cavalieri principle and vertical sections method to lung: estimation of volume and pleural surface area. J. Microsc. 150, 117–136.
Myer, D. J., Gurkoff, G. G., Lee, S. M., Hovda, D. A., and Sofroniew, M. V. (2006). Essential protective roles of reactive astrocytes in traumatic brain injury. Brain 129, 2761–2772.
Nandoe Tewarie, R. D. S., Hurtado, A., Ritfeld, G. J., Rahiem, S. T., Wendell, D. F., Barroso, M. M. S., Grotenhuis, J. A., and Oudega, M. (2009). Bone marrow stromal cells elicit tissue sparing after acute but not delayed transplantation into the contused adult rat thoracic spinal cord. J. Neurotrauma 26, 2313–2322.
Ng, K., Mikulis, D. J., Glazer, J., Kabani, N., Till, C., Greenberg, G., Thompson, A., Lazinski, D., Agid, R., Colella, B., and Green, R. E. (2008). Magnetic resonance imaging evidence of progression of subacute brain atrophy in moderate to severe traumatic brain injury. Arch. Phys. Med. Rehabil. 89, S35–S44.
Poca, M. A., Sahuquillo, J., Mataró, M., Benejam, B., Arikan, F., and Báguena, M. (2005). Ventricular enlargement after moderate or severe head injury: a frequent and neglected problem. J. Neurotrauma 22, 1303–1310.
Shiozaki, T., Akai, H., Taneda, M., Hayakata, T., Aoki, M., Oda, J., Tanaka, H., Hiraide, A., Shimazu, T., and Sugimoto, H. (2001). Delayed hemispheric neuronal loss in severely head-injured patients. J. Neurotrauma 18, 665–674.
Smith, D. H., Soares, H. D., Pierce, J. S., Perlman, K. G., Saatman, K. E., Meaney, D. F., Dixon, C. E., and McIntosh, T. K. (1995). A model of parasagittal controlled cortical impact in the mouse: cognitive and histopathologic effects. J. Neurotrauma 12, 169–178.
Thompson, H. J., Marklund, N., LeBold, D. G., Morales, D. M., Keck, C. A., Vinson, M., Royo, N. C., Grundy, R., and McIntosh, T. K. (2006). Tissue sparing and functional recovery following experimental traumatic brain injury is provided by treatment with an anti-myelin-associated glycoprotein antibody. Eur. J. Neurosci. 24, 3063–3072.
Wahl, F., Renou, E., Mary, V., and Stutzmann, J. M. (1997). Riluzole reduces brain lesions and improves neurological function in rats after a traumatic brain injury. Brain Res. 756, 247–255.
Xiong, Y., Mahmood, A., Qu, C., Kazmi, H., Zhang, Z. G., Noguchi, C. T., Schallert, T., and Chopp, M. (2010). Erythropoietin improves histological and functional outcomes after traumatic brain injury in mice in the absence of the neural erythropoietin receptor. J. Neurotrauma 27, 205–215.
Keywords: traumatic brain injury, tissue loss, image analysis
Citation: Hånell A, Hedin J, Clausen F and Marklund N (2012) Facilitated assessment of tissue loss following traumatic brain injury. Front. Neur. 3:29. doi: 10.3389/fneur.2012.00029
Received: 15 December 2011; Paper pending published: 23 December 2011;
Accepted: 16 February 2012; Published online: 14 March 2012.
Edited by:
Mattias Sköld, Uppsala University, SwedenReviewed by:
Denes V. Agoston, University Medical School Szeged, HungaryBridgette D. Semple, University of California San Francisco, USA
Copyright: © 2012 Hånell, Hedin, Clausen and Marklund. This is an open-access article distributed under the terms of the Creative Commons Attribution Non Commercial License, which permits non-commercial use, distribution, and reproduction in other forums, provided the original authors and source are credited.
*Correspondence: Anders Hånell and Niklas Marklund, Uppsala University Hospital, Entrance 85, 3rd Floor, FOA3, SE-851 85 Uppsala, Sweden. e-mail:YW5kZXJzLmhhbmVsbEBuZXVyby51dS5zZQ==