 Stefano Ramat1*
 Silvia Colnaghi2
 Andreas Boehler1,3
 Serena Astore4 Paola Falco4
 Marco Mandalà5
 Daniele Nuti4 Paolo Colagiorgio1 Maurizio Versino2
- 1 Department of Computer and Systems Science, University of Pavia, Pavia, Italy
- 2 Neuro-otology and Neuro-ophthalmology Laboratory and BCC, National Neurological Institute C. Mondino Foundation, IRCCS, and Department of Neurological Sciences University of Pavia, Pavia, Italy
- 3 Institute for Research and Development on Advanced Radiation Technologies, Paracelsus Medical University, Salzburg, Austria
- 4 Department of Human Pathology and Oncology, University of Siena, Siena, Italy
- 5 Otology and Skull-Base Surgery Department, University of Siena, Siena, Italy
We developed the head impulse testing device (HITD) based on an inertial sensing system allowing to investigate the functional performance of the rotational vestibulo-ocular reflex (VOR) by testing its gaze stabilization ability, independently from the subject’s visual acuity, in response to head impulses at different head angular accelerations ranging from 2000 to 7000 deg/s2. HITD was initially tested on 22 normal subjects, and a method to compare the results from a single subject (patient) with those from controls was set up. As a pilot study, we tested the HITD in 39 dizzy patients suffering, non-acutely, from different kinds of vestibular disorders. The results obtained with the HITD were comparable with those from the clinical head impulse test (HIT), but an higher number of abnormalities was detectable by HITD in the central vestibular disorders group. The HITD appears to be a promising tool for detecting abnormal VOR performance while providing information on the functional performance of the rotational VOR, and can provide a valuable assistance to the clinical evaluation of patients with vestibular disorders.
Introduction
The malfunctioning of the vestibular system acutely induces vestibular nystagmus and vertigo, and is clinically evident during bedside examination. Yet, after the acute phase or in the chronic patient, vestibular diagnosis becomes more difficult as the central nervous system (CNS) activates very efficient adaptive mechanisms often allowing excellent recovery (see Curthoys and Halmagyi, 2007 for a review). Thus, the eye movements produced by the rotational vestibular ocular reflex (rVOR) in chronic unilateral vestibular patients often succeed in stabilizing the visual scene during low head angular acceleration transients, by exploiting the modulation of the afferents’ firing rate in the off direction provided by the intact canal. Unfortunately, most diagnostic tools also investigate movements in the same low frequencies stimulus range: this is true for the caloric test, which is widely used in ENT clinical laboratories since canal paresis is considered to be a diagnostic marker of unilateral vestibular deficit (UVD), but also for the stimulus frequencies that can be tested by benchmark rotatory chairs. Deficits in response to high frequency stimuli may instead be unveiled using the head impulse test (HIT), consisting in high-acceleration head rotations in the plane of each canal pair.
The rotational HIT (Halmagyi and Curthoys, 1988; Halmagyi et al., 1990), or head thrust test, is nowadays the recognized reference procedure for evaluating individual semicircular canals. It consists in imposing brief, unpredictable, high-acceleration (3000–6000 deg/s2) rotations to the subject’s head while asking to fixate a stationary target. By imposing rotations in the planes of individual canal pairs it allows to unveil a deficit in the canal toward which the head is rotated, such deficit causes the eye movement to be slower than needed for maintaining fixation. The technique allows the evaluation of the activity of each semicircular canal using a physiological stimulus involving high frequency components. The clinical sign indicating the deficit in the stimulated canal is a corrective saccade (a fast eye movement) that at the end of the head movement brings gaze back on target, thus supplementing the deficient rVOR.
A quantitative version of the test may be achieved by simultaneously recording both the eye and the head movement and computing the gain of the rVOR (eye velocity/head velocity; Aw et al., 1996a,b). Until recently, only the search coil eye movement recording system allowed a reliable measurement of such high-acceleration rotations and the technique, which is relatively invasive, was therefore available only to the few laboratories equipped with it. This approach allows to provide details on the magnitude of the deficit in terms of rVOR gain (Aw et al., 1996b; Collewijn and Smeets, 2000). Recently such quantitative approach has been suggested by the group of Halmagyi also for studying the responses to different head accelerations (Weber et al., 2008, 2009; Macdougall et al., 2009; Halmagyi et al., 2010) using video-oculography based on a high-speed camera. Such study has shown that some subjects with a low gain vestibulo-ocular reflex (VOR) are able to produce compensatory (catch-up) saccades even during the head movement, the so-called covert saccades (Weber et al., 2008), thereby masking the deficit to the clinical examination since no delayed saccade is needed to recover fixation at the end of the head impulse.
Need for Functional Testing
Even a few degrees/s of image slippage on the retina seriously deteriorate vision, so that during a head rotation that unveils a vestibular deficit vision is impaired. This observation provides the grounds for protocols aiming at the evaluation of vestibular function, i.e., evaluating the VOR in terms of its efficacy toward the stabilization of the visual scene during head rotations. One early example is the dynamic visual acuity test (DVAT), which measures visual acuity during active, sinusoidal, head rotations (Herdman et al., 1998; Tian et al., 2001). The subject must recognize the orientation of the letter “E” appearing on the screen when head velocity falls between 120 and 180 deg/s. The size of the shown letter is progressively decreased until that corresponding to normal visual acuity is reached. The test has proven clinically reliable (Herdman et al., 1998; Schubert et al., 2002) in detecting vestibular dysfunction. Nonetheless its effectiveness with compensated patients is limited, since voluntary head movements imply that the CNS may use the available information, e.g., the efference copy of the commands to neck muscles, to activate predictive mechanisms that do not rely on peripheral function (Herdman et al., 2001; Della Santina et al., 2002). A new version of the DVAT using passive, impulsive head rotations has recently been suggested (Tian et al., 2002; Schubert et al., 2006). In the Schubert study, when head velocity is within the 120–180 deg/s range for at least 40 ms a letter “E” optotype appears on the computer monitor and the subject must recognize its orientation. During the test the size of the letter is varied based on the rate of correct answers and the outcome is a measure of visual acuity, i.e., the minimum angle between the features of the shown character, as seen from the patient, needed for correctly discerning it (in logMAR, minimum angle of resolution). The diagnosis of a vestibular deficit is based on the comparison of the static visual acuity measure with that of the dynamic one and the patient is considered pathological when the latter is at least 0.3 logMAR lower than the former (Longridge and Mallinson, 1987).
Further research has recently been devoted to improving the DVAT by designing a new version of the test using Landolt rings in eight orientations, thereby reducing the probability of obtaining a correct answer by chance, and exploiting an adaptive algorithm for changing the size of the presented letters allowing to speed-up the execution of the test (Vital et al., 2010).
The gaze stabilization test (GST; Goebel et al., 2007; Pritcher et al., 2008; Whitney et al., 2009) evaluates the contribution of the VOR to gaze stabilization by measuring the peak head velocity that allows discerning the orientation of a randomly presented, fixed-size optotype (the letter “E”) during active head shaking (sinusoidal head movements at relatively high frequency, above 2 Hz). The size of the optotype is fixed at 0.3 logMAR above each subject’s static visual acuity level and the visual stimulus is shown for at most 75 ms when head velocity exceeds a predefined threshold for at least 40 ms. The threshold is increased or decreased adaptively depending on the patient’s performance. The GST allows discerning vestibular patients. Yet, the use of active head movements exposes this technique to the same limitations described above for the sinusoidal and the active DVAT. Surprisingly, no normative data exists on both DVAT and GST.
The above mentioned quantitative testing techniques indicate the presence, or absence, of a deficit, yet their measurements are not directly correlated with the patient’s percept of his own disability. In fact, during DVA testing, vision plays a fundamental role in determining the output of the technique and, although the diagnosis is based on a comparison with the static visual acuity level, the relationship of the absolute DVA value to the patient’s percept of his abilities cannot provide a direct measure of vestibular functionality.
We have recently developed and tested a new software and hardware device (head impulse testing device, HITD) to assess the function of the VOR without directly measuring the movement of the eyes, based on a similar idea (Böhler et al., 2010). The suggested approach differs from that of DVA assessment as it focuses on the characteristics of the head movement, and not those of the visual stimulus, in affecting the subject’s ability to stabilize gaze in space. Thus the goal of the HITD is that of assessing vestibular function to different head angular accelerations, while facing equally challenging visual stimuli, in order to provide indications that may be closely correlated to each patient’s daily activities.
We tested the HITD in a group of normal subjects, and we suggest a method for the definition of normal limits for the evaluation of a single patient. This method was tested on a group of patients with various stabilized vestibular disorders, and the results were compared with those obtained by clinical HIT.
Materials and Methods
The rationale of the proposed testing approach is as follows: a patient wearing a head mounted sensor sits in front of a computer monitor with the experimenter manually imposing head impulses standing behind his/her back. Static visual acuity is first assessed using an eye chart displayed on the monitor with letter sizes scaled based on the subject’s viewing distance. The size of the visual stimuli used during the test is then determined based on the assessed visual acuity by increasing that of the smallest seen line by 0.8 logMAR. Such stimulus size, which is eight lines bigger than the best static visual acuity, will then remain constant during the test.
When the imposed head angular acceleration exceeds a user-defined threshold, a character drawn from the Sloan letter set is briefly displayed on the screen for a user adjustable number of video frames and with a user adjustable time lag.
In our experiments the duration of the letter display was set to two frames (about 33 ms with a regular 60 Hz refresh rate) with no delay. This setting resulted in the visual stimulus being displayed around the time of maximum head acceleration, as we verified by recording the output of a photo diode applied to the screen, as shown in Figure 1.
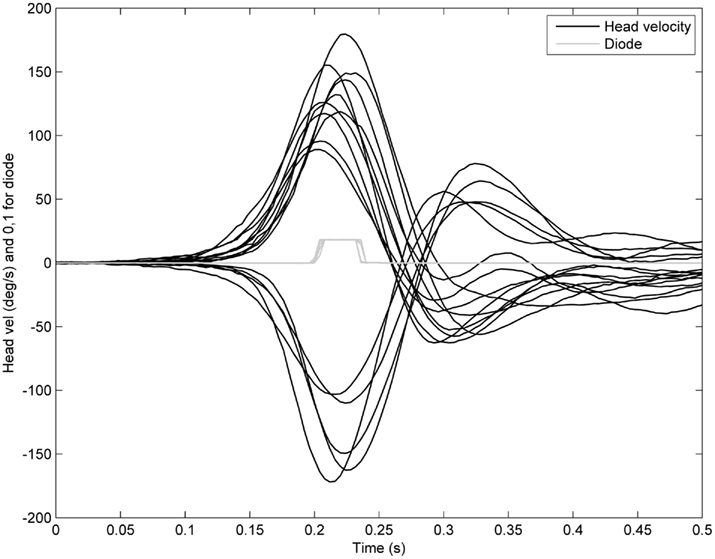
Figure 1. Representative example of visual stimulus timing with respect to head angular velocity during a test performed with the HITD. Black traces: head angular velocities recorded during individual head impulses on one subject. Gray traces: visual stimulus appearance timing recorded by the photodiode applied to the testing screen. Low value indicates no stimulus; high value indicates the stimulus is displayed on screen.
To implement such protocol we developed an inertial motion sensor based on a three axis accelerometer (model ADXL330, Analog Devices Inc., with a linear range of ± 3 g) and a single axis gyroscope (model ADXRS300, Analog Devices Inc., with a linear range of ± 300 deg/s), packed together on a custom 2 cm by 2 cm circuit board, weighing only a few grams. Such assembly was then mounted with an elastic band to the subject’s head, allowing to freely and naturally move his/her head.
The analog sensor signals were then acquired and sampled using a National Instruments USB-6211, 16 bit, 256 KS/s data acquisition card.
In order to reduce the effect of sampling noise, raw data was captured at 10 KHz and then smoothed in to 100 Hz by averaging 100 samples to provide one angular velocity or linear acceleration data point. Head angular acceleration was then computed from the gyroscope angular head velocity signal as an= Δv/Δt = (vn−vn −1)/(tn−tn −1).
The software verified both that the axis of head rotation did not change during the angular head impulse by verifying the orientation of the sensor with respect to gravity, and that there was limited spurious head translation. Trials in which the lateral head acceleration was greater than an adaptive threshold max(4,1.1*αT/1000), where αT is the angular acceleration threshold set for the trial, were therefore rejected.
Subjects and Patients
We have recorded the responses of 39 patients (age range 35–80) with different vestibular disorders and those of 22 age-matched controls (age range 22–68). In patients the HITD evaluation and the HITD vs HIT comparison were not performed during the acute phase of their disorders.
The experimental protocol was approved by the local ethics committee, and all individuals were investigated on a voluntary basis and gave written informed consent to participate in it.
All patients underwent a careful collection of their clinical history and a full clinical vestibular examination. Moreover some patients, those who were referred to an ENT department in Siena, underwent caloric and mastoid vibration testing, whereas some other patients, who were referred to a neurological department in Pavia, underwent to rotatory testing, subjective visual vertical evaluation and vestibular evoked potentials recording.
On these bases the patients were divided in five diagnostic groups: vestibular neuritis (VN, seven patients, age range 35–66), Ménière disease (MD, five, age range 40–65), UVD (14, age range 42–66), bilateral vestibular deficit (BVD, seven, age range 45–80), central vestibular deficit (CVD, six, age range 50–71).
Vestibular neuritis was diagnosed on the basis of the clinical history (sudden onset of rotatory vertigo, quite severe in the first days, and then followed by a spontaneous and progressive improvement without recurrence) and of clinical and instrumental signs detectable in the acute phase of the disease. Instrumental signs included caloric canal paresis (Jongkees, 1948), VOR gain significant asymmetry at rotatory test, abnormally tilted subjective visual vertical, asymmetrical vestibular evoked potentials. MD was diagnosed on the basis of the AAON-HHS criteria (American Academy of Otolaryngology- Head and Neck Foundation Inc., 1995). In order to be included in the UVD group, patients had to show a clinical or instrumental vestibular deficit (asymmetry), but without any further features to be included in another diagnostic group (in particular the VN or the MD groups).
The BVD included subjects who complained of oscillopsia during head motion (for instance when walking) and who showed no response to caloric and/or to rotatory stimulation bilaterally; in all subjects BVD was idiopathic.
The CVD group included four patients with vestibular migraine and two subjects with idiopathic down beat nystagmus.
Data Analysis
Data was divided in 1000 deg/s2 wide bins based on peak head angular acceleration reached during each head impulse that triggered the display of the letter. Only patients that were tested for at least eight head impulses in each direction were considered for the specific bin and direction. Thresholds ranged 2000–7000 deg/s2 and the data was therefore organized in six bins for each subject.
Statistical analysis was performed by comparing the rate of correct answers in each patient against the population of controls considering two independent samples. We considered separately clockwise (CW) and counterclockwise (CCW) head impulses and performed the comparisons both considering individual acceleration bins and pooling bins together.
For each comparison we considered r1 correct answers over n1 total trials for controls and r2 correct answers over n2 trials for each patient, and the corresponding rates p1 = r1/n1 and p2 = r2/n2.
Thus we tested the null hypothesis that p1 = p2 by considering the expected rate of correct answers in the population as  and computing the standardized normal deviate:
The patient was considered as being not normal if z fell outside the 99% of the two tailed z distribution.
Such approach was applied twice for each patient: once by considering each acceleration bin individually (individual bin approach) and once by pooling all the acceleration bins together (pooled bin approach). The individual bin approach labeled as abnormal the subjects who showed a rate of correct answers lower than expected in at least one acceleration bin.
The percentage of patients showing an abnormal HIT and/or HITD test for each diagnostic group and for each direction (healthy and affected side) were compared by Fisher’s exact test.
Results
In controls the percentage of correct answers ranged from 98 to 100, both for CW and CCW impulses independently from the acceleration bin they belonged to. When all acceleration bins were pooled together the percentage of correct answers was 99 for CW and 98 for CCW impulses.
The distribution of the performance of control subjects in response to the six levels of head angular acceleration is shown in Figure 2, together with the number of subjects considered for each bin. For all bins except the highest CCW acceleration, the median of the sample of control subjects was 1.
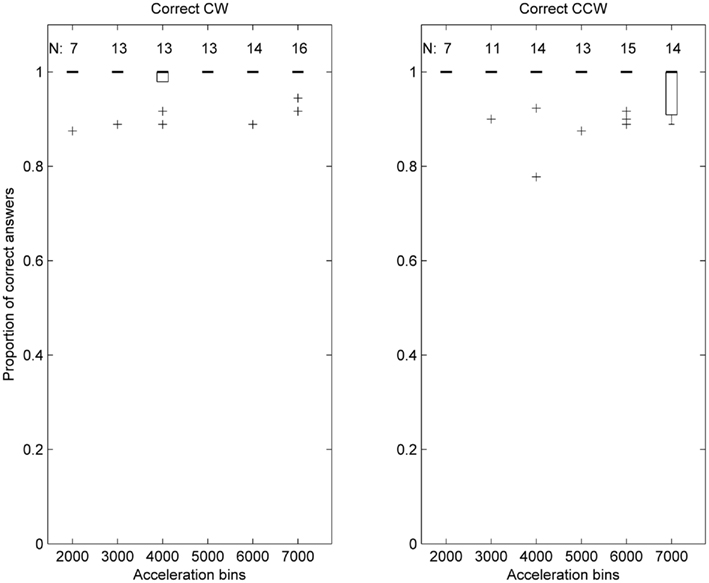
Figure 2. Box plot representation of the distribution of correct answers ratios per acceleration bin, in control subjects. Each acceleration bin is labeled using the lower acceleration threshold, e.g., the 2000 deg/s2 bin includes accelerations in (2000, 2999). In each box plot the thick horizontal line indicates the median of the sample, and the thin line at the lower extremity of the box the 25th percentile. Whiskers extend to the extreme data points considered in the distribution, while crosses indicate individual outlier data points.
The same graphical representation is shown for patients in Figure 3, where the median of correct response ratios is shown to be lower than in controls (Figure 2), especially for higher acceleration bins.
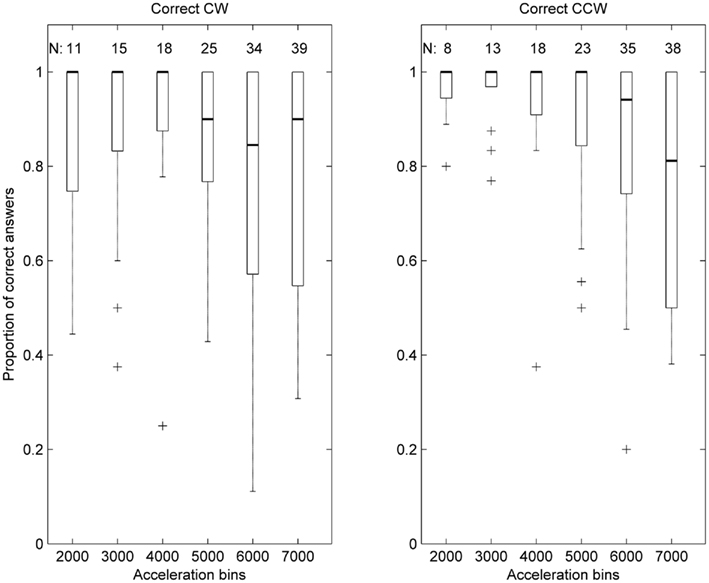
Figure 3. Box plot representation of the distribution of correct answers ratios per acceleration bin, in patients. Data is represented as in Figure 2, with the addition that the thin line at the upper extremity of the box represents the 75th percentile.
In 30 of the 39 patients HITD proved to be abnormal in at least one direction, and only in five patients the abnormality was detectable for acceleration thresholds less than 4000 deg/s2, i.e., for 2000 and/or for 3000 deg/s2 bins. On the other hand, only two patients proved to be abnormal only for the 7000 deg/s2 bin.
Tables 1 and 2 show the results obtained by HITD and clinical HIT in the different groups of patients.
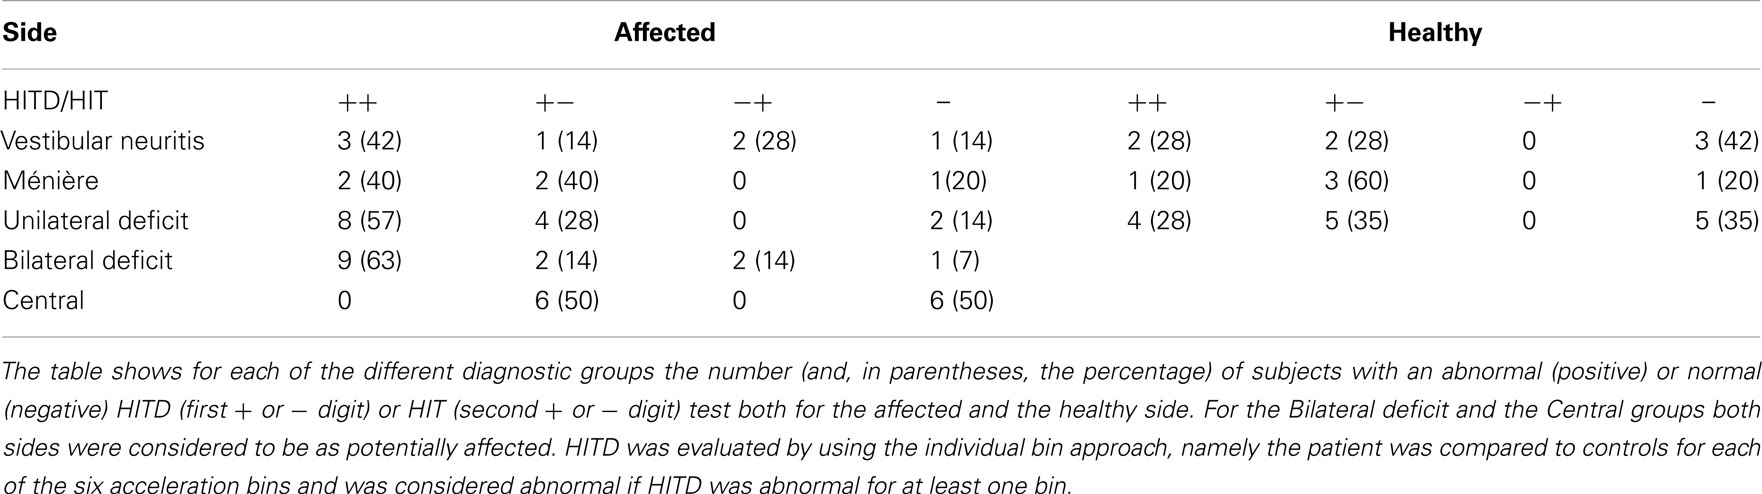
Table 1. HITD vs HIT results based on individual bin approach.
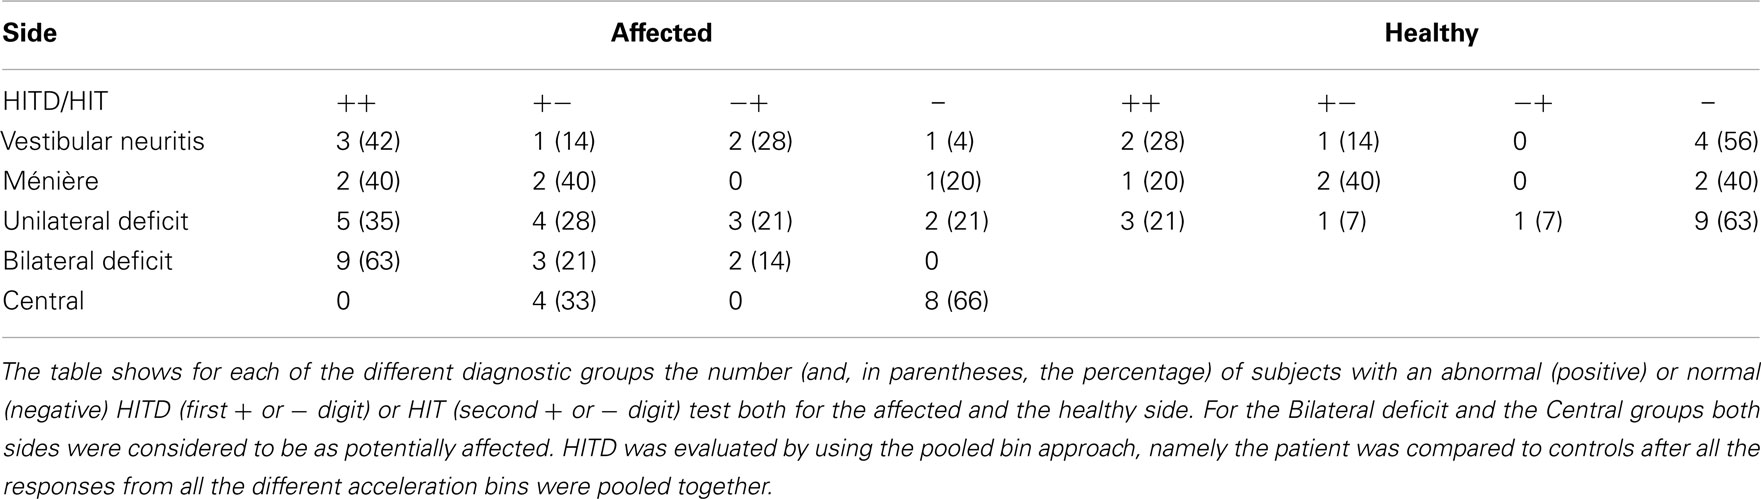
Table 2. HITD vs HIT results based on pooled bin approarch.
In Table 1, the acceleration bins were considered individually (individual bin approach) and a patient was considered to have an abnormal HITD when he/she showed a percentage of correct answers lower than expected in at least one acceleration bin. In Table 2 the acceleration bins were pooled together (pooled bin approach).
In order to make a statistical comparison (Fisher’s exact test) the data form Tables 1 and 2 were reorganized as shown in Table 3 (individual bin approach) and Table 4 (pooled bin approach). The abnormalities detectable by the HITD and the HIT were comparable both from the affected or the healthy sides in the VN, UVD, MD, and BVD groups. The two tests proved the CVD group to be significantly different, with a higher number of abnormalities detected by the HITD than by the HIT both for the individual (Fisher’s exact test, p = 0.007) and for the pooled (Fisher’s exact test, p = 0.04) approach.
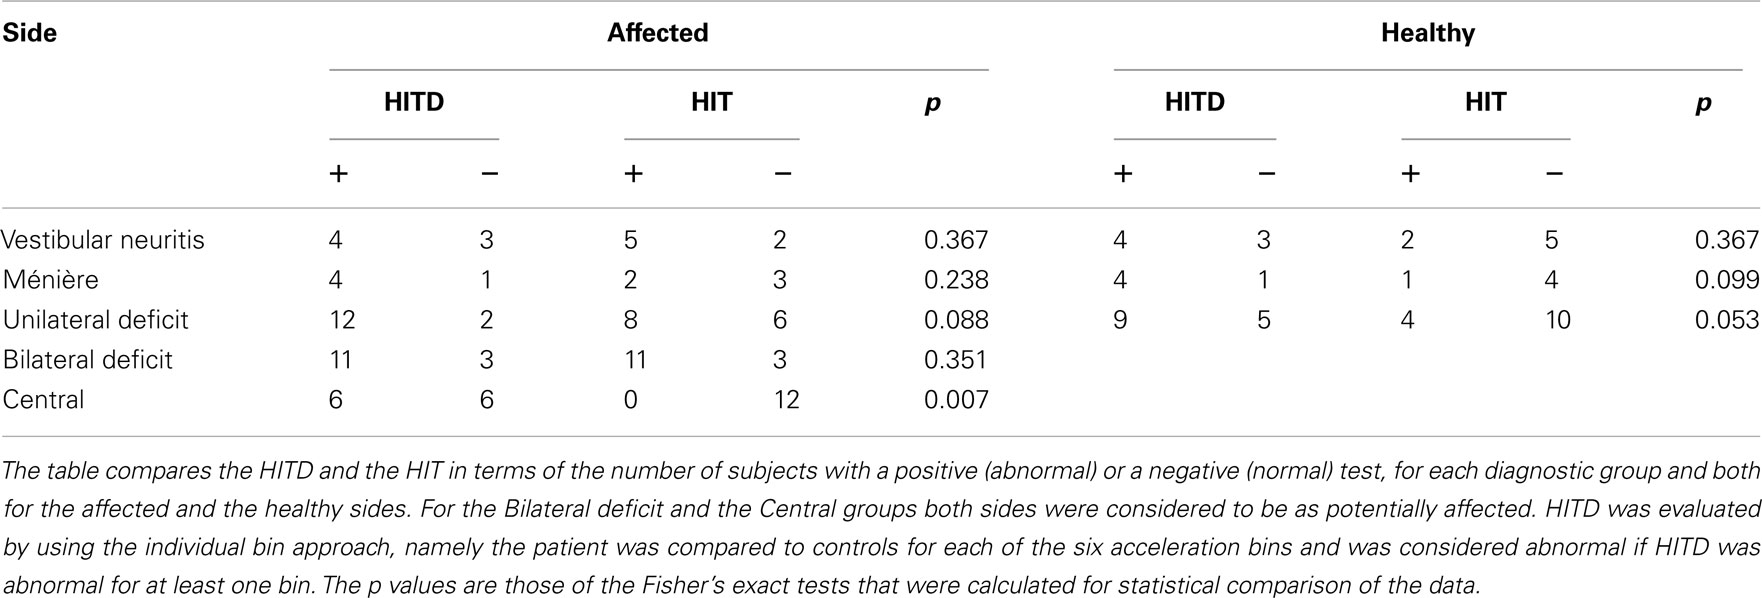
Table 3. HITD vs HIT comparison using individual bin approach and Fisher’s exact test.
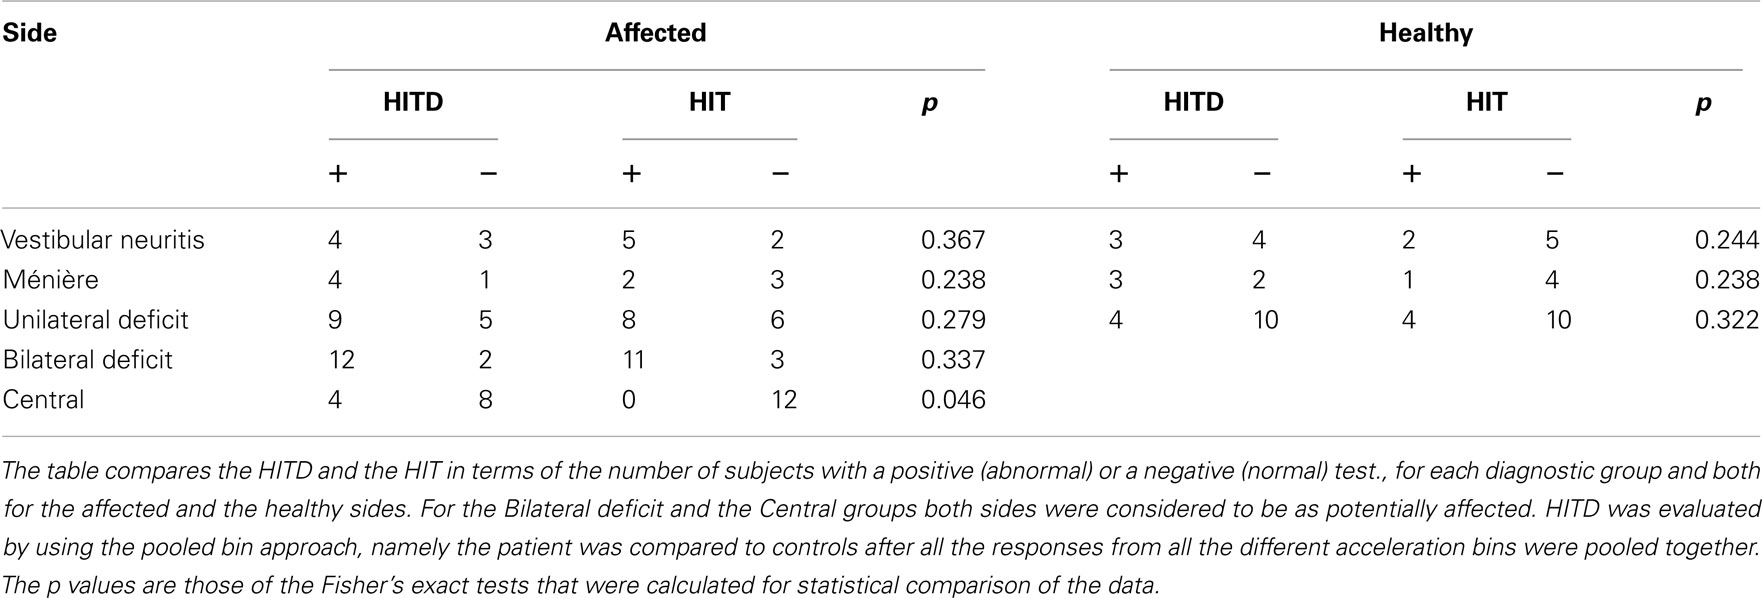
Table 4. HITD vs HIT comparison using pooled bin approach and Fisher’s exact test.
Discussion
We have developed a new approach to functional testing of the rVOR which focuses on the ability of the reflex to grant visual stability during head rotations when faced with a wide range of head angular accelerations, independently from the subject’s visual acuity.
Such approach is implemented by the HITD, a device which needs very little equipment to be set up, is not expensive, is user friendly and is well tolerated by the patients. The device is covered by an international patent application (“Head Impulse Testing Device for assessing the functionality of the semicircular canals and for the rehabilitation of vestibular loss,” deposit number: PCT/EP2009/000611) of the University of Pavia.
Normal subjects showed a very high frequency of correct answers (about 0.98) independently of peak head acceleration.
With the only exception of vestibular neuritis, in the affected side HITD detects a larger occurrence of abnormalities than HIT, but significantly so only in central vestibular patients. The generally higher abnormality detection of HITD as compared to HIT could be considered as an undesired high occurrence of false positives, but it is explicable since patients that are able to make covert saccades (Weber et al., 2008) are likely to be rated as normal with clinical HIT, but not with HITD since during saccades we are functionally blind. Although reasonable, this hypothesis should be proved by simultaneously recording eye movements while performing HITD. Further investigation should also deal with the timing parameters of the test. For instance, the very short duration of the letter on screen could have diminished its readability, although we believe that the increased letter size with respect to each subject’s visual acuity, should have compensated for this effect.
The detection of an abnormal response from the healthy side could also be considered as a false positive result, but it was suggested that in VN (and in UVD) a reduced VOR gain is to be expected for high angular accelerations toward the contralateral direction (Curthoys and Halmagyi, 2007); accordingly HITD and, to a lesser extent, HIT are able to unveil this VOR gain reduction.
In clinical settings, in order to minimize the time needed to test an individual subject without a significant reduction of diagnostic power, our data suggest that testing the 4000, 5000, and 6000 deg/s2 should be enough. Moreover, the procedure to evaluate the data collected from a single subject can be easily implemented in order to give the results as soon as the test is finished. However, we hypothesize that HITD may be used to assist vestibular rehabilitation exercises, and in that situation it would be useful also at lower accelerations, provided that they are high enough to be challenging for the patient.
Overall the HITD test appears to be a very promising tool for detecting abnormal VOR performance and providing information on the functional performance of the rVOR, and it may be already regarded as a valuable support that can be adopted during the clinical bedside evaluation of vestibular patients.
However the data from the different patient groups are to be considered as a preliminary pilot study: it will be necessary to test HITD on larger cohort of patients with different vestibular diseases, both at the time of the diagnosis (to ascertain sensitivity and specificity values) and during the follow-up to better understand the effect of compensation phenomena. Moreover, during the follow-up it would be useful to evaluate the patients’ self feeling to determine if it correlates with the functional evaluation of VOR provided by HITD.
Conflict of Interest Statement
The authors declare that the research was conducted in the absence of any commercial or financial relationships that could be construed as a potential conflict of interest.
References
American Academy of Otolaryngology- Head and Neck Foundation Inc. (1995). Committee on hearing and equilibrium guidelines for the diagnosis and evaluation of therapy in Menière’s deisease. Otolaryngol. Head Neck Surg. 113, 181–185.
Aw, S. T., Halmagyi, G. M., Haslwanter, T., Curthoys, I. S., Yavor, R. A., and Todd, M. J. (1996a). Three-dimensional vector analysis of the human vestibuloocular reflex in response to high-acceleration head rotations. II. responses in subjects with unilateral vestibular loss and selective semicircular canal occlusion. J. Neurophysiol. 76, 4021–4030.
Aw, S. T., Haslwanter, T., Halmagyi, G. M., Curthoys, I. S., Yavor, R. A., and Todd, M. J. (1996b). Three-dimensional vector analysis of the human vestibuloocular reflex in response to high-acceleration head rotations. I. Responses in normal subjects. J. Neurophysiol. 76, 4009–4020.
Böhler, A., Mandala, M., and Ramat, S. (2010). A software program for the head impulse testing device (HITD). Conf. Proc. IEEE Eng. Med. Biol. Soc. 2010, 6615–6618.
Collewijn, H., and Smeets, J. B. (2000). Early components of the human vestibulo-ocular response to head rotation: latency and gain. J. Neurophysiol. 84, 376–389.
Curthoys, I. S., and Halmagyi, G. M. (2007). “Vestibular compensation: clinical changes in vestibular function with time after unilateral vestibular loss,” in Vestibular Rehabilitation, Chap. 5, ed. S. J. Herdman (Philadelphia: FA Davis Co.), 76–97.
Della Santina, C. C., Cremer, P. D., Carey, J. P., and Minor, L. B. (2002). Comparison of head thrust test with head autorotation test reveals that the vestibulo-ocular reflex is enhanced during voluntary head movements. Arch. Otolaryngol. Head Neck Surg. 128, 1044–1054.
Goebel, J. A., Tungsiripat, N., Sinks, B., and Carmody, J. (2007). Gaze stabilization test: a new clinical test of unilateral vestibular dysfunction. Otol. Neurotol. 28, 68–73.
Halmagyi, G. M., and Curthoys, I. S. (1988). A clinical sign of canal paresis. Arch. Neurol. 45, 737–739.
Halmagyi, G. M., Curthoys, I. S., Cremer, P. D., Henderson, C. J., and Staples, M. (1990). Head impulses after unilateral vestibular deafferentation validate Ewald’s second law. J. Vestib. Res. 1, 187–197.
Halmagyi, G. M., Weber, K. P., and Curthoys, I. S. (2010). Vestibular function after acute vestibular neuritis. Restor. Neurol. Neurosci. 28, 37–46.
Herdman, S. J., Schubert, M. C., and Tusa, R. J. (2001). Role of central preprogramming in dynamic visual acuity with vestibular loss. Arch. Otolaryngol. Head Neck Surg. 127, 1205–1210.
Herdman, S. J., Tusa, R. J., Blatt, P., Suzuki, A., Venuto, P. J., and Roberts, D. (1998). Computerized dynamic visual acuity test in the assessment of vestibular deficits. Am. J. Otol. 19, 790–796.
Jongkees, L. B. W. (1948). Value of the caloric test of the labyrinth. Arch. Otolaryngol. 48, 402–417.
Longridge, N. S., and Mallinson, A. I. (1987). The dynamic illegible E-test: a technique for assessing the vestibulo-ocular reflex. Acta Otolaryngol. 103, 273–279.
Macdougall, H. G., Weber, K. P., McGarvie, L. A., Halmagyi, G. M., and Curthoys, I. S. (2009). The video head impulse test: diagnostic accuracy in peripheral vestibulopathy. Neurology 73, 1134–1141.
Pritcher, M. R., Whitney, S. L., Marchetti, G. F., and Furman, J. M. (2008). The influence of age and vestibular disorders on gaze stabilization: a pilot study. Otol. Neurotol. 29, 982–988.
Schubert, M. C., Herdman, S. J., and Tusa, R. J. (2002). Vertical dynamic visual acuity in normal subjects and patients with vestibular hypofunction. Otol. Neurotol. 23, 372–377.
Schubert, M. C., Migliaccio, A. A., and la Santina, C. C. (2006). Dynamic visual acuity during passive head thrusts in canal planes. J. Assoc. Res. Otolaryngol. 7, 329–338.
Tian, J. R., Shubayev, I., and Demer, J. L. (2001). Dynamic visual acuity during yaw rotation in normal and unilaterally vestibulopathic humans. Ann. N. Y. Acad. Sci. 942, 501–504.
Tian, J. R., Shubayev, I., and Demer, J. L. (2002). Dynamic visual acuity during passive and self-generated transient head rotation in normal and unilaterally vestibulopathic humans. Exp. Brain Res. 142, 486–495.
Vital, D., Hegemann, S. C., Straumann, D., Bergamin, O., Bockisch, C. J., Angehrn, D., Schmitt, K. U., and Probst, R. (2010). A new dynamic visual acuity test to assess peripheral vestibular function. Arch. Otolaryngol. Head Neck Surg. 136, 686–691.
Weber, K. P., Aw, S. T., Todd, M. J., McGarvie, L. A., Curthoys, I. S., and Halmagyi, G. M. (2008). Head impulse test in unilateral vestibular loss: vestibulo-ocular reflex and catch-up saccades. Neurology 70, 454–463.
Weber, K. P., Macdougall, H. G., Halmagyi, G. M., and Curthoys, I. S. (2009). Impulsive testing of semicircular-canal function using video-oculography. Ann. N. Y. Acad. Sci. 1164, 486–491.
Keywords: VOR testing, head impulse test, semicircular canals, rVOR, dynamic visual acuity
Citation: Ramat S, Colnaghi S, Boehler A, Astore S, Falco P, Mandalà M, Nuti D, Colagiorgio P and Versino M (2012) A device for the functional evaluation of the VOR in clinical settings. Front. Neur. 3:39. doi: 10.3389/fneur.2012.00039
Received: 09 January 2012; Paper pending published: 24 January 2012;
Accepted: 02 March 2012; Published online: 23 March 2012.
Edited by:
Sergio Carmona, Instituto de Neurociencias de Buenos Aires, ArgentinaReviewed by:
Sergio Carmona, Instituto de Neurociencias de Buenos Aires, ArgentinaDario Andres Yacovino, Instituto de Investigaciones Neurológicas “Raúl Carrea”, Argentina
Carlos R. Gordon, Tel Aviv and Meir Medical Center, Israel
Copyright: © 2012 Ramat, Colnaghi, Boehler, Astore, Falco, Mandalà, Nuti, Colagiorgio and Versino. This is an open-access article distributed under the terms of the Creative Commons Attribution Non Commercial License, which permits non-commercial use, distribution, and reproduction in other forums, provided the original authors and source are credited.
*Correspondence: Stefano Ramat, Dipartimento di Informatica e Sistemistica, Università di Pavia, Via Ferrata 1, 27100 Pavia, Italy. e-mail:c3RlZmFuby5yYW1hdEB1bmlwdi5pdA==